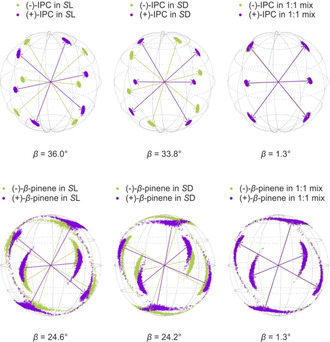
Figure 6.

Eigenvectors of IPC (upper row) and β‐pinene (lower row) in both of the polymers (S l 2L and S d 2D) and in their 1:1 mixture. The corresponding β angles are given below. The arrows represent the eigenvectors of the best‐fitting SVD‐solution, while the scattered points show the distribution of the eigenvectors determined by Monte Carlo‐boot‐strapping within the range of experimental RDC uncertainties.
