

Abstract
Our understanding of the factors governing immune responses in cancer remains incomplete, limiting patient benefit. Here, we use mass cytometry to define the systemic immune landscape in response to tumor development across five tissues in eight mouse tumor models. Systemic immunity was dramatically altered across models and time, with consistent findings in the peripheral blood of breast cancer patients. Changes in peripheral tissues differed from those in the tumor microenvironment. Mice with tumor-experienced immune systems mounted dampened responses to orthogonal challenges, including reduced T cell activation during viral or bacterial infection. Antigen-presenting cells (APCs) mounted weaker responses in this context, while promoting APC activation rescued T cell activity. Systemic immune changes were reversed with surgical tumor resection, and many were prevented by IL-1 or G-CSF blockade, revealing remarkable plasticity in the systemic immune state. These results demonstrate that tumor development dynamically reshapes the composition and function of the immune macroenvironment.
INTRODUCTION
Immunotherapy has rapidly expanded our toolkit against cancer, but a broader understanding of factors governing immune responses in cancer is required to extend clinical efficacy to all patients. Intratumoral CD8 T cells have been the main focus of cancer immunotherapies, yet recent studies demonstrate that cytotoxic T cells within the TME are irreversibly dysfunctional1. Several studies have shown that a systemic anti-tumor immune response is essential for immunotherapeutic efficacy2–9. However, we lack a comprehensive definition of how cancer development impacts the systemic immune state.
Several lines of evidence suggest that systemic immune perturbations occur with cancer. Peripheral granulocytic and monocytic expansion and impaired differentiation accompany tumor progression10–12 along with a reduction in conventional dendritic cells13. Systemic effects on lymphocytes remain poorly understood. Most studies have explored anti-tumor immune responses at a single, static time point, leaving the dynamicity of the immune system during cancer development an open question. Prior immune experiences can impact responses to new stimuli by shifting basal cytokine levels, innate immune activation states, and cellular composition14–16. While many immunotherapies and vaccines seek to elicit new immune responses in cancer patients, it remains uncertain how tumor burden impacts these processes. It is also unclear whether there are lasting immune impacts after successful primary tumor clearance, though studies have associated tumor resection with a reduction in myeloid-derived suppressor cells17,18. Defining the functional capacity and stability of the tumor-experienced immune macroenvironment is critical for improving immunotherapies.
We used high content single-cell analysis and corresponding analytical methods to characterize the systemic immune landscape across eight commonly used mouse tumor models. These data, which are publicly available, provide a rich resource. While each tumor has unique immunological consequences, we found that three distinct breast cancer models converged on similar systemic changes. Tumors drove dynamic shifts in the organization and functional capacity of immune cells across the organism, culminating in attenuated responses to new immune challenges, while tumor resection was sufficient to revert the systemic immune landscape. These findings have implications for how and when we apply immunomodulatory agents in cancer, emphasizing the importance of strategies that are informed by preexisting alterations in the immune macroenvironment.
RESULTS
Systemic immune organization is altered across multiple tumor types
We began by examining the TME across several common mouse tumor models, including genetically-engineered and transplantable syngeneic models across different mouse strains with different mutational loads, metastatic potential, variability and latency in tumor growth19–22. We characterized well-established, but pre-terminal tumor stages to reflect the patient populations most often treated with immunotherapies, but also to avoid the confounding impact of end-of-life processes. We utilized mass cytometry to quantify the abundance and activity state of immune cell subsets in the tumor as well as the blood, spleen, bone marrow and tumor-draining lymph nodes (Supplementary Table 1 and Extended Data Fig. 1).
The immune composition of the TME was distinct between models, varying in the degree of immune infiltration and diversity (Fig. 1a and Extended Data Fig. 2a). The predominant immune cell types were tumor-associated macrophages and other CD11bhigh myeloid subsets, particularly in the transplantable MC38 colorectal cancer and SB28 glioblastoma models, with relatively fewer adaptive immune cells as reported in many human tumors23. Both transplantable LMP pancreatic cancer and genetically induced Braf-Pten melanoma models showed extensive eosinophil infiltration. B16-F10 syngeneic melanoma and three models of breast cancer (transplantable cell lines 4T1 and AT3 and autochthonous MMTV-PyMT) showed less relative abundance but greater diversity in local immune cells, including B, T, and NK cell infiltration (Fig. 1a and Extended Data Fig. 2a). Unique immune profiles were apparent across tumor types (Fig. 1b and Extended Data Fig. 2g).
Fig. 1: The systemic immune landscape is remodeled across tumor models.
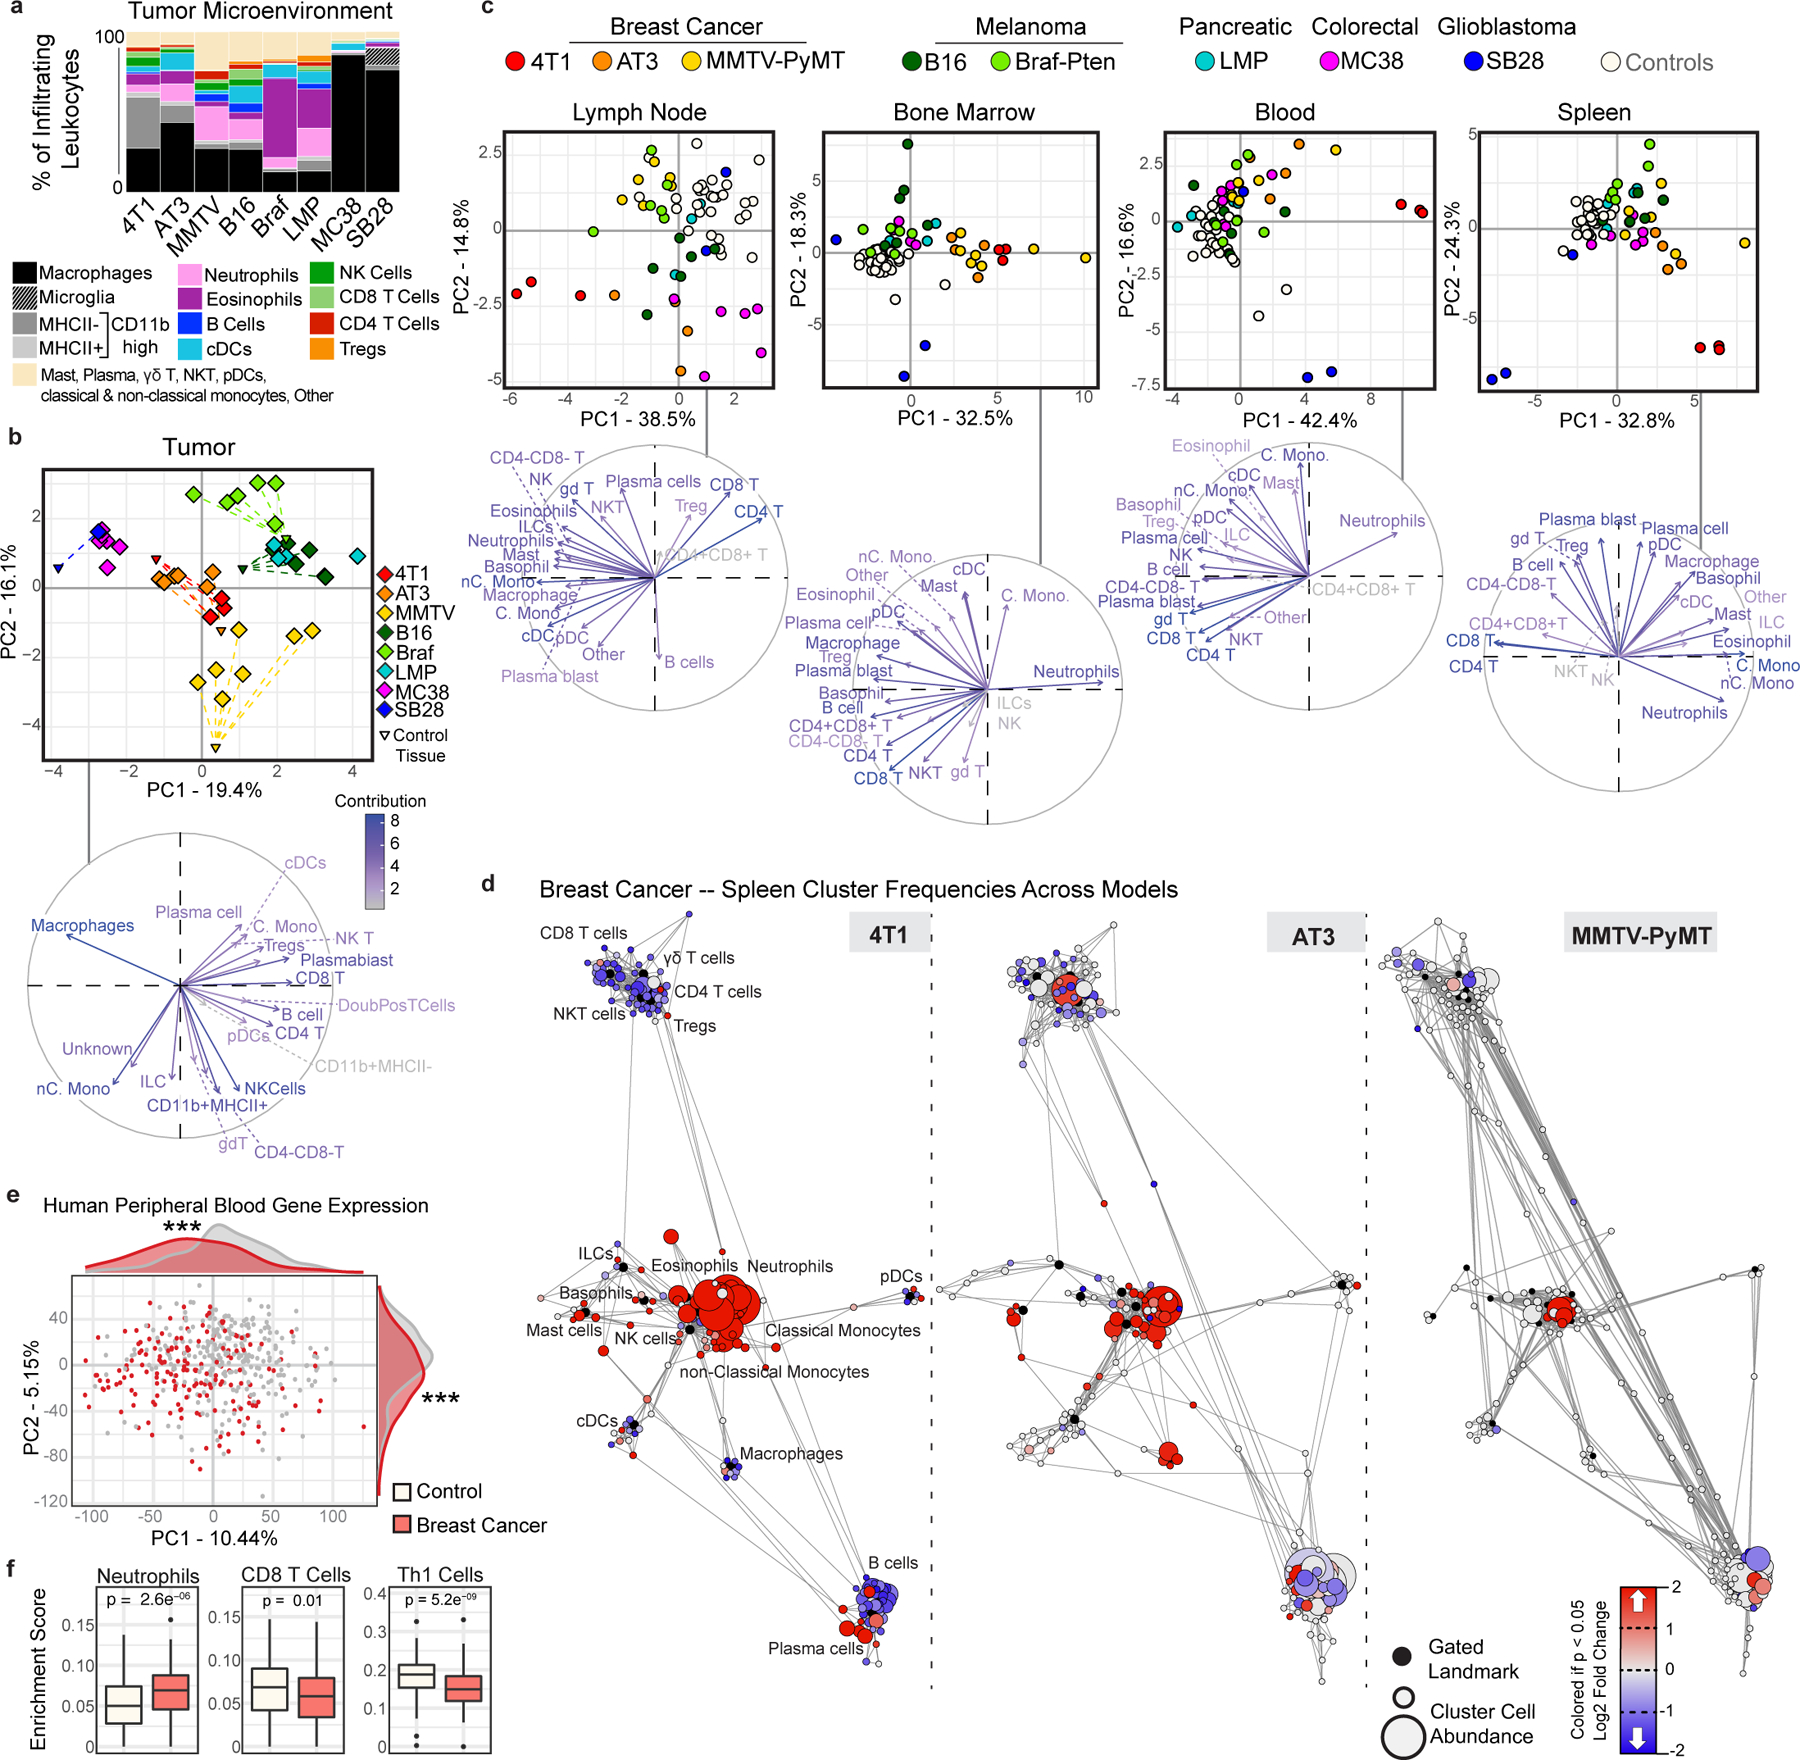
a, Composition of tumor immune infiltrates across late stage mouse models, identified by manual gating (n = 3 independent animals for 4T1; n = 6 AT3; n = 7 MMTV-PyMT; n = 6 B16; n = 6 Braf-Pten; n = 4 LMP; n = 6 MC38; n = 1 SB28; n = 30 Controls). b-c, Principal component analysis (PCA) and corresponding vector plot of individual contributions for the tumor infiltrating immune frequencies (b), and the log2 fold change of immune frequencies for the tumor draining lymph node, bone marrow, blood, and spleen (c) identified manually (n = 3 for SB28, otherwise as in panel (a)) d, Scaffold maps of spleen immune frequencies in breast tumor models (4T1, AT3, and MMTV-PyMT). Black nodes represent canonical cell populations identified manually. Other nodes reflect unsupervised clustering of leukocytes. Nodes are arranged by similarity using a force-directed graphing algorithm (see Methods). Red denotes populations significantly higher in frequency in tumor-burdened animals compared to controls; blue denotes significantly lower frequency. For significant nodes (q < 0.05 by significance analysis of microarrays), the degree of coloring reflects log2 fold change (n as in panel (a)). e-f, PCA (e) and significant immune changes by cellular enrichment analysis (f) from human whole blood gene expression, comparing breast cancer patients (n = 173) and matched controls (n = 281), p*** < 0.001 by two-sided Wilcoxon rank-sum test with Benjamini-Hochberg correction. Box plots: center line, median; box limits, upper and lower quartiles; whiskers, 1.58x interquartile range / sqrt(n); points, outliers.
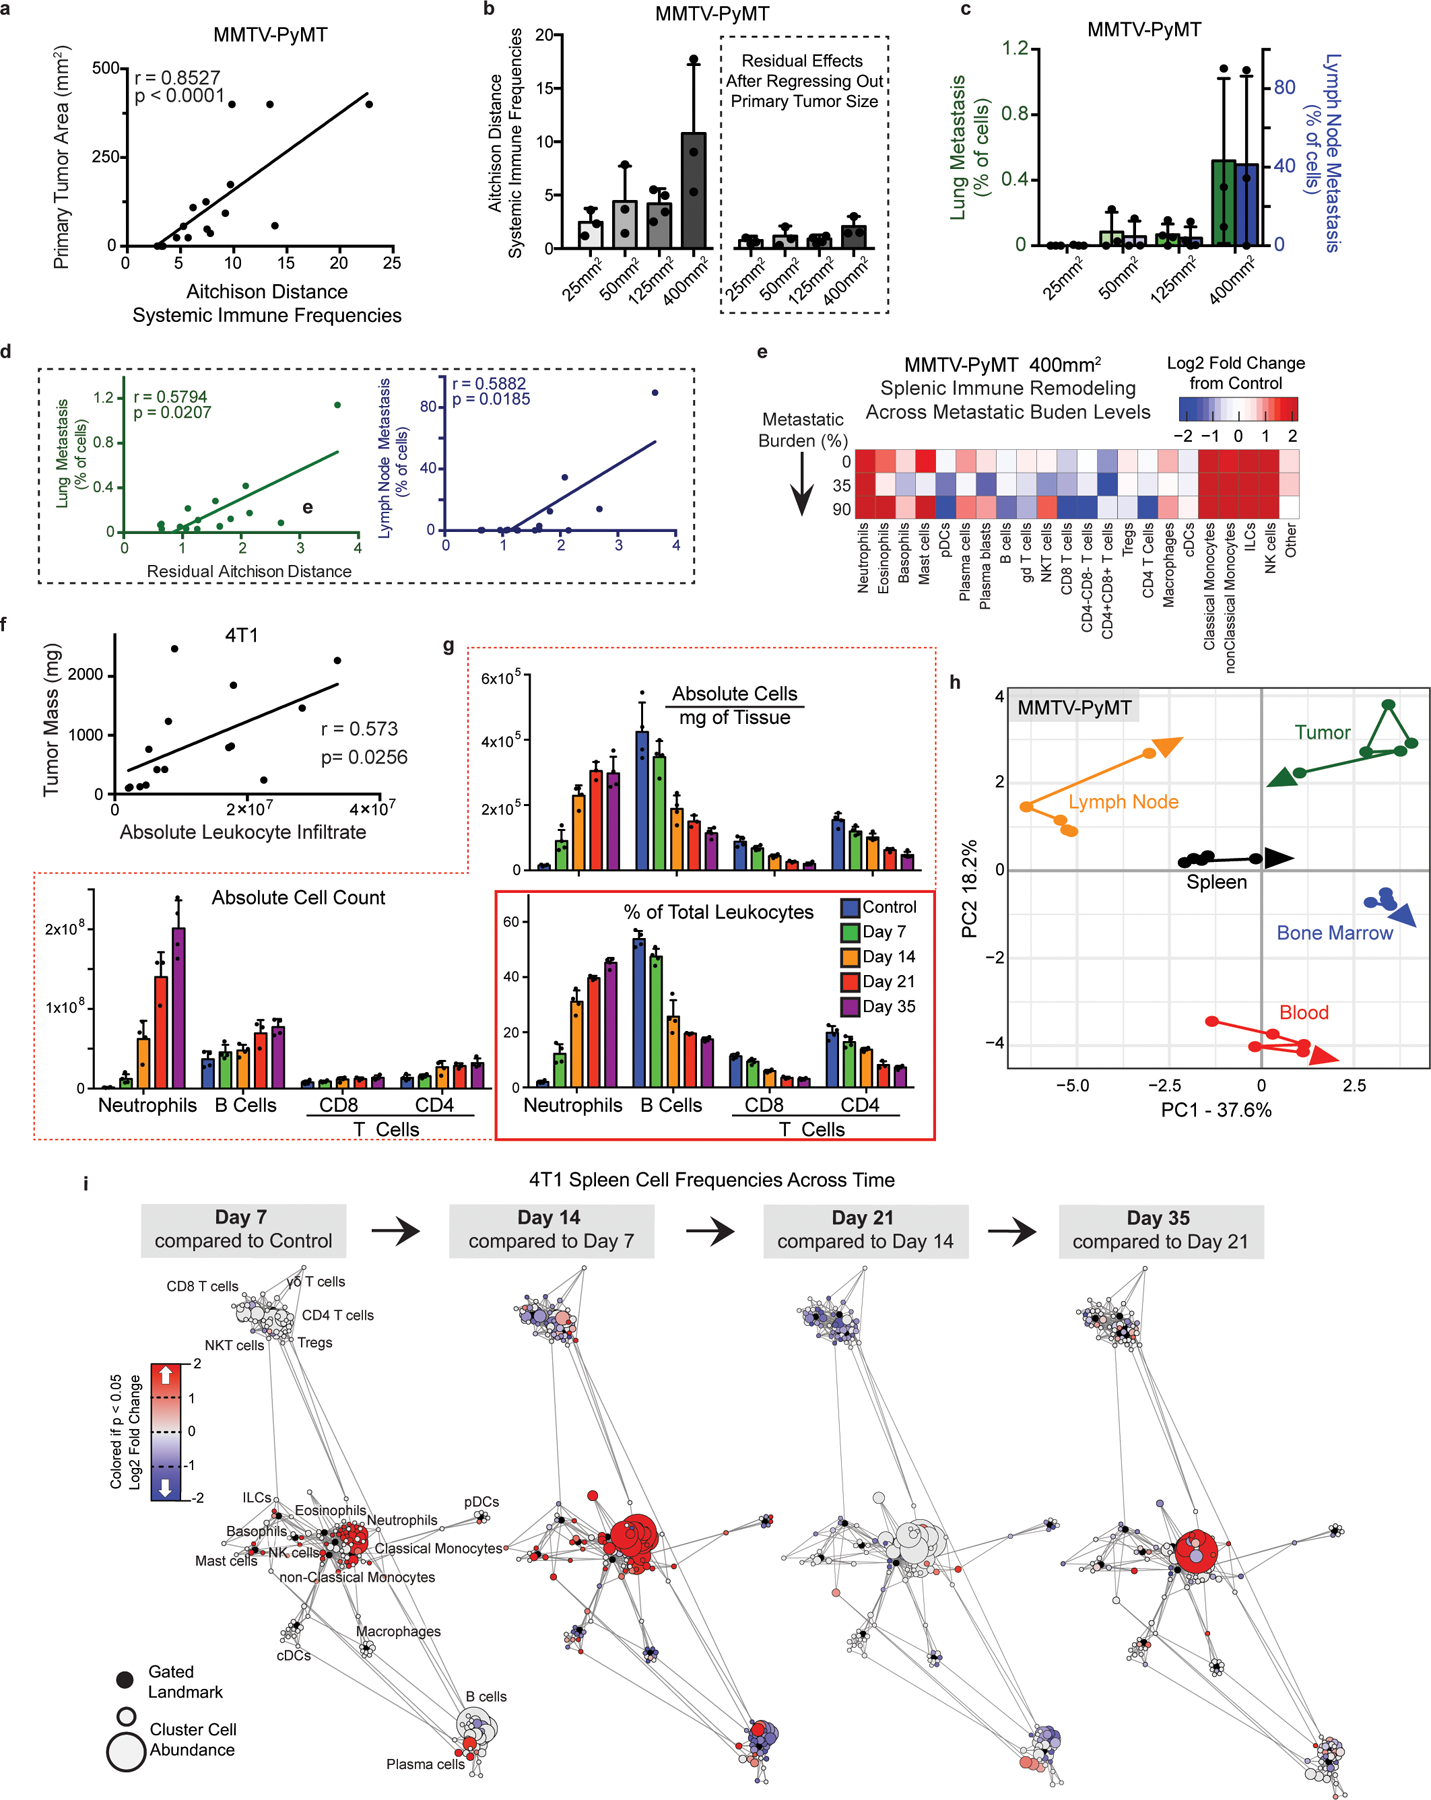
We next asked whether these tumor models also resulted in altered systemic immune states. The immune compositions of the tumor draining lymph node, bone marrow, blood, and spleen were indeed altered, with nuance in the extent of alteration and immune cell types affected (Fig. 1c and Extended Data Fig. 2g). There was striking concordance among different models of the same tumor type (breast cancer and melanoma), shifting together across principal components. Surprisingly, SB28 glioblastoma extensively altered systemic immunity despite localization in the brain. Reporter protein expression was not responsible for systemic immune remodeling, as both the AT3 parental cell line and a derivative expressing GFP and luciferase exhibited strongly correlated systemic alterations (Extended Data Figure 2h, r = 0.9, p = 2.2e-16). Systemic alterations also occurred in mice both with and without metastases (Extended Data Fig. 3a–e) and were tightly correlated with primary tumor size in the MMTV-PyMT model (r = 0.8527, p < 0.0001). While the majority of systemic immune remodeling could be explained by primary tumor size (78.4%), the residual values were correlated with both lung and lymph node metastases (r = 0.5794, p = 0.0207 for lung, and r = 0.5882, p = 0.0185 for lymph node). Compositional alterations in these peripheral sites did not correspond with the local immune infiltrate. Thus, tumor burden drives distinct changes in peripheral immune organization, dependent on the identity of the tumor.
We next performed Statistical Scaffold Analysis2,24 to interrogate the impact of tumor burden in a more detailed manner, focusing initially on the spleen as a secondary lymphoid organ distal from the tumor (Fig. 1d and Extended Data Fig. 2b–f, Methods). All models exhibited expansions in the splenic myeloid compartment, which was dominant in some, such as the three breast cancer models (Fig. 1d and Supplementary Table 2) but less dramatic in others, such as the two melanoma models (Extended Data Fig. 2e–f). Splenic remodeling in breast cancer was specifically characterized by increases in frequencies of neutrophils, eosinophils, and monocytes and reductions in B and T cells (Fig. 1d). Consistency was observed across breast cancer models, which span three mouse strain backgrounds (BALB/c for 4T1, C57BL/6 for AT3, and FVB/N for MMTV-PyMT), orthotopic and autochthonous models, and a range of metastatic potential (AT3 – weakly metastatic, MMTV-PyMT – moderately metastatic, 4T1 – highly metastatic). Consistency despite model differences argues for a tumor and/or site-specific bias in systemic immune responses. Gene expression analysis of whole blood from untreated breast cancer patients and matched controls from the Norwegian Women and Cancer Study also demonstrated a marked shift in the immune state (PC1 Wilcoxon rank-sum p-value = 5.0*10−12, PC2 p-value = 1.6*10−6) (Fig. 1e). Cellular enrichment analysis demonstrated increased neutrophils and decreased Th1 and CD8 T cells (Fig. 1f). Altogether, these data suggest that tumor burden broadly disrupts immune macroenvironments, providing context to inform therapeutic manipulations designed to activate local versus systemic responses.
Tumor growth drives non-linear changes in immune cell frequencies over time
Tumors develop gradually, yet tumors are sampled at one developmental point in the clinic to provide prognostic information related to the immune response. We explored the dynamics of global immune remodeling during breast tumor growth, beginning with the predictable orthotopic 4T1 model before confirming results in an unrelated spontaneous model (MMTV-PyMT). Absolute cell counts of tumor-infiltrating leukocytes positively correlated with tumor size, supporting a progressive immune response (Extended Data Fig. 3f, r = 0.6, p = 0.0256). Absolute spleen cell counts also increased, but cell frequencies as a percent of total leukocytes were comparable to absolute numbers per milligram of spleen (Extended Data Fig. 3g). Deep profiling of both the tumor and splenic immune compositions by mass cytometry revealed nonparametric correlations in individual cluster frequencies with time (Fig. 2ab), demonstrating at the single cell level that immune changes are indeed progressive. PCA of immune cell frequencies showed progressive changes across tissues over tumor growth in both 4T1 (Fig. 2c–d) and MMTV-PyMT tumors (Extended Data Fig. 3h). Importantly, the immune profile within the TME remained distinct from those observed in peripheral sites. The draining lymph node immune composition was unique, while the spleen, blood, and bone marrow were more coordinated. Neutrophil expansion in the spleen and bone marrow, culminating in elevated circulation in blood, but lack of accumulation within the lymph node or tumor, is one feature contributing to these unique profiles (Fig. 2d).
Fig. 2: The systemic immune landscape is remodeled progressively with tumor development.
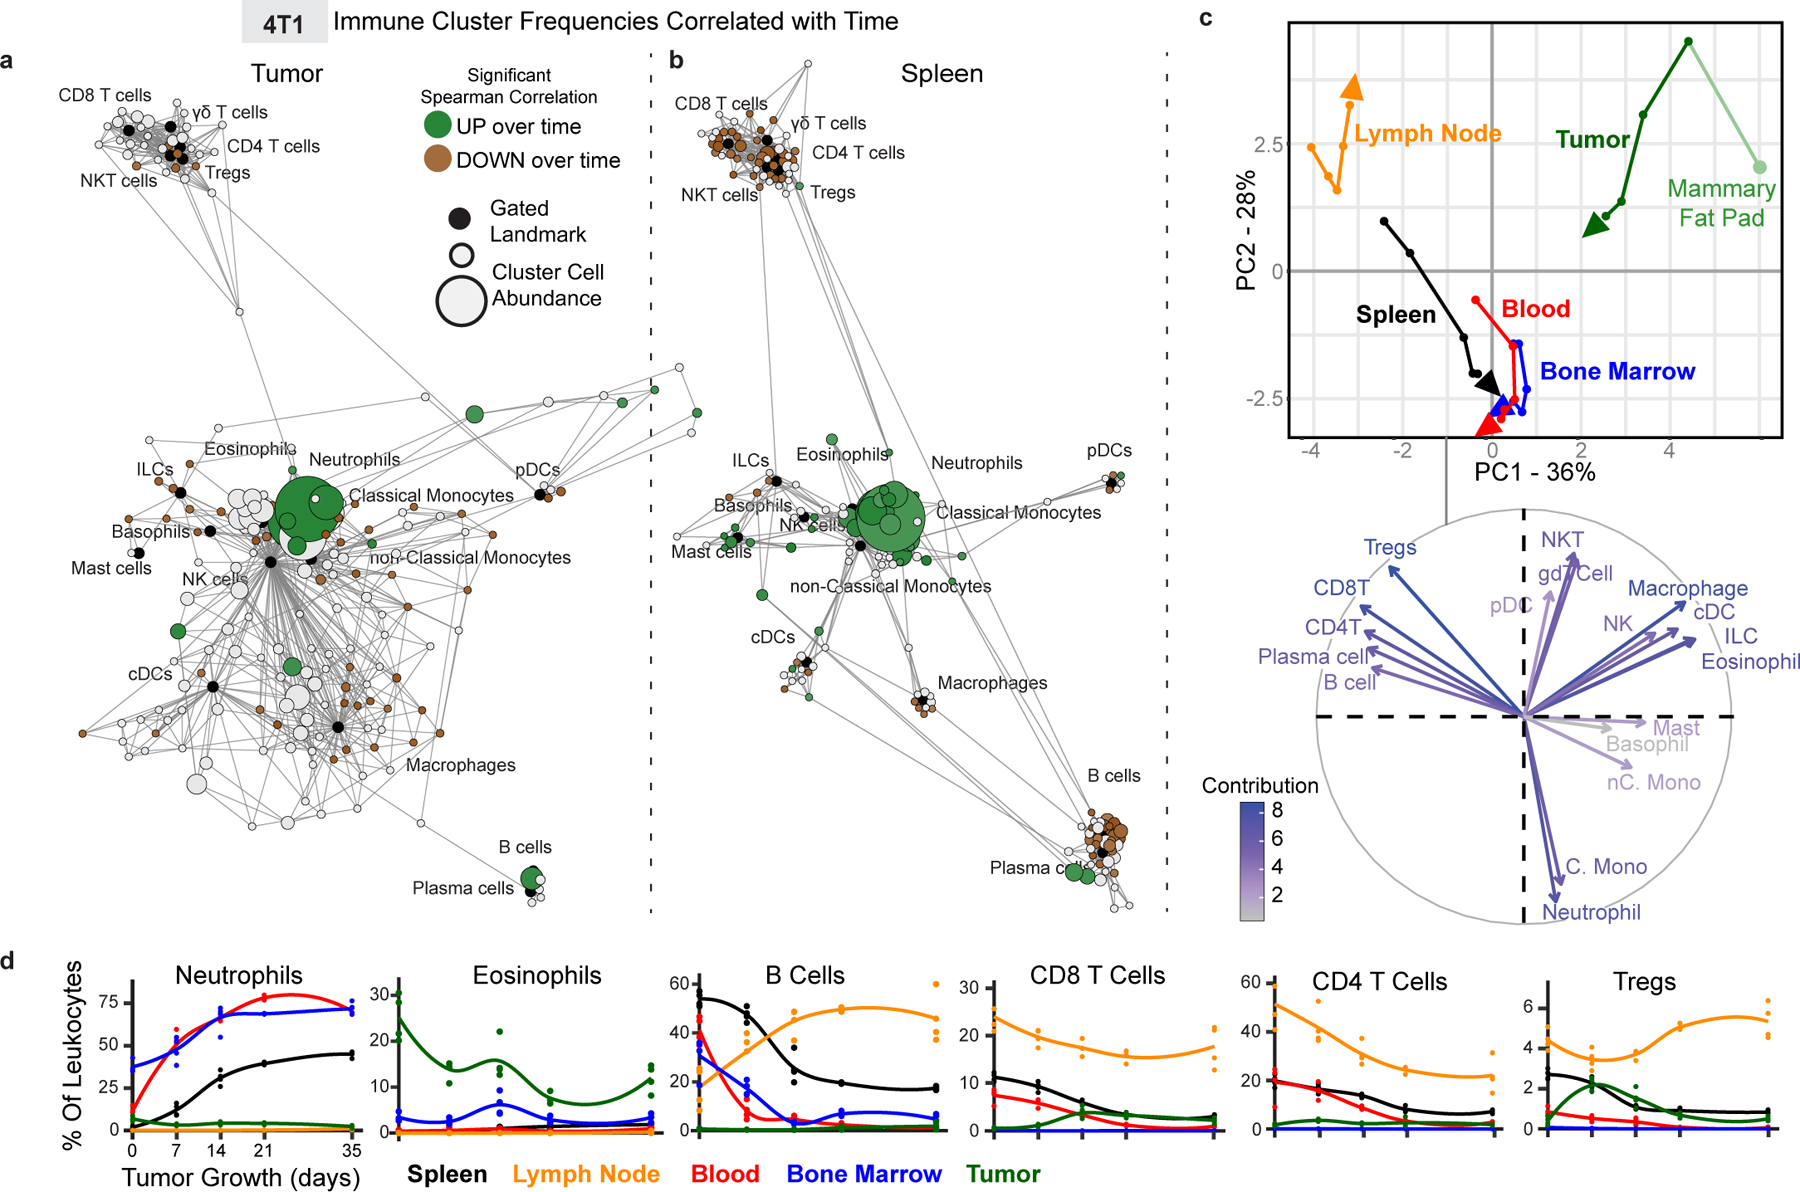
a-b, Scaffold maps of 4T1 tumor (a) and spleen (b) cell frequencies colored by significant Spearman correlation with time (across day 0, 7, 14, 21 and 35), p < 0.05 by two-sided t-test with Benjamini-Hochberg correction. Green denotes positive correlation, and brown denotes negative correlation. c, CA and corresponding vector plot of contributions for immune cell frequencies from each immune tissue over 4T1 breast tumor growth. Vectors designate progression from control day 0 (first point) to day 7, 14, 21, and 35 (last point, arrowhead). d, Curves of mean cell frequencies across time from a subset of immune cell types contributing to c, colored by tissue corresponding with c. All panels from one experiment, n = 3 independent animals for day 21 and n = 4 for all other timepoints.
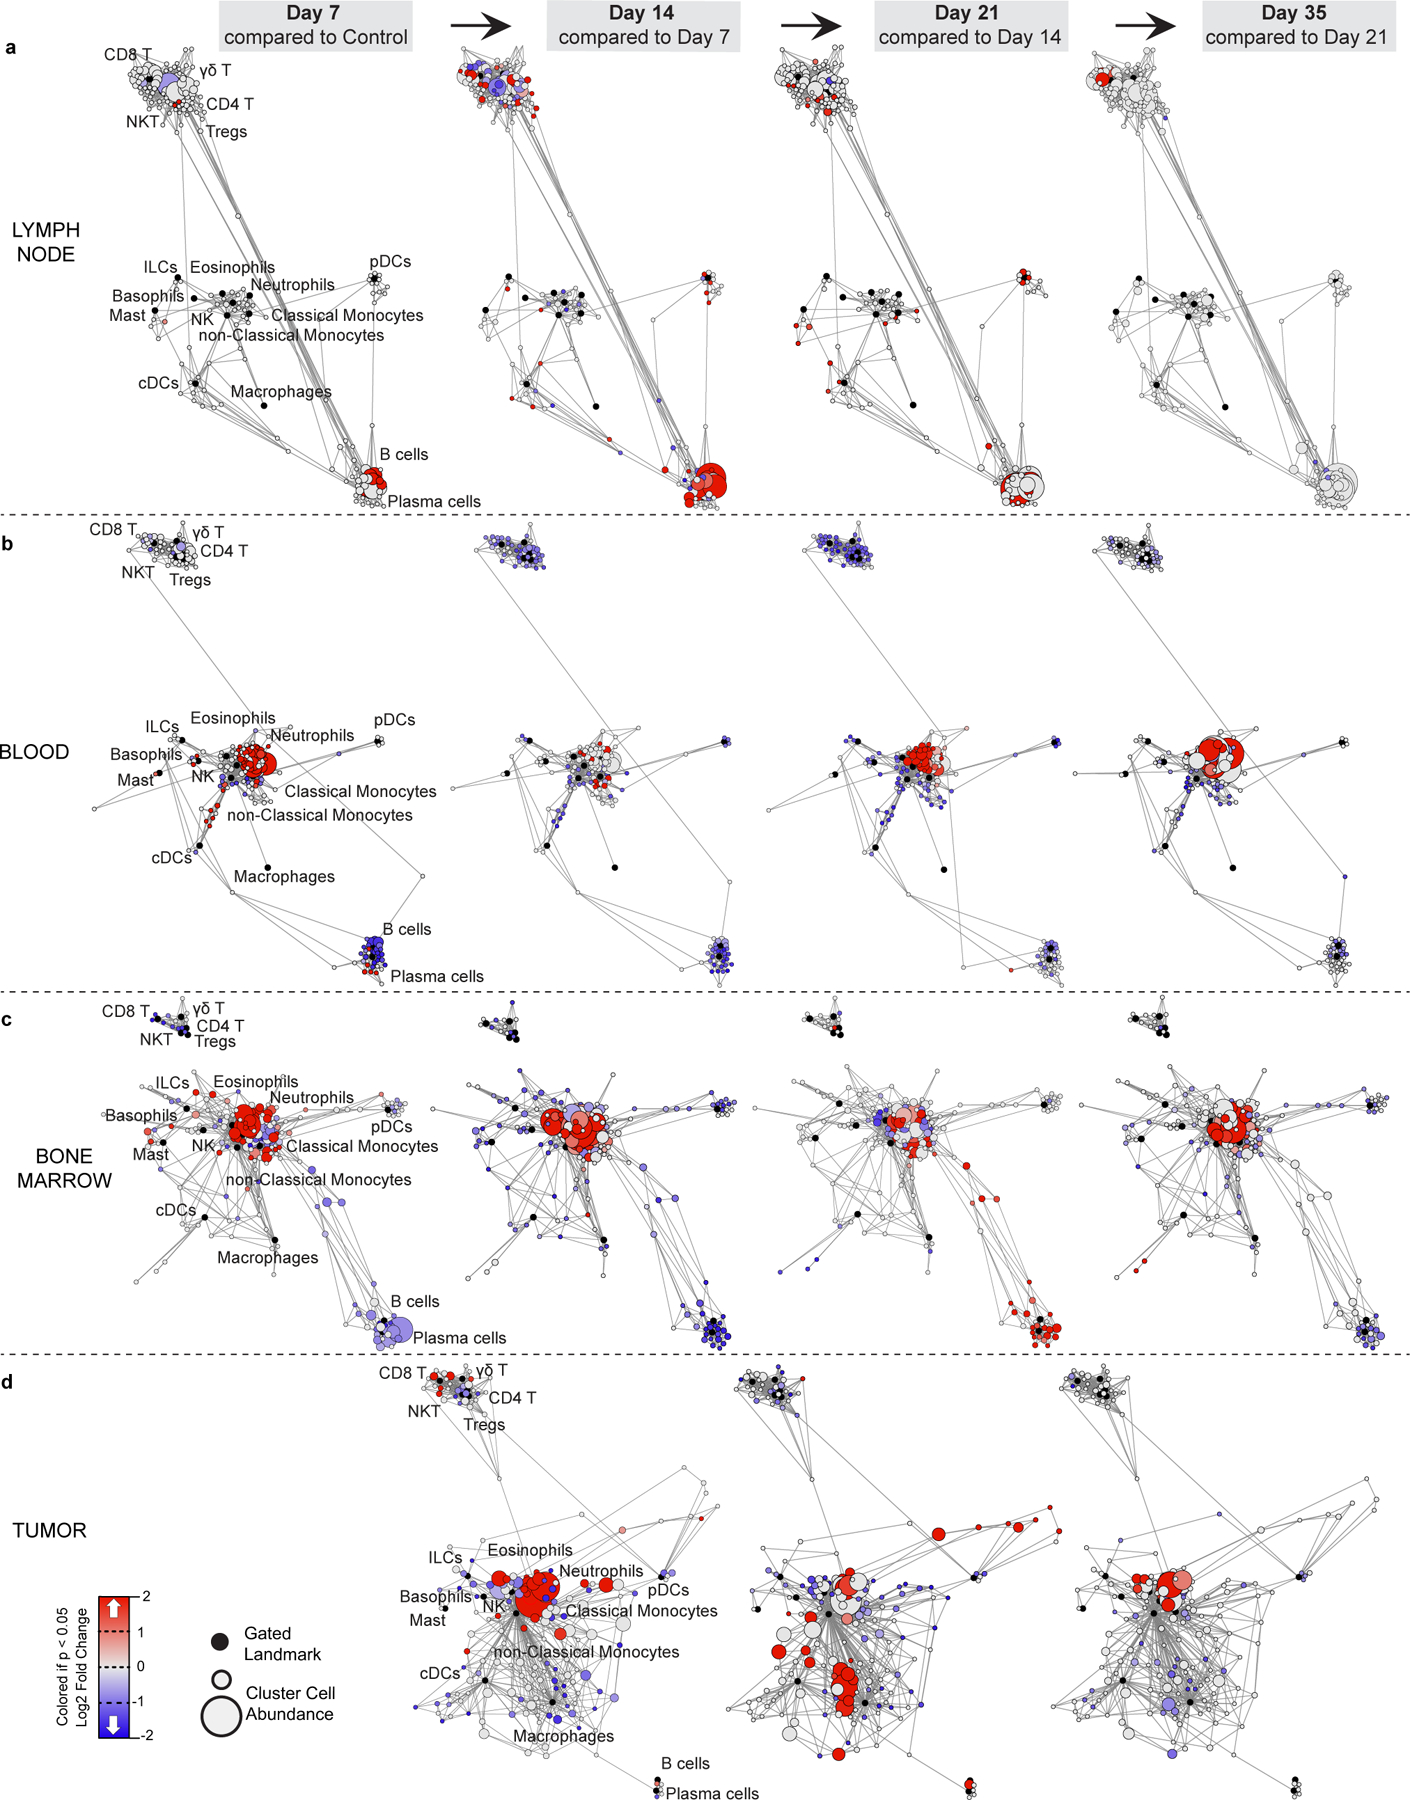
Progressive systemic immune responses to tumor burden were not strictly linear. The magnitude of change was non-uniform between each time point as evident by the PCA (Fig. 2c and Extended Data Fig. 3h). While some population changes were relatively continuous, such as increasing neutrophils or decreasing CD4+ T cells, many others were dynamic, like CD8+ T cells and Tregs, which reciprocally expanded and contracted at distinct times in the tumor and draining lymph node (Fig. 2d). In the spleen, myeloid expansion began by day 7 and continued to day 14, preceding the progressive decline in the T and B cells that began by day 14 (Extended Data Fig. 3i). The lymph node also changed most dramatically by day 14 (Extended Data Fig. 4a), while changes in blood were more continuous (Extended Data Fig. 4b). The bone marrow and tumor contained less mature and clearly defined cell types, with many more inter-cluster connections and individualized patterns of change over tumor growth (Extended Data Fig. 4c–d). These data demonstrate that the tumor immune response is a highly dynamic process.
Immune cell states are dynamically altered across immune organs with tumor growth
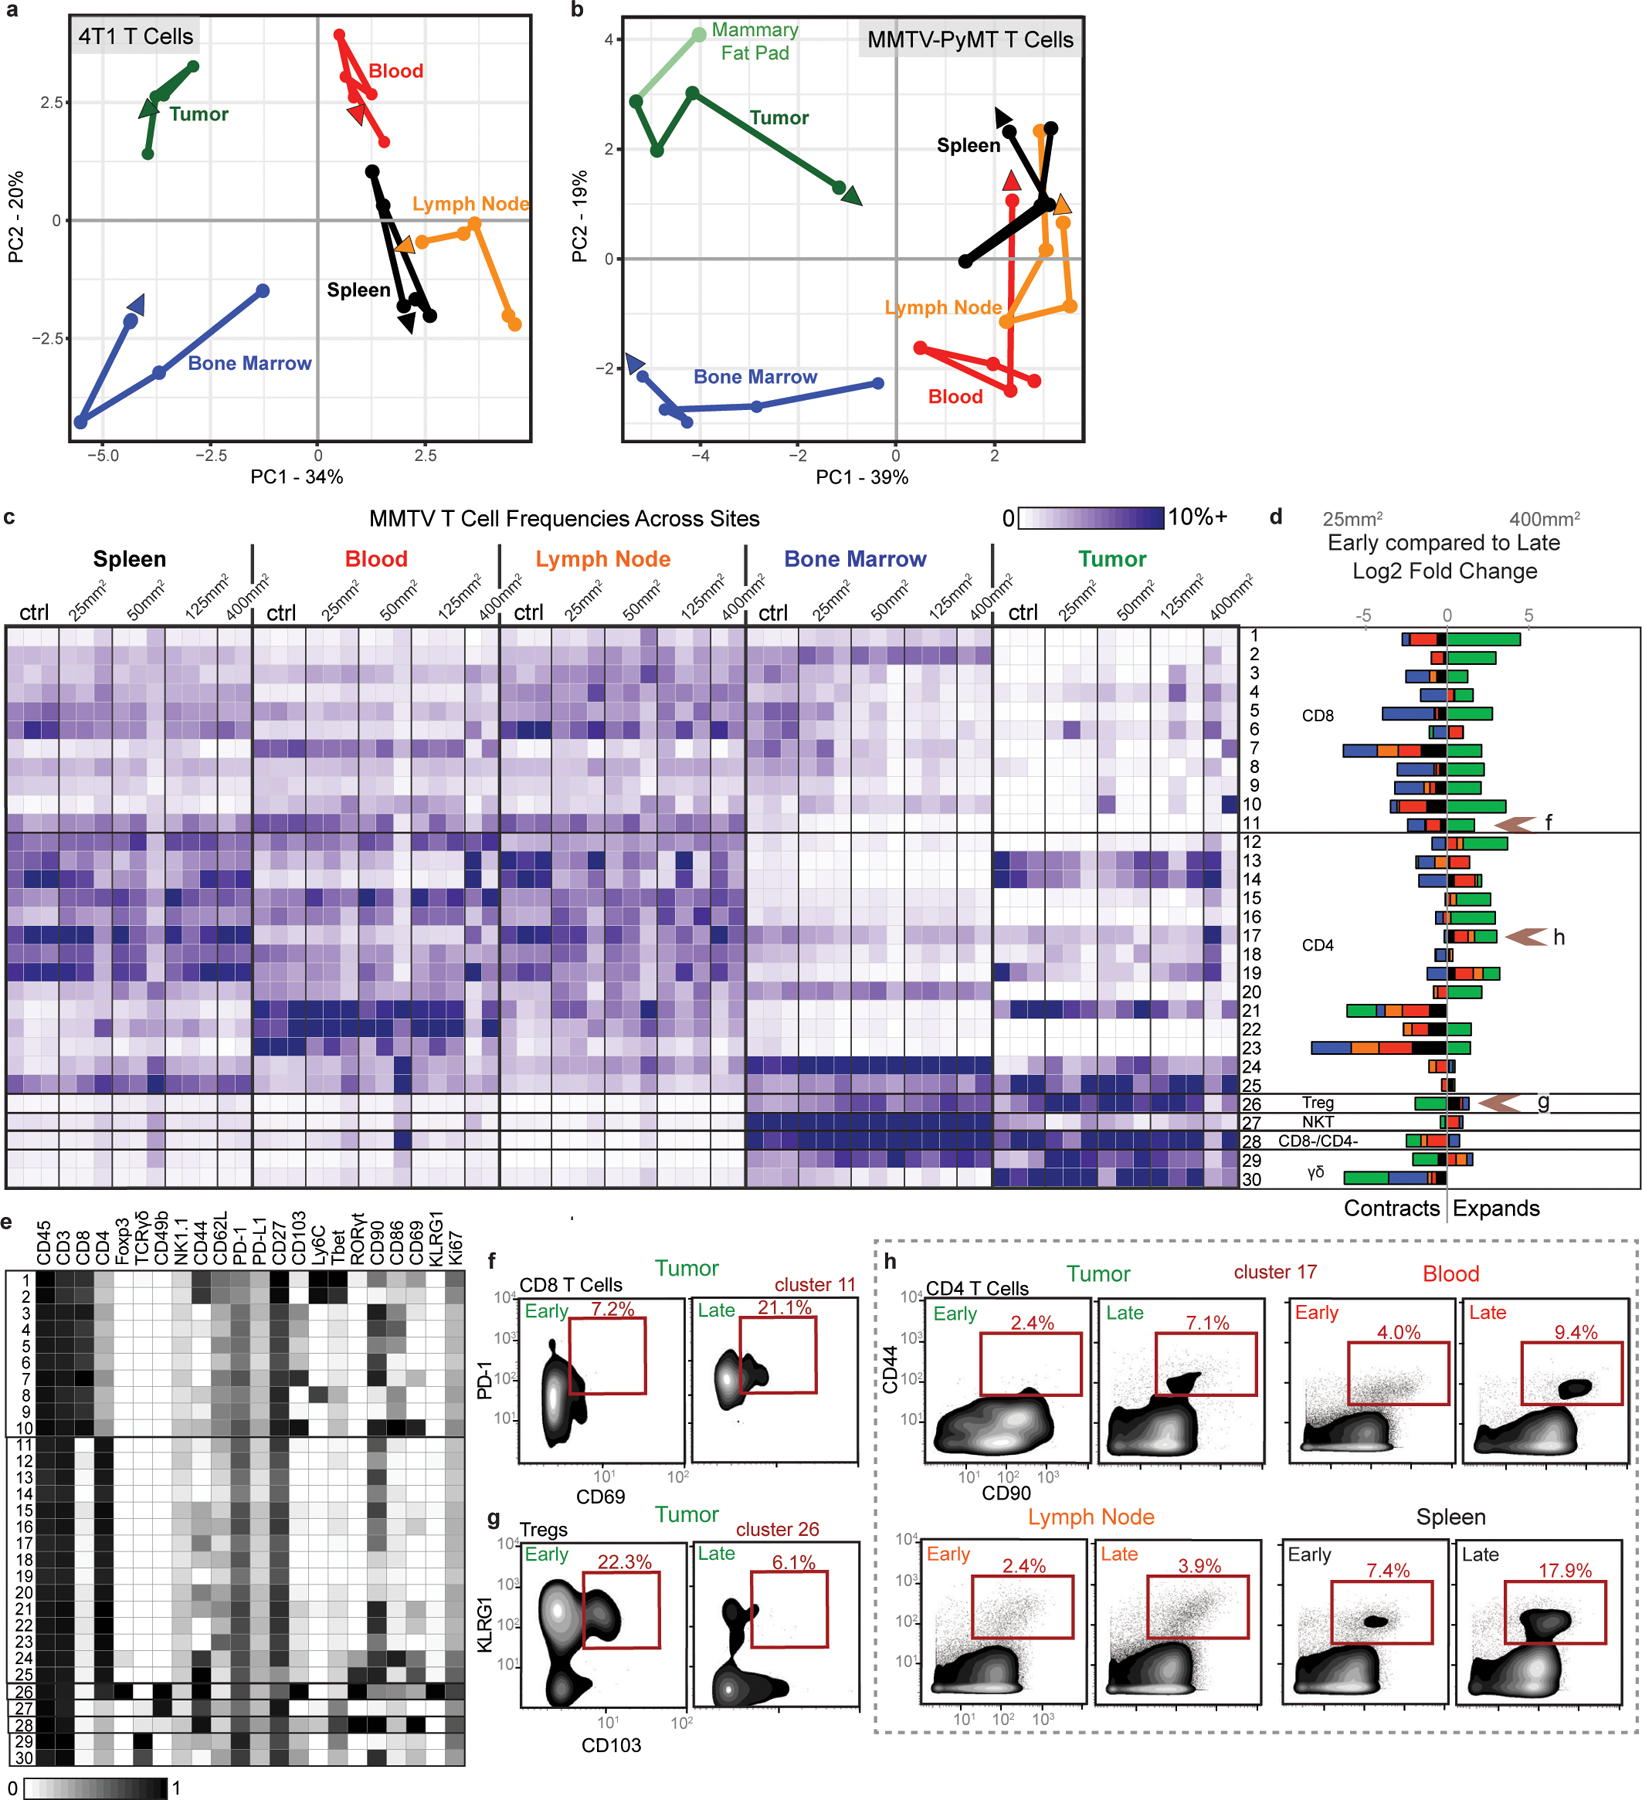
To understand the extent of systemic impacts on T cells, we leveraged unsupervised cell clustering to identify changes in T cell subsets, cell states, and potential cross-organ coordination of responses during tumor growth. Indeed, the T cell compartment was dramatically reorganized over both 4T1 and MMTV-PyMT tumor development (Fig. 3a, Extended Data Fig. 5a–b). Tissues contained both unique and shared T cell subsets shifting with tumor growth (Fig. 3b–c, Extended Data Fig. 5c–e). Blood and spleen profiles were more similar, dominated by CD4+ T cells. In contrast, the tumor T cell pool had more shared subsets with the bone marrow, including an increasing double negative population and a decreasing NKT cell population (Fig. 3c).
Fig. 3: Tumor burden progressively changes the systemic T cell composition.
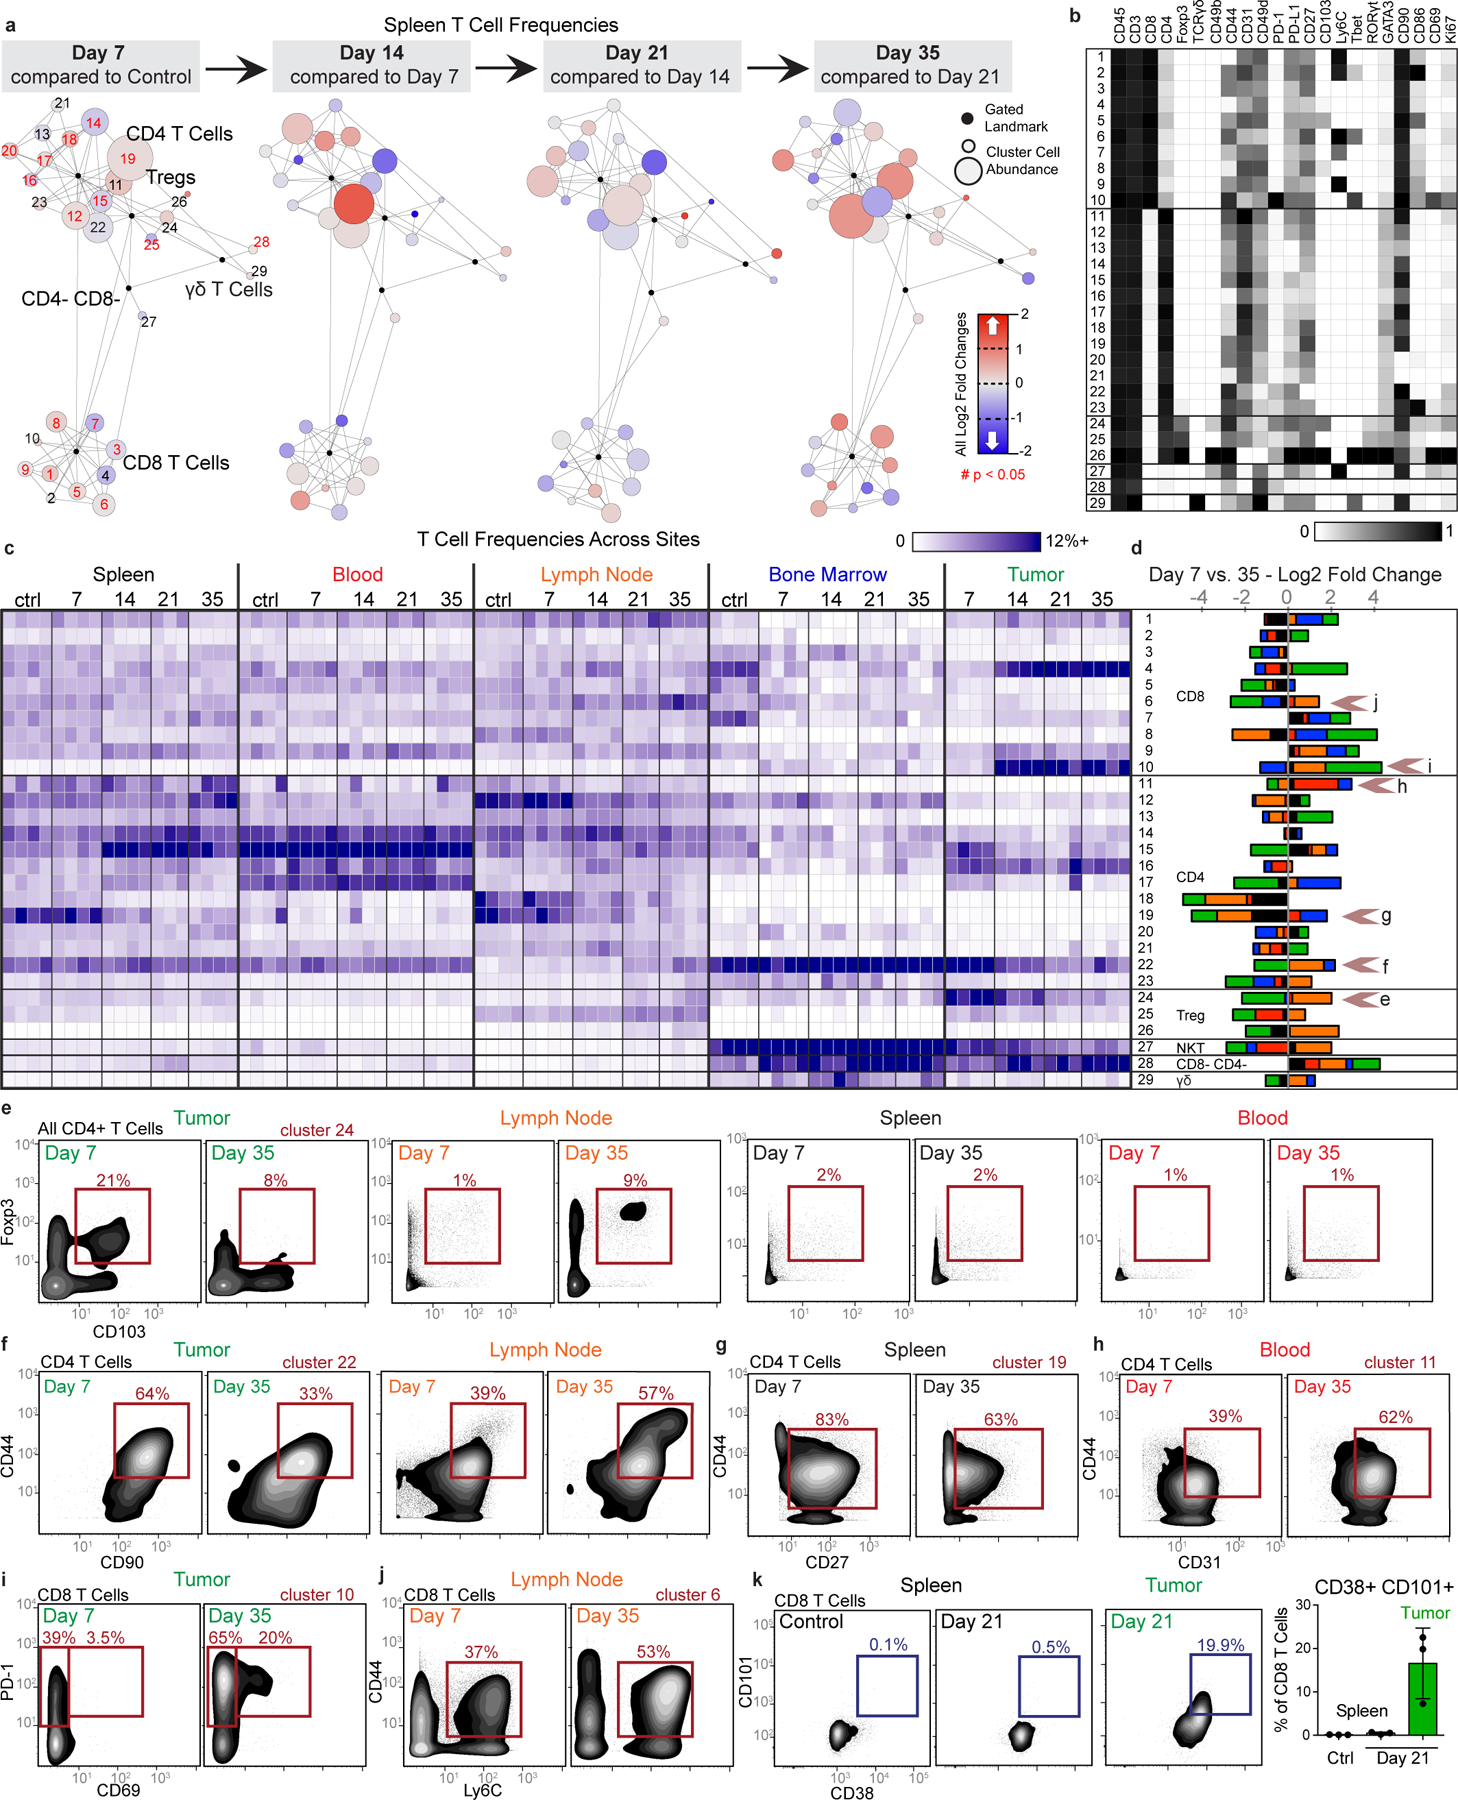
a-d, CD3+ CD11b- leukocytes from all tissues from healthy and 4T1 tumor-burdened animals at progressive time points. a, Scaffold maps of the T cell cluster frequencies in the spleen at each disease stage, all colored by log2 fold change in frequency. Clusters with significant change over time are highlighted in red in the first map, q < 0.05 by multiclass significance analysis of microarrays. b, Heatmap of the protein expression defining each T cell cluster, column normalized to each protein’s maximum positive expression. c, Heatmap of each T cell cluster frequency, by row, in each site and across the individual 3–4 animals per time point. d, Stacked bar plot of the log2 fold change in cluster frequency between early (day 7) and late (day 35) disease stage, colored by tissue. e-j, Representative scatter plots of key proteins defining T cell clusters that change in frequency in the designated tissues between early and late disease stage for Tregs (e), CD4 T cells (f-h), and CD8 T cells (i-j). k, Representative scatter plots and quantification of CD101+ CD38+ dysfunctional CD8 T cells in the spleen and tumor of health or day 21 tumor-burdened animals. All panels from one experiment, n = 3 independent animals for day 21 and n = 4 for all other timepoints. Barplot: centre, mean; whiskers, standard deviation.
Demonstrating the breadth of immune reorganization in cancer, all T cell clusters changed in abundance across multiple tissues between early and late disease time points (Fig. 3d). Of particular interest, tumor-infiltrating CD103+ Tregs, described as potent suppressors of effector T cells25, were abundant at day 7 but decreased with tumor progression (Fig. 3e). This Treg subset expanded in the draining lymph node, suggesting that distal suppressive mechanisms may support local changes to maintain a tumor-promoting systemic state. Anti-correlated changes extended to conventional CD4 T cells, where CD44+ CD90high activated CD4 T cells decreased in the tumor but expanded in the lymph node (Fig. 3f). The spleen showed the greatest change in CD44+ CD27+ memory CD4+ T cells, which decreased with disease progression (Fig. 3g). The blood showed increases of activated CD44+ CD4+ T cells expressing the CD31 adhesion receptor, which can promote T cell survival in settings of inflammation (Fig. 3h)26. CD44+ CD8+ T cells expanding in the lymph node expressed Ly6C (Fig. 3j), which can support lymph node homing of central memory T cells27. CD8+ T cells generally expanded in the tumor, but the most dominant cluster expressed high levels of PD-1 and CD69 previously associated with T cell dysfunction (Fig. 3i)28,29. To explore the extent of dysfunction, we interrogated intratumoral and splenic T cells for their expression of CD101 and CD38, two markers recently identified as evidence of permanent T cell dysfunction1. Late-stage tumor burden led to accumulation of CD38+CD101+ CD8+ T cells in the tumor as expected; however, this phenotype did not emerge in the spleen (Fig. 3k), suggesting that CD8+ T cells are altered differently in the TME and periphery. Similar changes in T cell composition were observed in the MMTV-PyMT model (Extended Data Fig. 5c–h).
A similar pan-organ clustering analysis for the mononuclear phagocyte subsets, including macrophages and dendritic cells (Extended Data Fig. 6), revealed correlated and anti-correlated systemic changes in cell states with tumor progression. As expected, the tumor-infiltrating subsets were distinct from peripheral subsets and expressed high levels of PD-L1.
We specifically interrogated protein expression dynamics of PD-1 and PD-L1, the most commonly manipulated immune checkpoints by cancer immunotherapies to facilitate T cell responses30. While expression of these molecules is used clinically for patient stratification, it remains unclear whether they are expressed consistently or modulated dynamically over time. We indeed found dynamic PD-1 and PD-L1 expression on infiltrating immune cells (CD45+) and non-immune cells (CD45− CD31−) in the TME and in the periphery of both 4T1 and AT3 breast cancer models (Extended Data Fig. 7a- c). In fact, while the overall amount of PD-L1 expression was significantly less in the blood compared to the tumor, median leukocyte signal intensity was positively correlated between these tissues (Extended Data Fig. 7d, r = 0.7487, p = 0.001). Both PD-1 and PD-L1 were promiscuously expressed across immune cell types, particularly within the TME (Extended Data Fig. 7e). The most prominent cells expressing PD-L1 in the periphery were non-classical monocytes31 and cDCs, while PD-1 was abundantly expressed on T cells, neutrophils and eosinophils. Dynamicity in PD-1 and PD-L1 expression suggests the potential for differential sensitivity to checkpoint blockade over the course of tumor development.
Changes in cellular proliferation or death rates are potential mechanisms contributing to immune composition alterations. We discovered that immune proliferation fluctuated systemically in a pattern nique to each site but was coordinated across all immune subsets within that site (Extended Data Fig. 8a–d). Changes in Ki67 and cleaved caspase-3 expression corresponded poorly with clusters that were increasing or decreasing in frequency in the spleen (Extended Data Fig. 8e). Thus, while tumor burden systemically alters proliferation and death, these processes alone likely do not account for the systemic immune alterations observed.
De novo T cell responses are impaired by pre-existing malignancy
Having established that tumor development drives an altered immune macroenvironment, we next examined whether immune responses to new challenges were affected. Type 1 immune responses are associated with strong cellular immunity and are generally thought to provide optimal anti-tumor immunity. To understand how type 1 immune responses might take place in the context of cancer, we challenged healthy or AT3 tumor-bearing mice with two well-described pathogens that induce potent type 1 immunity, lymphocytic choriomeningitis virus (LCMV) and Listeria monocytogenes (Lm)32,33. Tumor-burdened mice still cleared the pathogens from the spleen (Fig. 4a–b), consistent with the lack of complete immunosuppression in solid tumor patients. However, the cellular immune response to infection was dramatically altered. The differentiation of effector CD8 T cells, the magnitude of CD8+ T cell proliferation, and expression of the cytolytic mediator Granzyme B were all significantly impaired in tumor-bearing mice after infection (Fig. 4c–e and Extended Data Fig. 9a). These results demonstrate an unappreciated impairment of new cellular immune responses in the context of cancer.
Fig. 4: Tumor burden leads to impaired T cell responses to secondary infection.
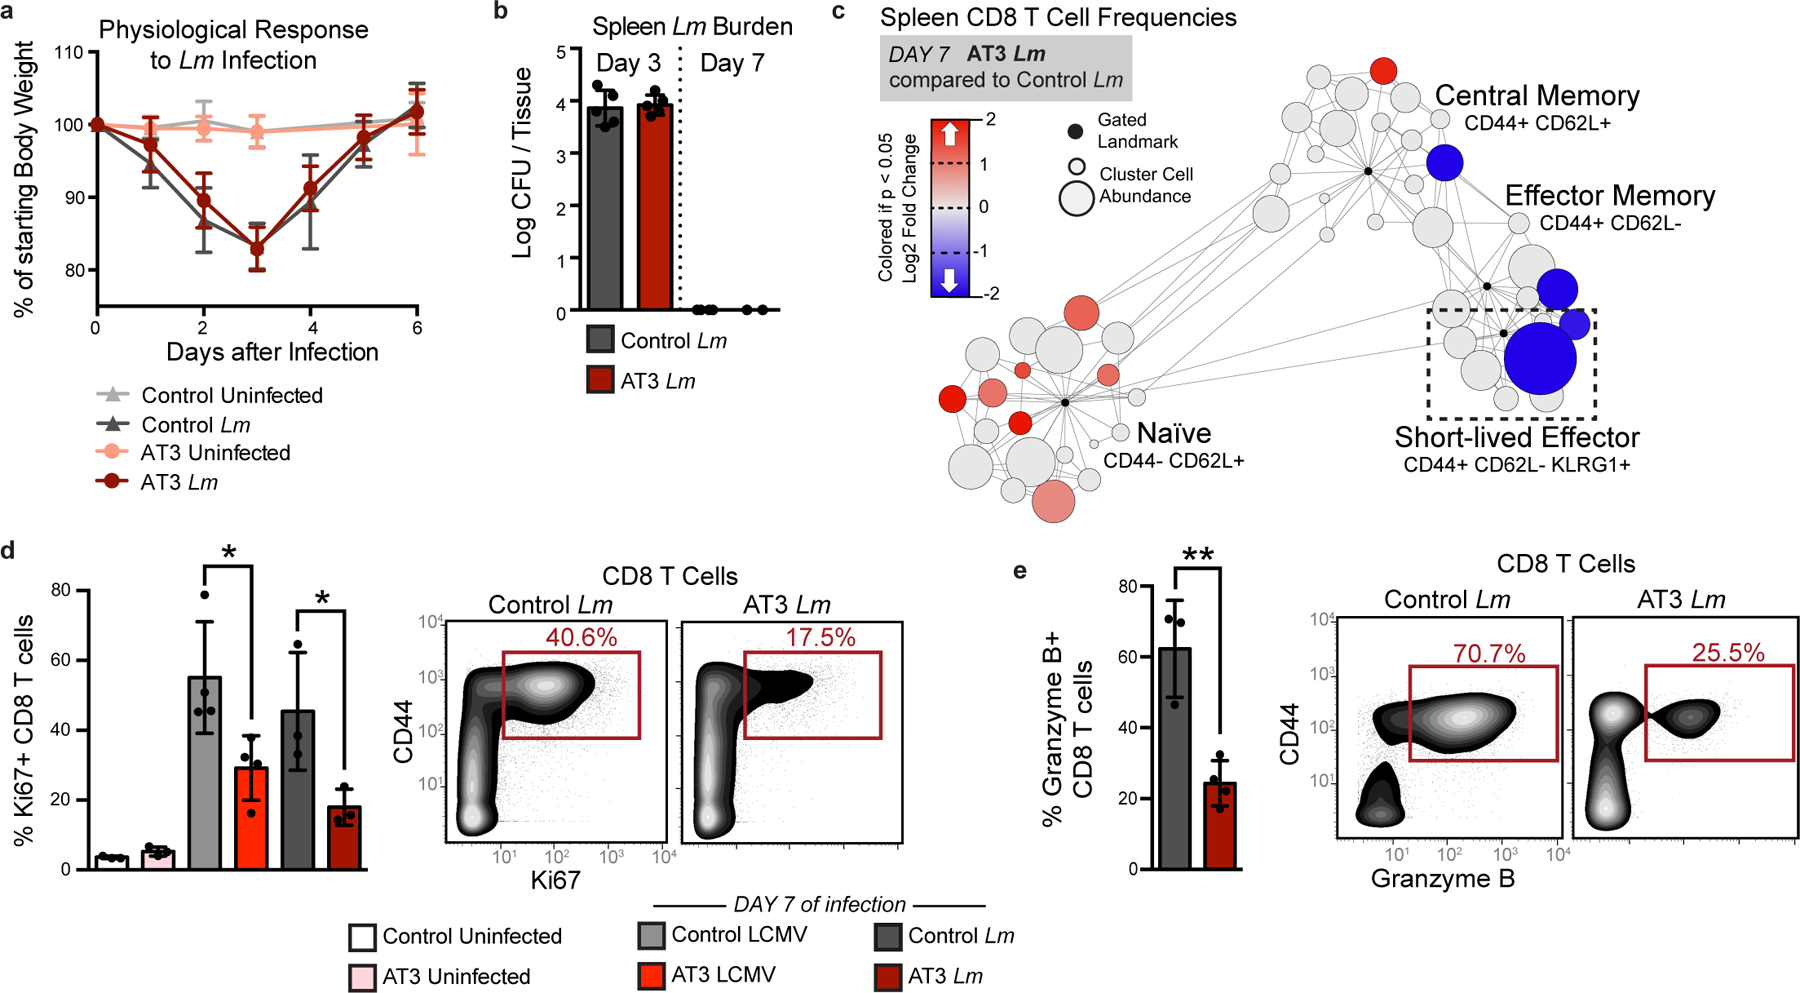
a-b, Fold change in body weight after Listeria monocytogenes (Lm) infection (n = 11 independent animals for control groups and n = 9 for AT3 groups) (a), and quantification of Lm bacterial burden (b) in control and AT3 tumor-burdened animals (n = 5 for day 3 groups, n = 4 for control day 8, and n = 2 for AT3 day 8). c, Scaffold map of CD8 T cell frequencies in the spleen in AT3 tumor-burdened mice after 7 days of Lm infection, colored by fold change in frequency compared to infected control mice (n = 3 uninfected, n = 3 Lm infected), q < 0.05 by significance analysis of microarrays. d-e, Quantification and representative scatter plots of splenic CD8+ T cell proliferation (d) and Granzyme B production (e) in response to LCMV Armstrong or Lm in healthy or AT3 tumor-burdened animals (n = 3 uninfected, n = 4 LCMV, and n = 3 Lm infected). For all barplots: p* < 0.05, p** < 0.01 by two-sided t-test; centre, mean; whiskers, standard deviation.
We previously found that CD8+ T cells with markers of terminal dysfunction were only observed in the TME and not in the spleen (Fig. 3k). Consistent with this hypothesis, splenic CD8+ T cells harvested from either control or tumor-burdened animals were equally capable of producing the key effector cytokines IFNγ, TNFα, and IL-2 in vitro (Extended Data Fig. 9b). To test their functionality after infection, CD8+ T cells from OT-I transgenic mice expressing a T cell receptor specific for ovalbumin (SIINFEKL) were isolated from control or tumor-bearing mice and transferred into recipient mice, which were infected with Lm expressing ovalbumin (Lm-OVA). AT3 tumors still drove systemic changes in TCR transgenic mice (Extended Data Fig. 9c). OT-I CD8+ T cells from control and tumor-bearing mice proliferated equivalently in control recipients at day 7 post-infection, the peak of the CD8 T cell response32–34 (Fig. 5a). However, when OT-I T cells were transferred into tumor-bearing recipients prior to infection, they expanded poorly, failed to induce T-bet expression associated with differentiation into effector cells, and expressed higher levels of PD-1 (Fig. 5b). Similar results were also observed when polyclonal CD8 T cells from control or tumor-burdened mice were competitively transferred (Fig. 5c). We found that antigen-specific central memory, effector memory, and short-lived effector CD8+ T cells were less abundant in tumor-bearing mice at day 10 as well, suggesting that defects extend beyond peak proliferation and represent a fundamental impairment of de novo CD8+ T cell responses (Fig. 5d). Together, these results demonstrate that cell extrinsic mechanisms suppress systemic T cell function in the tumor context.
Fig. 5: Tumor burden attenuates dendritic cell activation during secondary infection.
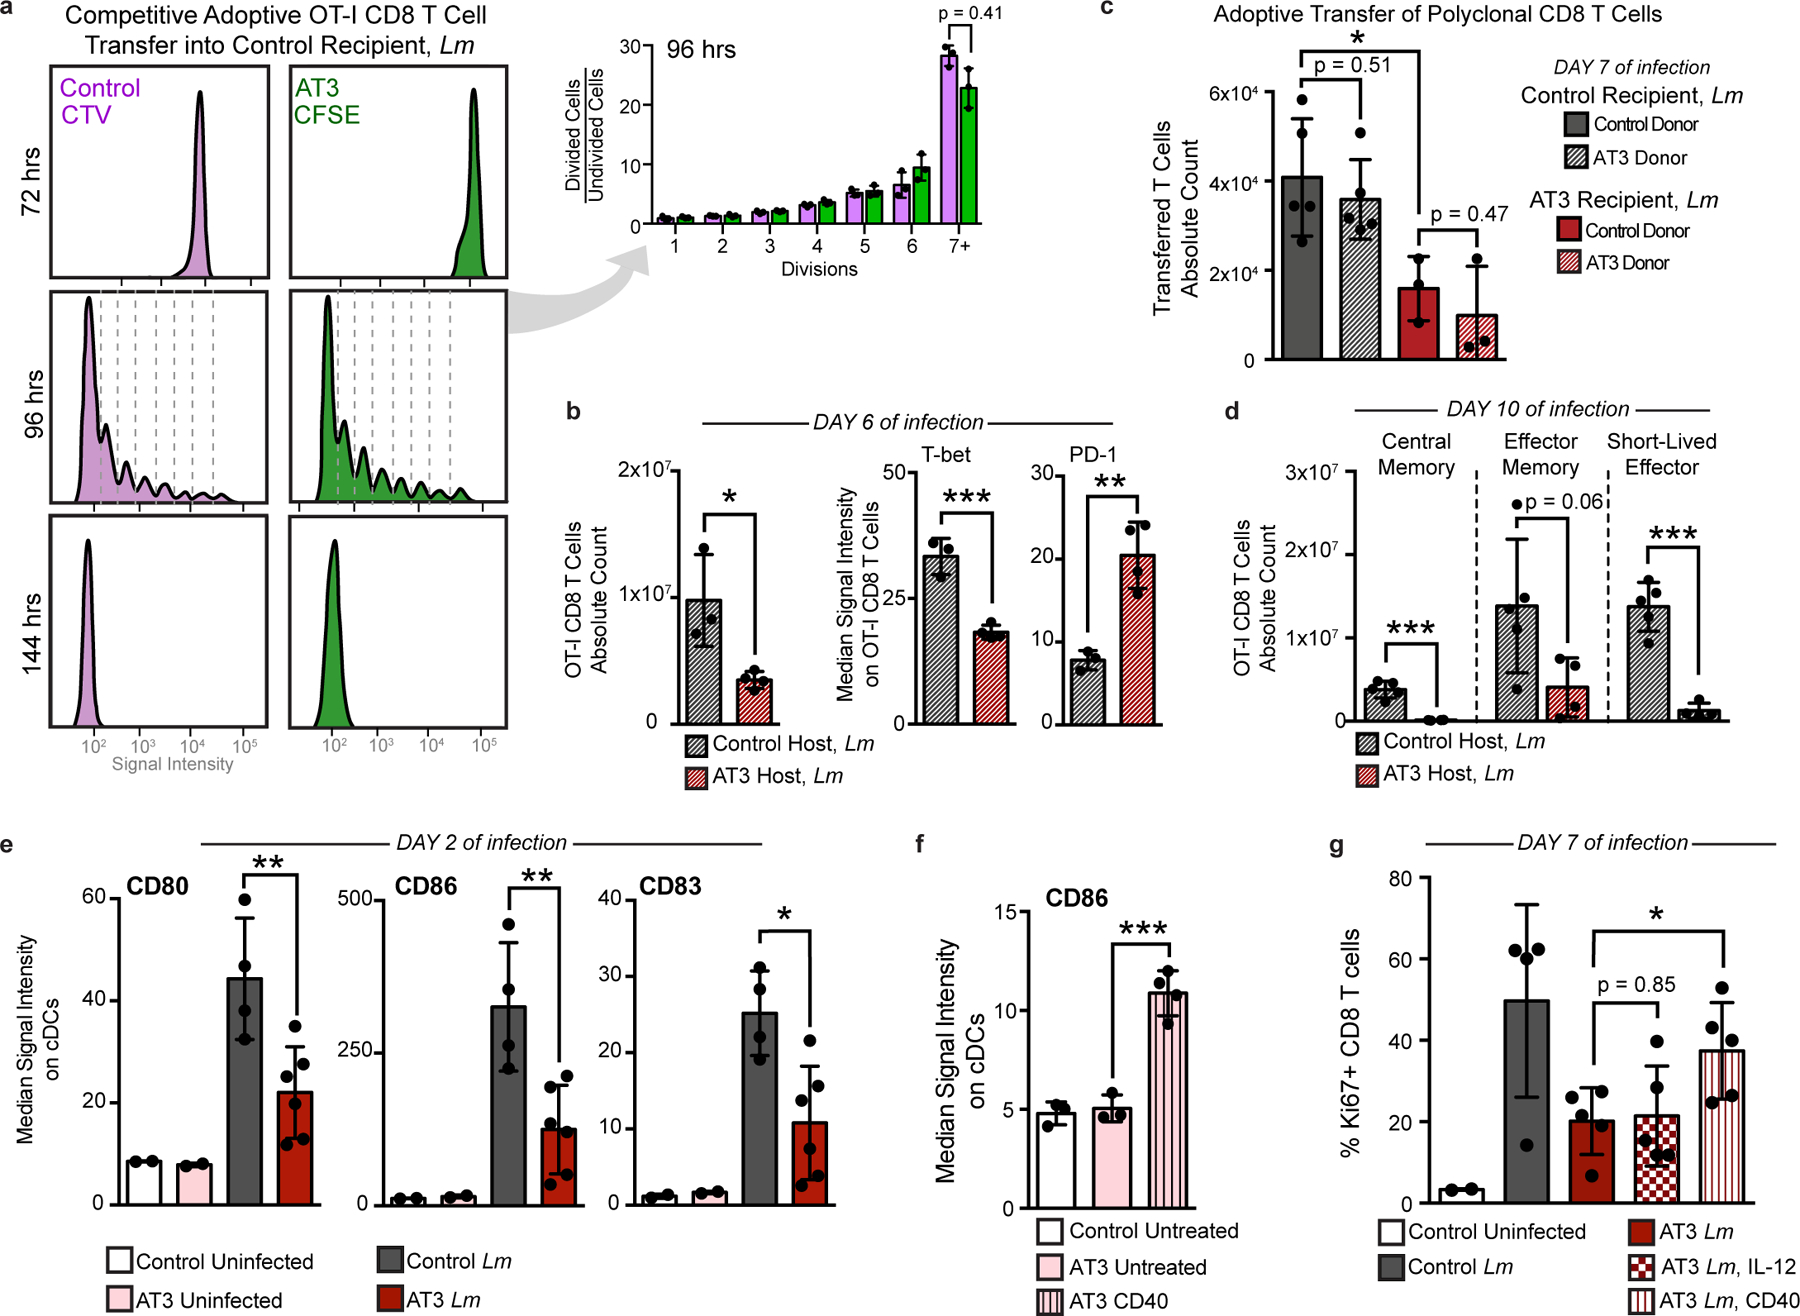
a, OT-I T cell proliferation from control or tumor-burdened animals transferred into control recipients, and analyzed at 72, 96, and 144 hours post Lm-Ova infection (n = 3 independent animals per group). Quantification of 96 hours. b, Transferred OT-I T cell counts and median signal intensity of T-bet and PD-1 at day 6 of Lm-OVA infection (n = 3 for control, and n = 4 for AT3 hosts). c, Competitively transferred polyclonal CD8 T cell counts from congenic (CD45.1+ AT3 tumor-burdened or CD45.1+CD45.2+ control) donors into CD45.2 control (n = 5) or AT3 tumor-burdened recipients (n = 4), after 7 days of Lm infection. d, CD8+ T cell subtype counts from transferred CD45.1+ OT-I T cells at day 10 of Lm-OVA infection (n = 5 for control, and n = 4 for AT3 hosts). e, Median signal intensity of CD80, CD86, and CD83 on splenic classical dendritic cells (cDCs) from healthy (n = 4) or AT3 tumor-burdened (day 28, n = 6) mice, at day 2 of Lm-OVA infection (n = 2 for uninfected groups). f, Median signal intensity of CD86 on splenic cDCs from untreated (n = 3) or CD40 treated (n = 4) AT3 tumor-burdened (day 21) mice. g, Quantification of splenic CD8+ T cell proliferation in healthy versus untreated, IL-12p70 treated, or anti-CD40 treated AT3 tumor-burdened animals at day 7 of Lm-OVA infection (n = 2 control uninfected, n = 4 control Lm, and n = 5 for AT3 groups). For all barplots: p* < 0.05, p** < 0.01, p*** < 0.001 by two-sided t-test; centre, mean; whiskers, standard deviation.
Since tumor-experienced CD8+ T cells in the periphery were not dysfunctional, we hypothesized that impaired APC activity earlier during infection contributes to decreased peripheral CD8+ T cell activation. Dendritic cells (DCs) play a key role in orchestrating CD8+ T cell responses to Lm35, and evidence suggests that circulating DCs in breast cancer patients have reduced antigen presentation capacity36. Therefore, we quantified costimulatory molecule expression on splenic DCs 2 days post-infection. DCs from AT3 tumor-bearing animals expressed lower levels of key costimulatory molecules CD80 and CD86 and the activation marker CD83 when compared to tumor-free controls (Fig. 5e and Extended Data Fig. 9d). DCs from tumor-bearing mice also exhibited suboptimal activation at day 7 of infection, expressing lower levels of CD80, the adhesion molecule CD54 (ICAM-1) and PD-L1 (Extended Data Fig. 9e). This result suggests that the PD-1/PD-L1 axis does not cause the T cell response impairment and indicates that alternative strategies are likely required to induce new systemic T cell activity. We therefore sought to pharmacologically boost APC activation as a plausible strategy for achieving this goal. Anti-CD40 treatment drives potent and systemic APC activation as shown by elevated CD86 and PD-L1 on splenic DCs (Fig. 5f and Extended Data Fig. 9f). In the context of infection, anti-CD40 treatment rescued CD8+ T cell proliferation in tumor-burdened animals 7 days post infection (Fig. 5g). We also observed significantly higher levels of activation markers CD80, CD54 and PD-L1 on DCs after treatment (Extended Data Fig. 9e), consistent with enhanced APC stimulation. In contrast, high doses of IL-12 or treatment with anti-CTLA-4 failed to rescue T cell proliferation (Fig. 5g and Extended Data Fig. 9g), suggesting that T cell targeted interventions alone are not sufficient. These experiments demonstrate that APCs fail to drive optimal new T cell responses in the context of tumor burden.
Tumor resection reverses changes in systemic immune organization and responsiveness
Given that defects in T cell activity were reversed after removal from a tumor-burdened context, we asked whether tumor clearance was sufficient to revert changes in systemic immunity. We surgically resected tumors when systemic changes were evident across sites and allowed mice to recover from surgery for 14 days to mitigate immune confounders from wound healing. We carefully tracked both local recurrence and metastatic outgrowth by bioluminescent imaging. Successful tumor resection reversed changes in systemic immunity in the AT3 and 4T1 breast cancer and the MC38 colorectal cancer models (Fig. 6a). Splenic immune cluster frequencies and proliferative behavior became comparable to control animals (Fig. 6b and c, and Extended Data Fig. 10a–c). Successful resection restored compositional changes in spleen immune frequencies and T cell clusters; however, local recurrence in the AT3 model and overt lung metastasis in the 4T1 model led to intermediate phenotypes in the systemic immune state (Fig. 6d and e, and Extended Data Fig. 10d and f-g). Local recurrence induced changes in the spleen comparable to primary tumors, but the composition of T cells was less dramatically altered. Lung metastasis induced more moderate changes, suggesting that systemic immune perturbations are not primarily the consequence of disseminated metastases. Finally, we interrogated DC and T cell responses 7 days after Lm-OVA infection and observed higher CD86 and PD-L1 expression on DCs in successfully resected mice (Extended Data Fig. 10h), and both T cell proliferation and Granzyme B production were restored (Fig. 6f–g). Local recurrence mitigated this rescue. Thus, changes in the immune macroenvironment, unlike those of T cells in the TME, are highly dependent on ongoing tumor burden and are reversible upon effective tumor clearance.
Fig. 6: Tumor resection completely resets the systemic immune landscape.
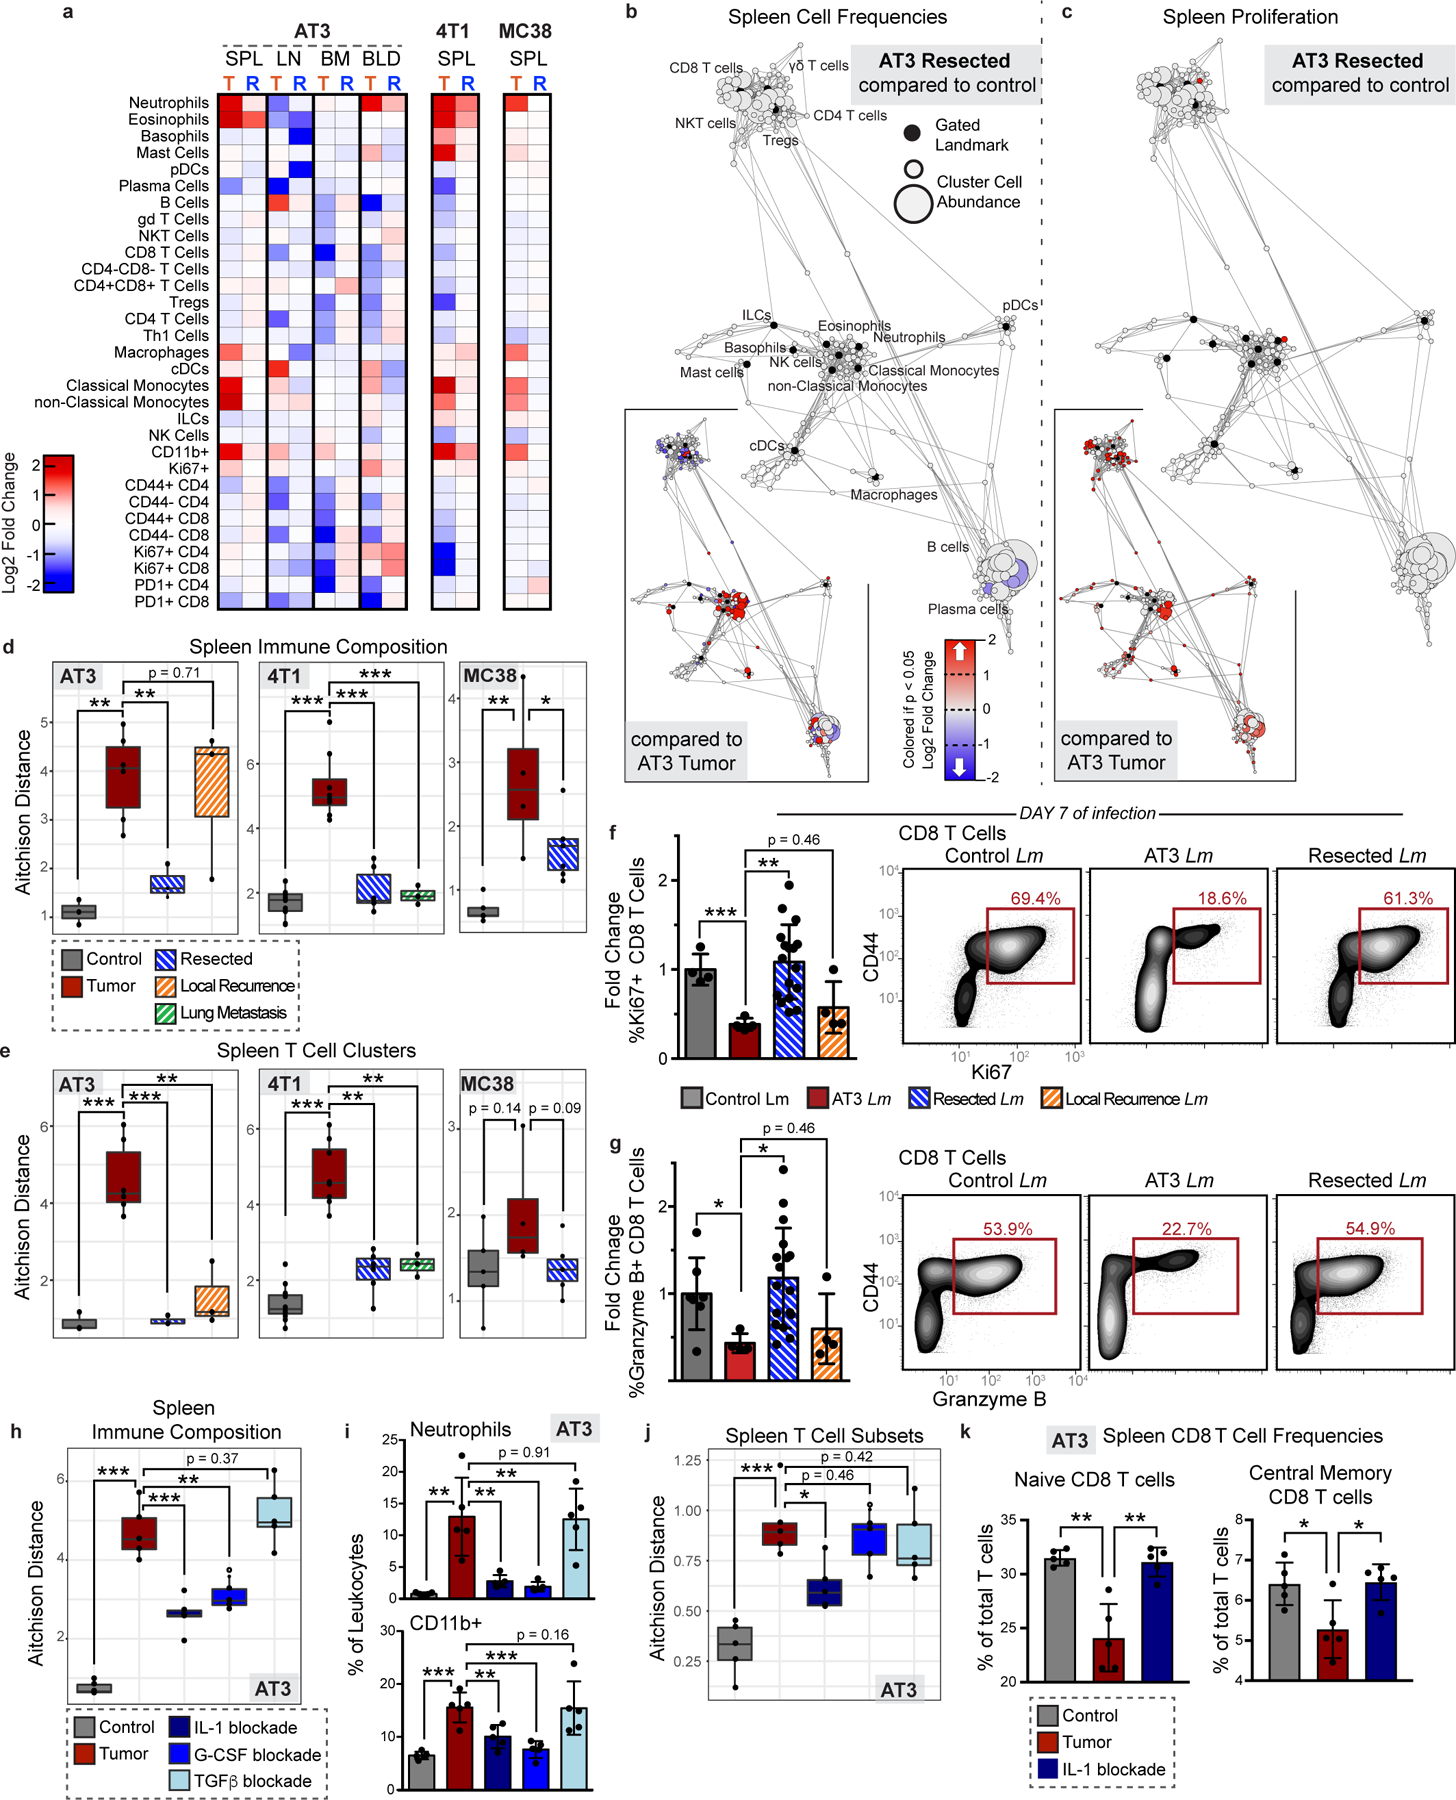
a, Heatmaps of log2 fold changes in peripheral immune frequencies from tumor-burdened (T) or resected (R) mice. b-c, Scaffold maps of spleen immune frequencies (b) and proliferation (c) after AT3 resection compared to control (n = 3 per group). Insets show resected compared to tumor-burden (n = 4), q < 0.05 by significance analysis of microarrays. d-e, Compositional Aitchison distances in spleen immune frequencies (d) or T cell cluster frequencies (e) from control (n = 3 for AT3, 8 for 4T1, and 5 for MC38), tumor-burdened (n = 6, 8, and 4), resected (n = 3, 6 and 6), or locally recurrent mice for AT3 and distal lung metastasis for 4T1 (n = 3 for both)(2 independent experiments for 4T1 and 1 experiment for AT3 and MC38). f-g, Quantification and representative scatter plots of splenic CD8+ T cell proliferation (f) and Granzyme B production (g) after Lm infection in control (n = 4 and n = 7), AT3 tumor-burdened (n = 4), resected (n = 17), or recurrent mice (n = 4), 3 independent experiments. h-k, Compositional Aitchison distances of spleen immune frequencies (h), spleen frequencies of neutrophil (top) and undefined CD11b+ cells (bottom) (i), compositional Aitchison distances of T cell subset frequencies (j), and splenic CD8+ T cell frequencies (k) from control, or tumor-burdened mice untreated or with IL-1, G-CSF, or TGFb antibody blockade (n = 5 per group, from 1 experiment). All box plots: center line, median; box limits, upper and lower quartiles; whiskers, 1.58x interquartile range / sqrt(n); points, outliers. All barplots: p* < 0.05, p** < 0.01, p*** < 0.001 by two-sided t-test; centre, mean; whiskers, standard deviation.
Finally, we investigated circulating cytokine levels to define potential mediators of tumor-driven systemic immune remodeling. We reasoned that candidate factors would be elevated in the serum of AT3 tumor-burdened mice, reduced in successfully resected animals, and elevated again with local recurrence, or vice versa. We found that levels of the inflammatory cytokines IL-1a and G-CSF followed this pattern (Extended Data Fig. 10i). Notably, recent studies have implicated G-CSF as a driver of myeloid-derived suppressor cell and neutrophil expansion in preclinical models and cancer patients12,37,38. While IL-1b has been shown to promote tumor development locally in the TME, the role of IL-1a is less well understood, though it is elevated human breast cancers39–41. Consistent with the hypothesis that tumor-secreted factors contribute to systemic immune remodeling, G-CSF and IL-1a, but not IL-1b, were produced by AT3 cancer cells in vitro (Extended Data Fig. 10j). We next treated mice with IL-1 and G-CSF blocking antibodies starting 5 days after tumor initiation, prior to most systemic immune changes. We also investigated the potential systemic impacts of TGFb, a pleiotropic cytokine known to play key roles in shaping the TME, including immune cell exclusion and immunosuppression42,43. Both IL-1 and G-CSF blockade significantly abrogated systemic immune remodeling while TGFb blockade had no effect (Fig. 6h and Extended Data Fig. 10e). IL-1 and G-CSF blockade reduced splenic neutrophils and less mature CD11b+ myeloid cells (Fig. 6i). Notably, IL-1 blockade also significantly reduced circulating levels of G-CSF, suggesting that IL-1 may act upstream to promote G-CSF production (Extended Data Fig. 10k), consistent with in vitro data from human tumor cell lines44. IL-1 blockade was additionally sufficient to reduce tumor effects on the splenic T cell composition, preventing the observed reductions in naïve and central memory CD8 T cells (Fig. 6j–k). Thus, circulating IL-1a and G-CSF are critical mediators of tumor-driven systemic immune remodeling in this context.
DISCUSSION
This study constructs a comprehensive landscape of the immune macroenvironment in cancer, revealing a systemic immune context to consider when targeting immune behavior therapeutically. Strong pre-existing T cell activity is associated with clinical benefit from currently available immunotherapies, but many cancer patients likely require the priming of new antitumor immune responses. However, the ability of a tumor-burdened immune system to establish new responses is poorly defined45–47. Cancer patients are more susceptible to opportunistic infections and mount less effective responses to vaccines48,49, though the relative contributions of tumor driven systemic disruption and cytotoxic cancer therapies are debated. Here, we show that systemic immunity is disrupted to varying degrees across tumor types. Systemic immune alterations in breast cancer impair new immune responses, even to highly immunogenic pathogens that do not share tumor antigens. This challenges the idea that T cell dysfunction in cancer is limited to tumor-specific T cells experiencing chronic antigen exposure. Our data reveal impairment in the initial coordination of a T cell response by APCs, impacting T cell proliferation and differentiation. Impaired type 1 immune responses represent a fundamental, but previously unappreciated, obstacle for effective immunotherapy. These results, alongside promising clinical results of CD40 agonism in pancreatic cancer50, strongly support combinatorial therapeutic strategies that include APC activation.
This work further reveals remarkable plasticity in the systemic immune state, as successful tumor resection largely reverted systemic immune disruptions. Influenced by physiological context, immunotherapies may have different consequences when applied pre- or post-operatively. These studies show that the immune macroenviornment in cancer is highly manipulatable, warranting further studies in cancer patients. Prior studies have connected systemic changes with relapse in breast cancer patients, showing altered immune gene signatures in uninvolved lymph nodes and blood of patients with metastatic versus non-metastatic disease51 and that circulating CD45RA−Foxp3high Tregs predict future relapse52. In breast tumor models, we show that the primary tumor is a primary driver of systemic immune reorganization, but that lung and lymph node metastasis are also associated with additional subtle changes. Future work to understand systemic immune alterations across cancer patients could inform prognosis and optimal therapy.
Our study lays the foundation for detailed studies of specific tumor macroenvironments to match our detailed understanding of tumor microenvironments in mouse tumor models and patients. Building a complete understanding of systems-level immunity in cancer should further our ability to drive effective and rationally-designed anti-tumor immune responses in all cancer patients.
METHODS
Animals
All mice were housed in an American Association for the Accreditation of Laboratory Animal Care-accredited animal facility and maintained in specific pathogen-free conditions. Animal experiments were approved and conducted in accordance with Institutional Animal Care & Use Program protocol number AN157618. Wild-type female BALB/c, C57BL/6, and B6;129 F1 mice between 8–10 weeks old were purchased from The Jackson Laboratory and housed at our facility. 4T1 (1X10⁵ cells / 100μl) or AT3 (5×10⁵ cells / 100μl) breast cancer cells were transplanted into the fourth mammary fat pad. SB28 glioblastoma cells (1×10⁵ cells / 2μl) were transplanted into the right cerebral hemisphere by stereotactic injection. MC38 colon cancer cells (1×10⁵ cells / 100μl), B16-F10 melanoma cancer cells (1×10⁵ cells / 100μl), or LMP pancreatic cancer cells (2×10⁵ cells / 100μl) were transplanted into the subcutaneous region of the flank. Female MMTV-PyMT mice were bred at Stanford University. Tyr::CreER; BrafV600E/+; Ptenlox/lox mice were purchased from Jackson Laboratory and housed at our facility. Tumors were considered well-established when they reached approximately 1 cm3 in volume. TCR Transgenic OT-I CD45.1 mice and heterozygous CD45.2/CD45.1 mice were bred at our facility. Animals were housed under standard SPF conditions with typical light/dark cycles and standard chow.
Cell Lines
4T1 cells were gifted from Dr. Mary-Helen Barcellos-Hoff (UCSF). AT3 cells were gifted from Dr. Ross Levine (MSKCC). For in vivo experiments tracking tumor growth and recurrence after resection, we used 4T1 cells expressing mCherry-Luciferase and AT3 cells expressing GFP-Luciferase. SB28 cells, derived from a NRasV12;shp53;mPGDF transposon-induced glioma53, were gifted from Dr. Hideho Okada (UCSF). LMP cells, derived from the KrasG12D/+;LSL-Trp53R172H/+;Pdx-1-Cre model of pancreatic cancer54, were gifted from Dr. Edgar Engleman (Stanford University). MC38 cells and B16-F10 cells gifted from Dr. Jeffrey Bluestone (UCSF). 4T1, MC38, B16 and SB28 cells were cultured in RPMI-1640, and AT3 and LMP cells were cultured in DMEM, all supplemented with 10% FCS, 2 mM L-glutamine,100 U/mL penicillin and 100 mg/mL penicillin/streptomycin.
Infectious Agents
Listeria monocytogenes strain 10403s expressing OVA (Lm-OVA) was originally kindly provided by Shomyseh Sanjabi (UCSF).55 Lm-OVA stocks frozen at −80 C were grown overnight at 37 C in BHI broth supplemented with 5 ug/ml Erythromycin. Then, overnight cultures were sub-cultured by diluting into fresh BHI broth supplemented with 5 ug/ml Erythromycin and grown for 4 hours. Bacteria CFU was then quantified by measuring optical density at 600 nm. Bacteria were then diluted to 5X10⁴ CFU / 100μl in sterile PBS and 100 μl was injected per mouse i.v. via the retro-orbital vein.
Lymphocytic choriomeningitis virus (LCMV) was kindly provided by Dr. Jason Cyster (UCSF) and mice were infected with pre-titered and aliquoted stocks stored in PBS at −80C and diluted with sterile PBS. Mice were infected with 2×10⁵ PFU by intraperitoneal injection.
Mass Cytometry Antibodies
All mass cytometry antibodies and concentrations used for analysis can be found in Supplementary Table1. Primary conjugates of mass cytometry antibodies were prepared using the MaxPAR antibody conjugation kit (Fluidigm) according to the manufacturer’s recommended protocol. Following labeling, antibodies were diluted in Candor PBS Antibody Stabilization solution (Candor Bioscience GmbH, Wangen, Germany) supplemented with 0.02% NaN3 to between 0.1 and 0.3 mg/mL and stored long-term at 4°C. Each antibody clone and lot was titrated to optimal staining concentrations using primary murine samples.
Cell Preparation
All tissue preparations were performed simultaneously from each individual mouse, as previously reported2. After euthanasia by C02 inhalation, peripheral blood was collected via the posterior vena cava prior to perfusion of the animal and transferred into sodium heparin-coated vacuum tubes prior to dilution in PBS with 5mM EDTA and 0.5% BSA (PBS/EDTA/BSA). Spleens and lymph nodes were homogenized in PBS/EDTA at 4°C. Bone marrow was flushed from femur and re-suspended in PBS/EDTA at 4°C. Tumors were finely minced and digested in RPMI-1640 with 4 mg/ml collagenase IV, and 0.1 mg/ml DNase I. After digestion, re-suspended cells were quenched with PBS/EDTA at 4°C. All tissues were washed with PBS/EDTA and re-suspended 1:1 with PBS/EDTA and 100mM Cisplatin (Enzo Life Sciences, Farmingdale, NY) for 60 s before quenching 1:1 with PBS/EDTA/BSA to determine viability as previously described24. Cells were centrifuged at 500 g for 5 min at 4°C and re-suspended in PBS/EDTA/BSA at a density between 1–10*106 cells/ml. Suspensions were fixed for 10 min at RT using 1.6% PFA and frozen at −80°C.
Mass-Tag Cellular Barcoding
Mass-tag cellular barcoding was performed as previously described56. Briefly, 1*106 cells from each animal were barcoded with distinct combinations of stable Pd isotopes in 0.02% saponin in PBS. Samples from any given tissue from each mouse per experiment group were barcoded together. Cells were washed once with cell staining media (PBS with 0.5% BSA and 0.02% NaN3), and once with 1X PBS, and pooled into a single FACS tube (BD Biosciences). After data collection, each condition was deconvoluted using a single-cell debarcoding algorithm56.
Mass Cytometry Staining and Measurement
Cells were resuspended in cell staining media (PBS with 0.5% BSA and 0.02% NaN3) and metal-labeled antibodies against CD16/32 were added at 20 mg/ml for 5 min at RT on a shaker to block Fc receptors. Surface marker antibodies were then added, yielding 500 uL final reaction volumes and stained for 30 min at RT on a shaker. Following staining, cells were washed 2 times with cell staining media, then permeabilized with methanol for at 10 min at 4°C. Cells were then washed twice in cell staining media to remove remaining methanol, and stained with intracellular antibodies in 500 mL for 30 min at RT on a shaker. Cells were washed twice in cell staining media and then stained with 1mL of 1:4000 191/193Ir DNA intercalator (Fluidigm) diluted in PBS with 1.6% PFA overnight. Cells were then washed once with cell staining media and then two times with double-deionized (dd)H20. Care was taken to assure buffers preceding analysis were not contaminated with metals in the mass range above 100 Da. Mass cytometry samples were diluted in ddH2O containing bead standards (see below) to approximately 106 cells per mL and then analyzed on a CyTOF 2 mass cytometer (Fluidigm) equilibrated with ddH2O. We analyzed 1–5*105 cells per animal, per tissue, per time point, consistent with generally accepted practices in the field.
Mass Cytometry Bead Standard Data Normalization
Data normalization was performed as previously described2. Briefly, just before analysis, the stained and intercalated cell pellet was resuspended in freshly prepared ddH2O containing the bead standard at a concentration ranging between 1 and 2*104 beads/ml. The mixture of beads and cells were filtered through a filter cap FACS tubes (BD Biosciences) before analysis. All mass cytometry files were normalized together using the mass cytometry data normalization algorithm57, which uses the intensity values of a sliding window of these bead standards to correct for instrument fluctuations over time and between samples.
Mass Cytometry Gating Strategy
After normalization and debarcoding of files, singlets were gated by Event Length and DNA. Live cells were identified by Cisplatin negative cells. All positive and negative populations and antibody staining concentrations were determined by titration on positive and negative control cell populations.
Scaffold Map Generation
Statistical scaffold maps were generated using the open source Statistical Scaffold R package available at github.com/SpitzerLab/statisticalScaffold with modifications detailed below.
Statistical scaffold analysis combines unsupervised clustering to identify immune cell subsets with dimensionality reduction using a force-directed graph to visualize the organization of immune cells within a tissue. Regions of the graph are easy to identify due to the incorporation of canonical immune cell types defined manually as ‘landmarks’ in the graph. As previously described2,24, cells from each tissue for all animals were clustered together and then deconvolved into their respective samples. Cluster frequencies or the Boolean expression of specific proteins for each cluster were passed into the Significance Analysis of Microarrays algorithm58 (using a q-value cutoff of 0.05), and the fold change results were reported (rather than the binary significance cutoff as originally implemented in Spitzer et al., 2017). Cluster frequencies were also correlated with the time from tumor inoculation using Spearman’s rank-ordered correlation. All results were tabulated into the Scaffold map files for visualization through the graphical user interface, with coloring modifications to graph the spectrum of fold change or correlation strength. The fold change was log2 normalized and graphed with an upper and lower limit of a four-fold difference, unless otherwise indicated. Cluster frequencies were calculated as a percent of total live leukocytes or parent immune subset as indicated. The spleen data from the 4T1 model was used to spatialize the initial Scaffold map because all major, mature immune cell populations are present in that tissue.
Cell Frequency Heat Map Generation
Specified subsets, i.e. T cells and mononuclear phagocytes, were manually gated from each tissue for all animals and clustered together. Cluster frequencies were calculated as a percent of total live nucleated cells within that subset (excluding erythrocytes). T cells were identified as CD3+, CD11b−. Mononuclear phagocytes were defined as CD11b+, CD19−, CD3−, Ly6G−. Heatmaps of the resulting cluster frequencies were generated in R.
Human Gene Expression Analysis
Whole blood microarray data was generated by The Norwegian Women and Cancer (NOWAC) study and is deposited in the European Genome-Phenome Archive under accession number EGAS00001001804 as previously reported59. Principal component analysis of centered and scaled data was performed in R using the prcomp function. xCell cell type enrichment analysis60 was performed in R using the xCell package (https://github.com/dviraran/xCell) using a customized list of cell populations known to exist in peripheral whole blood (B-cells, Basophils, CD4+ memory T-cells, CD4+ naive T-cells, CD4+ T-cells, CD4+ Tcm, CD4+ Tem, CD8+ naive T-cells, CD8+ T-cells, CD8+ Tcm, CD8+ Tem, cDC, Class-switched memory B-cells, Eosinophils, Erythrocytes, Megakaryocytes, Memory B-cells, Monocytes, naive B-cells, Neutrophils, NK cells, NKT, pDC, Plasma cells, Platelets, Tgd cells, Th1 cells, Th2 cells, Tregs).
In vitro CD8 T cell Differentiation and cytokine production
Mice bearing 21-day AT3 tumors were euthanized and their spleens harvested and dissociated. CD8 T cells were enriched using the EasySep Streptavidin Negative Selection Kit with the following biotinylated markers: CD11b, MHCII, CD11c, Gr1, B220, CD4, CD44, and Ter119. Isolated CD8 T cells were then stimulated with plate-bound CD3 and suspended in CD28 containing T cell media for 3 days. The cells were then removed from CD3/CD28 stimulation and rested for 1 day. Cells were then restimulated with PMA & Ionomycin or left unstimulated for 4 hours with Brefeldin A and analyzed by flow cytometry.
Adoptive T Cell Transfer
For OT1 and polyclonal adoptive transfers, CD8 T cells were isolated from spleens of CD45.1 OT1 TCR transgenic or CD45.1/CD45.2 heterozygote wildtype or CD45.1 BoyJ mice by enrichment with EasySep Streptavidin Negative Selection Kit with the following biotinylated markers: CD11b, MHCII, CD11c, Gr1, B220, CD4, and Ter119. Cells were stained with CFSE or Cell Trace Violet and 1×10⁵ cells were then adoptively transferred into each recipient mouse via the retroorbital vein.
Quantifying Bacterial Burden
To quantify bacterial burden, spleens were harvested and dissociated. Cells from each mouse were lysed in 0.5% TritonX 100 in PBS and cells were serially diluted in duplicate and aliquots were then added to BHI agar and incubated overnight at 37C. Colonies grown were then counted to quantify bacterial CFU present.
Treatments
For infection studies, in vivo antibody treatments were given i.p. starting on day 0 of Lm-Ova infection: 200 μg of agonistic anti-CD40 (FGK4.5, BioXCell) on day 0, 225 μg of recombinant IL-12p70 (BioLegend) daily, and 200 μg of anti-CTLA-4 (9H10, BioXCell) on day 0 and day 3. For cytokine inhibition studies, in vivo antibody treatments were given i.p. starting on day 5 after injection of AT3 cells: 10ug of blocking anti-GCSF (67604, R&D Systems) daily, and 200 ug of both blocking anti-IL-1a (ALF-161, BioXCell) and blocking anti-IL-1R (JAMA-147, BioXCell) every 3 days. We observed compensatory elevations in circulating IL-1a with anti-IL-1a treatment, so we added anti-IL-1R to ensure sufficient blockade of this pathway.
Tumor Resection
Mice bearing 14-day 4T1 tumors or 16 to 21-day AT3 or MC38 tumors (between 350–550mm3) were anesthetized by intraperitoneal (i.p) injection with a mixture of ketamine and xylazine, and titrated to effect with isoflurane from a precision vaporizer. The surgical site was shaved and sterilized with 70% ethanol and 10% povidone iodine. An incision was made subcutaneously at the anterior midline and along the flank of the side with the tumor, using surgical scissors, to reveal the inguinal mammary tumor. The tumor was teased away using forceps and the surgical wound closed with wound clips. Wound clips were removed after 7 days. 20–30% of AT3 or 4T1 resected mice had tumor recurrence due to incomplete removal of primary tumors or outgrowth of micro-metastases. These mice were separated from successful resection analyses.
Cytokine Quantification
For in vivo circulating plasma cytokines, mice were bled via the retroorbital vein using heparinized capillary tubes. Blood was then centrifuged at 1000 × g for 10 minutes and the supernatant plasma was removed for analysis. For tissue culture supernatants, cells were grown for 48 hours in fresh media, then supernatant was removed, centrifuged at 3000g for 10 minutes to remove debris. Plasma and tissue culture supernatant samples were sent to Eve Technologies (Calgary, AB), and analyzed using a multiplex cytokine array.
Flow Cytometry
All flow cytometry antibodies and concentrations used for analysis can be found in Supplementary Table 3. Cells were stained for viability with Zombie-NIR stain. Cell surface staining was performed in cell staining media (PBS with 0.5% BSA and 0.02% NaN3) for 15 minutes at room temperature. Intracellular staining was performed after fixing cells with BioLegend FluoroFix Buffer and permeabilizing cells with Biolegend’s Intracellular Staining Perm Wash Buffer. The following anti-mouse antibodies were used: (PE-Dazzle594) – CD3 (clone 17A2), (PacificBlue) – CD4 (clone RM4–5), (BV786) – CD8 (clone 53–6.7), (APC-Cy7) – CD45 (clone 30-F11), (APC) – CD38 (clone 90), (PE) – CD101 (clone Moushi101) , (PD1) – PE-Cy7 (clone 29F.1A12), (BV421) – TCRb (clone H57–597), (PE) – IFNg (clone XMG1.2), (BV711) – IL2 (clone JES6–5H4), (FITC) – TNFalpha (clone MP6-XT22), (BV650) – CD8 (clone 53–6.7), (BV510) – KLRG1 (clone 2F1-KLRG1), (BV421) – CD62L (clone MEL-14), (FITC) – CD45.2 (clone 104), (APC) – CD8 (clone 53–6.7), (PE-Cy7) – MHC I (clone AF6–120.1), (PE) – CD45.1 (clone A20). All antibodies were purchased from Biolegend, Inc., BD Biosciences, or Thermo Fisher Scientific. Stained cells were analyzed with a CytoFLEX flow cytometer (Beckman Coulter) or an LSR II flow cytometer (BD Biosciences).
Singlets were gated by FSC-A and FSC-W, as well as by SSC-A and SSC-W. All positive and negative populations were determined by staining on positive and negative control populations.
QUANTIFICATION AND STATISTICAL ANALYSIS
Comparison of cell frequencies and protein expression in Statistical Scaffold was performed using Significance Analysis of Microarrays as described above and in Bair and Tibshirani, 2004 and Bruggner et al., 2014. Features with q < 0.05 were considered statistically significant. Comparison of bulk cell frequencies was performed using Wilcoxon rank-Sum test with Benjamini-Hochberg correction in R. Analysis of principle components for human gene expression was performed using two-sided Wilcoxon rank-sum test in R. Analysis of cell correlation with time was performed using Spearman correlation with Benjamini-Hochberg correction. All comparisons over 4T1 tumor growth were performed by One-way ANOVA with Tukey correction in Prism. Unless otherwise states, all other comparisons after infection, treatment, or resection were made using two-sided t tests in Prism. All tests with p < 0.05 were considered statistically significant. Unless otherwise stated in the figure legends, n = 3 to 6 independent mice for each experimental condition.
DATA AVAILABILITY
All mass cytometry data are publicly available at https://premium.cytobank.org/cytobank/projects/2433/ or by request to the senior author without restrictions.
CODE AVAILABILITY
The updated Statistical Scaffold package is available at https://github.com/SpitzerLab/statisticalScaffold.
Extended Data
Extended Data Fig. 1. Main Mass Cytometry Gating Strategy.
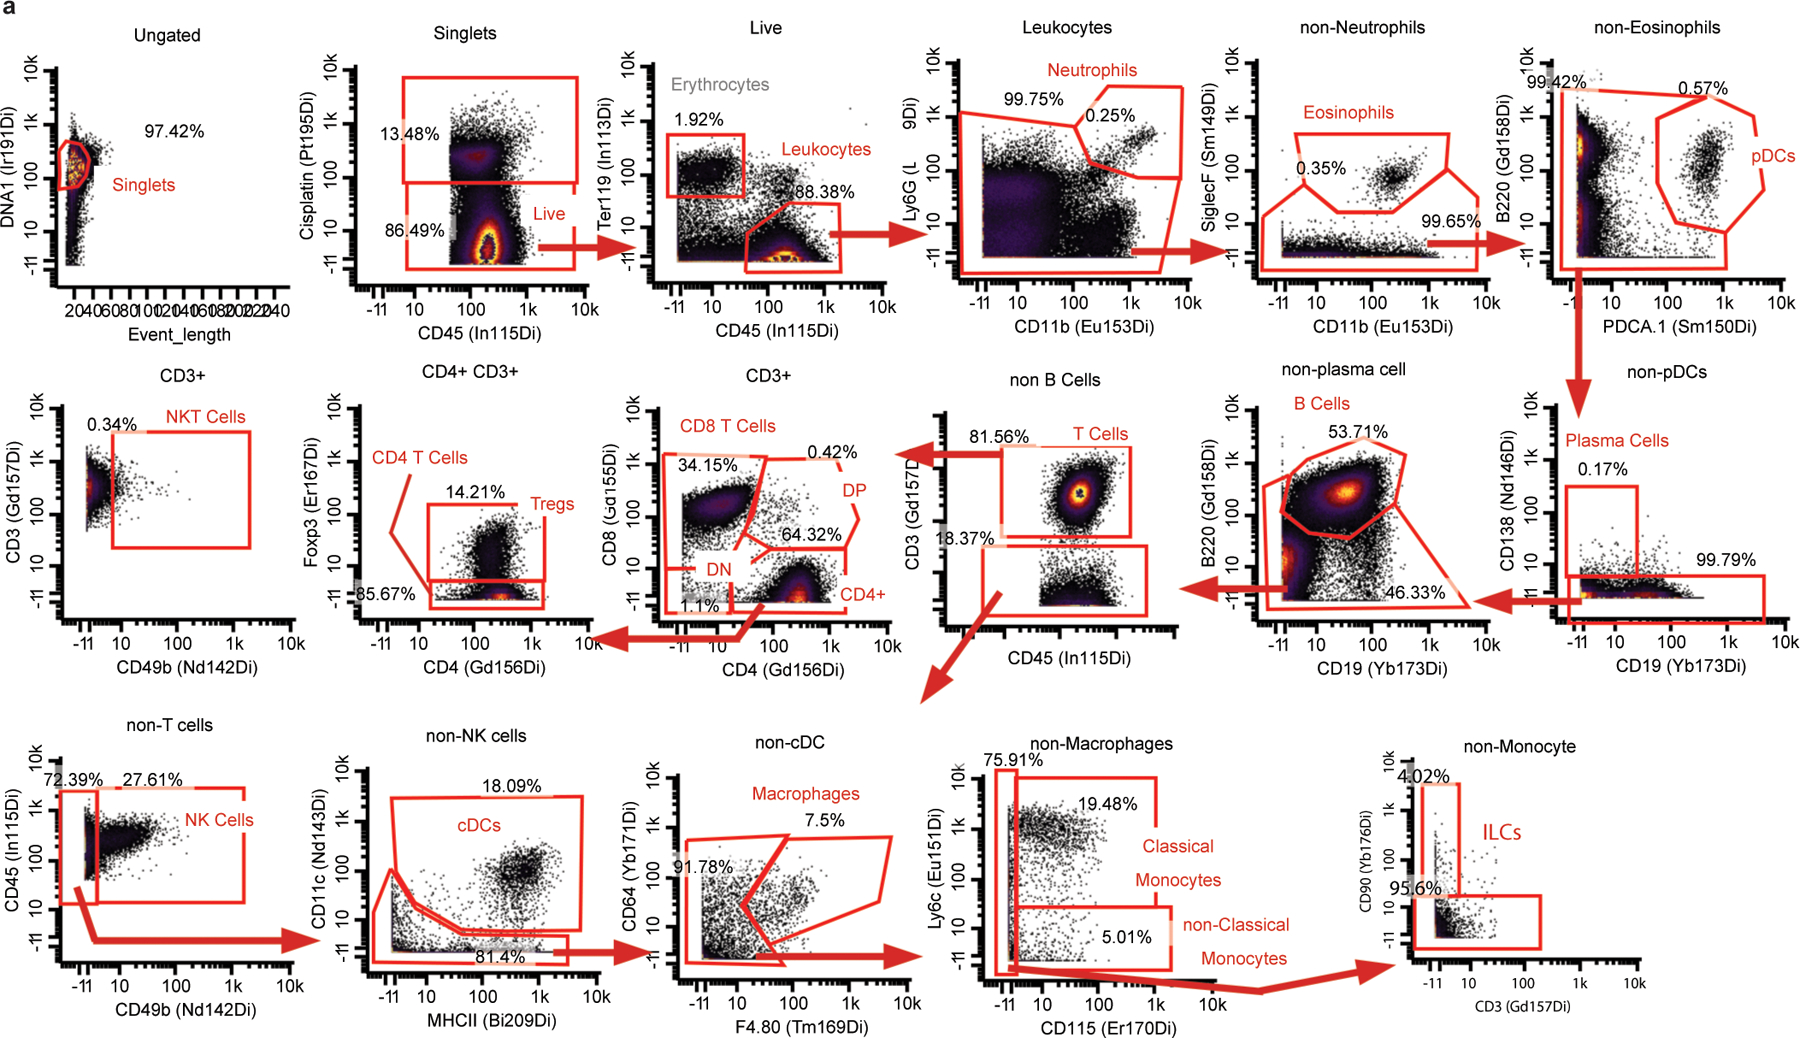
Main Mass Cytometry Gating Scheme. a, Main gating strategy for identifying major immune cell populations from mass cytometry datasets.
Extended Data Fig. 2. Systemic immunity is distinctly remodeled across tumor types.
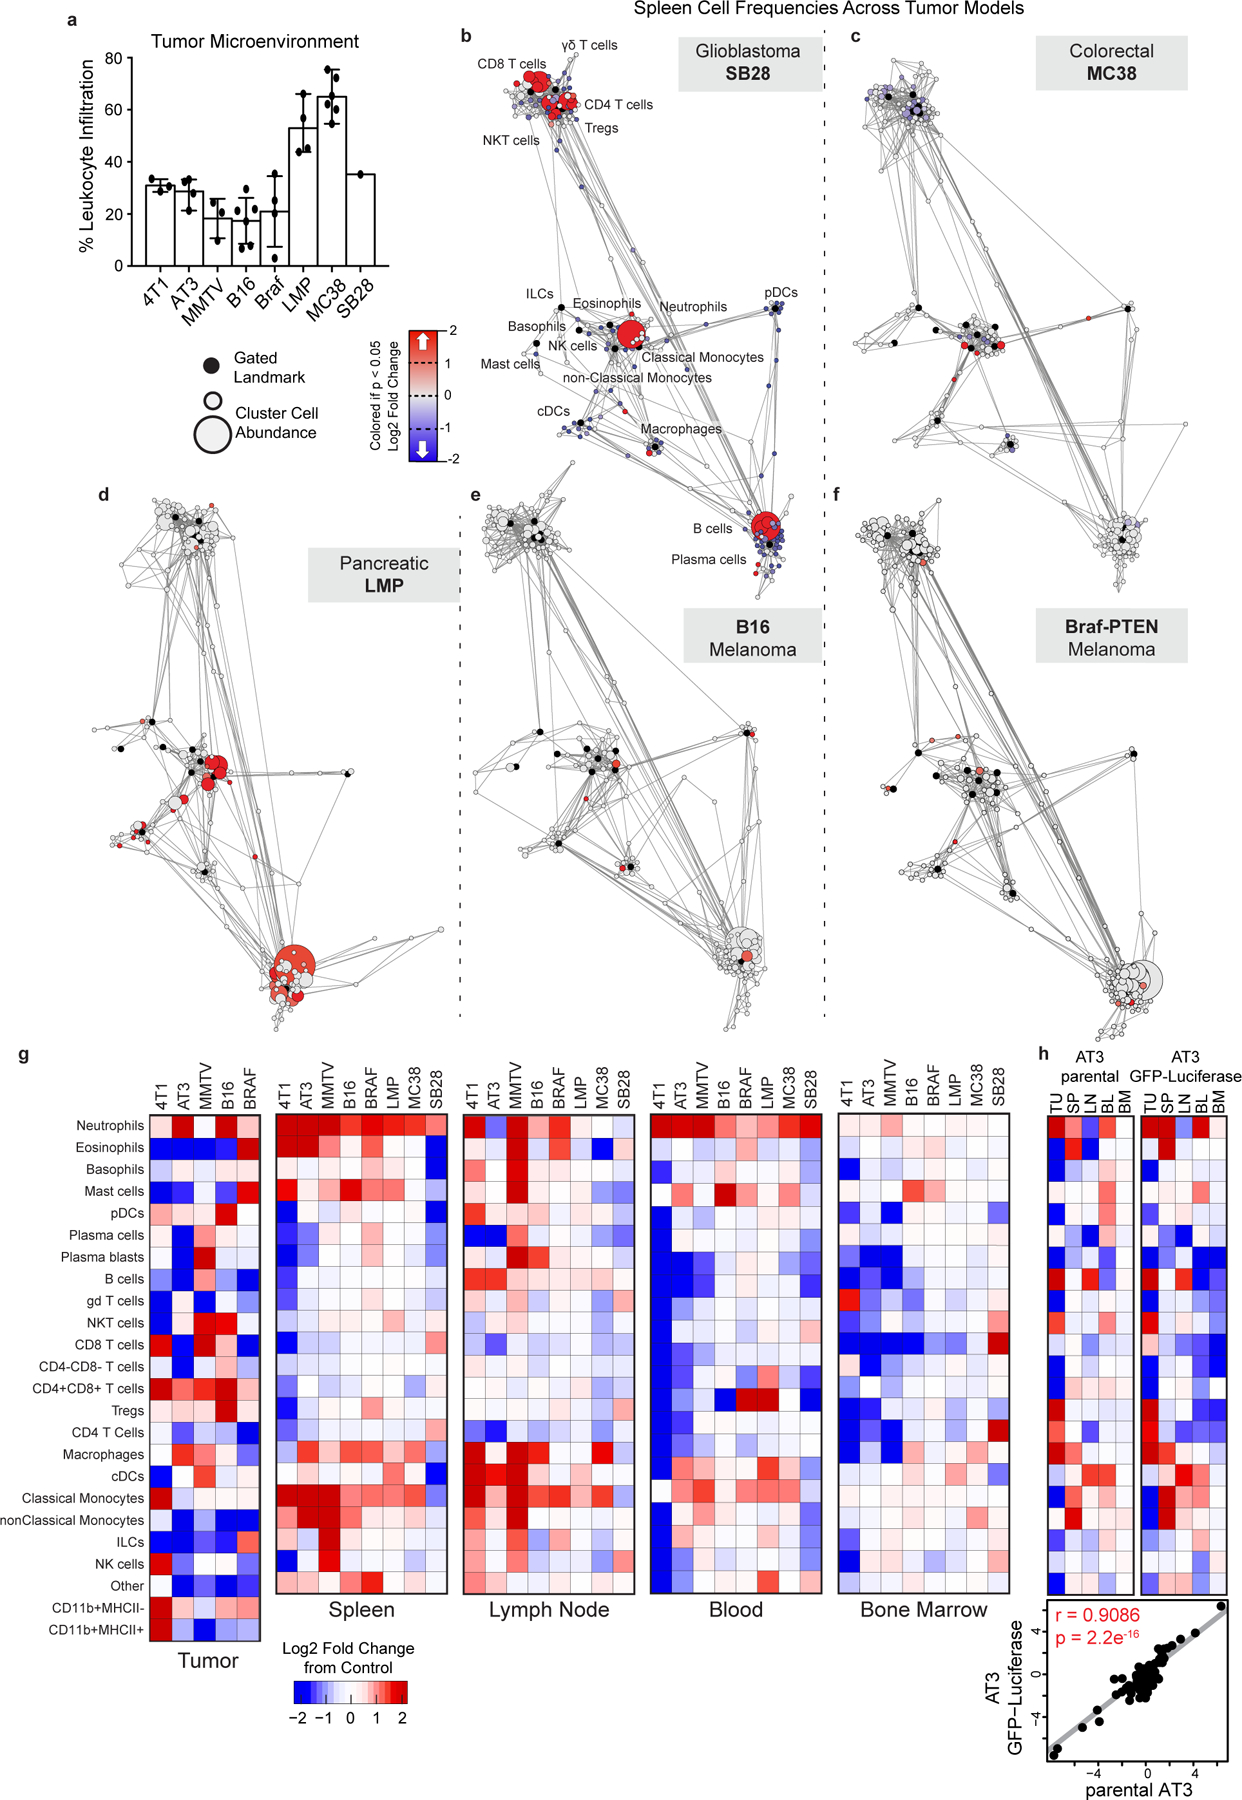
a, Relative abundance of total leukocytes infiltrating the TME across eight tumor models. b-f, Scaffold maps of spleen cell frequencies across five distinct tumor models, SB28 glioblastoma (b), MC38 colorectal (c), LMP pancreatic (d), B16 melanoma (e), and Braf-PTEN melanoma (f), comparing late stage tumor burden to their respective health littermate controls. g, Heatmaps of the log2 adjusted fold change in bulk immune cell frequencies across all five tissues, where relevant, across all models. h, Heatmaps of the log2 adjusted fold change in bulk immune cell frequencies comparing the parental AT3 and engineered AT3 expressing reporters GFP and Luciferase, with cell labels in g. Lower inset shows Pearson’s correlation between these systemic immune features.
Extended Data Fig. 3. Systemic immunity is distinctly remodeled over tumor development.
a, Pearson’s correlation between MMTV-PyMT primary tumor size and change in systemic immune composition, measured as Aitchison distance. b, Degree of systemic immune change by Aitchison distance over tumor growth (left) and after removing the contribution of primary tumor size by linear regression (right). c, Percent of PyMT expressing metastatic cancer cells in the lung (green) and primary draining lymph node (blue). d, Pearson’s correlation between lung or lymph node metastasis and the residual changes in systemic immune composition after regressing out primary tumor burden. e, Heatmap of the log2 adjusted fold change in bulk spleen immune cell frequencies for each 400mm2 tumor-bearing mouse, ranging from 0 to high metastatic disease. f, Pearson’s correlation between tumor mass and absolute number of infiltrating leukocytes in 4T1 breast tumors. g, Spleen immune absolute cell counts, adjusted absolute cell counts per mg of tissue, and unadjusted immune frequencies at each time point for neutrophils, B cells and T cells of the 4T1 breast tumor model. h, PCA of relative immune cell frequencies from each major immune tissue over time in the MMTV-PyMT breast tumor model. Vectors designate progression from control (first point) to 25 mm2, 50mm2, 125mm2, and 400mm2 (last point, arrowhead). i, Scaffold maps of immune cell frequencies in the spleen at each time point of 4T1 tumor burden, colored by log2 fold change in frequency compared to the previous time point.
Extended Data Fig. 4. Immunity is distinctly remodeled by compartment over tumor development.
a-d, Scaffold maps of immune cell frequencies over 4T1 tumor progression in the tumor draining lymph node (a) blood (b), bone marrow (c), and tumor (d), colored by fold change from the previous time point.
Extended Data Fig. 5. Tumor growth shifts the systemic T cell composition across models.
a-b, PCA of T cell cluster frequencies across lymphoid tissues over tumor development for the 4T1 (a) and MMTV-PyMT (b) breast tumor models. Vectors designate directional progression from control (first point) to late stage disease (last point, arrowhead). In a, tumor time points include day 7, 14, 21, and 35 after 4T1 cancer cell transplant. In b, tumor time points include tumor sizes of 25 mm2, 50 mm2, 125 mm2, and 400 mm2. c-e, CD3+ CD11b- leukocytes from all tissues clustered together from healthy and MMTV-PyMT tumor-burdened animals at progressive tumor sizes. c, Heatmap of each T cell cluster frequency, by row, in each site and across the individual 2–3 animals per time point. d, Stacked bar plot of the log2 fold change in cluster frequency between early (25 mm2) and late (400 mm2) disease time points, colored by tissue. e, Heatmap of the protein expression defining each T cell cluster, column normalized to each protein’s maximum positive expression. f-h, Representative scatter plots of key proteins that define T cell clusters changing in frequency in the designated site between early and late disease stage for CD8 T cells (f), Tregs (g), and CD4 T Cells (h).
Extended Data Fig. 6. Tumor growth shifts the systemic mononuclear phagocyte composition.
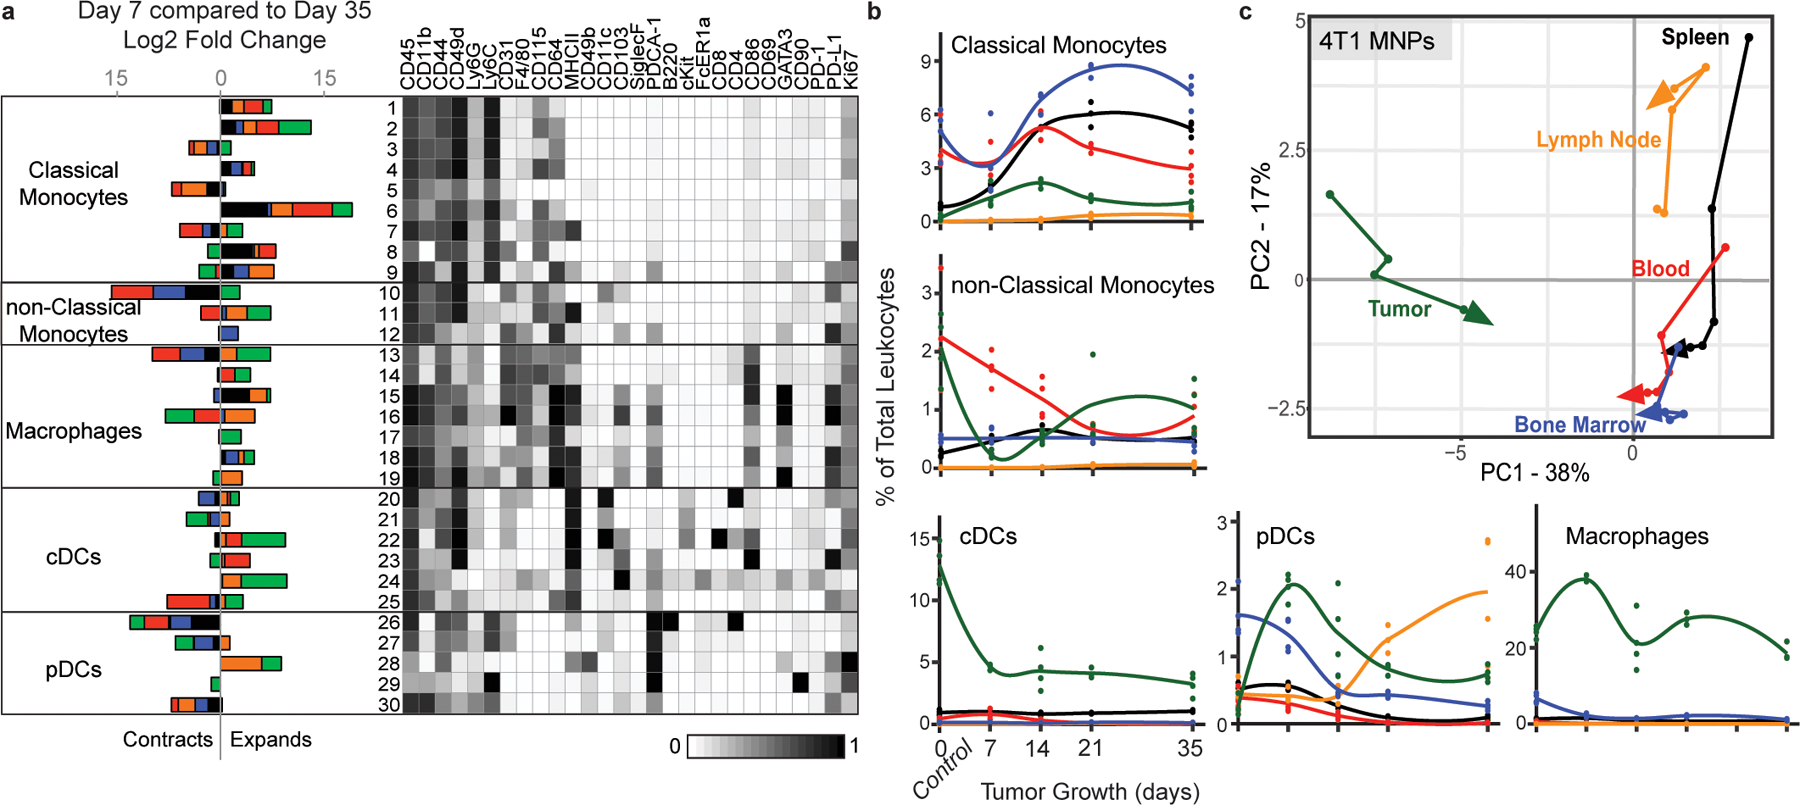
a, CD3- CD19- leukocytes from all tissues clustered together from healthy and 4T1 tumor-burdened animals at progressive time points. Left, stacked bar plot of the log2 fold change in cluster frequency between early (day 7) and late (day 35) times points, colored by tissue. Right, heatmap of the protein expression defining each cluster, column normalized to each protein’s maximum positive expression. b, Curves of the mean cell frequencies over time in the 4T1 breast tumor model from designated mononuclear phagocyte cell types, colored by tissue. c, PCA of the mononuclear phagocyte cell frequencies from each tissue over time in the 4T1 breast tumor model. Vectors designate progression from control (first point) to day 7, 14, 21, and 35 (last point, arrowhead). Coloring of tissues for a-c corresponds to labels in c.
Extended Data Fig. 7. PD-1 and PD-L1 expression is dynamic over tumor growth.
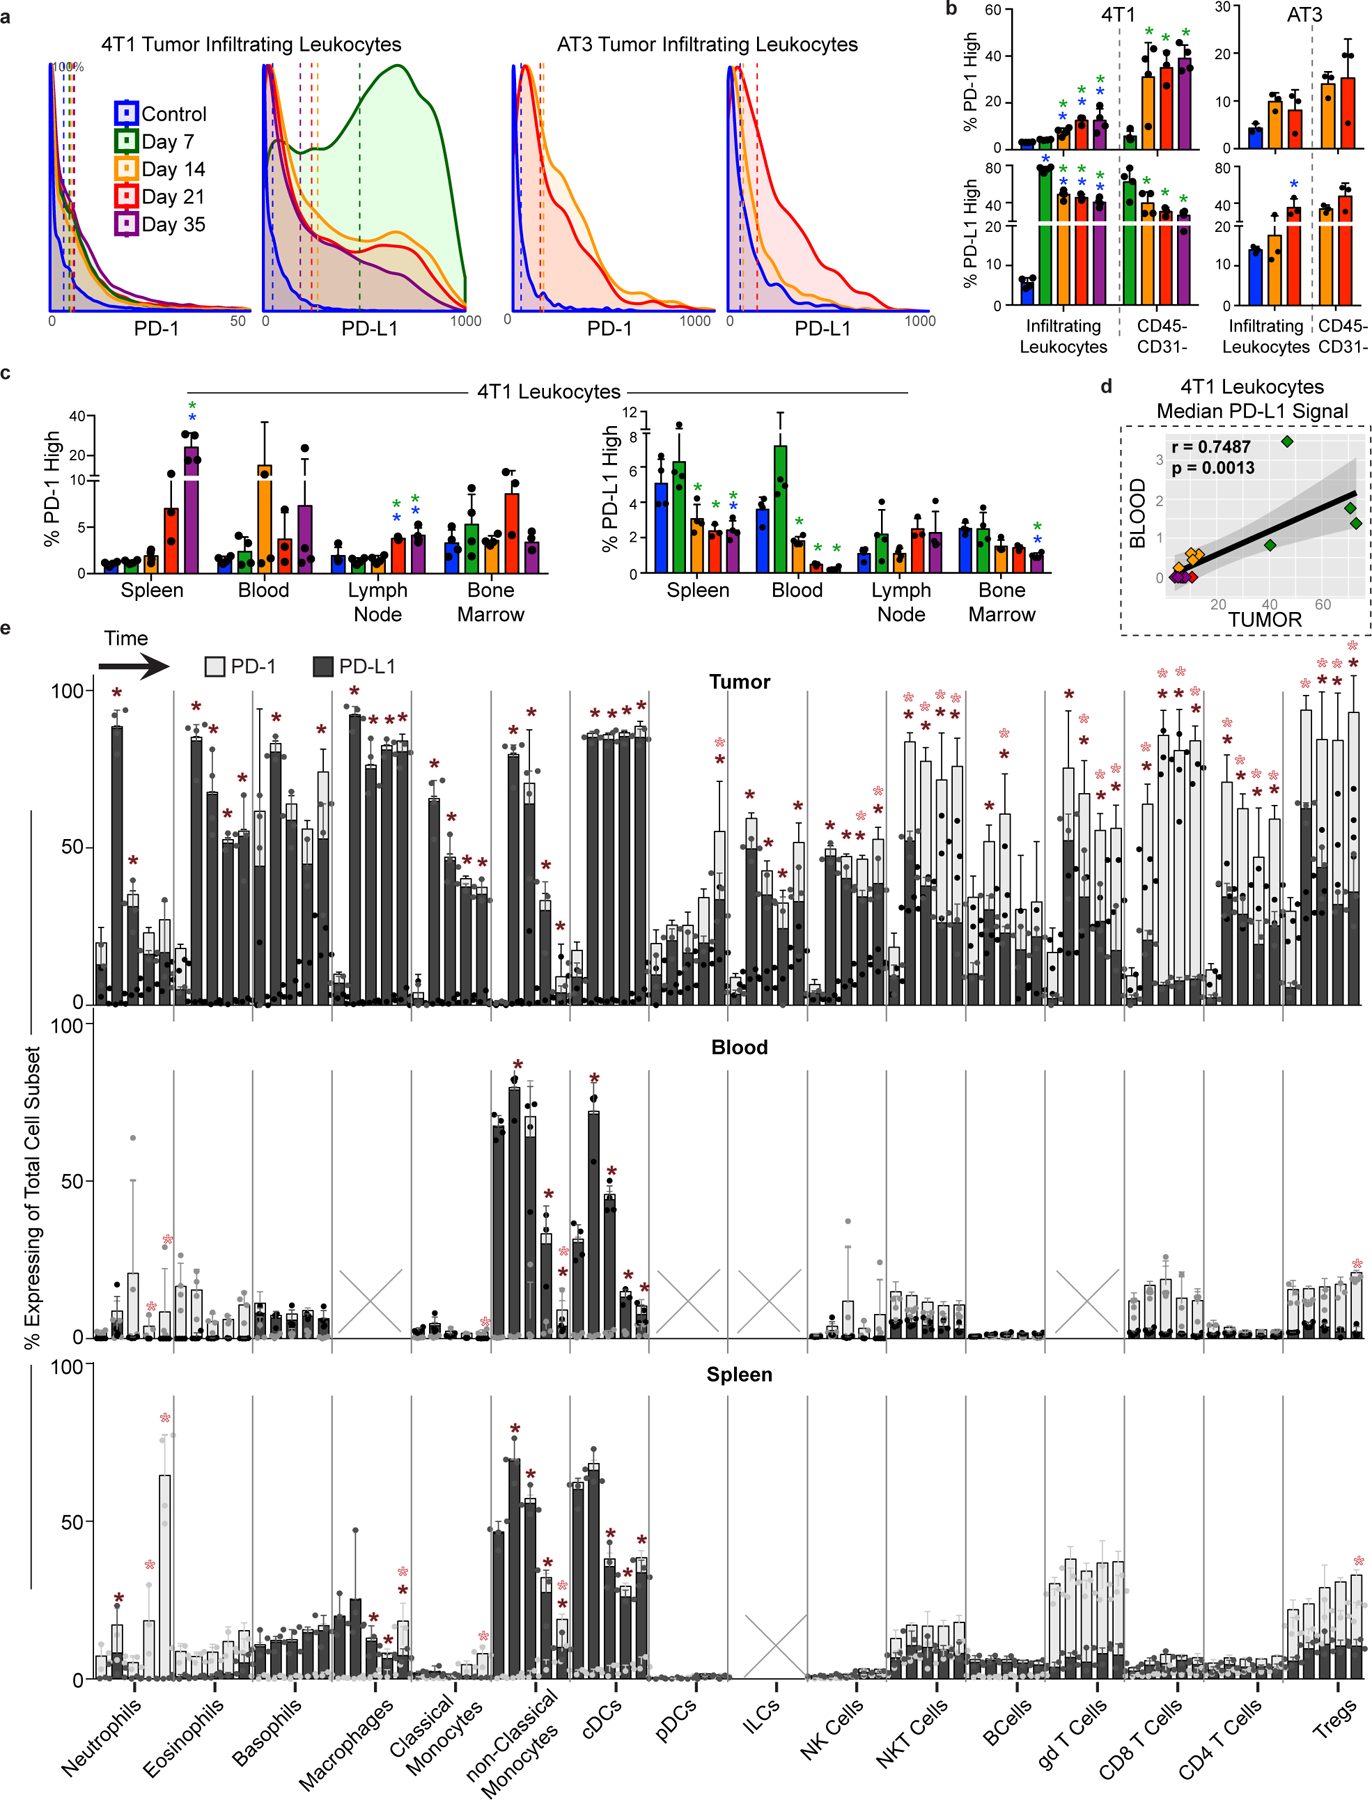
a, Distribution of PD-1 and PD-L1 signal intensities on tumor infiltrating leukocytes over time in the 4T1 or AT3 breast tumor models. Coloring of time points for a-d corresponds to legend in a. b, Percent of total infiltrating leukocytes (left of dashed line) or CD45-, non-endothelial cells (right of dashed line) with high PD-1 or PD-L1 expression in the 4T1 or AT3 tumor models. c, Percent of leukocytes with high PD-1 or PD-L1 expression over time and across tissues, 4T1 model. d, Pearson’s correlation between median PD-L1 signal intensity on blood versus tumor infiltrating leukocytes, 4T1 model. e, Percent of each major immune cell subset expressing high PD-1 or PD-L1 in the tumor, blood, and spleen, identified manually. Cell subsets below 0.2% of total leukocytes were not included, X. Bars ordered by time point, beginning at healthy control. Double positive PD-1/PD-L1 expression was rare and not illustrated. p*< 0.05, One-Way ANOVA, with Tukey correction versus control tissue or healthy mammary fat pad (blue in b-c, fill corresponding to bar color in e), or versus day 7 (green in b-c).
Extended Data Fig. 8. Tumor burden induces organ-specific changes in immune cell cycling.
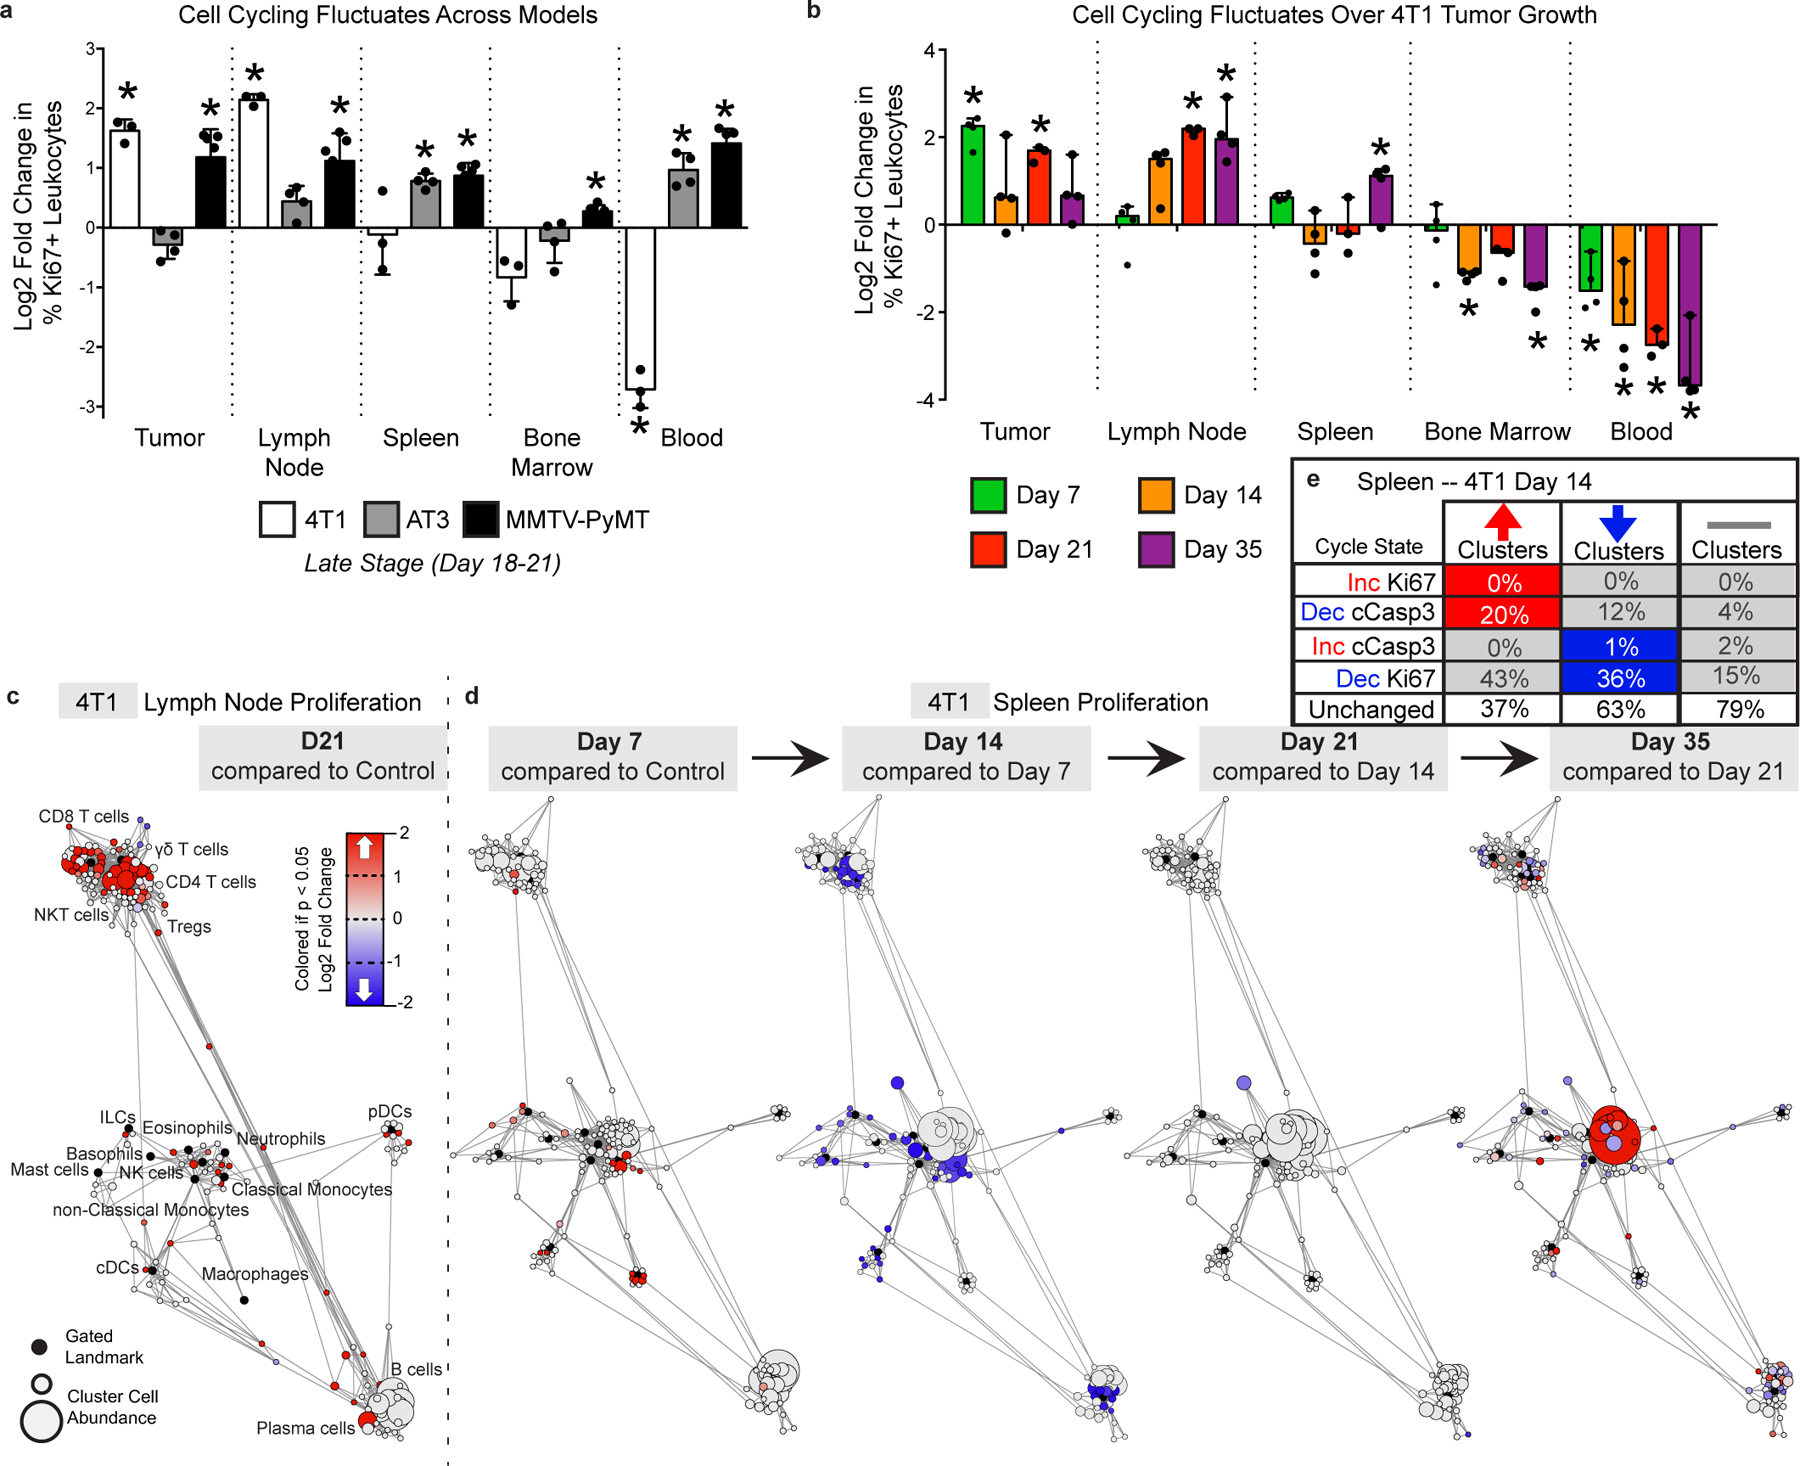
a-b, Log2 fold change in bulk Ki67 expressing leukocytes in each tissue tissues for 4T1, AT3 and MMTV breast tumors (a), and over 4T1 tumor progression (b). p*< 0.05, One-Way ANOVA, with Tukey correction versus control. c-d, Statistical Scaffold maps of Ki67 expression in immune cells of the tumor draining lymph node comparing control to day 21 (c) and the Spleen over time (d) in 4T1 tumor burdened animals. e, Percent of increasing clusters (red, total of 56), decreasing clusters (blue, total of 90), or unchanged cluster that have corresponding changes in cell cycle markers Ki67 and cleaved Caspase-3.
Extended Data Fig. 9. Tumor driven deficits in T cell responses are cell-extrinsic.
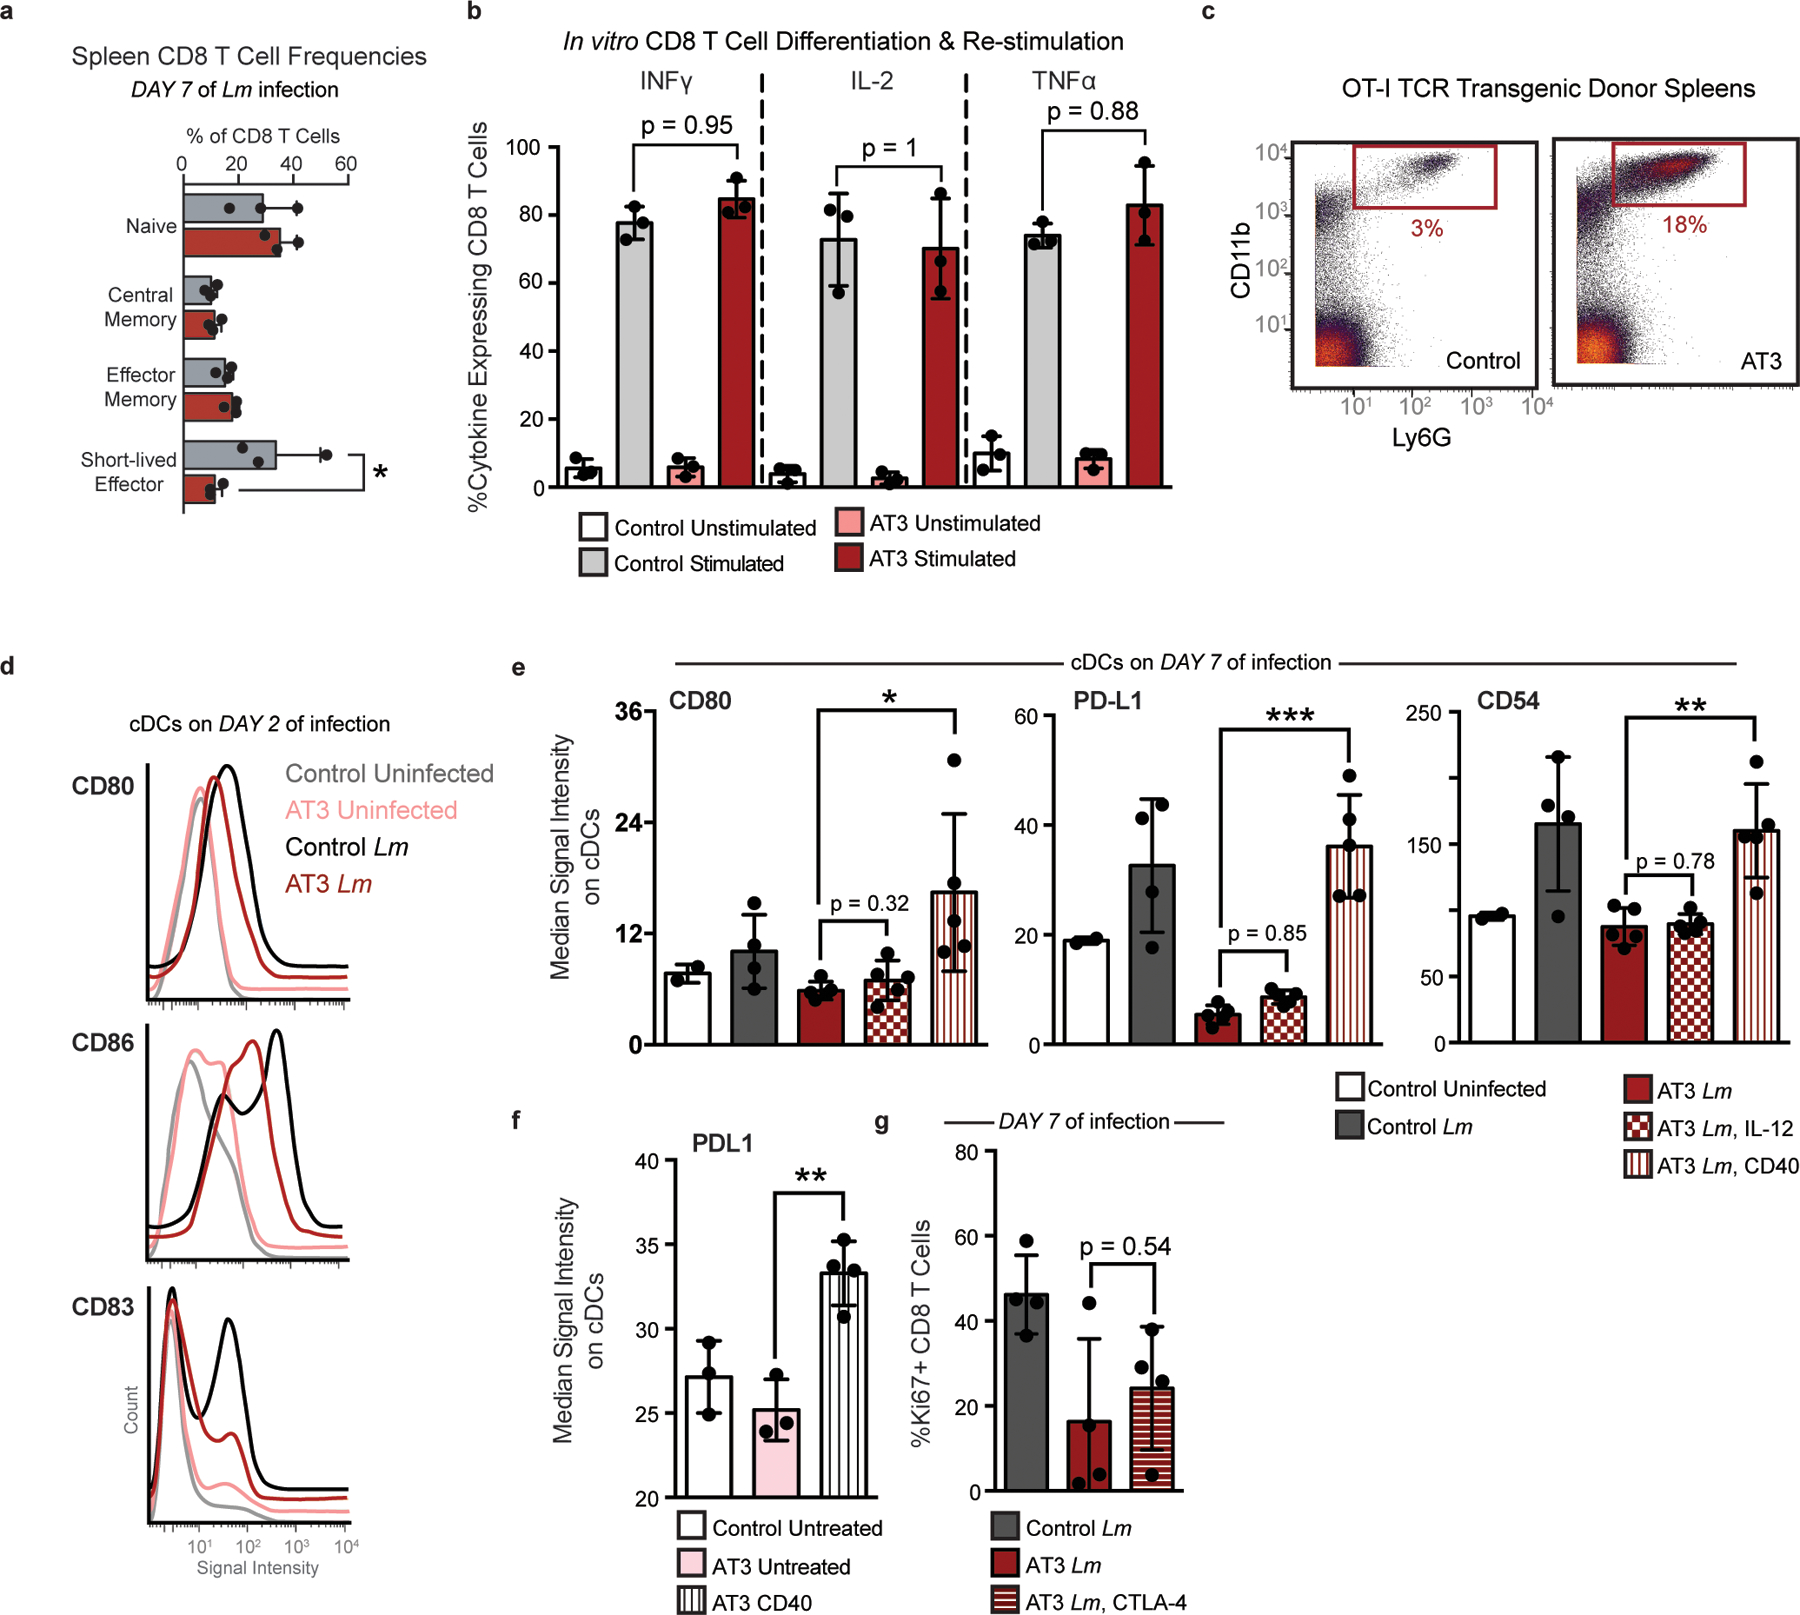
a, Quantification of bulk CD8+ T cell populations in the spleen of healthy or AT3 tumor-burdened mice after 7 days of Lm infection, Two-Way ANOVA with Bonferroni correction. b, Expression of inflammatory cytokines, INFy, IL-2, and TNFa in splenic CD8 T Cells isolated from control or AT3 tumor-burdened mice after in vitro differentiation with CD3, CD28 and IL-2, and re-stimulation with BrefeldinA and PMA Ionomycin. c, Scatter plots of CD11b and Ly6G showing expected neutrophilia in OT-I TCR transgenic mice with AT3 tumor burden. d, Histograms of CD80, CD86, and CD83 signal intensity on cDCs from healthy or AT3 tumor-burdened mice at day 2 of Lm-OVA infection. e, Median signal intensity of CD80, PD-L1 and CD54 activation markers on splenic cDCs from healthy or AT3 tumor-burdened mice compared to IL-12p70 or CD40 treatment at day 7 of Lm-OVA infection. F, Median signal intensity of PD-L1 on splenic cDCs from untreated or CD40 treated AT3 tumor-burdened (day 21) mice. G, Quantification of splenic CD8+ T cell proliferation in healthy, untreated or CTLA-4 treated AT3 tumor-burdened animals in response to 7 days of Lm-OVA infection. p*<0.05, two-tailed t-test.
Extended Data Fig. 10. Tumor resection resets systemic immune organization and function.
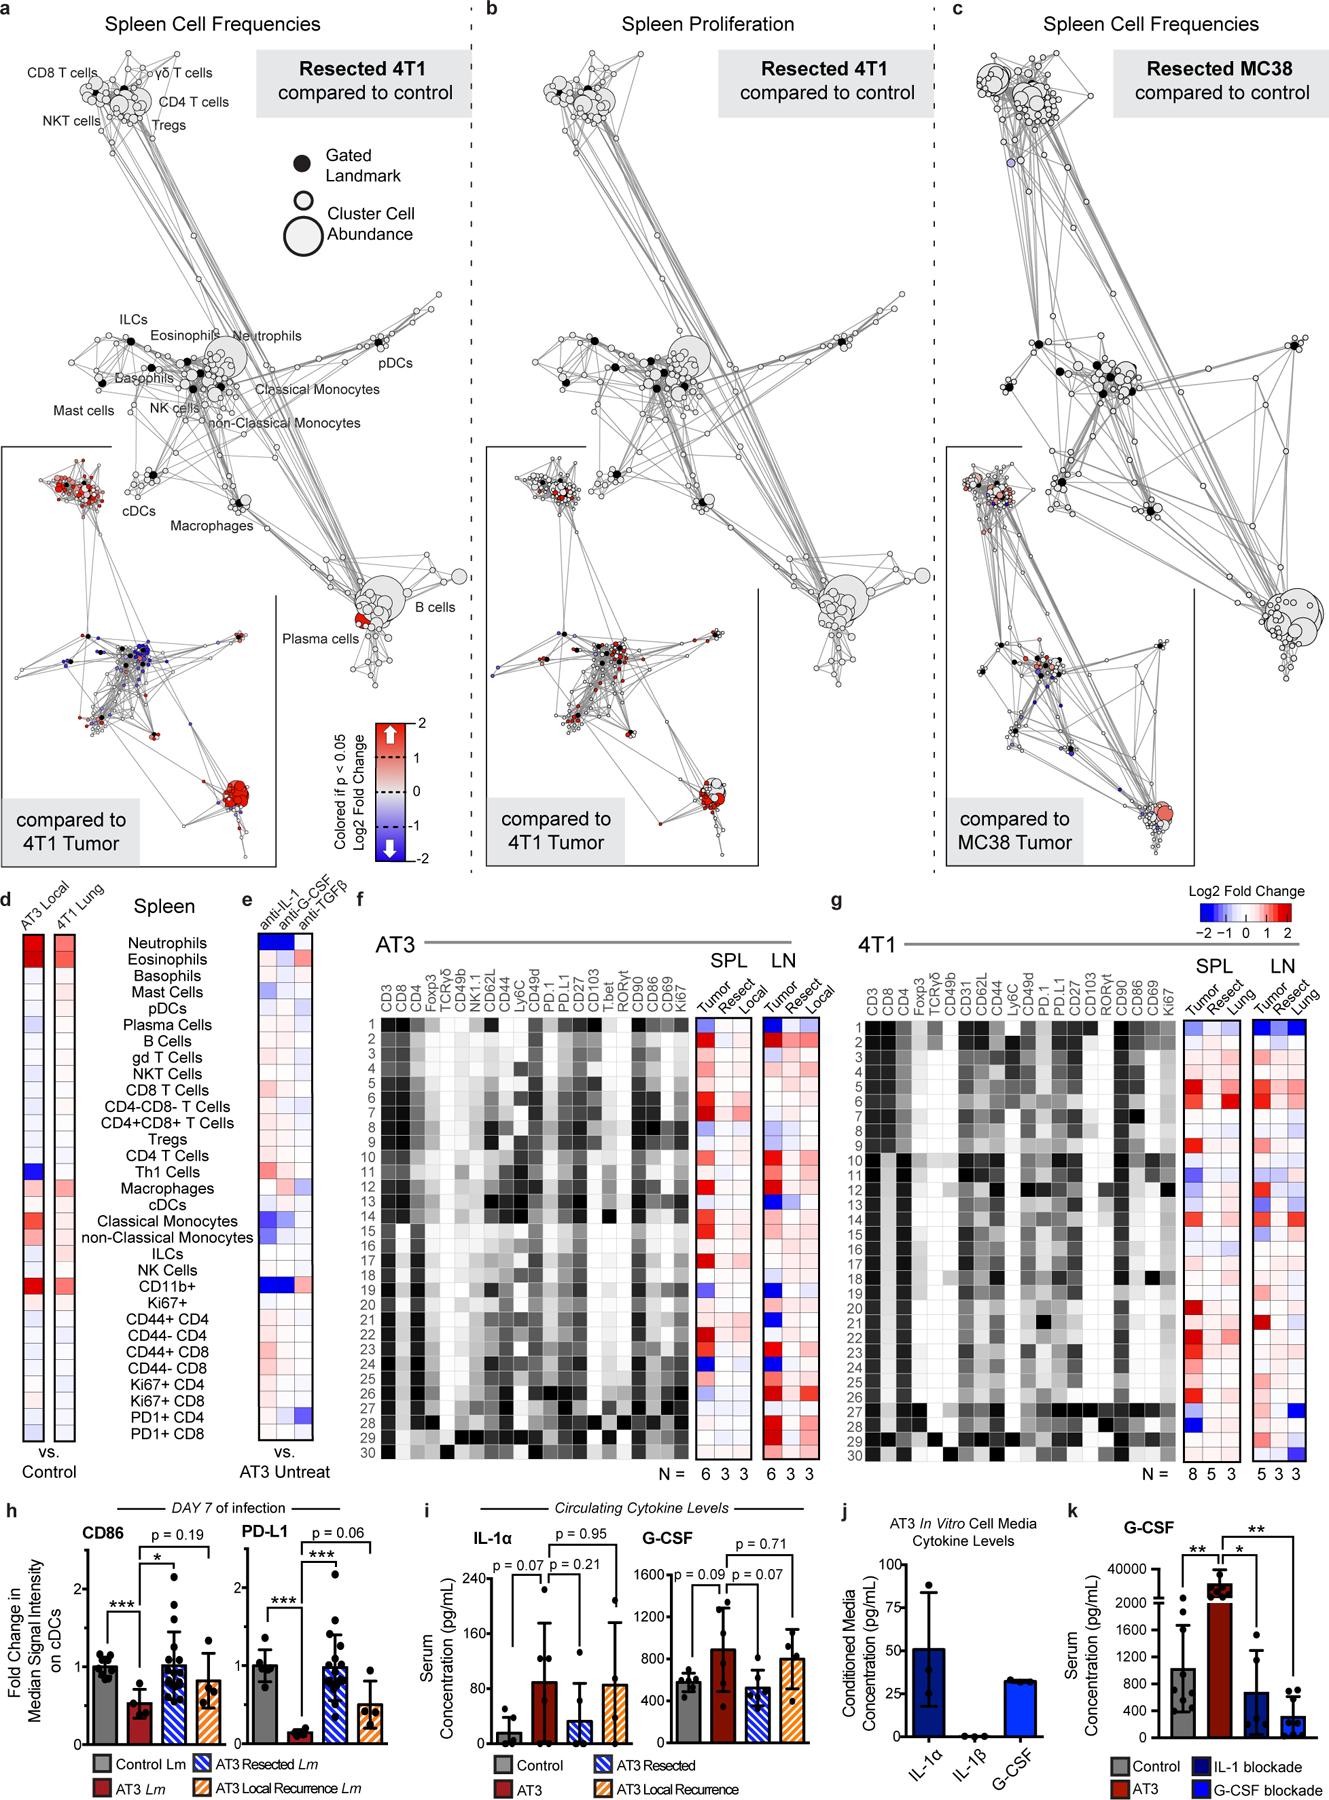
a-c, Statistical scaffold maps of spleen immune cell frequencies (a) and proliferation by Ki67 expression (b) in 4T1 resected mice, and of spleen immune cell frequencies in MC38 resected mice (c) compared to healthy control. Insets show resected mice compared to tumor-burdened mice. d-e, Heatmap of the log2 fold changes in splenic immune cell frequencies for local or lung recurrences from control mice (d), and for IL-1, G-CSF, or TGFβ blockade from untreated AT3 tumor-burdened mice (e). f-g, Heatmaps of T cell cluster expression profiles and log2 fold change from control for AT3 (f) and 4T1 (g) for the spleen and draining lymph node. h, Median signal intensity of CD86 and PD-L1 on splenic cDCs from healthy, AT3 tumor-burdened, resected, or resected mice with local recurrence at day 7 of Lm-OVA infection. i, Concentration of circulating cytokines, IL-1α and G-CSF from healthy, AT3 tumor-burdened, resected, or resected mice with local recurrence. j, Concentration of cytokines, IL-1α, IL-1β and G-CSF from in vitro cell culture media conditioned with AT3 cancer cells. k, Concentration of circulating G-CSF from control or AT3 tumor-bearing mice, or AT3 tumor-bearing mice treated with either IL-1 or G-CSF blocking antibodies. p*<0.05, two-tailed t-test.
Supplementary Material
ACKNOWLEDGMENTS
We thank the UCSF Flow Cytometry Core and Stanley Tamaki for CyTOF maintenance, Drs. Mary Helen Barcellos-Hoff, Ross Levine, Hideho Okada, Edgar Engleman and Jeffrey Bluestone for cell lines, transgenic mice and reagents. We thank Drs. Lewis Lanier, Zena Werb, Mary Helen Barcellos-Hoff, and Lawrence Fong for insightful feedback. This work was supported by NIH grants DP5OD023056 and P50CA097257 (UCSF Brain Tumor SPORE Developmental Research Program), funds from the UCSF Program for Breakthrough Biomedical Research, and investigator funding from the Parker Institute for Cancer Immunotherapy to M.H.S., and by NIH grant S10OD018040, which enabled procurement of the mass cytometer used in this study.
This study makes use of data generated by NOWAC. A full list of investigators who contributed to the generation of the data is available from http://site.uit.no/nowac/. Funding for the project was provided by the European Research Council grant ERC-2008-AdG 232997. The NOWAC group is not responsible for the analysis or interpretation of the data presented.
M.H.S. receives research funding from Roche/Genentech, Bristol-Myers Squibb and Valitor Inc. and has been a paid consultant for Five Prime Therapeutics, Ono Pharmaceutical, and January Inc.
REFERENCES
- 1.Philip M et al. Chromatin states define tumour-specific T cell dysfunction and reprogramming. Nature 545, 452–456 (2017). [DOI] [PMC free article] [PubMed] [Google Scholar]
- 2.Spitzer MH et al. Systemic Immunity Is Required for Effective Cancer Immunotherapy. Cell 168, 487–502.e15 (2017). [DOI] [PMC free article] [PubMed] [Google Scholar]
- 3.Fransen MF et al. Tumor-draining lymph nodes are pivotal in PD-1/PD-L1 checkpoint therapy. JCI Insight 3, 1–7 (2018). [DOI] [PMC free article] [PubMed] [Google Scholar]
- 4.Tang H et al. PD-L1 on host cells is essential for PD-L1 blockade-mediated tumor regression. J Clin Invest 128, 580–588 (2018). [DOI] [PMC free article] [PubMed] [Google Scholar]
- 5.Chamoto K et al. Mitochondrial activation chemicals synergize with surface receptor PD-1 blockade for T cell-dependent antitumor activity. PNAS 114, E761–E770 (2017). [DOI] [PMC free article] [PubMed] [Google Scholar]
- 6.Mathios D et al. Anti-PD-1 antitumor immunity is enhanced by local and abrogated by systemic chemotherapy in GBM. Sci. Transl. Med 8, 370ra180–370ra180 (2016). [DOI] [PMC free article] [PubMed] [Google Scholar]
- 7.Lin H et al. Host expression of PD-L1 determines efficacy of PD-L1 pathway blockade-mediated tumor regression. J. Clin. Invest 128, 805–815 (2018). [DOI] [PMC free article] [PubMed] [Google Scholar]
- 8.Curiel TJ et al. Blockade of B7-H1 improves myeloid dendritic cell-mediated antitumor immunity. Nat. Med 9, 562–567 (2003). [DOI] [PubMed] [Google Scholar]
- 9.Yost KE et al. Clonal replacement of tumor-specific T cells following PD-1 blockade. Nat. Med 25, 1251–1259 (2019). [DOI] [PMC free article] [PubMed] [Google Scholar]
- 10.McAllister SS & Weinberg RA The tumour-induced systemic environment as a critical regulator of cancer progression and metastasis. Nat. Cell Biol 16, 717–727 (2014). [DOI] [PMC free article] [PubMed] [Google Scholar]
- 11.Zhang S et al. The Role of Myeloid-Derived Suppressor Cells in Patients with Solid Tumors: A Meta-Analysis. PLoS One 11, e0164514 (2016). [DOI] [PMC free article] [PubMed] [Google Scholar]
- 12.Casbon A-J et al. Invasive breast cancer reprograms early myeloid differentiation in the bone marrow to generate immunosuppressive neutrophils. Proc. Natl. Acad. Sci. U. S. A 112, E566–75 (2015). [DOI] [PMC free article] [PubMed] [Google Scholar]
- 13.Meyer MA et al. Breast and pancreatic cancer interrupt IRF8-dependent dendritic cell development to overcome immune surveillance. Nat. Commun 9, 1–19 (2018). [DOI] [PMC free article] [PubMed] [Google Scholar]
- 14.Barnstorf I et al. Chronic virus infection compromises memory bystander T cell function in an IL-6/ STAT1-dependent manner. J. Exp. Med 216, 571–586 (2019). [DOI] [PMC free article] [PubMed] [Google Scholar]
- 15.Snell LM et al. CD8 + T Cell Priming in Established Chronic Viral Infection Preferentially Directs Differentiation of Memory-like Cells for Sustained Immunity. Immunity 49, (2018). [DOI] [PMC free article] [PubMed] [Google Scholar]
- 16.Osborne LC et al. Virus-helminth coinfection reveals a microbiota-independent mechanism of immunomodulation. Science. 345, 578–582 (2014). [DOI] [PMC free article] [PubMed] [Google Scholar]
- 17.Danna EA et al. Surgical Removal of Primary Tumor Reverses Tumor-Induced Immunosuppression Despite the Presence of Metastatic Disease. Cancer Res. 64, 2205–2211 (2004). [DOI] [PubMed] [Google Scholar]
- 18.Ghochikyan A et al. Primary 4T1 tumor resection provides critical “window of opportunity” for immunotherapy. Clin Exp Metastasis 31, 185–198 (2014). [DOI] [PMC free article] [PubMed] [Google Scholar]
- 19.Mosely SIS et al. Rational Selection of Syngeneic Preclinical Tumor Models for Immunotherapeutic Drug Discovery. Cancer Immunol Res 5, 29–41 (2017). [DOI] [PubMed] [Google Scholar]
- 20.Westcott PMK et al. The mutational landscapes of genetic and chemical models of Kras-driven lung cancer. Nature 517, 489–492 (2015). [DOI] [PMC free article] [PubMed] [Google Scholar]
- 21.Zeitouni B et al. Abstract 1840: Whole-exome somatic mutation analysis of mouse cancer models and implications for preclinical immunomodulatory drug development. in Proceedings of the 107th Annual Meeting of the American Association for Cancer Research (2017). doi: 10.1158/1538-7445.AM2017-1840. [DOI] [Google Scholar]
- 22.Heinzel FP, Sadick MD, Holaday BJ, Coffman RL & Locksley RM Reciprocal expression of interferon gamma or interleukin 4 during the resolution or progression of murine leishmaniasis. Evidence for expansion of distinct helper T cell subsets. J. Exp. Med 169, 59–72 (1989). [DOI] [PMC free article] [PubMed] [Google Scholar]
- 23.Kather JN et al. Topography of cancer-associated immune cells in human solid tumors. Elife 7, (2018). [DOI] [PMC free article] [PubMed] [Google Scholar]
- 24.Spitzer MH et al. An interactive reference framework for modeling a dynamic immune system. Science. 349, 1259425 (2015). [DOI] [PMC free article] [PubMed] [Google Scholar]
- 25.Anz D et al. CD103 is a hallmark of tumor-infiltrating regulatory T cells. Int. J. Cancer 129, 2417–2426 (2011). [DOI] [PubMed] [Google Scholar]
- 26.Ross EA et al. CD31 is required on CD4 + T cells to promote T cell survival during Salmonella infection. J. Immunol 187, 1553–1565 (2011). [DOI] [PMC free article] [PubMed] [Google Scholar]
- 27.Hänninen A, Maksimow M, Alam C, Morgan DJ & Jalkanen S Ly6C supports preferential homing of central memory CD8+ T cells into lymph nodes. Eur. J. Immunol 41, 634–644 (2011). [DOI] [PubMed] [Google Scholar]
- 28.Fourcade J et al. Upregulation of Tim-3 and PD-1 expression is associated with tumor antigen-specific CD8+ T cell dysfunction in melanoma patients. J. Exp. Med 207, 2175–2186 (2010). [DOI] [PMC free article] [PubMed] [Google Scholar]
- 29.Mita Y et al. Crucial role of CD69 in anti-tumor immunity through regulating the exhaustion of tumor-infiltrating T cells. Int. Immunol 30, 559–567 (2018). [DOI] [PubMed] [Google Scholar]
- 30.Sun C, Mezzadra R & Schumacher TN Regulation and Function of the PD-L1 Checkpoint. Immunity 48, 434–452 (2018). [DOI] [PMC free article] [PubMed] [Google Scholar]
- 31.Bianchini M et al. PD-L1 expression on nonclassical monocytes reveals their origin and immunoregulatory function. Sci. Immunol 4, eaar3054 (2019). [DOI] [PubMed] [Google Scholar]
- 32.Busch DH, Pilip IM, Vijh S & Pamer EG Coordinate regulation of complex T cell populations responding to bacterial infection. Immunity 8, 353–362 (1998). [DOI] [PubMed] [Google Scholar]
- 33.Kaech SM & Ahmed R Memory CD8 + T cell differentiation: initial antigen encounter triggers a developmental program in naïve cells. Nat. Immunol 2, 415–422 (2001). [DOI] [PMC free article] [PubMed] [Google Scholar]
- 34.Herndler-Brandstetter D et al. KLRG1+ Effector CD8+ T Cells Lose KLRG1, Differentiate into All Memory T Cell Lineages, and Convey Enhanced Protective Immunity. Immunity 48, 716–729 (2018). [DOI] [PMC free article] [PubMed] [Google Scholar]
- 35.Jung S et al. In vivo depletion of CD11c+ dendritic cells abrogates priming of CD8+ T cells by exogenous cell-associated antigens. Immunity 17, 211–220 (2002). [DOI] [PMC free article] [PubMed] [Google Scholar]
- 36.Gabrilovich DI, Corak J, Ciernik IF, Kavanaugh D & Carbone DP Decreased antigen presentation by dendritic cells in patients with breast cancer. Clin. Cancer Res 3, 483–490 (1997). [PubMed] [Google Scholar]
- 37.Coffelt SB et al. IL-17-producing γδ T cells and neutrophils conspire to promote breast cancer metastasis. Nature 522, 345–8 (2015). [DOI] [PMC free article] [PubMed] [Google Scholar]
- 38.Wu W-C et al. Circulating hematopoietic stem and progenitor cells are myeloid-biased in cancer patients. Proc. Natl. Acad. Sci 111, 4221–4226 (2014). [DOI] [PMC free article] [PubMed] [Google Scholar]
- 39.Apte RN et al. Effects of micro-environment- and malignant cell-derived interleukin-1 in carcinogenesis, tumour invasiveness and tumour-host interactions. Eur. J. Cancer 42, 751–759 (2006). [DOI] [PubMed] [Google Scholar]
- 40.Wu TC et al. IL1 receptor antagonist controls transcriptional signature of inflammation in patients with metastatic breast cancer. Cancer Res. 78, 5243–5258 (2018). [DOI] [PMC free article] [PubMed] [Google Scholar]
- 41.Singer CF et al. Interleukin-1alpha protein secretion in breast cancer is associated with poor differentiation and estrogen receptor alpha negativity. Int. J. Gynecol. Cancer 16, 556–559 (2006). [DOI] [PubMed] [Google Scholar]
- 42.Pickup M, Novitskiy S & Moses HL The roles of TGFβ in the tumour microenvironment. Nat. Rev. Cancer 13, 788–799 (2013). [DOI] [PMC free article] [PubMed] [Google Scholar]
- 43.Mariathasan S et al. TGFβ attenuates tumour response to PD-L1 blockade by contributing to exclusion of T cells. Nature 554, 544–548 (2018). [DOI] [PMC free article] [PubMed] [Google Scholar]
- 44.Suzuki A et al. IL-1 production as a regulator of G-CSF and IL-6 production in CSF-producing cell lines. Br. J. Cancer 65, 515–518 (1992). [DOI] [PMC free article] [PubMed] [Google Scholar]
- 45.Mittal R, Wagener M, Breed ER, Liang Z & Yoseph BP Phenotypic T Cell Exhaustion in a Murine Model of Bacterial Infection in the Setting of Pre-Existing Malignancy. PLoS One 9, 93523 (2014). [DOI] [PMC free article] [PubMed] [Google Scholar]
- 46.Xie J et al. Pre-existing malignancy results in increased prevalence of distinct populations of CD4+ T cells during sepsis. PLoS One 13, e0191065 (2018). [DOI] [PMC free article] [PubMed] [Google Scholar]
- 47.Russ AJ et al. Melanoma-induced suppression of tumor antigen-specific T cell expansion is comparable to suppression of global T cell expansion. Cell. Immunol 271, 104–109 (2011). [DOI] [PMC free article] [PubMed] [Google Scholar]
- 48.Klastersky J & Aoun M Opportunistic infections in patients with cancer. Ann. Oncol 15, iv329–iv335 (2004). [DOI] [PubMed] [Google Scholar]
- 49.Baluch A & Pasikhova Y Influenza Vaccination in Oncology Patients. Curr Infect Dis Rep 15, 486–490 (2013). [DOI] [PubMed] [Google Scholar]
- 50.O’Hara MH et al. Abstract CT004: A Phase Ib study of CD40 agonistic monoclonal antibody APX005M together with gemcitabine (Gem) and nab-paclitaxel (NP) with or without nivolumab (Nivo) in untreated metastatic ductal pancreatic adenocarcinoma (PDAC) patients. Clin. Trials (2019) doi: 10.1158/1538-7445.am2019-ct004. [DOI] [Google Scholar]
- 51.Zuckerman NS et al. Altered local and systemic immune profiles underlie lymph node metastasis in breast cancer patients. Int. J. Cancer 132, 2537–2547 (2012). [DOI] [PMC free article] [PubMed] [Google Scholar]
- 52.Wang L et al. Connecting blood and intratumoral Treg cell activity in predicting future relapse in breast cancer. Nat. Immunol 20, 1220–1230 (2019). [DOI] [PMC free article] [PubMed] [Google Scholar]
- 53.Kosaka A, Ohkuri T, Program BT & Okada H Combination of an agonistic anti-CD40 monoclonal antibody and the COX-2 inhibitor celecoxib induces anti-glioma effects by promotion of type-1 immunity in myeloid cells and T-cells. Cancer Immunol Immunother 63, 847–857 (2014). [DOI] [PMC free article] [PubMed] [Google Scholar]
- 54.Tseng WW et al. Development of an orthotopic model of invasive pancreatic cancer in an immunocompetent murine host. Clin. Cancer Res 16, 3684–3695 (2010). [DOI] [PMC free article] [PubMed] [Google Scholar]
- 55.Foulds Kathryn E., Zenewicz Lauren A., Shedlock Devon J., J. J. & Troy Amy E., and H. S. Cutting Edge: CD4 and CD8 T Cells Are Intrinsically Different in Their Proliferative Responses. J Immunol 168, 1528–1532 (2002). [DOI] [PubMed] [Google Scholar]
- 56.Zunder ER et al. Palladium-based Mass-Tag Cell Barcoding with a Doublet-Filtering Scheme and Single Cell Deconvolution Algorithm. Nat. Protoc 10, 316–333 (2015). [DOI] [PMC free article] [PubMed] [Google Scholar]
- 57.Finck R et al. Normalization of mass cytometry data with bead standards. Cytom. Part A 83 A, 483–494 (2013). [DOI] [PMC free article] [PubMed] [Google Scholar]
- 58.Bair E & Tibshirani R Semi-Supervised Methods to Predict Patient Survival from Gene Expression Data. PLoS Biol. 2, 0511–0522 (2004). [DOI] [PMC free article] [PubMed] [Google Scholar]
- 59.Dumeaux V et al. Interactions between the tumor and the blood systemic response of breast cancer patients. PLoS Comput. Biol 13, (2017). [DOI] [PMC free article] [PubMed] [Google Scholar]
- 60.Aran D, Hu Z & Butte AJ xCell: digitally portraying the tissue cellular heterogeneity landscape. Genome Biol. 18, 1–14 (2017). [DOI] [PMC free article] [PubMed] [Google Scholar]
Associated Data
This section collects any data citations, data availability statements, or supplementary materials included in this article.
Supplementary Materials
Data Availability Statement
All mass cytometry data are publicly available at https://premium.cytobank.org/cytobank/projects/2433/ or by request to the senior author without restrictions.