

Abstract
Background:
Globally, age-standardized incidence rates for most cancers at shared sites are substantially and consistently higher in men than in women. Differences in established risk factors are unable to account for much of the sex disparity. We hypothesized that variability in height may be important in explaining sex differences in cancer risk.
Patients and methods:
We included 49 372 men from the Health Professionals Follow-up Study (1986–2014) and 115 612 women from the Nurses’ Health Study (1980–2014). Height was reported at baseline and biennial questionnaires were used to collect information on cancer risk factors. We examined the association between sex and cancer incidence at shared anatomic sites using Cox proportional hazards models and performed mediation analysis to determine the percent of the association that was accounted for by height.
Results:
Over up to 34 years of follow-up, 21 307 incident cases of cancers at shared sites (7705 men, 13 602 women) were documented. After adjusting for major cancer risk factors, men had a 39% increased risk of shared cancers overall (hazard ratio = 1.39; 95% confidence interval = 1.33–1.45) of which 35% (95% confidence interval 24–46) was mediated by height. The excess risk of cancer for men was also partially explained by height for several specific cancers (gastrointestinal, melanoma, kidney, brain, hematologic). Mediation by height tended to be stronger among never smokers or those who adhered to a healthy lifestyle, and for cancers with fewer known environmental risk factors.
Conclusions:
Differences in height among men and women partially mediated the association between sex and cancer incidence at several shared sites. Hence, mechanisms underlying the relationship between height and cancer may be important determinants of sex disparities in cancer incidence.
Keywords: cohort study, height, mediation, sex
INTRODUCTION
Incidence rates for most cancers are higher in men than in women.1,2 The most recent data (2011–2015) from the National Cancer Institute’s Surveillance, Epidemiology, and End Results program showed a male-to-female incidence rate ratio of 1.18 for total cancer (age standardized rates per 100 000 population: 494.8 for men and 419.3 for women).3 A similar sex disparity has been reported in other countries, highlighted by a study using data from the International Agency for Research on Cancer’s Cancer Incidence in Five Continents which found higher cancer incidence in men than women for 32 of 35 anatomical sites.4 For 13 of these sites, the sex disparity was considered entirely unexplained by known risk factors such as smoking and alcohol, indicating that much of the difference remains enigmatic.4
Differences in height between men and women may be able to explain some of the discrepancy. Taller stature is consistently associated with an increased risk of many cancers in large population-based studies, for both sexes and across different ethnicities.5–8 A meta-analysis of prospective studies showed a 14% higher risk for total cancer per 10 cm increase in height.9 And a study of nearly 23 million South Koreans reported a positive association between height and risk of cancer at all anatomic sites other than esophagus.10 Although the mechanisms remain to be fully elucidated, height may serve as a proxy for the overall number of stem cells11 as well as hormonal and growth factor exposures,12,13 and thus influence both the number of cells at risk of acquiring somatic mutations and the rate of tumor proliferation.
Few studies have used body size to understand sex disparities in cancer risk and only one study to date has specifically evaluated height,14 showing that nearly half of the excess risk of cancer at shared sites overall was explained by height after adjusting for other risk factors. However, that study had limited statistical power for site-specific analyses. Therefore, we investigated the extent to which height mediates sex differences in cancer incidence using two large cohort studies of US men and women with up to 34 years of follow-up and extensive covariate data to allow for detailed adjustment for confounding by cancer risk factors that may differ between the sexes.
MATERIALS AND METHODS
Study population
We used data from two ongoing US prospective cohort studies: the Health Professionals Follow-up Study (HPFS) and the Nurses’ Health Study (NHS). The HPFS enrolled 51 529 male health professionals aged 40–75 in 1986, and the NHS enrolled 121 700 female registered nurses aged 30–55 in 1976. For both cohorts, participants returned mailed questionnaires at enrollment and every 2 years to provide data on demographics, lifestyle factors, medical history, and disease outcomes. Dietary intake was assessed every 4 years using a validated food frequency questionnaire. Follow-up rates for both cohorts have exceeded 90%.
For the current study, we used as baseline 1986 for HPFS and 1980 for NHS, when detailed lifestyle and medication data were first collected. We excluded participants with diagnosis of any cancer other than nonmelanoma skin cancer at baseline (n = 2117 men, 5007 women), as well as those who had missing values for height or date of birth (n = 40 men, 317 women) and those in NHS who died before 1980 (n = 764). Data from the remaining 49 372 men and 115 612 women were available for analysis.
The study protocol was approved by the institutional review boards of the Brigham and Women’s Hospital and Harvard T.H. Chan School of Public Health, and those of participating registries as required. Written informed consent was obtained from each study participant.
Assessment of height and covariates
Height was reported by participants in the initial questionnaire for both HPFS and NHS. Self-reported and technician-measured anthropometrics, including height, are highly correlated within the cohorts.15,16 Participants were asked to provide information on potential cancer risk factors in the baseline and biennial follow-up questionnaires, including body weight, alcohol use, smoking, physical activity, medication use, family history of cancer, physical examinations, and colonoscopy or sigmoidoscopy examinations. Body mass index (BMI) was calculated by dividing weight in kilograms by height in meters squared. Dietary data were collected every 4 years using a validated food frequency questionnaire.17,18 The Alternate Healthy Eating Index-2010 was used to assess overall diet quality.19
Ascertainment of cases
In both cohorts, we obtained permission to acquire medical records and pathology reports from participants who reported cancer diagnoses on biennial questionnaires. A physician reviewed the records to confirm the diagnosis and extracted information on anatomic location and histological type. We focused on cancers that occur in both men and women, and also excluded breast cancer, which is rare in men. For all deaths, we sought death certificates and, when appropriate, requested permission from next-of-kin to review medical records. Information on cancer cases were also ascertained through state tumor registries and the National Death Index.20
Statistical analysis
Person-time was calculated from date of return of the baseline questionnaire to date of diagnosis for the cancer of interest, date of death, or end of follow-up (31 January 2014 for HPFS and 1 June 2014 for NHS), whichever came first. Follow-up was also censored when a participant was diagnosed with any of the cancers under study. The outcomes of interest included cancers at anatomic sites shared by men and women (i.e. all sites excluding reproductive organs and breast). Analyses were conducted on cancer overall among those shared by men and women as well as site-specific cancers. Sites with 400 or more cases were included in site-specific analyses.
We used Cox proportional hazards models stratified by age and time period to estimate hazard ratios (HRs) and 95% confidence intervals (CIs) for the association between sex and cancer risk. The Cox regression models satisfied the proportionality of hazards assumption. Models were additionally adjusted for race, BMI, alcohol intake, smoking history, pack-years of smoking, physical activity, multivitamin use, regular aspirin use, Alternate Healthy Eating Index-2010, total energy intake, family history of cancer, physical exam in the past 2 years, and history of colonos-copy or sigmoidoscopy. Other than race, all covariates were updated over follow-up and cumulatively updated when applicable. Heterogeneity in associations of height with cancer by sex was assessed by the Cochran Q statistic.21
To calculate the proportion of the association between sex and cancer that was accounted for by differences in height, we pooled data from HPFS and NHS and conducted mediation analysis using the difference method.22,23 Briefly, associations between sex and cancer incidence were estimated using Cox proportional hazard models with and without adjustment for height (modeled continuously). Mediation by height was then assessed by comparing the β coefficients between the two models with the following equation: (βunadjustead-βadjustead)/βunadjustead
We also conducted several secondary analyses. Given the importance of lifestyle factors for cancer risk,24 we explored potential differences in mediation by height for shared cancers overall by smoking status (ever versus never), alcohol consumption (no or moderate versus heavy), BMI (18.5–24.9 kg/m2 versus <18.5 or ≥25 kg/m2), and physical activity [≥7.5 metabolic equivalent of tasks (METs)-h/week versus <7.5 METs-h/week], as well as by adherence to a healthy lifestyle, defined by never smoking, having a BMI between 18.5 and 24.9 kg/m2, no or moderate alcohol consumption (≤1 drink/day for women,≤2 drinks/day for men), and physical activity of at least 75 vigorous-intensity or 150 moderate-intensity minutes per week (7.5 METs-h/ week). Finally, we grouped cancers by their relative attributability to environmental factors, based on previously calculated proportions of cancer cases attributable to major modifiable risk factors in the USA.25 We hypothesized that height would be a stronger mediator for cancers with fewer attributable environmental factors. We considered cancer sites with a greater estimated proportion of cases attributable to the evaluated risk factors than cancer overall as high environmental attribution (oral, nasal, esophagus, stomach, colorectal, liver, larynx, lung, melanoma, kidney, and bladder cancer), and sites with a lower estimated proportion of cases attributable to evaluated risk factors than cancer overall as low environmental attribution (gallbladder, pancreas, thyroid, and hematologic cancer). Analyses were conducted using SAS version 9.4 (SAS Institute Inc, Cary, NC). Tests were two-sided with P < 0.05 considered statistically significant.
RESULTS
During up to 34 years of follow-up for 49 372 men and 115 612 women, 7705 and 13 602 incident cancers at shared sites were diagnosed, respectively. The most common cancers for men were colon, lung, melanoma, and bladder. The most common cancers for women were lung, colon, non-Hodgkin’s lymphoma, and melanoma. Mean (standard deviation) height was 178.3 (7.1) cm for men and 163.8 (6.1) cm for women (Table 1). Men had greater alcohol consumption and total energy intake, engaged in more physical activity, and underwent colorectal cancer screening more frequently. Women were more likely to be current smokers during the study period.
Table 1.
Participant characteristics weighted by person-years in the Health Professionals Follow-up Study (1986–2014) and Nurses’ Health Study (1980–2014)a
| Characteristic | Men (n = 49 372) | Women (n = 115 612) |
|---|---|---|
| Age, years | 64.5 (11.4) | 61.1 (11.7) |
| White, % | 94.8 | 96.8 |
| Height, cm | 178.3 (7.1) | 163.8 (6.1) |
| Body mass index, kg/m2 | 25.7 (3.4) | 25.1 (4.5) |
| Alcohol consumption, g/day | 1 10.9 (13.8) | 5.9 (9.2) |
| Current smoker, % | 5.7 | 16.3 |
| Ever smoker | 50.0 | 54.6 |
| Pack-years of smoking | 11.9 (17.8) | 13.2 (19.2) |
| Physical activity, METs-h/week | 25.8 (23.6) | 16.3 (18.2) |
| Multivitamin use, % | 48.3 | 43.4 |
| Regular aspirin use, % | 38.9 | 43.6 |
| Alternate Healthy Eating lndex-2010 | 48.0 (10.1) | 46.6 (9.5) |
| Total energy intake, Kcal/day | 1994 (627) | 1689 (529) |
| Family history of cancer, % | 34.1 | 34.3 |
| Physical exam in past 2 years, % | 75.7 | 74.4 |
| History of colonoscopy or | 53.3 | 39.4 |
| sigmoidoscopy, % |
MET, metabolic equivalent of task.
All variables other than age are standardized to the age distribution of all participants. Values presented as mean (standard deviation) for continuous variables.
Associations between height (per 10 cm) and risk of shared cancers were significant and similar in men (HR = 1.08; 95% CI = 1.05–1.12) and women (HR 1.10; 95% CI = 1.07–1.13) (Table 2). For specific sites, height was significantly associated with increased risk of melanoma and gastrointestinal, colon, and rectal cancers among men, and melanoma, non-Hodgkin lymphoma, and gastrointestinal, colon, pancreatic, lung, brain, and hematologic cancers among women. Associations of height with hematologic cancer and non-Hodgkin’s lymphoma were stronger in women than men (P for heterogeneity 0.02 for both).
Table 2.
Hazard ratios and 95% confidence intervals for the association between height per 10 cm and cancer risk by site of cancer for Health Professionals Follow-up Study (1986–2014) and Nurses’ Health Study (1980–2014)a
| Cancer site | Total cases | Male cases | Female cases | Men | Women | P for heterogeneityb |
|---|---|---|---|---|---|---|
| Oral | 513 | 213 | 300 | 1.14 (0.93–1.38) | 0.99 (0.82–1.19) | 0.30 |
| Gastrointestinalc | 6097 | 2195 | 3902 | 1.10 (1.03–1.17) | 1.13 (1.07–1.19) | 0.51 |
| Colon | 2999 | 1031 | 1968 | 1.10 (1.00–1.20) | 1.15 (1.07–1.23) | 0.43 |
| Rectum | 792 | 261 | 531 | 1.32 (1.10–1.58) | 1.12 (0.98–1.29) | 0.16 |
| Pancreas | 1063 | 407 | 656 | 1.05 (0.91–1.21) | 1.14 (1.00–1.29) | 0.05 |
| Lung | 3976 | 975 | 3001 | 1.06 (0.97–1.17) | 1.07 (1.01–1.14) | 0.89 |
| Melanoma | 2286 | 876 | 1410 | 1.13 (1.03–1.25) | 1.21 (1.11–1.32) | 0.31 |
| Bladder | 1504 | 856 | 648 | 1.01 (0.92–1.11) | 0.93 (0.82–1.05) | 0.31 |
| Kidney | 861 | 362 | 499 | 1.12 (0.96–1.30) | 1.12 (0.97–1.30) | 0.98 |
| Brain | 480 | 183 | 297 | 1.23 (0.99–1.52) | 1.26 (1.05–1.52) | 0.83 |
| Thyroid | 470 | 86 | 384 | 1.14 (0.83–1.57) | 0.98 (0.83–1.15) | 0.40 |
| Hematologicd | 3435 | 1343 | 2092 | 0.99 (0.92–1.07) | 1.13 (1.05–1.21) | 0.02 |
| Non-Hodgkin’s lymphoma | 2173 | 759 | 1414 | 0.97 (0.88–1.08) | 1.14 (1.05–1.25) | 0.02 |
| Myeloma | 524 | 218 | 306 | 1.05 (0.86–1.27) | 1.13 (0.95–1.35) | 0.58 |
| Leukemia | 627 | 323 | 304 | 0.99 (0.84–1.15) | 1.08 (0.89–1.29) | 0.48 |
| Sharede | 21 307 | 7705 | 13 602 | 1.08 (1.05–1.12) | 1.10 (1.07–1.13) | 0.39 |
All models stratified by age and time period.
P for heterogeneity assessed by the Cochran Q statistic.
Includes cancers of the esophagus, stomach, small intestine, colon, rectum, anus, liver, gallbladder, bile ducts, pancreas, and other digestive organs.
Includes lymphomas, multiple myeloma, and leukemias.
Includes all sites other than reproductive organs and breast.
Compared with women, men had a higher risk of cancers at shared sites overall (HR = 1.39; 95% CI = 1.33–1.45), as well as for several specific sites (oral, gastrointestinal, rectum, pancreas, melanoma, bladder, kidney, brain, hematologic, non-Hodgkin’s lymphoma, myeloma, leukemia) (Table 3). In our cohorts, men had a lower risk of lung cancer than women (HR = 0.79, 95% CI =0.70–0.89), possibly due in part to the higher smoking prevalence in the NHS than in the HPFS (16.3% versus 5.7% current smoking). Height significantly mediated the association between male sex and cancers at shared sites (percent mediated = 35; 95% CI = 24–46). Height also mediated associations at five specific sites: 87% for gastrointestinal, 45% for melanoma, 25% for kidney, 84% for brain, and 24% for hematologic. In analyses stratified by lifestyle factors, mediation by height for cancers at shared sites overall persisted in all subgroups other than among heavy alcohol consumers (percent mediated 15, 95% CI = −14–44) (Figure 1). Mediation tended to be stronger among those with healthier lifestyle factors, particularly when comparing never smokers (percent mediated = 44, 95% CI = 29–59) and ever smokers (percent mediated = 28, 95% CI = 12–44).
Table 3.
Multivariable-adjusted hazard ratios and 95% confidence intervals for the association between male sex and cancer risk by site of cancer before and after adjustment for height, and percent of the association mediated by heighta
| Cancer site | HR (95% Cl) | HR (95% Cl) | Percent mediated by height (95% Cl); Pb |
|---|---|---|---|
| Not adjusted for height | Adjusted for height | ||
| Oral Gastrointestinalc |
2.07 (1.58–2.72) 1.21 (1.12–1.32) |
1.94 (1.39–2.70) 1.03 (0.93–1.13) |
9 (−17–36); P = 0.48 87 (40–134); P < 0.001 |
| Colon | 1.03 (0.91–1.15) | 0.85 (0.74–0.99) | 729 (−2745–4202); P = 0.68 |
| Rectum | 1.32 (1.04–1.67) | 1.02 (0.77–1.35) | 93 (−3–188); P = 0.06 |
| Pancreas | 1.52 (1.25–1.84) | 1.31 (1.03–1.66) | 35 (−1–72); P = 0.06 |
| Lung | 0.79 (0.70–0.89) | 0.78 (0.67–0.90) | −4 (−35–27); P = 0.79 |
| Melanoma | 1.59 (1.41–1.80) | 1.29 (1.10–1.51) | 45 (21–69); P < 0.001 |
| Bladder | 3.23 (2.78–3.75) | 3.51 (2.92–4.23) | -7 (−17–2); P = 0.13| |
| Kidney | 2.15 (1.76–2.63) | 1.77 (1.36–2.29) | 25 (4–47); P = 0.02 |
| Brain | 1.52 (1.15–2.01) | 1.07 (0.75–1.54) | 84 (6–162); P = 0.03 |
| Thyroid | 0.79 (0.56–1.10) | 0.75 (0.51–1.11) | −19 (−107–70); P = 0.68 |
| Hematologicd | 1.51 (1.36–1.67) | 1.36 (1.20–1.55) | 24 (4–45); P = 0.02 |
| Non-Hodgkin lymphoma | 1.30 (1.14–1.48) | 1.18 (1.00–1.39) | 38 (−6–82); P = 0.09 |
| Myeloma | 1.59 (1.24–2.03) | 1.36 (0.99–1.86) | 34 (−13–81); P = 0.16 |
| Leukemia | 2.45 (1.92–3.11) | 2.32 (1.73–3.12) | 6 (−13–25); P = 0.54 |
| Sharede | 1.39 (1.33–1.45) | 1.24 (1.17–1.31) | 35 (24–46); P < 0.001 |
CI, confidence interval; HR, hazard ratio.
All models stratified by age and time period, and adjusted for race (white/non-white), body mass index (<25, 25–27.4, 27.5–29.9, 30–34.9, 35 kg/m2), alcohol intake (0, 0.1–6.9, 7–13.9, 14–27.9, 28+ g/day), smoking history (never, former, current 1–14, current 15+), pack-years of smoking (0, 0.1–4.9, 5–19.9, 20–39.9, 40+), physical activity (quintiles), multivitamin use (yes/no), regular aspirin use (yes/no), Alternate Healthy Eating Index-2010 (quintiles), total energy intake (quintiles), family history of cancer (yes/no), physical exam in past 2 years (yes/no), history of colonoscopy or sigmoidoscopy (yes/no).
Percent mediated by height calculated as (βunadjustead-βadjustead)/βunadjustead.
Includes cancers of the esophagus, stomach, small intestine, colon, rectum, anus, liver, gallbladder, bile ducts, pancreas, and other digestive organs.
Includes lymphomas, multiple myeloma, and leukemias.
Includes all sites other than reproductive organs and breast.
Figure 1.
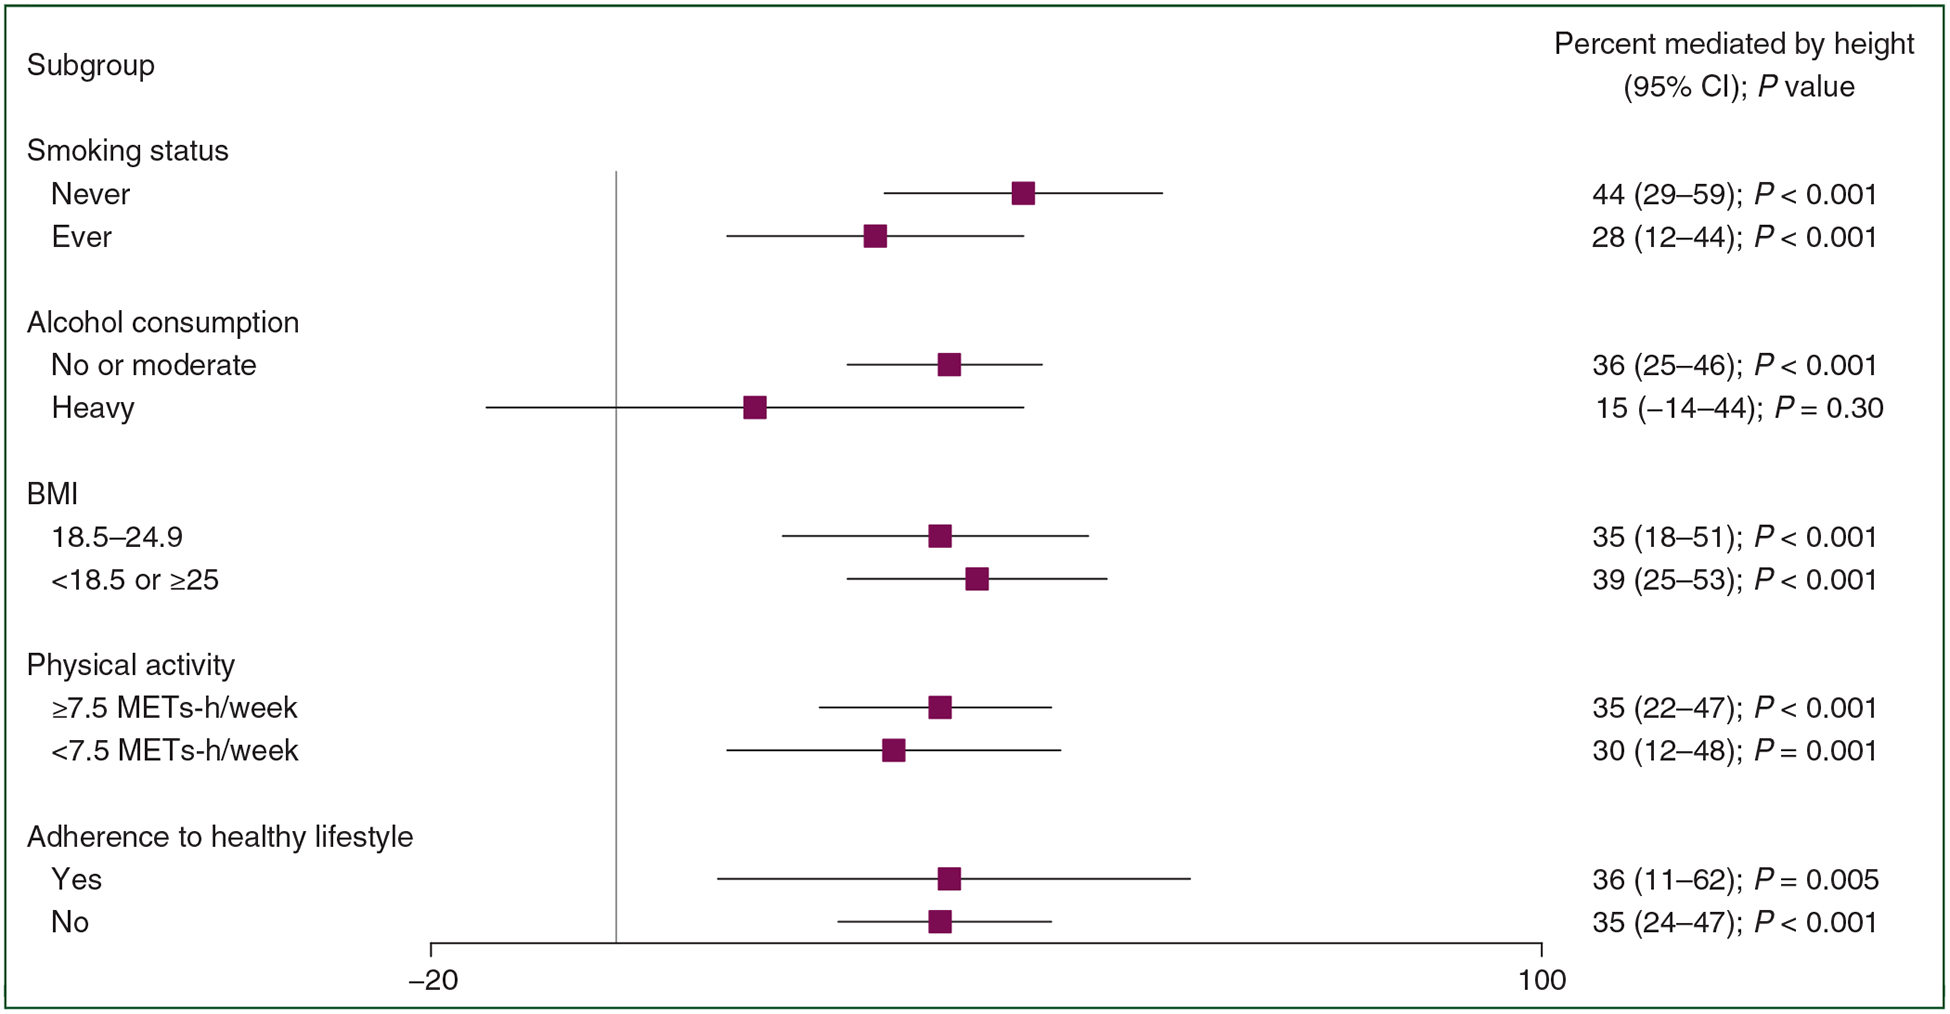
Percent of the association between sex and shared cancers mediated by height in subgroups. Heavy alcohol consumption defined by ≤1 drink/day for women, ≤2 drinks/day for men. Healthy lifestyle defined by never smoking, BMI between 18.5 and 24.9 kg/m2, no or moderate alcohol consumption (≤1 drink/ day for women, ≤2 drinks/day for men), and 7.5 METs-h/week. All models stratified by age and time period, and adjusted for race (white/non-white), BMI (<25, 25–27.4, 27.5–29.9, 30–34.9, 35+ kg/m2), alcohol intake (0, 0.1–6.9, 7–13.9, 14–27.9, 28+ g/day), smoking history (never, former, current 1–14, current 15+), pack-years of smoking (0, 0.1–4.9, 5–19.9, 20–39.9, 40+), physical activity (quintiles), multivitamin use (yes/no), regular aspirin use (yes/no), Alternate Healthy Eating Index-2010 (quintiles), total energy intake (quintiles), family history of cancer (yes/no), physical exam in past 2 years (yes/no), history of colonoscopy or sigmoidoscopy (yes/no).
BMI, body mass index; CI, confidence interval; MET, metabolic equivalent of task.
Cancer with low environmental attribution showed greater mediation by height compared with those with high environmental attribution (36% and 27%, respectively) (Table 4). This discrepancy increased among participants who adhered to a healthy lifestyle (49% and 31%), although mediation for cancers with low environmental attribution was not significant, possibly due to the reduced sample size.
Table 4.
Multivariable-adjusted hazard ratios and 95% confidence intervals for the association between male sex and risk of cancer before and after adjustment for height, and percent of the association mediated by height, according to cancer subgroups by attribution to environmental risk factors
| Male | Female | Total cases | HR (95% Cl) | HR (95% Cl) | Percent mediated by | |
|---|---|---|---|---|---|---|
| cases | cases | Not adjusted for height | Adjusted for height | height (95% Cl); Pa | ||
| All participants | ||||||
| Cancers with high environmental attribution | 5162 | 8888 | 14 050 | 1.44 (1.37–1.52) | 1.31 (1.22–1.39) | 27 (16–38); P < 0.001 |
| Cancers with low environmental attribution | 1902 | 3357 | 5259 | 1.37 (1.26–1.49) | 1.22 (1.10–1.36) | 36 (14–58); P = 0.002 |
| Never smokers | ||||||
| Cancers with high environmental attribution | 1708 | 2651 | 4359 | 1.61 (1.47–1.76) | 1.33 (1.18–1.49) | 40 (23–57); P < 0.001 |
| Cancers with low environmental attribution | 809 | 1498 | 2307 | 1.36 (1.20–1.54) | 1.17 (1.00–1.38) | 48 (11–85); P = 0.01 |
| Adherence to healthy lifestyle | ||||||
| Cancers with high environmental attribution | 629 | 706 | 1335 | 1.74 (1.48–2.05) | 1.47 (1.19–1.81) | 31 (5–56); P = 0.02 |
| Cancers with low environmental attribution | 310 | 436 | 746 | 1.33 (1.07–1.64) | 1.15 (0.87–1.53) | 49 (−24–123); P = 0.19 |
Cancers designated as high environmental attribution (oral, nasal, esophagus, stomach, colorectal, liver, larynx, lung, melanoma, kidney, and bladder cancer), and low environmental attribution (gallbladder, pancreas, thyroid, and hematologic cancer) relative to previously estimated proportion of cases attributable to evaluated risk factors than cancer overall. Healthy lifestyle defined by never smoking, BMI between 18.5 and 24.9 kg/m2, no or moderate alcohol consumption (≤1 drink/day for women, 2 drinks/day for men), and 7.5 METs-h/week. All models stratified by age and time period, and adjusted for race (white/non-white), BMI (<25, 25–27.4, 27.5–29.9, 30–34.9, 35+kg/m2), alcohol intake (0, 0.1–6.9, 7–13.9, 14–27.9, 28+ g/day), smoking history (never, former, current 1–14, current 15+), pack-years of smoking (0, 0.1–4.9, 5–19.9, 20–39.9, 40+), physical activity (quintiles), multivitamin use (yes/no), regular aspirin use (yes/no), Alternate Healthy Eating Index-2010 (quintiles), total energy intake (quintiles), family history of cancer (yes/no), physical exam in past 2 years (yes/no), history of colonoscopy or sigmoidoscopy (yes/no).
BMI, body mass index; CI, confidence interval; HR, hazard ratio; MET, metabolic equivalent of task.
Percent mediated by height calculated as (βunadjustead-βadjustead)/βunadjustead.
DISCUSSION
We used two large US prospective cohorts to quantify whether and to what extent height mediated sex differences in cancer risk. After up to 34 years of follow-up, height explained one-third of the excess risk of cancers at shared sites overall in men after accounting for major cancer risk factors with substantial variation across cancer sites and types. Mediation by height was evident for gastrointestinal, melanoma, kidney, brain, and hematologic malignancies and tended to be stronger among those who were never smokers or adhered to a healthy lifestyle, as well as for cancers with lower environmental attribution. Our results for total shared cancers are comparable to another published study,14 in which close to half of the total excess risk for men was explained by height after adjusting for cancer risk factors.
Although men have been shown in many populations to have higher rates of cancer incidence than women, the reasons for much of the discrepancy remain unclear. Occupational exposures to carcinogens26,27 and differences in lifestyle factors28,29 are potential contributing factors, but are only able to partially explain the disparity for most cancers.4 The cellular and molecular features driving these differences are also not well understood and remain active areas of research. Hormones and sex chromosomes30–32 are known factors, and there is increasing evidence that other genetic and epigenetic differences between men and women may be important,33 including differences in regulation by transcription factors34 and sex biases in somatic mutations of cancer driver genes.35
We found that women had a higher risk of lung cancer than men. Smoking is known to be the most important contributor to sex disparities in lung cancer, with decreases in male-to-female rate ratios over time reflecting smoking cessation trends.1,36 The greater risk of lung cancer among women in our study is likely driven in part by higher rates of smoking in the NHS compared with HPFS, especially smoking during follow-up. Smoking also seemed to attenuate the effect of height on cancer risk overall, as mediation by height was stronger overall among never smokers. Sex differences in lung cancer susceptibility may also play a role, as incidence among never smokers has been previously shown to be higher among women than men in several large prospective cohorts, including the NHS and HPFS.37
Among the cancers that had higher risk in men, those where a smaller proportion of cases have been found to be attributable to environmental risk factors24,25,38 were more likely to be mediated by height. In particular, height significantly mediated the risk of brain cancer and showed suggestive evidence of mediation for non-Hodgkin’s lymphoma, both of which have few established environmental risk factors. Studies using data from nationally representative population surveys in the USA and UK have estimated population attributable fractions of major lifestyle and environmental factors for the two cancer types to be less than 10%.25,38 Thus, other factors such as height may be of particular interest for understanding sex differences in risk for these cancers.
Although height is simple to measure, both its determinants and potential mechanisms in cancer risk are complex. Twin studies39 and genome-wide association studies40 have shown that much of the variation in height is influenced by genetics. However, early life environment is also an important determinant of adult stature through nutrition, exposure to pathogens during childhood and adolescence, as well as aspects of the fetal environment. These may play an even larger role in developing countries, where stunted growth is of greater concern due to a higher prevalence of malnutrition and recurrent infections.41 Increasing secular trends in height around the world have been attributed in part to rising living standards and improvements in early life health.42
Many of these environmental determinants of height may influence cancer through increasing circulating levels of hormones such as insulin-like growth factor-1, which promote cell growth and survival,43 and have been associated with increased risk of certain cancers.44–46 Greater stature may also serve as a marker for the number of stem cells in the body, leading to an increase in cell divisions and subsequently a greater chance of malignant transformation. This theory is supported in part by the allometric scaling of organs with height, in which the mass of a number of different organs is proportional to powers of height.47 Our finding that cancers with fewer known environmental risk factors were more likely to be mediated by height suggests that cell number could play a larger role in determining sex differences for these cancers and that environmental factors, both known and unknown, are indeed fewer and/or more similar between men and women, although it is also possible that residual confounding may be overshadowing this effect for those with stronger environmental ties. Additional studies of cancer risk with assessments of organ size (e.g. through imaging) would be one approach to addressing this particular mechanism.
Strengths of our study include over 30 years of follow-up within two well-characterized prospective cohorts and repeated assessment of a large number of cancer risk factors to allow for time-varying covariates in our analyses. In addition, the number of cancer cases provided us with greater power, particularly in site-specific analyses, than previous studies.
Our study also has several limitations. First, some of the sex differences in cancer risk that we found could be due to differences between the two cohort populations, such as calendar time, screening, and lifestyle, although we adjusted for these in our analyses to minimize their impact and performed secondary analyses among participants who never smoked and adhered to healthy lifestyles. Second, our participants were predominantly white health professionals which may limit generalizability. However, at the same time the homogeneity of the cohorts reduces the impact of occupational exposures and other environmental factors that may contribute to sex differences in cancer risk. Third, we cannot rule out residual confounding. Although we adjusted for many of the major cancer risk factors, the unavailability of other factors, such as infections and early-life factors, may have partially masked or exaggerated the effect of height on certain cancers. Fourth, although we were able to include analyses of a number of individual sites, there were a limited number of cases for subtype analysis. Future studies should be conducted in populations with greater power to investigate specific cancer subtypes.
In summary, we show that height accounted for 35% of the sex differences in risk of cancers at shared sites between men and women, and tended to be stronger among never smokers or those adhering to healthy lifestyles. The mechanisms underlying the relationship between height and cancer may be important determinants of sex disparities in cancer incidence.
ACKNOWLEDGEMENTS
We would like to thank the participants and staff of the Health Professionals Follow-up Study and Nurses’ Health Study for their valuable contributions, as well as the following US state cancer registries for their help: Alabama, Arizona, Arkansas, California, Colorado, Connecticut, Delaware, Florida, Georgia, Idaho, Illinois, Indiana, Iowa, Kentucky, Louisiana, Maine, Maryland, Massachusetts, Michigan, Nebraska, New Hampshire, New Jersey, New York, North Carolina, North Dakota, Ohio, Oklahoma, Oregon, Pennsylvania, Rhode Island, South Carolina, Tennessee, Texas, Virginia, Washington, and Wyoming. Drs Fu and Mucci had full access to all the data in the study and take responsibility for the integrity of the data and the accuracy of the data analysis.
FUNDING
This work was supported by grants from the National Institutes of Health (grant numbers U01 CA167552, UM1 CA186107, P01 CA87969, R00 CA215314, and T32 CA00900).
Footnotes
DISCLOSURE
The authors have declared no conflicts of interest.
REFERENCES
- 1.Cook MB, Dawsey SM, Freedman ND, et al. Sex disparities in cancer incidence by period and age. Cancer Epidemiol Biomarkers Prev. 2009;18:1174–1182. [DOI] [PMC free article] [PubMed] [Google Scholar]
- 2.Dorak MT, Karpuzoglu E. Gender differences in cancer susceptibility: an inadequately addressed issue. Front Genet. 2012;3:268. [DOI] [PMC free article] [PubMed] [Google Scholar]
- 3.Siegel RL, Miller KD, Jemal A. Cancer statistics, 2019. CA Cancer J Clin. 2019;69:7–34. [DOI] [PubMed] [Google Scholar]
- 4.Edgren G, Liang L, Adami HO, Chang ET. Enigmatic sex disparities in cancer incidence. Eur J Epidemiol. 2012;27:187–196. [DOI] [PubMed] [Google Scholar]
- 5.Kabat GC, Kim MY, Hollenbeck AR, Rohan TE. Attained height, sex, and risk of cancer at different anatomic sites in the NIH-AARP diet and health study. Cancer Causes Control. 2014;25:1697–1706. [DOI] [PubMed] [Google Scholar]
- 6.Gunnell D, Okasha M, Smith GD, Yarnell J, Smith GD. Height, leg length, and cancer risk: a systematic review. Epidemiol Rev. 2001;23:313–342. [DOI] [PubMed] [Google Scholar]
- 7.Sung J, Song YM, Lawlor DA, Smith GD, Ebrahim S. Height and site-specific cancer risk: a cohort study of a Korean adult population. Am J Epidemiol. 2009;170:53–64. [DOI] [PubMed] [Google Scholar]
- 8.Giovannucci E, Rimm EB, Liu Y, Willett WC. Height, predictors of C-peptide and cancer risk in men. Int J Epidemiol. 2004;33:217–225. [DOI] [PubMed] [Google Scholar]
- 9.Green J, Cairns BJ, Casabonne D, et al. Height and cancer incidence in the Million Women Study: prospective cohort, and meta-analysis of prospective studies of height and total cancer risk. Lancet Oncol. 2011;12:785–794. [DOI] [PMC free article] [PubMed] [Google Scholar]
- 10.Choi YJ, Lee DH, Han KD, et al. Adult height in relation to risk of cancer in a cohort of 22,809,722 Korean adults. Br J Cancer. 2019;120(6): 668–674. [DOI] [PMC free article] [PubMed] [Google Scholar]
- 11.Albanes D, Winick M. Are cell number and cell proliferation risk factors for cancer? J Natl Cancer Inst. 1988;80:772–774. [DOI] [PubMed] [Google Scholar]
- 12.Insulin Pollak M. and insulin-like growth factor signalling in neoplasia. Nat Rev Cancer. 2008;8:915–928. [DOI] [PubMed] [Google Scholar]
- 13.Yu H, Rohan T. Role of the insulin-like growth factor family in cancer development and progression. J Natl Cancer Inst. 2000;92:1472–1489. [DOI] [PubMed] [Google Scholar]
- 14.Walter RB, Brasky TM, Buckley SA, et al. Height as an explanatory factor for sex differences in human cancer. J Natl Cancer Inst. 2013;105:860–868. [DOI] [PMC free article] [PubMed] [Google Scholar]
- 15.Rimm EB, Stampfer MJ, Colditz GA, Chute CG, Litin LB, Willett WC. Validity of self-reported waist and hip circumferences in men and women. Epidemiology. 1990;1:466–473. [DOI] [PubMed] [Google Scholar]
- 16.Troy LM, Hunter DJ, Manson JE, Colditz GA, Stampfer MJ, Willett WC. The validity of recalled weight among younger women. Int J Obes Relat Metab Disord. 1995;19:570–572. [PubMed] [Google Scholar]
- 17.Rimm EB, Giovannucci EL, Stampfer MJ, Colditz GA, Litin LB, Willett WC. Reproducibility and validity of an expanded self-administered semiquantitative food frequency questionnaire among male health professionals. Am J Epidemiol. 1992;135:1114–1126. discussion 1127–1136. [DOI] [PubMed] [Google Scholar]
- 18.Willett WC, Sampson L, Stampfer MJ, et al. Reproducibility and validity of a semiquantitative food frequency questionnaire. Am J Epidemiol. 1985;122:51–65. [DOI] [PubMed] [Google Scholar]
- 19.McCullough ML, Feskanich D, Stampfer MJ, et al. Diet quality and major chronic disease risk in men and women: moving toward improved dietary guidance. Am J Clin Nutr. 2002;76:1261–1271. [DOI] [PubMed] [Google Scholar]
- 20.Stampfer MJ, Willett WC, Speizer FE, et al. Test of the National Death Index. Am J Epidemiol. 1984;119:837–839. [DOI] [PubMed] [Google Scholar]
- 21.Cochran WG. The combination of estimates from different experiments. Biometrics. 1954;10:101–129. [Google Scholar]
- 22.MacKinnon DP, Fairchild AJ, Fritz MS. Mediation analysis. Annu Rev Psychol. 2007;58:593–614. [DOI] [PMC free article] [PubMed] [Google Scholar]
- 23.VanderWeele TJ. Mediation analysis: a practitioner’s guide. Annu Rev Public Health. 2016;37:17–32. [DOI] [PubMed] [Google Scholar]
- 24.Song M, Giovannucci E. Preventable incidence and mortality of carcinoma associated with lifestyle factors among white adults in the United States. JAMA Oncol. 2016;2:1154–1161. [DOI] [PMC free article] [PubMed] [Google Scholar]
- 25.Islami F, Goding Sauer A, Miller KD, et al. Proportion and number of cancer cases and deaths attributable to potentially modifiable risk factors in the United States. CA Cancer J Clin. 2018;68:31–54. [DOI] [PubMed] [Google Scholar]
- 26.Rushton L, Bagga S, Bevan R, et al. Occupation and cancer in Britain. Br J Cancer. 2010;102:1428–1437. [DOI] [PMC free article] [PubMed] [Google Scholar]
- 27.Purdue MP, Hutchings SJ, Rushton L, Silverman DT. The proportion of cancer attributable to occupational exposures. Ann Epidemiol. 2015;25:188–192. [DOI] [PMC free article] [PubMed] [Google Scholar]
- 28.Cao Y, Willett WC, Rimm EB, Stampfer MJ, Giovannucci EL. Light to moderate intake of alcohol, drinking patterns, and risk of cancer: results from two prospective US cohort studies. BMJ. 2015;351:h4238. [DOI] [PMC free article] [PubMed] [Google Scholar]
- 29.Thun MJ, Carter BD, Feskanich D, et al. 50-year trends in smoking-related mortality in the United States. N Engl J Med. 2013;368: 351–364. [DOI] [PMC free article] [PubMed] [Google Scholar]
- 30.Clocchiatti A, Cora E, Zhang Y, Dotto GP. Sexual dimorphism in cancer. Nat Rev Cancer. 2016;16:330–339. [DOI] [PubMed] [Google Scholar]
- 31.Spatz A, Borg C, Feunteun J. X-chromosome genetics and human cancer. Nat Rev Cancer. 2004;4:617–629. [DOI] [PubMed] [Google Scholar]
- 32.Henderson BE, Ross RK, Pike MC, Casagrande JT. Endogenous hormones as a major factor in human cancer. Cancer Res. 1982;42:3232–3239. [PubMed] [Google Scholar]
- 33.Ellegren H, Parsch J. The evolution of sex-biased genes and sex-biased gene expression. Nat Rev Genet. 2007;8:689–698. [DOI] [PubMed] [Google Scholar]
- 34.Lopes-Ramos CM, Kuijjer ML, Ogino S, et al. Gene regulatory network analysis identifies sex-linked differences in colon cancer drug metabolism. Cancer Res. 2018;78:5538–5547. [DOI] [PMC free article] [PubMed] [Google Scholar]
- 35.Li CH, Haider S, Shiah YJ, Thai K, Boutros PC. Sex differences in cancer driver genes and biomarkers. Cancer Res. 2018;78:5527–5537. [DOI] [PubMed] [Google Scholar]
- 36.Doll R, Hill AB. Lung cancer and other causes of death in relation to smoking; a second report on the mortality of British doctors. Br Med J. 1956;2:1071–1081. [DOI] [PMC free article] [PubMed] [Google Scholar]
- 37.Wakelee HA, Chang ET, Gomez SL, et al. Lung cancer incidence in never smokers. J Clin Oncol. 2007;25:472–478. [DOI] [PMC free article] [PubMed] [Google Scholar]
- 38.Brown KF, Rumgay H, Dunlop C, et al. The fraction of cancer attributable to modifiable risk factors in England, Wales, Scotland, Northern Ireland, and the United Kingdom in 2015. Br J Cancer. 2018;118: 1130–1141. [DOI] [PMC free article] [PubMed] [Google Scholar]
- 39.Silventoinen K, Sammalisto S, Perola M, et al. Heritability of adult body height: a comparative study of twin cohorts in eight countries. Twin Res. 2003;6:399–408. [DOI] [PubMed] [Google Scholar]
- 40.Wood AR, Esko T, Yang J, et al. Defining the role of common variation in the genomic and biological architecture of adult human height. Nat Genet. 2014;46:1173–1186. [DOI] [PMC free article] [PubMed] [Google Scholar]
- 41.Victora CG, Adair L, Fall C, et al. Maternal and child undernutrition: consequences for adult health and human capital. Lancet. 2008;371: 340–357. [DOI] [PMC free article] [PubMed] [Google Scholar]
- 42.Currie J, Vogl T. Early-life health and adult circumstance in developing countries. Annu Rev Econ. 2013;5:1–36. [Google Scholar]
- 43.Nutrition Giovannucci E., insulin, insulin-like growth factors and cancer. Horm Metab Res. 2003;35:694–704. [DOI] [PubMed] [Google Scholar]
- 44.Rinaldi S, Cleveland R, Norat T, et al. Serum levels of IGF-I, IGFBP-3 and colorectal cancer risk: results from the EPIC cohort, plus a meta-analysis of prospective studies. Int J Cancer. 2010;126:1702–1715. [DOI] [PubMed] [Google Scholar]
- 45.Shi R, Yu H, McLarty J, Glass J. IGF-I and breast cancer: a meta-analysis. Int J Cancer. 2004;111:418–423. [DOI] [PubMed] [Google Scholar]
- 46.Chan JM, Stampfer MJ, Giovannucci E, et al. Plasma insulin-like growth factor-I and prostate cancer risk: a prospective study. Science. 1998;279:563–566. [DOI] [PubMed] [Google Scholar]
- 47.Heymsfield SB, Gallagher D, Mayer L, Beetsch J, Pietrobelli A. Scaling of human body composition to stature: new insights into body mass index. Am J Clin Nutr. 2007;86:82–91. [DOI] [PMC free article] [PubMed] [Google Scholar]