

Abstract
Dihydronicotinamide riboside (NRH) was suggested to act as a precursor for the synthesis of NAD+ but the biochemical pathway converting it has been unknown. Here we show that NRH can be converted into NAD+ via a salvage pathway in which adenosine kinase (AK) acts as an NRH kinase. Using isotope labeling approaches, we demonstrate NRH is fully incorporated into NAD+, with NMNH acting as an intermediate. We further show that AK is enriched in fractions from cell lysates with NRH kinase activity and that AK can convert NRH into NAD+. In cultured cells and the mouse liver, pharmacological or genetic inhibition of AK blocks formation of nicotinamide mononucleotide (NMNH) and inhibits NRH-stimulated NAD+ biosynthesis. Finally, we confirm the presence of endogenous NRH in the liver with metabolomics. Our findings establish NRH as a natural precursor of NAD+ and reveal a new route for NAD+ biosynthesis via an NRH salvage pathway involving AK.
The metabolic pathways of NAD+ biosynthesis have been of significant biomedical interest since the 1940s1. From that time came the appreciation that NAD+ is a key metabolic co-factor in the transfer of hydrogen equivalents between fuel biomolecules such as glucose and downstream processes such as mitochondrial oxidative phosphorylation that drive cellular energy production1. Sufficient tissue NAD+ concentrations are known to be important for human health, as depletion of NAD+ leads to the nutritional deficiency of pellagra, which killed more than a hundred thousand people in the US in the early part of the 20th century2,3. Kornberg4,5, and Preiss and Handler6–8 showed that NAD+ could be made from enzymatic steps originating from mononucleotides synthesized from nicotinamide and nicotinic acid (Extended Data Figure 1)9,10. Tryptophan catabolism through the kynurenine pathway to quinolinate and downstream to nicotinate mononucleotide (NaMN)11,12 provides a human de novo pathway for NAD+ biosynthesis11,12. Another salvage pathway for NAD+ biosynthesis was recently identified starting from nicotinamide riboside (NR) and dependent upon nicotinamide riboside kinases13 (Nrk1 and Nrk2). Vitamin B3 precursors converge to NAD+, enhancing cellular dinucleotide concentrations.
Newer biomedical rationales are driving attention to NAD+ biosynthesis, with the idea that NAD+ homeostasis is an age-vulnerable phenotype14 and that weak homeostasis is a contributor to disease development in humans15. This hypothesis has stimulated studies to examine whether genetic and pharmacologic interventions that bolster cell and tissue NAD+ concentrations can correct or delay disease. For example, NR mitigates metabolic toxicity caused by high calorie diets16,17, and extends lifespan in aged mice18. Administration of the NAD+ enhancing compound nicotinamide mononucleotide (NMN) reverses age-specific phenotypes in aged mice and improves mitochondrial fitness to youthful levels14. Improved outcomes in metabolic syndrome have been observed in genetically modified mice that feature reduced NAD+ consumption and elevated NAD+ concentrations in animal tissues. Mouse genetic knockouts of key NAD+ consumers such as CD3819 and poly (ADP-ribose) polymerase 1 (PARP1)20 exhibit increased resistance to weight gain and metabolic toxicities associated with high calorie diets. More broadly, in preclinical animal studies, enhancement of NAD+ biosynthesis through administration of NAD+ precursors mitigates mitochondrial disease21,22, Alzheimer’s Disease23–25, cardiovascular disorders26,27, and even cancer28 and provides profound improvements in vascular and exercise fitness29. Phase I clinical trials have begun or have been published for NR30–34 and NMN, and these agents augment NAD+ biosynthesis in humans, at least in blood.
Beyond the known NAD+ precursors and their described biosynthetic pathways, we recently evaluated a compound called dihydronicotinamide riboside (NRH) and showed it is a potent pharmacologic agent for NAD+ concentration enhancement in mammalian cells35. As compared with NR or NMN, it significantly surpassed their effects causing NAD+ concentration increases of 3–10 fold in a variety of cultured mammalian cells. The compound shows significant effects when administered to mice by intraperitoneal injection35. NRH is thought to be a naturally occurring metabolite, but its only known role is as a substrate for NRH quinone oxidoreductase 2 (NQO2)36. Our preliminary investigations of this compound indicated that it probably acts as an NAD+ biosynthetic precursor, although isotope-labeling would make it definitive. We also identified an NRH kinase activity in cell lysates capable of converting NRH to reduced nicotinamide mononucleotide (NMNH), which could serve as a putative biosynthetic intermediate to NAD+, previously unrecognized to participate in this respect35. These findings led us to propose that NRH provides the starting point for a novel NAD+ biosynthetic salvage pathway with exceptional biosynthetic activity in mammalian cells.
In this report we describe investigations showing that NRH is a biosynthetic precursor to NAD+ in mammalian cells. It relies upon a kinase previously unrecognized to participate in NAD+ biosynthesis, which was identified by cell fractionation studies and proteomics identification methods. The NRH kinase is adenosine kinase (AK), and AK readily converts NRH to NMNH. Cells and mice treated with AK inhibitors or genetic knockout of AK abolish conversion of NRH to to NMNH in mammalian lysates and ablates conversion of NRH to NAD+ in cells and in mouse tissue. This report describes the discovery of a novel NRH salvage pathway converging to NAD+ in mammalian cells withimpressive pharmacologic activity for raising NAD+ concentrations.
RESULTS
NRH converts to NMNH and to NAD+
NRH exposure to mammalian cells causes NAD+ concentrations to accumulate. In prior work, we showed that NRH increases cellular NAD+ concentrations from 3–10 fold in different mammalian cell types including neuronal, muscle-like, kidney-like and insulin producing cells35. Investigations of its mechanism of action indicated that NRH exposure does not inhibit NAD+ turnover suggesting that NRH is an NAD+ precursor metabolized in cells to NAD+35. Neuro2a cells were chosen to further investigate this hypothesis, given that they respond to NRH with increases in NAD+ concentrations of greater than 1000 % versus controls35. Neuro2a cell lysates contain an activity that can metabolize NRH to NMNH. We hypothesized that NRH action in raising cellular NAD+ concentration is dependent upon this phosphorylation catalyzed by an unknown kinase35. NRH conversion to NMNH is ATP dependent, with 80–90% less activity if ATP is not added to lysates (Figure 1a). The diminished phosphorylating activity of lysates without added ATP likely reflects sub-saturation of the responsible kinase with diluted ATP already present in lysate (Figure 1a). Similar results were published previously under different conditions35. In order to investigate the concentration dependence for NRH phosphorylation, we varied NRH and ATP independently at fixed and saturating ATP and NRH (2 mM) concentrations respectively. We show that both NRH and ATP exhibit saturable increases in NRH transformation to NMNH catalyzed by Neuro2a lysate. These experiments were performed by monitoring NMNH formation at 340 nm by HPLC which quantitates the rate of NMNH formed (μmol product/mg protein-sec). The rate of NRH conversion to NMNH reaches a maximum with apparent Km = 440 ± 71 μM for NRH (Figure 1b), and apparent Km = 86 ± 32 μM for ATP (Figure 1c).
Figure 1.

NRH is converted into NMNH before being made into NAD+. a) ATP is essential in converting NRH to NMNH. Experiments were repeated independently 3 times with similar results. b) Vmax and apparent KM for NMNH production with Neuro2a protein lysate, 2 mM ATP, 5 mM Mg2+ and NRH varying between 0.1 and 2 mM. n=2 biologically independent samples. c) Vmax and apparent KM for NMNH production with Neuro2a protein lysate, 2 mM NRH and ATP/Mg2+ varying between 0.1 and 2 mM. n=2 biologically independent samples. d) NRH molecule is labeled with one 18O (+2 m/z) on the nicotinamide and five 13C (+5 m/z) on the ribose. If NRH is incorporated into NAD+ in its intact form, mass of NAD+ will shift from 664 to 671 (positive ion detection mode: +7 m/z). Two additional product outcomes are shown, in which either labeled 18O-nicotinamide is incorporated into NAD+ (predicted m/z = 666) or only labeled sugar is incorporated into NAD + (predicted m/z = 669). e) Comparison between MS spectra of NAD+ (positive ion mode detection) measured by LCMS for isolated NAD+ from Neuro2a and f) HEK293 cells treated with vehicle or 1 mM [carbonyl-18O, U-ribosyl-13C]NRH for 7 hr (Further details provided in Methods). n=2 biologically independent samples.
A model (Extended Data Figure 2) describes several metabolic pathways for NRH conversion to NAD+. To test for the relevant pathway in mammalian cells, we synthesized isotopically labeled [carbonyl-18O, U-ribosyl-13C]NRH, where the reduced nicotinamide is labeled with 18O and the ribose is labeled at all five carbons with 13C. The 18O incorporation is 85%, and 13C incorporations are 99% (See Methods and Supplementary Figure 1 for MS spectrum). If NRH is transported into cells intact and phosphorylated as an initial step to form NMNH followed by adenylation, the product formed would be NADH. Subsequent oxidation would form NAD+ incorporating all the isotopic labels of the NRH. The resulting [carbonyl-18O, U-ribosyl-13C]NAD+ would have m/z = 671 (positive ion), which has Δ m/z= +7 versus unlabeled NAD+ with an m/z = 664 (positive ion) as shown in Figure 1d. Additional metabolites could arise from labeled NRH, including the product [U-ribosyl-13C]NAD+ which would arise from the 15% lower labeling at the carbonyl position (Figure 1d). [carbonyl-18O]NAD+ could also be obtained by nicotinamide salvage mediated by nicotinamide phosphoribosyltransferase (Nampt).
Cells (Neuro2a and HEK293) were treated with 1 mM isotope-labeled NRH or vehicle and harvested after 7 hr. NAD+ was purified from cell lysates by HPLC and lyophilized. Isolated NAD+ was analyzed by LCMS to assess for isotopic composition. Natural abundance NAD+ from control cells has a dominant ion of m/z = 664, with only base-line signal peaks at m/z values of 666, 669 or 671 (Figure 1e). In Neuro2a cells treated with 1 mM [carbonyl-18O, U-ribosyl-13C]NRH, the resulting NAD+ mass spectrum featured a dominant peak at m/z = 671, which is 17 times the unlabeled NAD+ intensity (Figure 1e, see Figure S2 for raw data). Similar results were obtained in HEK293 cells, with the intensity of the peak at m/z = 671 present in excess of 4000 percent of the unlabeled NAD+ from these cells (Figure 1f and Supplementary Figure 2). In all cases, the 664 peak is assigned to NAD+ arising from NRH independent biosynthesis.
A 15% intensity of 669 versus the 671 signal in both Neuro2a and HEK293 NAD+ MS spectra reflects the 15% lack of labeling at the carbonyl oxygen, as expected from the 85% 18O enrichment in NRH. Small amounts of nicotinamide-salvage generated [carbonyl-18O]NAD+ (m/z = 666) was observed above control (Figure 1 e and 1f and structure in Figure 1d) but no more than 5% of the total incorporated isotope label. Thus, degradation of NRH to nicotinamide is unlikely to play a major role in NAD+ biosynthesis derived from NRH. The data confirm that NRH is incorporated overwhelmingly in intact form into NAD+ and is consistent with the hypothesis NRH is phosphorylated to NMNH then converted to NAD+ by subsequent cellular chemistry. The dominance of m/z = 671 intensities over corresponding natural abundance m/z= 664 intensities in treated cells indicates robust biosynthetic throughput to NAD+ through the NRH pathway relative to non-NRH biosynthetic pathways. These data correlate to large increases in NAD+ concentrations arising from NRH treatment35.
Discovery of NRH kinase
In order to identify the kinase responsible for NRH conversion to NMNH, we performed cell fractionations to enrich for the responsible NRH kinase. With the convenience of a functional lysate-based assay to detect NRH to NMNH activity (Figure 1a), we could track the protein responsible for the activity during fractionation process. The overall fractionation scheme is shown in Figure 2a. Neuro2a lysates were dialyzed in 25 mM Tris buffer at pH 8.5 and then fractionated by gravity elution on Q sepharose with increasing concentrations of NaCl, 10, 50, 100 mM at pH 8.5. Subsequent elutions at 100 mM NaCl pH 7.8 and 100 mM NaCl pH 7.0 followed. 250 mM, 500 mM and 1 M NaCl in pH 7.0 buffer elutions completed the fractionation. Active fractions eluted primarily at 100 mM NaCl pH 8.5 and 100 mM NaCl pH 7.8 (Figure 2b).
Figure 2.

Identification of the NRH kinase. a) Scheme of enzyme identification procedures. b) Activities of NRH kinase active fractions from Q sepharose-separated Neuro2a lysate. Experiments were repeated independently 3 times with similar results. c) To identify the fraction with highest NMNH converting ability, equal volume of eluants from FPLC separation (See text for more information) were incubated with 2 mM NRH, 2 mM ATP/Mg2+ in pH 8.5 phosphate buffer at 37°C for 30 min and the product NMNH was quantified on HPLC. Percentage conversion was calculated by the area-under-curve quantification of NMNH peak divided by the sum of NMNH and NRH peak areas at 340 nm. Experiments were repeated independently 3 times with similar results. d) Silver-staining of SDS-PAGE gel of fraction 15 and adjacent fractions from FPLC separation shows size distribution and relative abundance of proteins. e) Proteomics-assisted analysis reveals the most abundant kinases from the top 200 abundant enzymes in fraction 15. Bolded enzymes were selected for testing. f) NMNH forming activities of the candidate kinases (0.25 μg enzyme incubated with 2 mM NRH, 2 mM ATP/Mg2+ in pH 8.5 phosphate buffer at 37°C for 30 min). Experiments were repeated independently 3 times with similar results. Controls for positive activities of kinases are in Figure S3.
The kinase-enriched fractions were pooled, and fractionated next on an Enrich 650 FPLC column which separates proteins based on size. Different fractions contained different molecular weight distributions. Fraction 15 from the FPLC process contained proteins with a mean protein MW of 30 ± 10 kd and was enriched for NRH kinase activity, as measured by HPLC assay (Figures 2c and 2d). Fraction 15 was at least 6 times more active than base-line fractions (Figure 2c inset) and twice as active as fraction 14, which also contained NRH kinase activity. Fraction 15 was submitted to proteolytic digestion and LCMS identification of individual proteins. A partial list of the top kinase hits in the protein mixture is shown in Figure 2e (Supplementary Table 1). Several candidate kinases (bolded in Figure 2e) were tested for NRH kinase activity and only AK provided measureable NRH kinase activity to form NMNH (Figure 2f and Figure S3). AK has broad substrate specificity37, and we considered it likely that it could be required as a kinase for NRH conversion to NAD+.
Human AK cDNA was obtained from HEK293 cells and used to construct an AK overexpression vector in pcDNA 3.1 (pcDNA 3.1-AK) with a CMV promoter for overexpressing proteins in mammalian cells. Transfected pcDNA 3.1-AK provided increased AK protein expression in both Neuro2a cells and HEK293 cells as shown by western blots (Figure 3a). HEK293 cell lysates overexpressing AK had increased NRH kinase activity versus wildtype HEK293 cells as determined by conversion of NRH to NMNH (Figure 3b). Overexpression of AK increased NRH kinase activity but did not NRH-induced NAD+ concentrations in HEK293 and Neuro2a cells (Figure 3c). Overexpression of AK had no impact on cellular NAD+ concentrations without NRH exposure (Figure 3c).
Figure 3.

Characterization of AK as an NRH kinase. a) Western blot showing overexpression of human AK in Neuro2a and HEK293 cells with pcDNA3.1 AK vector. b) AK overexpressing lysate in HEK293 cells produces more NMNH than wildtype HEK293 lysate. Experiments were repeated independently 3 times with similar results. c) AK overexpression in HEK293 and Neuro2a cells treated with 1 mM NRH for 6 hr. Data expressed as mean ± SD, n=4 biologically independent samples. In b) & c), one-way ANOVA and Tukey’s multiple comparison test were used for statistical analysis, * indicates p<0.0001; n.s. indicates p>0.05. d) AK overexpressing cell lysate in HEK293 cells have NRH kinase active fractions co-eluting with AK after Q sepharose separation. Bottom panel shows western blots for AK in different fractions. Experiment was repeated independently 2 times with similar results. e) Kinetic parameters of recombinant human AK enzyme with NRH as a substrate. n=2 independent experiments. Data is plotted and fit to Michaelis-Menton equation. f) Substrate competition test of AK with NRH and Adenosine (Ado). Addition of 2 mM Ado in the reaction inhibited the NMNH production from 1 mM NRH using 0.5 ug recombinant human AK, with 2 mM ATP/Mg2+ in pH 7.4 phosphate buffer. Experiments were repeated independently 2 times with similar results.
Given that AK overexpression increased NRH kinase activity in lysates, we wondered if the activity is traceable to AK itself, and whether overexpressed AK would co-elute with fractions containing NRH kinase activity in previous fractionation studies. Thus, we subjected AK overexpression lysates (HEK293) to Q-sepharose fractionation (as in Figure 2a). The peak of NRH kinase activity was correspondent to 100 mM NaCl pH 8.5, pH 7.8 and pH 7 as previously observed from native Neuro2a lysates (Figure 2b and Figure 3d). Western blots confirmed that overexpressed AK was eluted in these fractions (Figure 3d). The identity of the mouse and human AK enzymes is 91% (BLAST NCBI), with predicted pI values of 5.85 and 6.23 (Protparam EXPASY) respectively, so co-elution of human AK and mouse AK is probable. The fact that AK protein elution corresponds with NRH kinase activity supports the conclusion that AK is responsible for the NRH kinase activity observed in Neuro2a cells and HEK293 cells.
To unequivocally confirm that AK has NRH kinase activity, we tested recombinant purified AK for NRH conversion to NMNH and detected robust catalytic activity. At 2 mM ATP and varying NRH concentrations, we determined kinetic parameters for the steady-state conversion of NRH to NMNH catalyzed by AK with Km (NRH) = 380 ± 34 μM, and kcat = 1.4 s−1 (Figure 3e). The Km value agrees very well with the apparent value measured in Neuro2a lysate (440 ± 71 μM). This result confirms that NRH is a good substrate for AK, based on kinetic parameters, and is correspondent to NRH kinase properties inferred from lysate measurements. We evaluated if adenosine and NRH bind competitively, to address if NRH binds to the adenosine binding pocket. Addition of adenosine at a concentration of 2 mM caused full inhibition of NRH kinase activity (Figure 3f).
Inhibition of NRH kinase effects on NAD+ concentration enhancement
Data establishing that AK possesses the biochemical properties of the NRH kinase identified in Neuro2a lysates led us to investigate if AK is required for the NAD+ concentration enhancing effects of NRH in cells. We employed known pharmacologic inhibitors of AK to assess this question. The compound 5-iodo-tubercidin (5-Itu; structure in Extended Data Figure 2) is known to inhibit human AK activity with reported IC50 = 26 nM38. Treatment with NRH at 1 mM concentration provided a robust 4.6-fold increase in NAD+ concentrations in HEK293 cells (Figure 4a). 5-Itu treatment alone, at a concentration of 26 nM did not change NAD+ concentrations versus controls. However, 5-Itu combined with NRH treatment abolished the majority of the NAD+ concentration enhancing effect of NRH. In the same experiments, 5-Itu did not alter 1 mM NR-induced NAD+ concentration raising effects which were approximately 1.6 fold over controls. NRH in combination with 5-Itu was similar to the effect of NR or NR with 5-Itu. These results indicate that the majority of NRH effect on NAD+ concentrations is dependent upon AK activity. Moreover, 5-Itu did not affect NAD+ homeostasis or NR-dependent NAD+ concentration enhancement.
Figure 4.

Pharmacology of AK inhibitors on NRH kinase activity and on NAD+ concentration enhancement. HEK293 cells treated with AK inhibitors, a) 5-Itu (26 nM) or b) ABT702 (20 nM), abolished NRH (1 mM) effect in NAD+ concentration enhancement, whereas the inhibitors do not affect NR (1 mM) action. Neuro2a cells treated with c) 5-Itu (26 nM) or d) ABT702 (20 nM) lose majority of NRH (1 mM) effect on NAD+ concentration enhancement. e) & f) 5-Itu and ABT702 inhibit NRH (1 mM) effect on NAD+ concentration increase in HepG2 and C2C12 cells. Data expressed as mean ± SD, n = 4 or 6 biologically independent samples. One-way ANOVA and Tukey’s multiple comparison test were used for statistical analysis, *, p<0.0001 when compared to control or within indicated groups. g) 5-Itu and h) ABT702 inhibit Neuro2a lysate NRH kinase activity as they reduce production of NMNH in a dose-dependent manner. i) AK overexpressed HEK293 cell lysates have NRH kinase activity which is inhibited by 5-Itu or ABT702. Experiments were repeated independently 3 times with similar results.
To further validate these effects, a second AK inhibitor called ABT702 (structure in Extended Data Figure 2) was employed. ABT702 inhibits AK with an IC50 of 1.7 nM39. As shown in Figure 4b, 20 nM ABT702 administered to HEK293 cells abolished the majority of the effect of 1 mM NRH treatment on NAD+ concentration enhancement, going from 4.4-fold to 1.9-fold with ABT702 treatment. ABT702 had no impact on resting NAD+ concentrations. Cells treated with 1 mM NR were not affected by ABT702 treatment. Concentrations of NAD+ from NR treatment were similar to NAD+ concentrations provided by NRH and ABT702 treatment. We evaluated both ABT702 and 5-Itu on Neuro2a cells as well. As shown in Figure 4c, Neuro2a responses to NRH treatment provided substantial NAD+ concentration increases up to 10-fold over control values. Neither ABT702 nor 5-Itu significantly altered baseline NAD+ concentrations in Neuro2a cells. Co-treatment of 5-Itu with NRH (Figure 4c) or ABT702 with NRH (Figure 4d) resulted in substantial loss of the NAD+ concentration enhancement caused by NRH, leading to only 2 fold increases. These increases were similar to increases caused by NR. Neither ABT702 nor 5-Itu had any effect on NR effects on Neuro2a cells. These results, obtained by application of AK inhibitors ABT702 and 5-Itu, show that pharmacologic inhibition of AK abolishes the bulk of effects of NRH on cellular NAD+ enhancement, strongly indicating that NRH conversion to NMNH mediated by AK activity is required for NRH effects. Similar effects with both ABT702 and 5-Itu were also observed for HepG2 and C2C12 cells (Figure 4e and 4f).
These findings, showing that AK inhibitors abolish the major effects of NRH, implicate AK as the mediator for NRH metabolism leading to biosynthesis of NAD+ in cells. We assayed NRH kinase activity in Neuro2a cells, or in HEK293 cells with overexpression of AK. If NRH kinase activity is indeed mediated by AK, then inhibitors should prevent NRH from being phosphorylated to NMNH in lysates. As shown in Figure 4g increasing concentrations of 5-Itu inhibited NRH kinase activity of Neuro2a lysates with partial inhibition at the lowest concentration of 26 nM and nearly complete inhibition achievable at 2.6 μM. Similarly, increasing concentrations of ABT702 (Figure 4h) inhibited NRH kinase activity, with nearly complete inhibition observed at 200 nM of inhibitor. Similar findings were obtained in HEK293 lysates overexpressing AK. Although slightly higher concentrations of inhibitor were used in these experiments both 5-Itu (Figure 4i) and ABT702 (Figure 4i) inhibited NRH kinase activity, which is increased by AK overexpression in HEK293 cells (Figure 3b). These results establish that NRH kinase activity is a target of both 5-Itu and ABT702 consistent with identification of AK as the enzyme with NRH kinase activity. These findings strongly indicate the inhibitory effects of 5-Itu and ABT702 on NRH-induced NAD+ concentration enhancement in cells are due to inhibition of AK, preventing conversion of NRH to NMNH.
AK KO ablates NRH kinase and NRH effects on NAD+ biosynthesis
Although inhibitors are powerful tools, they have the potential for off-target effects. To more unequivocally identify AK activity as responsible for NRH effects in increasing NAD+ concentrations in mammalian cells we used genetically modified cells with knockout of AK. We obtained HAP1 wildtype (WT) and HAP1 AK KO cells as a means to test for the requirement of AK for NRH effects. Loss of AK expression from these cells was confirmed by protein blots. As shown in Figure 5a, HAP1 WT cells exhibit detectable AK expression, whereas HAP1 AK KO cells do not have detectable AK in western blots. This result confirms successful genetic ablation of AK in these cells. Treatment of HAP1 WT cells with NRH causes significant increases in NAD+ concentrations of at least 6-fold. The effect of NRH is substantially inhibited by co-treatment with 5-Itu (Figure 5b). Treatment of HAP1 AK KO cells with NRH caused NAD+ concentration increases to rise to only about 2-fold. This NAD+ concentration increase is similar to the increase observed in HAP1 WT cells treated with 5-Itu. Treatment of HAP1 AK KO cells with both NRH and 5-Itu provided no change from NRH treatment alone (Figure 5b). Similar studies were performed using ABT702 as the AK inhibitor. Again, ABT702 inhibited the majority of the effect of NRH on NAD+ concentration enhancement in HAP1 WT cells, but did not affect the resting NAD+ concentrations in untreated cells and did not alter NRH effects in AK KO cells (Figure 5c). These data show that AK activity is required for the majority of the effect of NRH on NAD+ enhancement in HAP1 cells.
Figure 5.

HAP1 AK KO cells lack NRH kinase activity. a) HAP1 AK KO cells lose AK protein expression. Experiments were repeated independently 2 times with similar results. b) & c) 1 mM NRH raises NAD+ levels in wildtype HAP1 cells, and the increase is abolished with AK inhibitors 5-Itu (26 nM) or ABT702 (20 nM). AK KO cells have significantly diminished NRH-induced NAD+ enhancement as compared to wildtype, 5-Itu or ABT702 have not further reduced NAD+ levels in NRH-treated AK KO cells. Data expressed as mean ± SD, n=4 biologically independent samples. *, p<0.0001. d) & e) 250 μM NRH protects wildtype HAP1 cells from 500 μM HP-induced cytotoxicity shown by increased survival (d), correlated to increase of NAD+ levels (e), whereas NR at the same concentration does not significantly improve survival with minimal NAD+ preservation against HP. Nampt inhibitor FK866 (400 nM) further reduces NAD+ concentration in cells and aggravates cell death upon HP treatment, without interfering with cell rescuing effect of NRH. Data expressed as mean ± SD, n=4 biologically independent samples. *, p<0.0001. f) NRH kinase activity can be detected in wildtype HAP1 cell lysate, but not in HAP1 AK KO lysates. g) HAP1 WT lysate NRH kinase activity can be inhibited with 5-Itu or ABT702. For f) & g) experiments were repeated independently 3 times with similar results. h) HAP1 AK KO cells do not interfere with NR activity as 1 mM NR raised NAD+ concentration by 2-fold in both HAP1 WT and AK KO cells. Data expressed as mean ± SD, n=6 biologically independent samples. *, p<0.001. i) & j) NRH effect does not require Nrk1 activity, as 1 mM NRH protects HAP1 Nrk1 KO cells from 500 μM HP-induced cell death (i) by elevating cellular NAD+ levels (j), whereas 1 mM NR fails to rescue cells and NAD+ concentrations in HAP1 Nrk1 KO cells. Data expressed as mean ± SD, n=8 biologically independent samples. *, p<0.0001. For b) to e), i) & j), one-way ANOVA and Tukey’s multiple comparison test were used for statistical analysis; for h) unpaired t-test was used.
In order to evaluate if NAD+ biosynthesis from NRH can rescue cells from reactive oxygen stress, which can deplete NAD+, we treated HAP1 WT cells with 500 μM hydrogen peroxide (HP) for 6 hr. Controls experienced an 80% reduction in viable cells after the treatment (Figure 5d). Furthermore, cells treated with HP and Nampt inhibitor FK866 experienced even greater reduction in cell viability because they cannot resynthesize nicotinamide into NAD+, so their cell viability falls to almost zero percent survival (Figure 5d). Examining relative NAD+ levels, HP treatment causes loss of nearly all NAD+ from cells, with more severe NAD+ depletion occurring in FK866 and HP treated cells (Figure 5e). On the other hand, treatment of 250 μM NRH together with HP or HP+FK866 causes rescue of cells, to approximately 50% cell survival in both cases (Figure 5d). NAD+ concentrations were 4-fold elevated versus controls in both instances, and similar to NRH treatment alone (Figure 5e). Comparing NR at the same concentration, we found NR provides improved survival but not to the extent of NRH. NAD+ concentration was slightly increased in NR treatment with HP, but not as high as controls and only modestly higher than HP treatment alone (Figure 5e). NR+FK866 in combination provided no improvements in survival or NAD+ concentrations versus HP +FK866 alone (Figure 5d and 5e). NR could not rescue NAD+ concentrations in HP + FK866 treated samples. Taken collectively, these data support the interpretation that NRH effect on NAD+ concentrations is independent from Nampt, which recycles nicotinamide. Furthermore, NRH acts in a superior manner to NR at similar concentrations, consistent with an independent mechanism of action.
Both AK inhibitor data and genetic KO data show that NRH action on cellular NAD+ concentrations is AK dependent. Looking at HAP1 lysates for NRH kinase activity, WT lysate supports NMNH formation in the presence of added ATP as previously reported35. The corresponding HAP1 AK KO lysate completely lacks NRH kinase activity (Figure 5f). This is an important finding as it implies that the sole measurable NRH kinase activity in this cell line is provided by AK. Moreover, consistent with Neuro2a and HEK293 cells, HAP1 WT NRH kinase activity is sensitive to inhibitors 5-Itu and ABT702 (Figure 5g). These data recapitulate effects observed for AK inhibitors 5-Itu and ABT702 on Neuro2a and HEK293 cells and lysates.
The data obtained in HAP1 cells supports the interpretation that AK serves specifically as an NRH kinase and is not acting to modify NR activity. Thus, we hypothesized that AK KO would have no impact on NR effects on these cells. Figure 5h shows that NR induces NAD+ concentration increases in HAP1 WT and HAP1 KO cells of approximately 2–2.4-fold. These results show that AK expression/non-expression has no impact on NR-induced NAD+ enhancement effects, as expected. Conversely, in HP challenge, 1 mM NRH is effective in HAP1 Nrk1 KO cells (Figure 5i and j), but NR cannot rescue viability (Figure 5i) or NAD+ concentrations (Figure 5j) in HAP1 Nrk1 KO cells. This result is consistent with our prior studies showing that NR effects require Nrk1 in this cell line and that NRH does not require Nrk1 for activity35. This data is consistent with our interpretation that NRH acts independently of NR in these cells and that NR requires Nrk1 activity, not AK activity for its effects.
Incorporation of NRH into NAD+ and dependence on NRH kinase activity
We showed that the molecular structure of NRH is incorporated intact into NAD+ in both Neuro2a cells and in HEK293 cells as shown by formation of [carbonyl-18O, U-ribosyl-13C]NAD+ upon treatment of cells with [carbonyl-18O, U-ribosyl-13C]NRH (Figure 1e and 1f). To probe for the requirement of AK for this biosynthetic transformation, we synthesized [carbonyl-14C]NRH (Figure 6a) to measure NRH incorporation into NAD+ in HAP1 WT cells. Treatment of HAP1 WT cells with [carbonyl-14C]NRH resulted in significant incorporation of radiolabel into NAD+ (Figure 6b). However, when the same quantity of [carbonyl-14C]NRH was added to HAP1 AK KO cells, approximately 80% of radiolabel was no longer incorporated into [carbonyl-14C]NAD+ (Figure 6b). This result shows that AK genetic ablation compromises the NAD+ incorporation of the nicotinamide moiety of NRH. HAP1 Nrk1 KO cells also can incorporate 14C-NRH efficiently, similar to WT. The incorporation into both cell lines is sensitive to 5-Itu and ABT702, which causes up to 3–4-fold reductions in observed 14C incorporation into NAD+ (Figure 6c). These data support the conclusion that the nicotinamide moiety of NRH requires AK activity but not Nrk1 activity to be efficiently incorporated into NAD+. Similar results were obtained in Neuro2a cells (Figure 6d). [carbonyl-14C]NRH was incorporated to form [carbonyl-14C]NAD+ in these cells. Upon application of either 5-Itu or ABT702, the majority of radio-incorporation to [carbonyl-14C]NAD+ was inhibited. The radio-incorporation of [carbonyl-14C]NRH into Neuro2a cells with AK inhibition is similar to the radio-incorporation of [carbonyl-14C]NR into [carbonyl-14C]NAD+ applied under identical conditions (Figure 6d).
Figure 6.

NRH is incorporated into NAD+ dependent upon AK activity a) Chemical structure of [carbonyl-14C]NRH. b) Radioactivity incorporation from 150 μM [carbonyl-14C]NRH into [carbonyl-14C]NAD+ is significantly abolished in HAP1 AK KO cells comparing to wildtype HAP1 cells. Data expressed as mean ± SD, n=4 biologically independent samples. *, p<0.0001 when compared to WT. c) HAP1 WT and Nrk1 KO cells were treated with 150 μM [carbonyl-14C]-NRH with or without the presence of 26 nM 5-Itu or 20 nM ABT702. Radioactivity incorporations into [carbonyl-14C]NAD+ are shown. Data expressed as mean ± SD, n=2 or 4 biologically independent samples. *, p<0.0001 when compared to 14C-NRH treatment within cell type. d) Radioactivity incorporation from 150 μM [carbonyl-14C]NRH into [carbonyl-14C]NAD in Neuro2a cells is inhibited by treatments with AK inhibitors, 26 nM 5-Itu or 20 nM ABT702. [carbonyl-14C]NR was also treated with matching radioactivity, concentration and incubation time. Data expressed as mean ± SD, n=4 biologically independent samples. *, p<0.0001 when compared to [carbonyl-14C]-NRH treatment. For b) c) d), one-way ANOVA and Tukey’s multiple comparison test were used for statistical analysis. e) HAP1 WT and f) HAP1 AK KO cell treated with vehicle or [carbonyl-18O, U-ribosyl-13C]NRH (300 μM) for 7 hr and the isolated NAD+ analyzed by LCMS. Intensities for different observed peaks with different masses (negative ion mode) are displayed. Endogenous NAD+ not containing isotopes has m/z = 662. [carbonyl-18O, U-ribosyl-13C]NAD+ is peak with m/z = 669. n=2 biologically independent samples.
Radiolabeling is effective to demonstrate NRH incorporation into NAD+, but since the label is in the carbonyl moiety of nicotinamide, it does not fully report on the different moieties of NRH and how they incorporate into the NAD+ molecule. To address the requirement of AK for full incorporation of the nucleoside structure of NRH into NAD+, we employed [carbonyl-18O, U-ribosyl-13C]NRH on HAP1 WT and AK KO cells. As shown in Figure 6e and 6f, the majority of NAD+ taken from untreated cells has label at 662 (negative ion mode detection), consistent with a chemical NAD+ standard and the predominant NAD+ peak in controls not treated with isotope (Figure 6e and Supplementary Figure 2). There was no measurable 669 signal in either control cell NAD+ or a standard spectrum of NAD+ (Figure 6e and Supplementary Figure 2). Isotope-treated HAP1 WT cells presented a dominant m/z = 669 intensity peak (Δ m/z = +7 versus unlabeled NAD+, Figure 6e) in the MS spectrum for NAD+, exceeding 3500 percent above the natural abundance NAD+ (m/z = 662, normalized to 100 %), indicating the vast majority of NAD+ is synthesized via [carbonyl-18O, U-ribosyl-13C]NRH incorporation. Thus, in HAP1 WT cells, the vast majority of NAD+ is derived from NRH-mediated biosynthesis into NAD+ consistent with the impressive NAD+ concentration enhancing characteristics of NRH. These data are consistent with observations made with radiolabeled compound on Neuro2a and HEK293 cells (Figure 1e and 1f).
To investigate the effect of deletion of AK, we added [carbonyl-18O, U-ribosyl-13C]NRH to HAP1 AK KO cells and determined that the incorporation of intact NRH (m/z = 669, negative ion) dropped more than 80 fold from the incorporation observed in WT and the signal for it became less than the endogenous NAD+ signal which is normalized to 100% (Figure 6f). Thus the 669/662 ratio goes from approximately 35 in WT cells and reverses to approximately 0.3 in HAP1 AK KO cells. The data shows that the majority of NRH-incorporation into NAD+ requires AK activity. Consistent with our findings from radiolabel, some amount of isotope from nicotinamide arising from NRH can be incorporated into NAD+ via nicotinamide salvage (m/z =664), but the amount is barely greater than control. The residual NRH nucleoside NAD+ biosynthesis in AK KO cells could reflect a minor pathway of NRH to NR oxidation in cells (Extended Data Figure 2b, bottom pathway) or could reflect a minor conversion of NRH to NMNH by an unknown kinase. Nevertheless, in this case the amount of residual is less than 1 % of WT. In summary, AK activity controls the majority of NRH incorporation into NAD+ as determined by isotopic approaches. This incorporation is sensitive to either pharmacologic or genetic inhibition of AK activity.
Biosynthetic Steps from NMNH to NAD+ in Cells
Isotope-labeling data, taking into account the effects of genetic knockout of AK or chemical inhibition of AK, supports the interpretation that AK-mediated NMNH formation is on the pathway for NRH-induced NAD+ biosynthesis. These findings are consistent with prior work showing the NRH induced NAD+ concentration raising effects are Nrk1 independent whereas NR concentration enhancing effects are Nrk1 dependent35. We considered the most likely mechanism for NMNH conversion to NAD+ is via direct conversion to NADH prior to oxidation to NAD+ (Extended Data Figure 2b). It is known that the adenylating enzymes nicotinamide mononucleotide adenylyltransferases Nmnat1, Nmnat 2 and Nmnat 3 reversibly react ATP with NMN5 and NMNH40 to form the corresponding dinucleotides5,40 and inorganic pyrophosphate5,40 (Figure 7a). We reasoned that if NMNH is converted to NADH, then incubation of lysates with NADH should also form NMNH due to the reversibility of the NADH biosynthetic step (Figure 7a). We found that Neuro2a lysate incubated with NADH or NADH plus pyrophosphate led to similar production of NMNH by breakdown of NADH (Figure 7b). When ATP was added in the absence of pyrophosphate, a reversal of this process was observed, wherein NADH become the dominant product, consistent with Nmnat catalyzed reversal of NMNH formation to reform NADH (Figure 7b). This interpretation is solidified by the observation that ATP and pyrophosphate added together causes NMNH to re-increase by virtue of the mass action effect of pyrophosphate to drive the Nmnat reaction back to the mononucleotides (Figure 7b).
Figure 7.

NMNH is a metabolite on biosynthetic pathway toward NADH and NAD+. a) Forward and reverse reactions of the interconversion of NMNH to NADH. b) NMNH is produced from NADH with Neuro2a cell lysate with and without addition of added pyrophosphate and Mg+2. = With the addition of ATP, NADH production and reduced production of NMNH occurs. Addition of 2 mM pyrophosphate (PPi) and 5 mM ATP increases NMNH production from NADH. Right panel shows area-under-curve quantifications for NMNH and NADH at 340 nm wavelength in Neuro2a lysate reactions with 2 mM NADH, 5 mM ATP/Mg2+, with or without 2 mM PPi. Data expressed as mean ± SD, n=5 biologically independent samples. *, p<0.0001 with unpaired t-test analysis. c) Putative NMNH pathways to NAD+ with NMN as an intermediate to NAD+ (Path A) and independent of NMN as an intermediate (Path B). d) Radioactive distribution of [carbonyl-14C]NMN, [carbonyl-14C]NMNH, [carbonyl-14C]NRH and [carbonyl-14C]NAD, after reaction where 50 μM [carbonyl-14C]NRH (20000 cpm) was incubated with 500 μM NMN, recombinant human AK and 2 mM ATP/Mg2+ for 30 min, then incubated with Neuro2a lysate for another 75 min. HPLC and scintillation counting as described in methods was used for quantitation. Controls is for 50 μM [carbonyl-14C]NRH (20,000 CPM) with no addition of AK and no cell lysate. n=2 independent experiments. e) Liver lysate from mouse has NRH kinase activity and this activity is inhibited by added ABT702. Experiments were repeated independently 3 times with similar results.
While consistent with the idea that NMNH is likely to form NADH, we sought to show that NMNH reaches NAD+ independently of the formation of NMN in lysates (Extended Data Figure 2b). We incubated [carbonyl-14C]NRH with recombinant AK, ATP and 500 μM NMN for 30 min to accumulate NMNH, then added Neuro2a lysate for 1 hr. As depicted in Figure 7c, we considered two possible fates from the [carbonyl-14C]NMNH formed. If Path A is operative to form NAD+, radiolabel can accumulate first into NMN, then subsequently accumulate into NAD+. Because excess unlabeled NMN was added, counts will accumulate preferentially into [carbonyl-14C]NMN rather than [carbonyl-14C]NAD+, as long as the majority of excess NMN is unconsumed during the reaction. Conversely, if Path B is operative, then [carbonyl-14C]NAD+ forms independently of [carbonyl-14C]NMN and added NMN will not capture counts that would later accumulate into NAD+. Moreover, NMN should have fewer counts than in NAD+. The results show that NMN was largely unconsumed in reaction, as determined by HPLC chromatograms. The eluent containing the NMN peak has approximately 3-fold fewer accumulated counts relative to NAD+ counts (Figure 7d). These data indicate that the majority of [carbonyl-14C]NAD+ is made independently of [carbonyl-14C]NMN. Collectively, these results implicate a direct NMNH to NADH conversion as responsible for the bulk of NAD+ biosynthesis, consistent with Path B. The full salvage pathway for NRH to NAD+ is shown in the shaded portion of Extended Data Figure 2b.
In vivo studies
To establish broader relevance for the mechanistic investigations implicating AK as responsible for metabolism of NRH to NAD+, we investigated if NRH kinase activity could be measured in liver lysates derived from C57BL/6N mice. Figure 7e shows that NRH is readily converted to NMNH in fresh liver lysates. Addition of 200 nM or 2 μM ABT702 causes dose-dependent inhibition of this activity in these lysates, with nearly complete inhibition of NRH kinase activity at 2 μM. These findings establish that NRH kinase activity is measureable in liver lysates and is sensitive to ABT702 added to lysate. This result led us to investigate if AK inhibition provided by pharmacologic use of ABT702 could interfere with NRH metabolism to NAD+ in living mice.
We injected 6 groups of C57BL/6N mice (n = 5) with either vehicle, NRH (250 mg/kg) or NR (250 mg/kg) with or without ABT 702 (3mg/kg). As shown in Figure 8a, NRH at a dose of 250 mg/kg causes over 5-fold increase in NAD+ concentration in liver at 2 hr. NR at the same dose and time only increases liver NAD+ concentration by 1.5-fold. On the other hand, ABT702 treatment with NRH caused NAD+ concentrations to be reduced by 53%, although higher than control. ABT702 alone had no impact on NAD+ concentrations. ABT702 treatment had no effect on NR NAD+ concentration enhancement. These data indicate that inhibition of AK in vivo prevents the bulk of NRH-induced NAD+ concentration enhancing effects. To validate that ABT702 acts as an NRH kinase inhibitor in vivo, we isolated liver lysates from control and ABT702 treated mice and measured NRH kinase activity. As shown in HPLC chromatograms (Figure 8b), the majority of the NRH kinase activity is inhibited in these lysates by injected ABT702. The quantification of all reactions from control and ABT702 treated group is shown in Figure 8b.
Figure 8.

AK inhibitor antagonizes NRH impacts in mouse liver. Adult male C57BL/6N mice (n = 5) received 250 mg/kg NRH or NR with or without 3 mg/kg ABT702 through IP injection, and sacrificed after 2 hr. a) NAD+ concentrations in mice livers measured by cycling assay. Data expressed as mean±SD, n=5 animals. $, p= 0.0371 in Ctrl vs. ABT702+NR; #, p=0.0011 in ABT702+NRH vs. ABT702+NR; *, p<0.0001 when compared to control or within indicated groups through one-way ANOVA and Tukey’s multiple comparison test. b) Protein lysates from Control and ABT702 treated livers were extracted and 30 μg of protein were incubated with 1 mM NRH, 1 mM ATP/Mg2+ in pH 8.5 phosphate buffer at 37°C for 30 min. Left panel shows representative HPLC chromatograms at 340 nm, right panel shows the quantification of NMNH producing specific activities of the protein lysates. Data expressed as mean±SD, n=5 animals. *, p<0.0001 through unpaired t-test analysis. c) Metabolomic analyses of nicotinamide derivative compounds in livers of control and NRH groups with or without ABT702 treatment. d) Mass-spectrum intensity of adenosine in mice livers of control and NRH groups with or without ABT702 treatment. Data expressed as mean±SD, n=5 animals. p values have either been specified or labeled with * if p<0.0001 when compared to control or within indicated groups through one-way ANOVA and Tukey’s multiple comparison test. e) Western blot of ADP-ribosylation in livers of control or NRH treated groups with or without ABT702 indicating activation of downstream NAD+ signaling. Positive control (+ve ctl) is defined in Reporting Summary. Right panel shows densitometry of the total ADP-ribosylation over α-tubulin. Data expressed as mean±SD, n=3 animals.
To better assess for the metabolic consequences of NRH and ABT702 treatment, we isolated metabolites from livers in these mice, and quantitated them including NRH, NR, NMN, nicotinamide, NAD+, nicotinic acid, NaMN, NaAD, 1-N-methylnicotinamide and NADH. These data are shown in Figure 8c. The first interesting observation is that NRH itself was detectable in all samples, confirming that NRH is a natural endogenous metabolite. Furthermore, NRH concentrations increased in NRH-treated livers. In addition, NR, NMN, NAD+, NaMN, NaAD, NADH all increase with NRH treatment, and all of these were reduced by ABT702 +NRH treatment (except NADH) showing that most downstream metabolites that increase with NRH treatment depend upon AK activity. Interestingly nicotinamide concentrations were fairly constant across all groups. Validating the effect of ABT702, adenosine concentrations increased several fold in ABT702 and ABT702 + NRH treated samples (Figure 8d). However, ABT702 by itself had no significant impact on any of the relevant NAD+ metabolites except for nicotinic acid versus untreated controls.
Finally, we blotted for poly-ADPribosylation (PAR) of proteins in liver as a measure of NAD+ signaling. As shown in Figure 8e, treatment with NRH increases PAR accumulation in liver at 2 hr, but this effect is ablated when ABT702 is co-administered with NRH. These data support the interpretation that in liver of mice NRH action in stimulation of PAR accumulation is dependent upon AK activity, and that pharmacologic inhibition of AK leads to attenuation of NRH effects on downstream NAD+ signaling.
DISCUSSION
In this manuscript we investigated the biochemical basis for NRH to stimulate large NAD+ accumulations in mammalian cells and tissues35 in some cases reaching 1000 % of untreated controls. We hypothesized that this effect was due to a kinase-dependent activity which converts NRH to the intermediate NMNH. This hypothesis is based on prior investigative work by our laboratory showing that cell lysates have robust NRH kinase activity35. Isotope labeling of NRH in the form of [carbonyl-18O, U-ribosyl-13C]NRH confirmed that NRH is incorporated intact into Neuro2a and HEK293 cells. Isotope labels from both chemical fragments are incorporated almost equally into cellular NAD+ indicating NRH is incorporated largely intact and is not split into separate chemical moieties (Figure 1e and 1f). These findings suggest an unknown transport mechanism which moves the NRH molecule intact from the extracellular milieu to the intracellular milieu. It is possible that a universally expressed NRH-specific transporter is involved in this process, as we have demonstrated that NRH is effective in a broad range of mammalian cell lines and raises NAD+ concentrations in multiple tissues including liver, kidney, adipose and brain, in mice following IP injection35. It is not likely related to a recently described NMN transporter41, but this will require additional experimental clarification. The majority of the NAD+ isolated and analyzed from cells treated with 1 mM [carbonyl-18O, U-ribosyl-13C]NRH incorporated all isotopic labels (relative to endogenous unlabeled NAD+). This data established that NRH is incorporated intact into NAD+ as a biosynthetic precursor. The isotope data shows that NRH initiated biosynthetic pathway is generating much more NAD+ than other NAD+ biosynthetic pathways. Thus, observed NAD+ concentration enhancements attained by NRH treatments are attributable to significantly enhanced NAD+ biosynthesis originating from NRH.
A kinase responsible for NRH conversion to NMNH was identified by cell lysate protein fractionations. Neuro2a cell lysates had robust NRH kinase activity which allowed us to identify and quantify this activity in chromatographic fractions. After two chromatographic procedures of enrichment and fractionation, proteolytic digestion and proteomic bioinformatic methods, a number of putative kinases were identified (Figure 2e). Only AK, of several kinases tested, had measureable NRH kinase activity, although other kinases were confirmed to be active on known substrates (Supplementary Figure 3). Overexpression of AK in HEK293 cells increased NRH kinase activity. Recombinant AK was shown to have NRH kinase activity with kinetic parameters agreeing well with parameters obtained from Neuro2a cell lysates (Figure 1b).
In order to test if AK activity is required for NRH effects on NAD+ concentration enhancement in cells, we exploited known pharmacologic inhibitors of AK. We showed that inhibitors such as 5-Itu and ABT702 abolished the large effects of NRH on NAD+ concentration enhancement in Neuro2a and HEK293 cells. Notably, effects did not return to control levels, but rather to concentration increases observed for NR on these cells. Nevertheless, more than 80% of the NAD+ enhancement caused by NRH treatment was lost. The effect of the inhibitors is specific for NRH kinase activity. For example, lysates of either Neuro2a or HEK293 cells overexpressing AK activity have robust NRH kinase activity but NRH kinase activity is fully inhibited with application of the inhibitors (Figures 4g-i). Thus, inhibitors of AK abolish NRH-induced NAD+ concentration enhancement as well as measured NRH kinase activity from cells. These results implicate AK as the responsible NRH kinase and indicate that this kinase activity is needed for NRH-induced effects on cellular NAD+ concentrations.
These findings were supported with genetically modified cells. HAP1 WT cells have measureable NRH kinase activity in lysates, but HAP1 AK KO cells do not (Figure 5f). HAP1 WT lysate NRH kinase activity is sensitive to 5-Itu and ABT702 (Figure 5g). When treated with NRH, HAP1 WT cells show marked NAD+ concentration increases but HAP1 AK KO lose the vast majority of NRH-induced NAD+ concentration enhancement and are reduced to concentrations seen for NR treatment. With the genetic data and pharmacologic data combined, we conclude that NRH requires AK activity to be phosphorylated to NMNH (as shown in lysates), and that this effect is required for NRH to be processed to NAD+ (as shown in cells). These effects appear to be independent of formation of NR. For example, the absence of Nrk1 activity in cells does not affect NRH-induced NAD+ increases and does not alter NRH protective effects from oxidative stress. Moreover, AK inhibition or loss of activity from genetic deletion had no effects on NR-induced NAD+ concentration enhancements, indicating that NRH acts independently of formation of NR.
Isotope labeling was used to directly show that AK activity/NRH kinase activity is required for the bulk of NAD+ biosynthesis induced from NRH exposure. We treated HAP1 WT and AK KO cells with [carbonyl-18O, U-ribosyl-13C]NRH and analyzed the NAD+ isolated from these cells. In WT cells, [carbonyl-18O, U-ribosyl-13C ]NAD+ was 35 fold higher in abundance than unlabeled endogenous NAD+ . This is consistent with very strong effects of NRH salvage in increasing NAD+ concentrations in these cells. Treatment of the corresponding HAP1 AK KO cells provided a strikingly different outcome. Unlabeled NAD+ becomes the dominant species again in these cells and [carbonyl-18O, U-ribosyl-13C ]NAD+ was reduced to 30% of the amount of endogenous NAD+. This result implies that NRH is inefficiently incorporated into NAD+ in the absence of AK, clearly implicating the requirement of AK-contributed NRH kinase activity to achieve the majority of the incorporation of the NRH structure into NAD+. The minor residual [carbonyl-18O, U-ribosyl-13C ]NAD+ signal measured in these cells we attribute to a small amount of NRH which is oxidized to NR in cells, possibly by the enzyme NQO236, which is known to use NRH as a preferred reductive substrate (Extended Data Figure 2b). Notably, we could not measure NRH kinase activity in HAP1 AK KO cells (Figure 5f). A point mutant of AK with diminished catalytic activity was not tested, either in cells or in lysates, therefore, the catalytic determinants of AK required to achieve NRH salvage still requires clarification.
We sought to determine the path from NMNH which converges to NAD+. Our studies in this respect recapitulate observations previously made, indicating that NMNH can be biosynthetically converted to NADH by Nmnat enzymes. First, we showed Neuro2a lysates could convert NADH to NMNH, as has been observed previously. This reaction has been shown to be reversible. We also showed that [carbonyl-14C]NRH in the presence of excess NMN is not accumulated in NMN, but rather accumulates independently of NMN into NAD+. The data we have obtained indicates to us the most probable active pathway for NRH mediated NAD+ biosynthesis is depicted in the shaded box in Extended Data Figure 2b. How conversions of NRH to NR and NMNH to NMN might play into NRH effects might vary in different cell lines and tissues. We will investigate these inter-conversions in future studies.
Finally, the in vitro studies were shown to be relevant to in vivo action of NRH. NRH was administered by intraperitoneal injection to mice, and co-administration of the inhibitor of AK ABT702 was able to interfere with the majority of NRH effects on NAD+ concentrations and on a number of NAD+ related metabolites which were measured from isolated livers. Consistently, treatment with AK inhibitor in vivo was shown by elevate adenosine concentrations. NRH kinase activity in ABT702 treated livers was substantially reduced showing that AK inhibition is effective and co-incident with inhibited NRH kinase activity. These findings provide in vivo correlations to cellular studies published during revision of this manuscript42, showing that the AK inhibitor, 5-Itu in AML 12 cells blunted NRH-induced increases in concentrations of NMNH, NADH, NAD+, NR and NMN. Thus, the in vivo results recapitulate the effects observed in cell culture studies and highlight the existence of AK-mediated NRH kinase dependent NAD+ biosynthesis in a living mammal.
AK had not been previously implicated in participation in NAD+ metabolism, and its role had been principally assigned to its adenosine modifying activity as reviewed recently43 and not NRH kinase activity, which is newly characterized in this manuscript. Traditionally AK had been thought as a key regulator of adenosine, and of synthesis of adenosine nucleotides. A new role acting upon NRH, which is a naturally occurring metabolite based on evidence presented in this study, expands known roles of AK into NAD+ biosynthetic activities. This is also interesting, because NAD+ breakdown leads to production of ADPribose and downstream catabolites such as AMP, which is the known product of AK action on adenosine. The importance of this newly described pathway on NAD+ homeostasis under different physiologic circumstances is unclear and there could be potential crosstalk with adenosine metabolism.
In summary, the work herein provides convincing evidence that NRH effects in a variety of cell lines is dependent upon the activity of an NRH kinase that converts NRH to NMNH as a biosynthetic intermediate. The NRH kinase is shown to be AK and is required for the potent effects of NRH as an NAD+ concentration enhancer in cells. NRH is incorporated largely intact into the chemical structure of NAD+ in cells. These findings establish the existence of a newly described NRH salvage pathway that is now added to the list of known NAD+ biosynthetic pathways in mammalian cells.
METHODS
Cell culture
HEK293, Neuro2a and C2C12 cells were purchased from ATCC and cultured in Dulbecco’s modified Eagle’s medium (DMEM) supplemented with 10% fetal bovine serum, 100 U/ml penicillin and 100 μg/ml streptomycin. HepG2 cells were purchased from ATCC and cultured in Eagle’s Minimum Essential Medium (EMEM) supplemented with 10% fetal bovine serum, 100 U/ml penicillin and 100 μg/ml streptomycin. Wildtype, AK knockout and Nrk1 knockout HAP1 cell lines were purchased from Horizon Discovery (UK) and cultured in Iscove’s Modified Dulbecco’s Medium (IMDM) with 10% fetal bovine serum, 100 U/ml penicillin and 100 μg/ml streptomycin. Cells were maintained in a humidified incubator supplied with 5% CO2/95% air at 37°C. HAP1 AK KO cells and Nrk1 KO cells were generated by a single basepair deletion in the human AK sequence or Nrk1 sequence using CRISPR Cas technology and the deletion was verified by sequencing by Horizon Discovery. Additional cell line information can be found in Reporting Summary.
Identification of compounds on HPLC
Reactions containing NMNH, NRH, NMN, NADH or NAD+ were injected onto EC 250/4.6 Nucleosil 100–5 C18 column on a Hitachi Elite Lachrom HPLC system equipped with Diode Array Detector L-2450. The column was eluted with 20 mM ammonium acetate at 1 mL/min for 40 min, then with 20 mM ammonium acetate and 20% methanol for 25 min. NMNH and NRH were characterized by peaks absorbing at 340 nm. NADH was characterized by its peaks at both 260 nm and 340 nm, while NAD+ and NMN were characterized by absorbance peaks at 260 nm. In addition, in order to separate samples containing AMP, ADP, ATP, GMP, GDP and GTP, reactions were eluted with 90% 0.1 M triethylammonium acetate (TEAA), pH 7 and 10% methanol at 1 mL/min for 75 min. Peaks were characterized at 260 nm absorbance.
NMNH conversion from NRH in Neuro2a lysates
To quantitate production of NMNH in samples, 100 μL reactions in 1.5 ml centrifuge tubes, 0.5 mM NRH in 150 mM KH2PO4 buffer at pH 9 were mixed with or without 2 mM ATP/5 mM MgCl2, with or without 30 μg of Neuro2a protein lysate prepared in lysis buffer (150 mM NaCl, 50 mM Tris-HCl, 1% Triton X-100, pH 7.5). Reactions were incubated at 37 °C for 30 min, then quenched by heating at 80 °C for 2 min. Tubes were spun to remove protein, and the supernatant for the reaction was injected onto HPLC as described above. NMNH and NRH peaks were quantified at absorbance at 340 nm.
Kinetic profiles for NRH kinase versus NRH and ATP
The kinetic parameters of NRH to NMNH reaction were characterized using Neuro2a protein lysates or recombinant human AK enzyme. In each Neuro2a lysate reaction, 30 μg total protein lysate was used. With NRH as the variable substrate its concentration was varied from 50 μM to 2 mM in the presence of 2 mM ATP, 5 mM MgCl2, and 150 mM KH2PO4 at pH 9. With ATP as the variable substrate, ATP amount in reaction varied from 50 μM to 2 mM, and MgCl2 concentrations used were 2.5 fold of the ATP concentrations. Reactions were combined with 2 mM NRH and 150 mM KH2PO4 at pH 9. In each recombinant enzyme reaction, 0.25 μg of AK was used with NRH as the variable substrate its concentration was varied from 5 μM to 2 mM, in the presence of 2 mM ATP, 5 mM MgCl2, and 150 mM KH2PO4 at pH 9. All reactions were 100 μL and incubated at 37°C for 30 min, and quenched by heating at 80° C for 2 min. After removing protein fractions by centrifugation, the supernatants were injected onto HPLC C-18 column to quantify the formation of NMNH. Rates of conversion were expressed as μmol NMNH per mg protein per second. The Michaelis Menten equation was used to fit plotted points to calculate apparent enzymatic parameters: i.e. v =Vmax[S]/[S]+ KM, where v is the rate observed for given substrate concentration, Vmax is the maximum rate for the reaction, KM is the apparent Michaelis constant and [S] is the substrate concentration. Best fit was determined with GraphPad Prism 6.
Synthesis of [carbonyl-18O, U-ribosyl-13C]NRH
20 mg [carbonyl-18O, U-ribosyl-13C]NR prepared by published synthetic method44 was reduced with Na2S2O4 (0.85 equivalents) in 1 mL 100 mM K2HPO4 buffer on ice for 5 min, and purified on C-18 column as reported35. Purity and isotopic composition of NRH was determined by HPLC and LCMS (Figure S1) and fractions containing NRH were pooled and lyophilized.
Treatment of cells with [carbonyl-18O, U-ribosyl-13C]NRH]
[carbonyl-18O, U-ribosyl-13C]NRH was added to media with 90% confluent Neuro2a or HEK293 (1 mM) cells, or HAP1 WT and HAP1 AK KO cells (300 μM) in 6 well plates. After 7 hr cells were harvested with trypsin and pelleted by centrifugation. NAD+ was extracted with 7% perchloric acid, then the neutralized with 2M NaOH and 500 mM K2HPO4 to pH 7. The NAD+ containing extracts were injected onto a C-18 column and eluted by HPLC to separate and collect the purified NAD+. Lyophilized NAD+ fractions were analyzed by LC-MS to determine the mass spectrum for NAD+ for each sample. Untreated controls and authentic NAD+ samples were also performed as above. Heights of each NAD+ m/z peak were quantified using ImageJ and the calculated in percentage relative to height of 664 peak. Chromatograms and raw intensities are provided in Supplementary information (Figure S2).
NAD+ measurement
For NAD+ measurements, cells were seeded in 6-well plates until they reached approximately 90% confluency. They were treated with 1 mM NRH or 1 mM NR from concentrated stocks dissolved in water and harvested by trypsin digestion after 6 hr treatment time, unless otherwise noted. Cell numbers were determined using hemocytometer and trypan blue staining. The harvested cells were pelleted at 3000 × g for 3 min. After removing the remaining media, cells were lysed with 7% perchloric acid to preserve NAD+, then neutralized with 2 M NaOH and 500 mM K2HPO4. The cellular NAD+ levels were measured as previously published using cycling assay45. In short, cell extracts were combined with l-lactate, lactate dehydrogenase (LDH), diaphorase, and resazurin. NAD+ reacts with lactate catalyzed by LDH to form NADH, which then binds to the enzyme diaphorase to reduce the dye resazurin to form the reduced dye resorufin. Formation of resorufin is read by fluorescence (excitation at 530 nm, emission at 580 nm) with a plate reader. Standards of known NAD+ concentration are used to generate a standard curve.
NRH kinase fractionation and enrichment in Neuro2a cell lysates
To fractionate proteins in cell lysate, Neuro2a cells were grown to confluence on a 15 cm2 plate and harvested and homogenized in lysis buffer (150 mM NaCl, 50 mM Tris-HCl, 1% Triton X-100, pH 7.5), then dialyzed in 25 mM Tris buffer at pH 8.5 for 4 hr at 4 ºC. The dialyzed lysate was the passed through a 1 ml Q sepharose gravity column, and eluted with an escalating concentration of NaCl in 25 mM Tris buffer: 10, 25, 50, 100 mM NaCl at pH 8.5, followed by 100 mM NaCl at pH 7.8 and pH 7, then 150, 250, 500 and 1000 mM NaCl at pH 7. Each fraction was eluted with a 1.5 ml volume of the corresponding buffer. The fractions were concentrated using a 2 ml 10 K Amicon® filter from Millipore by spinning for 30 min at 4000 rcf. To determine fractions containing NRH kinase activity, the concentrated fractions (from 500 ul original elutes) were incubated with 2 mM NRH, 2 mM ATP and 5 mM MgCl2 in pH 9 phosphate buffer for 30 min at 37°C, then quenched by heating for 2 min at 80 °C and subsequently injected onto HPLC to quantitate NMNH formation. Highest activities were identified in the fractions eluted with 100 mM NaCl at pH 8.5 and pH 7.8. These fractions were pooled and used without dialysis for further fractionations.
Further separation was done in the Structural Biology Resource Center at Rockefeller University on a BioRad FPLC using an Enrich 650 column with flow rate 0.5 ml/min. 0.5 ml/fractions were collected and concentrated with 10K membrane filter, from which 1/3 of total concentrated volume was used for quantitiating NRH kinase activity as described above. Fractions with highest activity were analyzed by SDS-PAGE and silver stained. The fraction with highest NRH kinase activity was analyzed by the Metabolomic and Proteomics Core of Weill Cornell Medical College to identify most abundant proteins.
Proteomic analysis
Protein samples were homogenized and denatured using 9M urea. After extraction, protein samples were subjected to reduction with dithiotreitol and alkylation with iodoacetamide before overnight tryptic digestion at 37 °C. The resulting peptides were desalted by C18 Stage-tips. Lyophilized peptides were then labeled with the tandem mass tag (TMT) reagents according to manufacturer’s protocol (catalog no. 90110, Thermo Fisher Scientific). Labeled peptides were mixed, lyophilized, desalted prior to LC-MS analysis.
A Thermo Fisher Scientific EASY-nLC 1200 coupled on-line to a Fusion Lumos mass spectrometer (Thermo Fisher Scientific) was used. Buffer A (0.1% formic acid in water) and buffer B (0.1% formic acid in 80 % acetonitrile) were used as mobile phases for gradient separation. A 75 μm I.D. column (ReproSil-Pur C18-AQ, 3 μm, Dr. Maisch GmbH, German) was packed in-house for peptides separation. Peptides were separated with a gradient of 5–10% buffer B over 1 min, 10%−35% buffer B over 229 min, and 35%−100% B over 5 min at a flow rate of 300 nL/min. The Fusion Lumos mass spectrometer was operated in data dependent mode. Full MS scans were acquired in the Orbitrap mass analyzer over a range of 400–1500 m/z with resolution 120,000 at m/z 200. Most abundant precursors were selected with an isolation window of 0.7 Thomson and fragmented by higher-energy collisional dissociation with normalized collision energy of 40. MS/MS scans were acquired in the Orbitrap mass analyzer. The automatic gain control target value was 1e6 for full scans and 5e4 for MS/MS scans respectively, and the maximum ion injection time is 54 ms for both.
The raw files were processed using the MaxQuant computational proteomics platform version 1.5.5.1 (Max Planck Institute, Munich, Germany) for protein identification. The fragmentation spectra were used to search the UniProt mouse protein database (downloaded August 22, 2016). Oxidation of methionine and protein N-terminal acetylation were used as variable modifications for database searching. The precursor and fragment mass tolerances were set to 7 and 20 ppm, respectively. Both peptide and protein identifications were filtered at 1% false discovery rate based on decoy search using a database with the protein sequences reversed. The average MW of eluted proteins was determined by averaging the MW and standard deviation of the top 12 most abundant kinases as shown in Figure 2e.
Screening for NRH kinase activity from recombinant human kinases
From the top kinases identified from the proteomic data, we purchased the following commercially available recombinant human enzymes from ProSpec: Adenylate Kinase 1 (ALK1, #PKA-316), Adenylate Kinase 2 (ALK2, #PKA-260), Adenylate Kinase 4 (ALK4, #PKA-267), Guanylate Kinase 1 (GLK1, #PKA-309), Nucleoside-diphosphate Kinase 1 (NME1, #PRO-715); and recombinant human AK (#8024-AK) from R&D Systems. To examine their NRH kinase activities, 0.25 μg enzymes were incubated with 1 mM NRH, 2 mM ATP/5 mM MgCl2 in 150 mM KH2PO4 buffer at pH 9, at 37 °C for 30 min. NMNH and NRH was analyzed on HPLC at 340 nm absorbance. To validate the kinase were active, 0.25 μg ALK1, ALK2 or ALK4 were incubated with 1 mM ATP, 1 mM AMP, 2.5 mM MgCl2 in 150 mM KH2PO4 buffer at pH 7.4, at 37 °C for 60 min. 0.25 μg GLK1 was incubated with 1 mM ATP, 1 mM GMP, 2.5 mM MgCl2 in 150 mM KH2PO4 buffer at pH 7.4, at 37 °C for 60 min. 0.25 μg NME1 was incubated with 1 mM ATP, 1 mM GDP, 2.5 mM MgCl2 in 150 mM KH2PO4 buffer at pH 7.4, at 37 °C for 60 min. Product peaks were analyzed on HPLC at 260 nm absorbance. Data for positive controls is shown in Figure S3.
Western blot
In order to identify proteins such as AK, whole cell lysates or protein fractions were loaded on to a SDS-PAGE gel and separated by electrophoresis, then transferred to a nitrocellulose membrane. Proteins were detected with primary antibodies: AK (#GTX101385, GeneTex) and normalized by α-tubulin (#2144, Cell Signaling) and corresponding secondary antibodies. In addition, to detect poly-ADP-ribose (PAR), livers from mice were ground in liquid nitrogen and lysed in denaturing loading buffer (62.5 mM Tris, pH 6.8, 2.5% SDS, 0.002% Bromophenol Blue, 5% β-mercaptoethanol and 10% glycerol). 30 μg total protein were loaded onto a SDS-PAGE gel and separated by electrophoresis, then transferred to a nitrocellulose membrane. PAR were detected with primary antibody (#MABE1016, Sigma) and corresponding secondary antibodies. Images were developed using Promega™ ECL Western Blotting Substrate (#W1001). Quantification of total PAR and α-tubulin was done using ImageJ. Additional antibody information can be found in Reporting Summary.
Cloning human AK sequence into and overexpression of AK plasmid
Human AK transcript variant 2 (NM_006721.3) was targeted for cloning. To clone this sequence into pET-28a(+) vector using NheI and HindIII as restriction sites primers were designed. Forward primer: 5’- GAC TTA GCT AGC ATG GCA GCT GCT GAG GAG GAG-3’; Reverse primer: 5’- GAG AAG CCA GAC TTC CAC TGA AAG CTT CGG CGC-3’. Total RNA was extracted from HEK293 cells using Trizol and cDNA was synthesized with reverse transcriptase (qScript™ cDNA SuperMix, #95048, Quanta BioSciences). For AK cloning, 5 pmol primers were combined with 500 ng cDNA using PerfeCTa® SYBR® Green FastMix (#95072, Quanta BioSciences). PCR cycles were set as follows: 95°C for 10 min, 30 cycles of 94°C for 30s, 56°C for 30 s and 72°C for 1 min, and a final 72°C for 10 min. PCR product was separated using 1% agarose gel and the bands at 1.1 kb were cut out and DNA was purified using NaI and GlassMilk® (#SKU 111001400, MP Biomedicals). The purified DNA was used as further template and the cloning was repeated with Platinum™ Taq Green Hot Start DNA Polymerase (#13001013, Invitrogen) using the same cycles. 14 ng of the secondary PCR products were ligated with 50 ng pET28-a(+) vectors cut with NheI and HindIII using T4 ligase and transformed into INVαF cells. The pET28-a(+)-AK vector was verified by sequencing. The AK insertion into pET28-a(+) vector is a 100% match with the NM_006721.3 sequence. The pET28-a(+)-AK vector was transformed into BL21-Codon Plus cells (#230280, Agilent Technologies) for protein expression. Transfected cultures were induced with 500 μM IPTG for 4 hr. Pellets were resuspended in 75 mM KH2PO4 pH = 7 (5 volumes) and broken with 3 freeze-thaw cycles. Lysates were pelleted and purified on Ni-agarose. His-tagged AK protein was eluted with 250 mM of imidazole, 75 mM KH2PO4, 200 mM NaCl pH 7.0. Active fractions were combined with 15% glycerol 1 mM DTT and aliquoted and frozen at −80 °C until use.
AK sequence was also ligated into pcDNA 3.1 vector using T4 ligase. The insertion sequence was verified by Genewiz sequencing. The pcDNA 3.1-AK plasmid was transfected into Neuro2a or HEK293 cells using lipofectamine 2000® per the manufacturer’s instructions. After 48 hr, cell lysates were harvested as described in the above section and the overexpressed lysates were fractionated through Q sepharose and used for western blots. Additional antibodies information can be found in Reporting Summary.
Substrate competition test for AK
To test the substrate preference of AK, 1 mM NRH, with or without 2 mM Adenosine (Ado), in 150 mM KH2PO4 buffer at pH 9 were mixed with 2 mM ATP/5 mM MgCl2, with or without 0.25 μg of recombinant AK protein prepared in lysis buffer (150 mM NaCl, 50 mM Tris-HCl, 1% Triton X-100, pH 7.5). Supernatant from the reaction was injected onto HPLC to detect NMNH and NRH peaks at 340 nm absorbance.
In vitro AK inhibitor experiments
Two known inhibitors for AK, 5-Iodotubercidin (5-Itu) and ABT702 dihydrochloride were purchased from Cayman Chemical (#10010375) and Tocris Bioscience (#2372) respectively. To test if these compounds can interfere with the NRH-induced NAD+ concentrations increases, HEK293 and Neuro2a cells were treated with 1 mM NRH or NR for 6 hr, with or without the addition of either 26 nM 5-Itu or 20 nM ABT702. In lysates, NMNH production was assayed in the presence of escalating concentrations of 5-Itu or ABT702 in the presence of 2 mM NRH, 2 mM ATP and 5 mM MgCl2 in pH 9 phosphate buffer and incubated at 37°C for 30 min, then quenched by heating at 80°C for 2 min. The supernatants were injected onto HPLC for NMNH and NRH quantifications. Additionally, HepG2 and C2C12 cells were treated with 1 mM NRH, with or without either 26 nM 5-Itu or 20 nM ABT702 for 6 hr, and their cellular NAD levels were examined.
HAP1 WT and AK KO and Nrk1 KO cell tests
In order to examine the response of HAP1 WT and AK knockout cells towards NRH treatment, we plated HAP1 cells onto 6-well plates until reaching 80–90% confluency. 1 mM NRH or 1 mM NR was added to the media and the cells were trypsinized after 6 hr incubation. Cell numbers were determined with hemocytometer and trypan blue staining. Then the cells were pelleted by centrifugation and NAD+ contents were measured as described above. For testing of inhibitors, 26 nM 5-Itu or 20 nM ABT702 were added together with NRH for a duration of 6 hr. In addition, to test the effect of FK866 and hydrogen peroxide (HP), HAP1 WT cells were incubated with either 250 μM NRH or 250 μM NR, with or without 400 nM FK866, or 500 μM HP. After 6 hr, cell viability were assessed by hemocytometer and trypan blue, and cellular NAD+ levels were measured. Similarly, HAP1 WT and Nrk1 KO cells were incubated with 1 mM NRH or 1 mM NR, with or without 500 μM HP, and the cell viability and cellular NAD+ content were assessed after 6 hr. For lysate experiments, protein lysates were extracted from HAP1 WT or HAP1 AK KO cells with lysis buffer and protein content quantified with Bradford assay. To test for NRH kinase activity, 30 μg of cell lysates were incubated with 2 mM NRH, 2 mM ATP, 5 mM MgCl2, and 150 mM KH2PO4 at pH 9 at 37°C for 30 min. Reactions were quenched by incubation at 80°C for 2 min and proteins were removed by centrifugation. The supernatants were injected onto HPLC for quantification of NMNH and NRH.
Synthesis of [carbonyl-14C]NRH and test in HAP1 cells
To understand whether NRH can be directly incorporated into NAD+, we used [carbonyl-14C]NRH as a substrate. 10 μCi of [carbonyl-14C]NR was synthesized as previously published35 and combined with 5 mg of unlabeled NR44. 1.8 mg Na2S2O4 was added to the NR dissolved in 400 μl of 50 mM KH2PO4 pH = 8.5 on ice for 5 min. The [carbonyl-14C]NRH product was purified by injection onto a C-18 column on HPLC eluted with 20 mM ammonium acetate at 1 mL/min for 25 min, then with 20 mM ammonium acetate and 20% methanol for 20 min. Specific activity was determined by scintillation counting of a known amount of [carbonyl-14C]NRH. To examine if AK or Nrk1 mediates the conversion, HAP1 WT, HAP1 AK KO or HAP1 Nrk1 KO were plated into 6-well plate until they reach 90% confluency, then media was replaced and containing 200,000 CPM [carbonyl-14C]NRH (150 μM). After 6 hr incubation, cells were harvested by trypsin and cell numbers were counted. Cells were lysed with 7% perchloric acid to extract NAD+ and the supernatants were injected onto HPLC for NAD+ separation and collection. Radioactivities of collected NAD+ peaks were determined by scintillation counting and normalized by total cell numbers. Similarly, Neuro2a cells were plated onto 6-well plates until they reached 90% confluency, then treated with media containing either ~150,000 CPM [carbonyl-14C]NRH (150 μM), with or without either 26 nM 5-Itu or 20 nM ABT702 for 6 hr. [carbonyl-14C]NR with similar radioactivity and concentration ( ~200,000 CPM & 150 μM) was also treated for comparison purposes.
Using [carbonyl-14C]NRH for metabolite analyses
To investigate if NMNH is directly converted to NAD+ independently of NMN, 50 μM 14C-NRH (approximately 20,000 CPM) was incubated with 0.1 μg recombinant human AK and 2 mM ATP/5 mM MgCl2 and 500 μM NMN in 80 μL150 mM KH2PO4 at pH 9 at 37 °C for 30 min. Subsequently, 20 μL of Neuro2a cell lysate (20 μg) was added for an additional 75 min incubation time. Reactions were quenched by heating at 80°C for 2 min. The protein precipitates were spun down by centrifugation and the supernatants injected onto C-18 column and eluted by HPLC with diode array detection for 260 and 340 nm chromatograms. Eluants containing peaks corresponding to NMN (260 nm), NMNH (340 nm), NRH (340 nm), and NAD+ (260 nm) were collected and radioactivity quantitated by scintillation counting. Unreacted [carbonyl-14C]NRH was assayed similarly.
NMNH conversion from NADH
To test if NMNH can be produced from NADH, 2 mM NADH were incubated with or without 30 μg of Neuro2a protein lysate in 150 mM KH2PO4 buffer at pH 8.5 at 37°C for 30 min. Additional conditions tested included addition of 5 mM ATP/10 mM MgCl2, or 2 mM Na4P2O7 /10 mM MgCl2 or 5 mM ATP/10 mM MgCl2 and 2 mM Na4P2O7 (All final concentrations). Reactions were quenched by heating at 80°C for 2 min. After spun at max speed to remove protein fraction, the supernatant for the reaction was injected into HPLC to identify NMNH and NADH peaks at 340 nm detection.
NRH kinase activity test with liver lysate
To test for NRH kinase activity in liver protein lysate, about 10 mg liver from male wildtype C57BL/6N mouse was ground in liquid nitrogen and protein was extracted with RIPA lysis buffer (#N653, Amresco). 30 μg of liver lysates were incubated with 2 mM NRH, 2 mM ATP, 5 mM MgCl2, and 150 mM KH2PO4 at pH 9 at 37°C for 30 min. 0, 0.2 μM or 2 μM ABT702 was added to the reaction. Reactions were quenched by incubation at 80°C for 2 min and proteins were removed by centrifugation. The supernatants were injected onto HPLC for quantification of NMNH and NRH.
In vivo AK inhibitor test
To evaluate the effect of NRH and AK inhibitor in in vivo models, we purchased 8-week old male C57BL/6N mice from Charles River Laboratories. No littermate control was used. The mice were randomly assigned to control, NRH, NR, ABT702, ABT702+NRH or ABT702+NR group, with 5 mice per treatment group. They received 250 mg/kg NRH or 250 mg/kg NR or similar volume of PBS through IP injection, with or without the co-treatment of 3 mg/kg ABT702 administered through IP injection. After 2 hr, mice were sacrificed and their livers were snap-frozen in liquid nitrogen. For NAD+ measurement, around 10 mg of liver tissue were ground in liquid nitrogen and NAD+ were extracted with 7% perchloric acid and analyzed as described above. To test NRH kinase activity from liver lysate, proteins were extracted from liver using RIPA lysis buffer. 30 μg protein from livers of control or ABT702-treated group were incubated with 1 mM NRH, 2 mM ATP and 5 mM MgCl2 in pH 9 phosphate buffer and incubated at 37 °C for 30 min, then quenched by heating at 80°C for 2 min. NMNH and NRH were quantitated using HPLC at 340 nm absorbance. A ll procedures were approved by the Institutional Animal Care and Use Committee of Weill Cornell Medicine under protocol number 2015–0007. Additional animal information can be found in Reporting Summary.
Quantitation of NAD+ related metabolites
To extract metabolites, around 10 mg liver from control, NRH, ABT702 and ABT702+NRH treated mice were grounded in liquid nitrogen and 500 μl 80% methanol was added to each tissue, incubated at −80°C for 4 hr, then the supernatants were lyophilized. Targeted LC/MS analyses of the NAD+ related metabolites were performed on a Q Exactive Orbitrap mass spectrometer (Thermo Scientific) coupled to a Vanquish UPLC system (Thermo Scientific). The Q Exactive operated in polarity-switching mode. A Sequant ZIC-HILIC column (2.1 mm i.d. × 150 mm, Merck) was used for metabolite separation. Flow rate was set at 150 μL/min. Buffers consisted of 100% acetonitrile for mobile A, and 0.1% NH4OH/20 mM CH3COONH4 in water for mobile B. Gradient ran from 85% to 30% A in 20 min followed by a wash with 30% A and re-equilibration at 85% A. The nicotinamide related metabolites were identified on the basis of exact mass within 5 ppm and standard retention time. Relative quantitation was performed based on peak area for each metabolite. NRH detection and quantification was validated with an authentic chemical standard.
Statistical analysis
Data were expressed as mean ± S.D. One-way analysis of variance and Tukey’s multiple comparison tests or unpaired t test to detect statistically significant differences between groups were conducted using GraphPad Prism 6.0 (GraphPad Software, La Jolla, CA, USA). P values less than 0.05 were considered significant.
Data availability
Relevant data generated or analyzed during this study are included in this published article (and its supplementary information files). Unpublished data that support the findings of this study are available from the corresponding author upon request.
Extended Data
Extended Data Fig. 1.
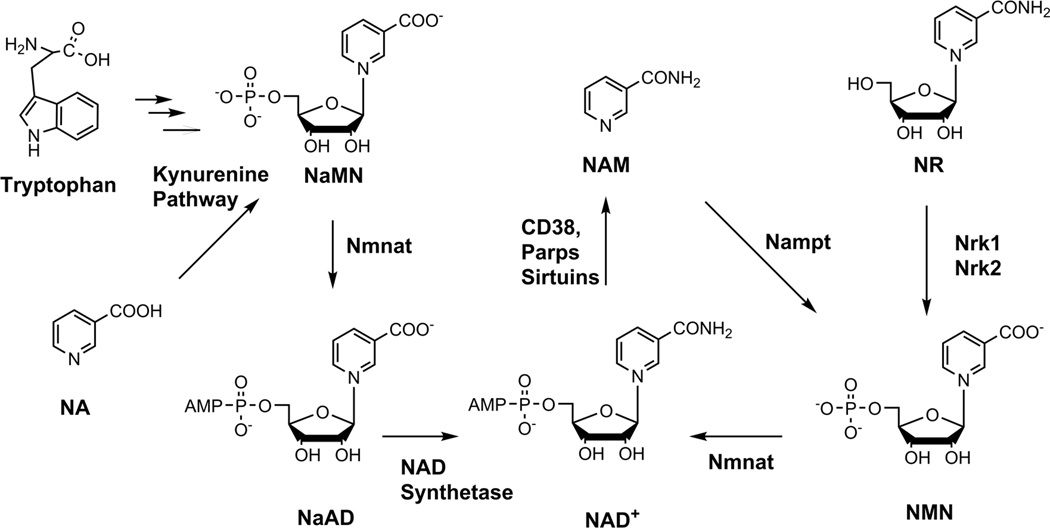
Known NAD+ biosynthetic pathways in mammalian cells. The currently known NAD+ biosynthetic pathways in mammalian cells.
Extended Data Fig. 2.
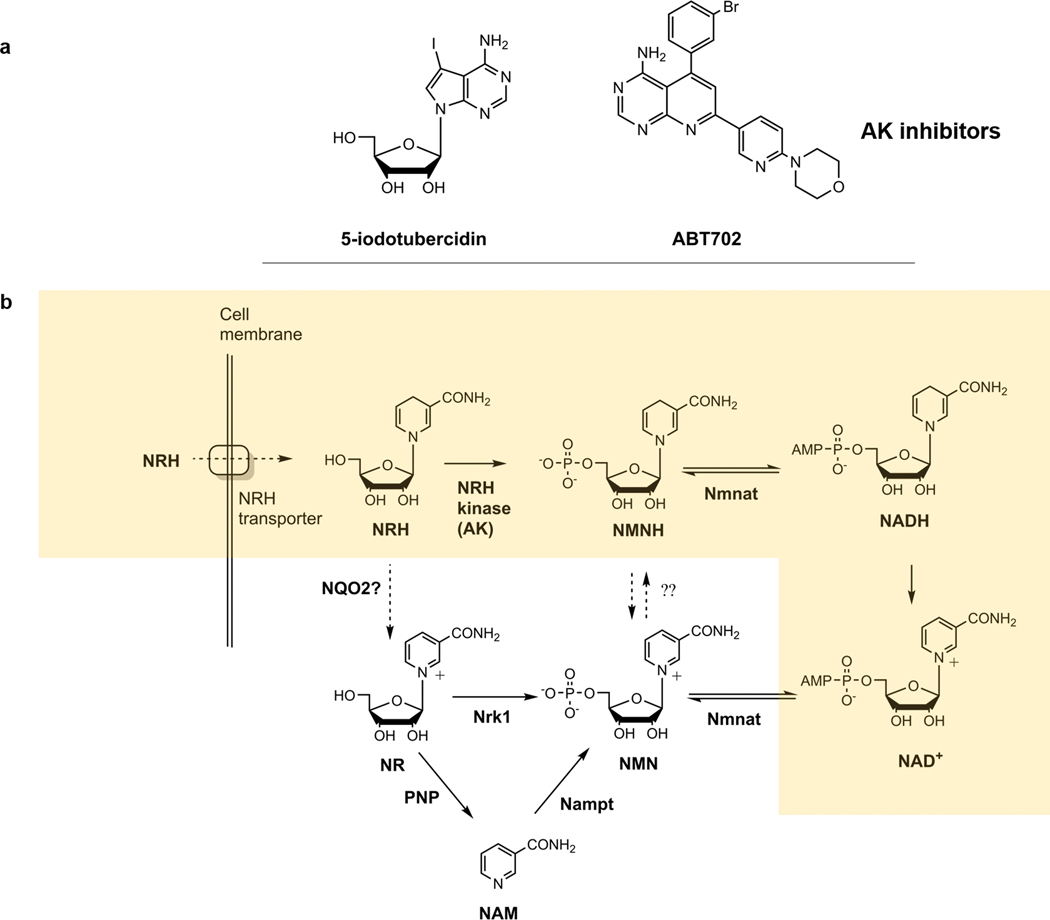
Structures of inhibitors and pathways of NRH metabolism. a) Structures of AK inhibitors. b) The “NRH salvage pathway”, where NRH is transported across cell membrane, phosphorylated into NMNH by NRH kinase, then adenylated into NADH which is then oxidized to produce NAD+. Additional pathways such as nicotinamide salvage, dependent upon Nampt (FK866 sensitive) and Nrk1 dependent pathways are also depicted in the unshaded part of the Scheme. Modified from Scheme published in reference 35.
Supplementary Material
ACKNOWLEDGEMENTS
Funding: This work was funded in part by NIH grant GM R01–106072 (AAS) and from NY Spinal Cord Research Board Contract C32098GG (AAS).
Footnotes
Competing interest: The authors Anthony Sauve and Yue Yang have filed a published PCT patent WO 2017/011788 Al on aspects of NRH activities in conjunction with Cornell University. Anthony Sauve is a co-inventor of issued US patent 8,106, 184 related to methods to produce NR and derivatives. The ‘184 patent is licensed by Chromadex Inc of Irvine California. Anthony Sauve is a consultant and a co-founder of Metro MidAtlantic Biotech LLC and Metro International Biotech LLC.
The authors Ning Zhang and Guoan Zhang declare no conflict of interest.
REFERENCES
- 1.Yang Y. & Sauve AA. NAD+ metabolism: Bioenergetics, signaling and manipulation for therapy. Biochim Biophys Acta 1864, 1787–1800, doi: 10.1016/j.bbapap.2016.06.014 (2016). [DOI] [PMC free article] [PubMed] [Google Scholar]
- 2.Rajakumar K. Pellagra in the United States: a historical perspective. Southern medical journal 93, 272–277 (2000). [PubMed] [Google Scholar]
- 3.Wilder RM. A brief history of the enrichment of flour and bread. Journal of the American Medical Association 162, 1539–1541, doi: 10.1001/jama.1956.72970340006010 (1956). [DOI] [PubMed] [Google Scholar]
- 4.Kornberg A. & Lindberg O. DPN pyrophosphatase. Fed Proc 7, 165 (1948). [PubMed] [Google Scholar]
- 5.Kornberg A. The participation of inorganic pyrophosphate in the reversible enzymatic synthesis of diphosphopyridine nucleotide. J Biol Chem 176, 1475 (1948). [PubMed] [Google Scholar]
- 6.Preiss J. & Handler P. Enzymatic synthesis of nicotinamide mononucleotide. The Journal of biological chemistry 225, 759–770 (1957). [PubMed] [Google Scholar]
- 7.Preiss J. & Handler P. Biosynthesis of diphosphopyridine nucleotide. II. Enzymatic aspects. The Journal of biological chemistry 233, 493–500 (1958). [PubMed] [Google Scholar]
- 8.Preiss J. & Handler P. Biosynthesis of diphosphopyridine nucleotide. I. Identification of intermediates. The Journal of biological chemistry 233, 488–492 (1958). [PubMed] [Google Scholar]
- 9.Bogan KL. & Brenner C. Nicotinic acid, nicotinamide, and nicotinamide riboside: a molecular evaluation of NAD+ precursor vitamins in human nutrition. Annu Rev Nutr 28, 115–130, doi: 10.1146/annurev.nutr.28.061807.155443 (2008). [DOI] [PubMed] [Google Scholar]
- 10.Sauve AA. NAD+ and vitamin B3: from metabolism to therapies. J Pharmacol Exp Ther 324, 883–893 (2008). [DOI] [PubMed] [Google Scholar]
- 11.Gholson RK, Ueda I, Ogasawara N. & Henderson LM. The Enzymatic Conversion of Quinolinate to Nicotinic Acid Mononucleotide in Mammalian Liver. J Biol Chem 239, 1208–1214 (1964). [PubMed] [Google Scholar]
- 12.Nishizuka Y. & Hayaishi O. Enzymic synthesis of niacin nucleotides from 3-hydroxyanthranilic acid in mammalian liver. J Biol Chem 238, 483–485 (1963). [PubMed] [Google Scholar]
- 13.Bieganowski P. & Brenner C. Discoveries of nicotinamide riboside as a nutrient and conserved NRK genes establish a Preiss-Handler independent route to NAD+ in fungi and humans. Cell 117, 495–502 (2004). [DOI] [PubMed] [Google Scholar]
- 14.Gomes AP. et al. Declining NAD(+) induces a pseudohypoxic state disrupting nuclear-mitochondrial communication during aging. Cell 155, 1624–1638, doi: 10.1016/j.cell.2013.11.037 (2013). [DOI] [PMC free article] [PubMed] [Google Scholar]
- 15.Katsyuba E. & Auwerx J. Modulating NAD(+) metabolism, from bench to bedside. EMBO J 36, 2670–2683, doi: 10.15252/embj.201797135 (2017). [DOI] [PMC free article] [PubMed] [Google Scholar]
- 16.Canto C. et al. The NAD(+) precursor nicotinamide riboside enhances oxidative metabolism and protects against high-fat diet-induced obesity. Cell Metab 15, 838–847, doi: 10.1016/j.cmet.2012.04.022 (2012). [DOI] [PMC free article] [PubMed] [Google Scholar]
- 17.Gariani K. et al. Eliciting the mitochondrial unfolded protein response by nicotinamide adenine dinucleotide repletion reverses fatty liver disease in mice. Hepatology 63, 1190–1204, doi: 10.1002/hep.28245 (2016). [DOI] [PMC free article] [PubMed] [Google Scholar]
- 18.Zhang H. et al. NAD(+) repletion improves mitochondrial and stem cell function and enhances life span in mice. Science 352, 1436–1443, doi: 10.1126/science.aaf2693 (2016). [DOI] [PubMed] [Google Scholar]
- 19.Barbosa MT. et al. The enzyme CD38 (a NAD glycohydrolase, EC 3.2.2.5) is necessary for the development of diet-induced obesity. FASEB J 21, 3629–3639, doi: 10.1096/fj.07-8290com (2007). [DOI] [PubMed] [Google Scholar]
- 20.Bai P. et al. PARP-1 inhibition increases mitochondrial metabolism through SIRT1 activation. Cell Metab 13, 461–468 (2011). [DOI] [PMC free article] [PubMed] [Google Scholar]
- 21.Khan NA. et al. Effective treatment of mitochondrial myopathy by nicotinamide riboside, a vitamin B3. EMBO Mol Med 6, 721–731, doi: 10.1002/emmm.201403943 (2014). [DOI] [PMC free article] [PubMed] [Google Scholar]
- 22.Cerutti R. et al. NAD(+)-dependent activation of Sirt1 corrects the phenotype in a mouse model of mitochondrial disease. Cell Metab 19, 1042–1049, doi: 10.1016/j.cmet.2014.04.001 (2014). [DOI] [PMC free article] [PubMed] [Google Scholar]
- 23.Gong B. et al. Nicotinamide riboside restores cognition through an upregulation of proliferator-activated receptor-gamma coactivator 1alpha regulated beta-secretase 1 degradation and mitochondrial gene expression in Alzheimer’s mouse models. Neurobiol Aging 34, 1581–1588 (2013). [DOI] [PMC free article] [PubMed] [Google Scholar]
- 24.Hou Y. et al. NAD(+) supplementation normalizes key Alzheimer’s features and DNA damage responses in a new AD mouse model with introduced DNA repair deficiency. Proc Natl Acad Sci U S A 115, E1876–E1885, doi: 10.1073/pnas.1718819115 (2018). [DOI] [PMC free article] [PubMed] [Google Scholar]
- 25.Sorrentino V. et al. Enhancing mitochondrial proteostasis reduces amyloid-beta proteotoxicity. Nature 552, 187–193, doi: 10.1038/nature25143 (2017). [DOI] [PMC free article] [PubMed] [Google Scholar]
- 26.Xu W. et al. Lethal Cardiomyopathy in Mice Lacking Transferrin Receptor in the Heart. Cell Rep 13, 533–545, doi: 10.1016/j.celrep.2015.09.023 (2015). [DOI] [PMC free article] [PubMed] [Google Scholar]
- 27.Zhang R. et al. Short-term administration of Nicotinamide Mononucleotide preserves cardiac mitochondrial homeostasis and prevents heart failure. J Mol Cell Cardiol 112, 64–73, doi: 10.1016/j.yjmcc.2017.09.001 (2017). [DOI] [PMC free article] [PubMed] [Google Scholar]
- 28.Tummala KS. et al. Inhibition of de novo NAD(+) synthesis by oncogenic URI causes liver tumorigenesis through DNA damage. Cancer Cell 26, 826–839, doi: 10.1016/j.ccell.2014.10.002 (2014). [DOI] [PubMed] [Google Scholar]
- 29.Das A. et al. Impairment of an Endothelial NAD(+)-H2S Signaling Network Is a Reversible Cause of Vascular Aging. Cell 173, 74–89 e20, doi: 10.1016/j.cell.2018.02.008 (2018). [DOI] [PMC free article] [PubMed] [Google Scholar]
- 30.Trammell SA. et al. Nicotinamide riboside is uniquely and orally bioavailable in mice and humans. Nat Commun 7, 12948, doi: 10.1038/ncomms12948 (2016). [DOI] [PMC free article] [PubMed] [Google Scholar]
- 31.Dellinger RW. et al. Repeat dose NRPT (nicotinamide riboside and pterostilbene) increases NAD(+) levels in humans safely and sustainably: a randomized, double-blind, placebo-controlled study. NPJ Aging Mech Dis 3, 17, doi: 10.1038/s41514-017-0016-9 (2017). [DOI] [PMC free article] [PubMed] [Google Scholar]
- 32.Dollerup OL. et al. A randomized placebo-controlled clinical trial of nicotinamide riboside in obese men: safety, insulin-sensitivity, and lipid-mobilizing effects. Am J Clin Nutr 108, 343–353, doi: 10.1093/ajcn/nqy132 (2018). [DOI] [PubMed] [Google Scholar]
- 33.Airhart SE. et al. An open-label, non-randomized study of the pharmacokinetics of the nutritional supplement nicotinamide riboside (NR) and its effects on blood NAD+ levels in healthy volunteers. PLoS One 12, e0186459, doi: 10.1371/journal.pone.0186459 (2017). [DOI] [PMC free article] [PubMed] [Google Scholar]
- 34.Martens CR. et al. Chronic nicotinamide riboside supplementation is well-tolerated and elevates NAD(+) in healthy middle-aged and older adults. Nat Commun 9, 1286, doi: 10.1038/s41467-018-03421-7 (2018). [DOI] [PMC free article] [PubMed] [Google Scholar]
- 35.Yang Y, Mohammed FS, Zhang N. & Sauve AA. Dihydronicotinamide riboside is a potent NAD(+) concentration enhancer in vitro and in vivo. J Biol Chem 294, 9295–9307, doi: 10.1074/jbc.RA118.005772 (2019). [DOI] [PMC free article] [PubMed] [Google Scholar]
- 36.Megarity CF. et al. The two common polymorphic forms of human NRH-quinone oxidoreductase 2 (NQO2) have different biochemical properties. FEBS Lett 588, 1666–1672, doi: 10.1016/j.febslet.2014.02.063 (2014). [DOI] [PMC free article] [PubMed] [Google Scholar]
- 37.Miller RL. et al. Adenosine kinase from rabbit liver. II. Substrate and inhibitor specificity. J Biol Chem 254, 2346–2352 (1979). [PubMed] [Google Scholar]
- 38.Ugarkar BG. et al. Adenosine kinase inhibitors. 1. Synthesis, enzyme inhibition, and antiseizure activity of 5-iodotubercidin analogues. J Med Chem 43, 2883–2893 (2000). [DOI] [PubMed] [Google Scholar]
- 39.Jarvis MF. et al. ABT-702 (4-amino-5-(3-bromophenyl)-7-(6-morpholinopyridin-3-yl)pyrido[2, 3-d]pyrimidine), a novel orally effective adenosine kinase inhibitor with analgesic and anti-inflammatory properties: I. In vitro characterization and acute antinociceptive effects in the mouse. J Pharmacol Exp Ther 295, 1156–1164 (2000). [PubMed] [Google Scholar]
- 40.Berger F, Lau C, Dahlmann M. & Ziegler M. Subcellular compartmentation and differential catalytic properties of the three human nicotinamide mononucleotide adenylyltransferase isoforms. J Biol Chem 280, 36334–36341, doi: 10.1074/jbc.M508660200 (2005). [DOI] [PubMed] [Google Scholar]
- 41.Grozio A. et al. Slc12a8 is a nicotinamide mononucleotide transporter. Nature metabolism 1, 47–57, doi: 10.1038/s42255-018-0009-4 (2019). [DOI] [PMC free article] [PubMed] [Google Scholar]
- 42.Giroud-Gerbetant J. et al. A reduced form of nicotinamide riboside defines a new path for NAD(+) biosynthesis and acts as an orally bioavailable NAD(+) precursor. Mol Metab 30, 192–202, doi: 10.1016/j.molmet.2019.09.013 (2019). [DOI] [PMC free article] [PubMed] [Google Scholar]
- 43.Boison D. & Yegutkin GG. Adenosine Metabolism: Emerging Concepts for Cancer Therapy. Cancer cell 36, 582–596, doi: 10.1016/j.ccell.2019.10.007 (2019). [DOI] [PMC free article] [PubMed] [Google Scholar]
- 44.Yang T, Chan NY. & Sauve AA. Syntheses of nicotinamide riboside and derivatives: effective agents for increasing nicotinamide adenine dinucleotide concentrations in mammalian cells. J Med Chem 50, 6458–6461 (2007). [DOI] [PubMed] [Google Scholar]
- 45.Li W. & Sauve AA. NAD(+) content and its role in mitochondria. Methods Mol Biol 1241, 39–48, doi: 10.1007/978-1-4939-1875-1_4 (2015). [DOI] [PubMed] [Google Scholar]
Associated Data
This section collects any data citations, data availability statements, or supplementary materials included in this article.
Supplementary Materials
Data Availability Statement
Relevant data generated or analyzed during this study are included in this published article (and its supplementary information files). Unpublished data that support the findings of this study are available from the corresponding author upon request.