

Abstract
Flow cytometric T-cell receptor (TCR)-Vβ repertoire analysis (TCR-Vβ-R) is a sensitive method for detection of T-cell clonality; however, no uniform approach exists to define clonality in neoplastic T cells. TCR-Vβ-R was evaluated in patients with a diagnosis of T-cell neoplasia in initial diagnostic specimens from 41 patients and for minimal residual disease (MRD) monitoring in 61 sequential samples from 14 patients with mature T-cell neoplasia. Gating strategies and criteria for detection of T-cell clonality were determined. In all 41 initial specimens, T-cell clonality was demonstrated via TCR-Vβ-R. The frequency of Vβ usage was consistent with random neoplastic transformation of TCR-Vβ subsets. MRD was successfully detected in follow-up samples from all 14 patients evaluated, Furthermore, MRD after therapy was quantitated in 48 peripheral blood specimens. TCR-Vβ-R analysis is a sensitive method for detection of T-cell clonality and is useful for diagnosis and MRD detection in multiple specimen types.
Keywords: T-cell clonality, Flow cytometry, Vβ repertoire
Flow cytometric immunophenotyping (FCI) is a powerful tool in the diagnosis, classification, and monitoring of B-cell leukemia and lymphoma.1–3 FCI has been shown to be highly sensitive in the detection of minimal residual disease (MRD) after therapy in acute leukemia and in mature B-cell neoplasia. Furthermore, flow cytometry offers more precise quantitation of MRD levels in these processes.1–9
FCI detection of mature T-cell neoplasms, specifically T-cell clonality, is more intensive and challenging, however, than for B-cell malignancies. FCI indicators of a T-cell lymphoproliferative process include absent, diminished, or abnormally increased expression of T-cell antigens; subset restriction; and the presence of aberrant non–T-cell antigens. Confirmation of clonality in apparent T-cell lymphoproliferative disorders is desirable and is frequently provided by additional molecular analysis of T-cell receptor-γ chain (TCRG) gene rearrangements using the polymerase chain reaction (PCR). The relatively restricted diversity of TCRG gene rearrangements, high background amplification of similar rearrangements found in normal T cells, and the qualitative nature of PCR (does not quantitate clonal T-cell numbers) have limited the potential of this approach and spurred the development of new technologies for the detection of T-cell clonality.10
T-cell clonality can be detected through immunophenotypic analysis of the TCR-Vβ repertoire. The vast majority of normal and neoplastic T cells are αβ T cells and express the β chain on the cell surface as part of the TCR. The β chain consists of a constant and a variable region formed by the recombination of V/D/J segments. The distribution of Vβ classes in normal CD4+ or CD8+ T cells is well defined.11,12 All T cells in a clonal T-cell population have the same V/D/J segment and, therefore, have identical, or “monoclonal,” Vβ protein expression.
Commercial fluorescently labeled antibodies are available against the majority of the human class-specific V segments for the TCRβ chain (Vβ). By using FCI, it is possible to detect expanded T-cell populations that show a pathologic restriction in Vβ usage. Furthermore, abnormal T-cell populations can be detected by using a panel of antibodies; subsequently, anti-Vβ antibodies can be used to study the immunophenotypically defined abnormal T cells to determine clonality. This is called Vβ repertoire analysis. Expansion of a Vβ population is consistent with a clonal T-cell population, similar to an expansion of κ- or λ-restricted B cells in a monoclonal B-cell population. Furthermore, a large population of αβ T cells expressing surface CD3 but failing to express any of the Vβ proteins detectable by current flow cytometric assays (detect 70% of normal T cells) is abnormal and consistent with a clonal T-cell population expressing one of the Vβ proteins not studied (normally present in only 30% of T cells).13–16 Thus, Vβ repertoire analysis by FCI is an exciting new tool in diagnosis of T-cell lymphoproliferative processes.
To bring Vβ repertoire analysis into standard clinical practice, studies defining gating strategies for the analysis of Vβ subsets and the level of Vβ subset expansion required for confirmation of T-cell clonality are essential.
Furthermore, the sensitivity of Vβ analysis in the detection and monitoring of MRD following therapy has not been established. In this study, we evaluated the TCR-Vβ repertoire in 41 cases of T-cell leukemia and lymphoma. T-cell clonality was also concurrently assessed by using PCR in 36 cases. Gating strategies for the evaluation of the TCR-Vβ repertoire were explored, and the extent of TCR-Vβ restriction required to demonstrate clonality was examined. This study also elaborated the sensitivity of detection of T-cell clonality and quantitation of tumor cell load in MRD by using tumor-specific TCR-Vβ antibodies in conjunction with conventional immunophenotyping.
Materials and Methods
Case Selection
Initial screening specimens included 37 peripheral blood (PB) samples, 3 bone marrow (BM) aspirates, and 1 lymph node fine-needle aspirate (FNA) from 41 patients with a confirmed diagnosis of a mature T-cell malignancy. The specimens were submitted for diagnostic evaluation to the Flow Cytometry Unit, Laboratory of Pathology, National Cancer Institute (Bethesda, MD) as part of screening for protocol eligibility from January 2007 to April 2010. All patients signed institutional review board–approved informed consent to be screened.
The 41 specimens were analyzed using a comprehensive FCI panel for T-cell lymphoproliferative disease and a complete TCR-Vβ repertoire. Concurrent CBCs were performed. In addition, 5 subsequent specimens (3 FNA and 2 cerebrospinal fluid [CSF]) were submitted for diagnostic FCI evaluation of the extent of disease involvement. Clinical data were obtained through medical record review and by contacting the patients’ physicians. Of the 41 patients, 24 had human T-lymphotropic virus (HTLV)-1–associated adult T-cell leukemia/lymphoma (ATLL), 7 had cutaneous T-cell lymphoma (CTCL), 6 had T-cell large granular lymphocytic leukemia (LGL), 3 had peripheral T-cell lymphoma, not otherwise specified, and 1 had T-cell prolymphocytic leukemia. Tumor classification was based on the World Health Organization criteria for hematologic malignancies using a combination of morphologic, immunohistochemical, and FCI studies. Concurrent molecular studies for TCRG gene rearrangement by PCR were performed in 36 cases. HTLV-1 serology performed by enzyme-linked immunosorbent assay and confirmed by Western blot and blood HTLV-1 viral load by real-time PCR were used when indicated. The diagnoses were confirmed by review of the original pathology reports, FCI, immunohistochemical staining, and cytology or histologic evaluation by 2 hematopathologists (C.M.Y. and M.S.-S.). Of the 41 patients, 18 (44%) were male (age range, 17–77 years) and 23 (56%) were female (age range, 26–82 years).
Fourteen patients who responded to therapy were followed up for up to 3 years. There were 56 specimens (48 PB, 4 FNA, 2 CSF, and 2 BM) submitted from these 14 patients that were analyzed by FCI using limited immunophenotypic panels and single-clone-specific TCR-Vβ antibody cocktails to quantitate MRD. Results were correlated with molecular studies using TCRG gene rearrangement by PCR for T-cell clonality.
Immunophenotyping
Specimens were stained within 24 hours of collection with a panel of antibodies. Erythrocytes were lysed by incubating with lysing solution (150 mmol/L ammonium chloride, 10 mmol/L potassium bicarbonate, and 0.1 mmol/L EDTA) for 10 minutes at room temperature (maintained at 21°C-23°C) at a ratio of 1:9 (volume of sample/volume of lysing solution). Specimens were then washed with phosphate-buffered saline to remove cytophilic antibodies before determining cell number. Cellularity was determined by a hemocytometer and viability by trypan blue exclusion.
Specimens were then stained for 30 minutes at room temperature (maintained at 21°C-23°C) with a cocktail of 4 antibodies (antibody concentration according to manufacturer’s recommendations) according to Clinical Laboratory Standards Institute document H43-A recommendations.4,17 Antibody panels, including the combinations used, were chosen based on the number of cells, the diagnosis, and previous immunophenotypic data. The panels included antibodies against CD2, CD3, CD4, CD5, CD7, CD8, CD10, CD14, CD16, CD19, CD20, CD25, CD26, CD27, CD30, CD45, CD52, CD56, CD57, γδ T-cell receptor, αβ T-cell receptor, κ, and λ.
After incubation, cells were pelleted by centrifugation (500g for 15 minutes at room temperature), the media aspirated, and the cells washed twice in a phosphate-buffered saline solution containing 0.1% sodium azide and 0.5% albumin. All cells were fixed in 1.0% paraformaldehyde and stored at 4°C for up to 12 hours before acquisition. Normal lymphoid cells within specimens served as internal positive and negative controls. Four-color cytometry was performed using a FACSCalibur flow cytometer (sensitivity of fluorescent detectors monitored using standard beads according to the manufacturer’s recommendations; BD Biosciences, San Jose, CA). At least 5,000 lymphocytes were acquired per tube. Data (collected in list mode) were analyzed with CellQuest Pro software (BD Biosciences) and FCS Express (De Novo Software, Los Angeles, CA). Relevant cell populations were analyzed by examining forward and side light scatter, CD3, CD4, CD8, and other characteristic markers for each specific disease entity (eg, CD4+, CD7–, and CD25 bright for ATLL). Normal lymphoid cells within specimens served as internal controls to define positive and negative populations (eg, B cells as negative controls for T cell–directed antibodies) and for antibody binding intensity. Bright expression was defined as higher than that observed in normal T cells, and dim staining was defined as lower than that observed in normal T cells, in accordance with the 1997 US-Canadian consensus guidelines.18
Flow Cytometric Analysis of the TCR-Vβ Repertoire
The IOTest Beta Mark TCR-Vβ Repertoire kit (Beckman Coulter, Miami, FL) was used for the assessment of the following TCR-Vβ regions: Vβ1, Vβ2, Vβ3, Vβ4, Vβ5.1, Vβ5.2, Vβ5.3, Vβ7.1, Vβ7.2, Vβ8, Vβ9, Vβ11, Vβ12, Vβ13.1, Vβ13.2, Vβ13.6, Vβ14, Vβ16, Vβ17, Vβ18, Vβ20, Vβ21.3, Vβ22, and Vβ23. This kit includes 8 cocktails, each containing antibodies against 3 different TCR-Vβ regions covering 24 TCR-Vβ antigens and approximately 70% of the normal human TCR-Vβ repertoire. The 3 antibodies per cocktail are labeled with fluorescein isothiocyanate, phycoerythrin, or fluorescein isothiocyanate and phycoerythrin, respectively. In performing the TCR-Vβ repertoire assay, anti-CD3 peridinin chlorophyll-a protein (PerCP) and anti-CD4 and/or anti-CD8 allophycocyanin (APC) were added to the 8 Vβ cocktails. In occasional cases, anti-CD5 or anti-CD7 APC antibodies were used in place of anti-CD4 or anti-CD8 when previous FCI indicated they were more valuable in isolating the abnormal T-cell population.
TCR-Vβ antigen usage was studied by using 2 general gating strategies based on expression of CD3 PerCP and CD4 or CD8 APC ▮Image 1▮. In gating strategy 1 (GS-1), an analysis gate was drawn including all dual CD3+ and CD4+ or CD8+ cells. Gating strategy 2 (GS-2) was based on specific abnormal immunophenotypic features of the neoplastic cells such as aberrant dim or bright expression of antigens (eg, dim CD3, CD5, or CD8) or lack of expression of appropriate antigens (CD4– and CD8–, CD5– or CD7–, CD3+ cells). Selected T-cell populations as per each gating strategy were analyzed for TCR-Vβ expression and quantitation. The values were compared with published normal ranges provided by the vendor.
▮Image 1▮.
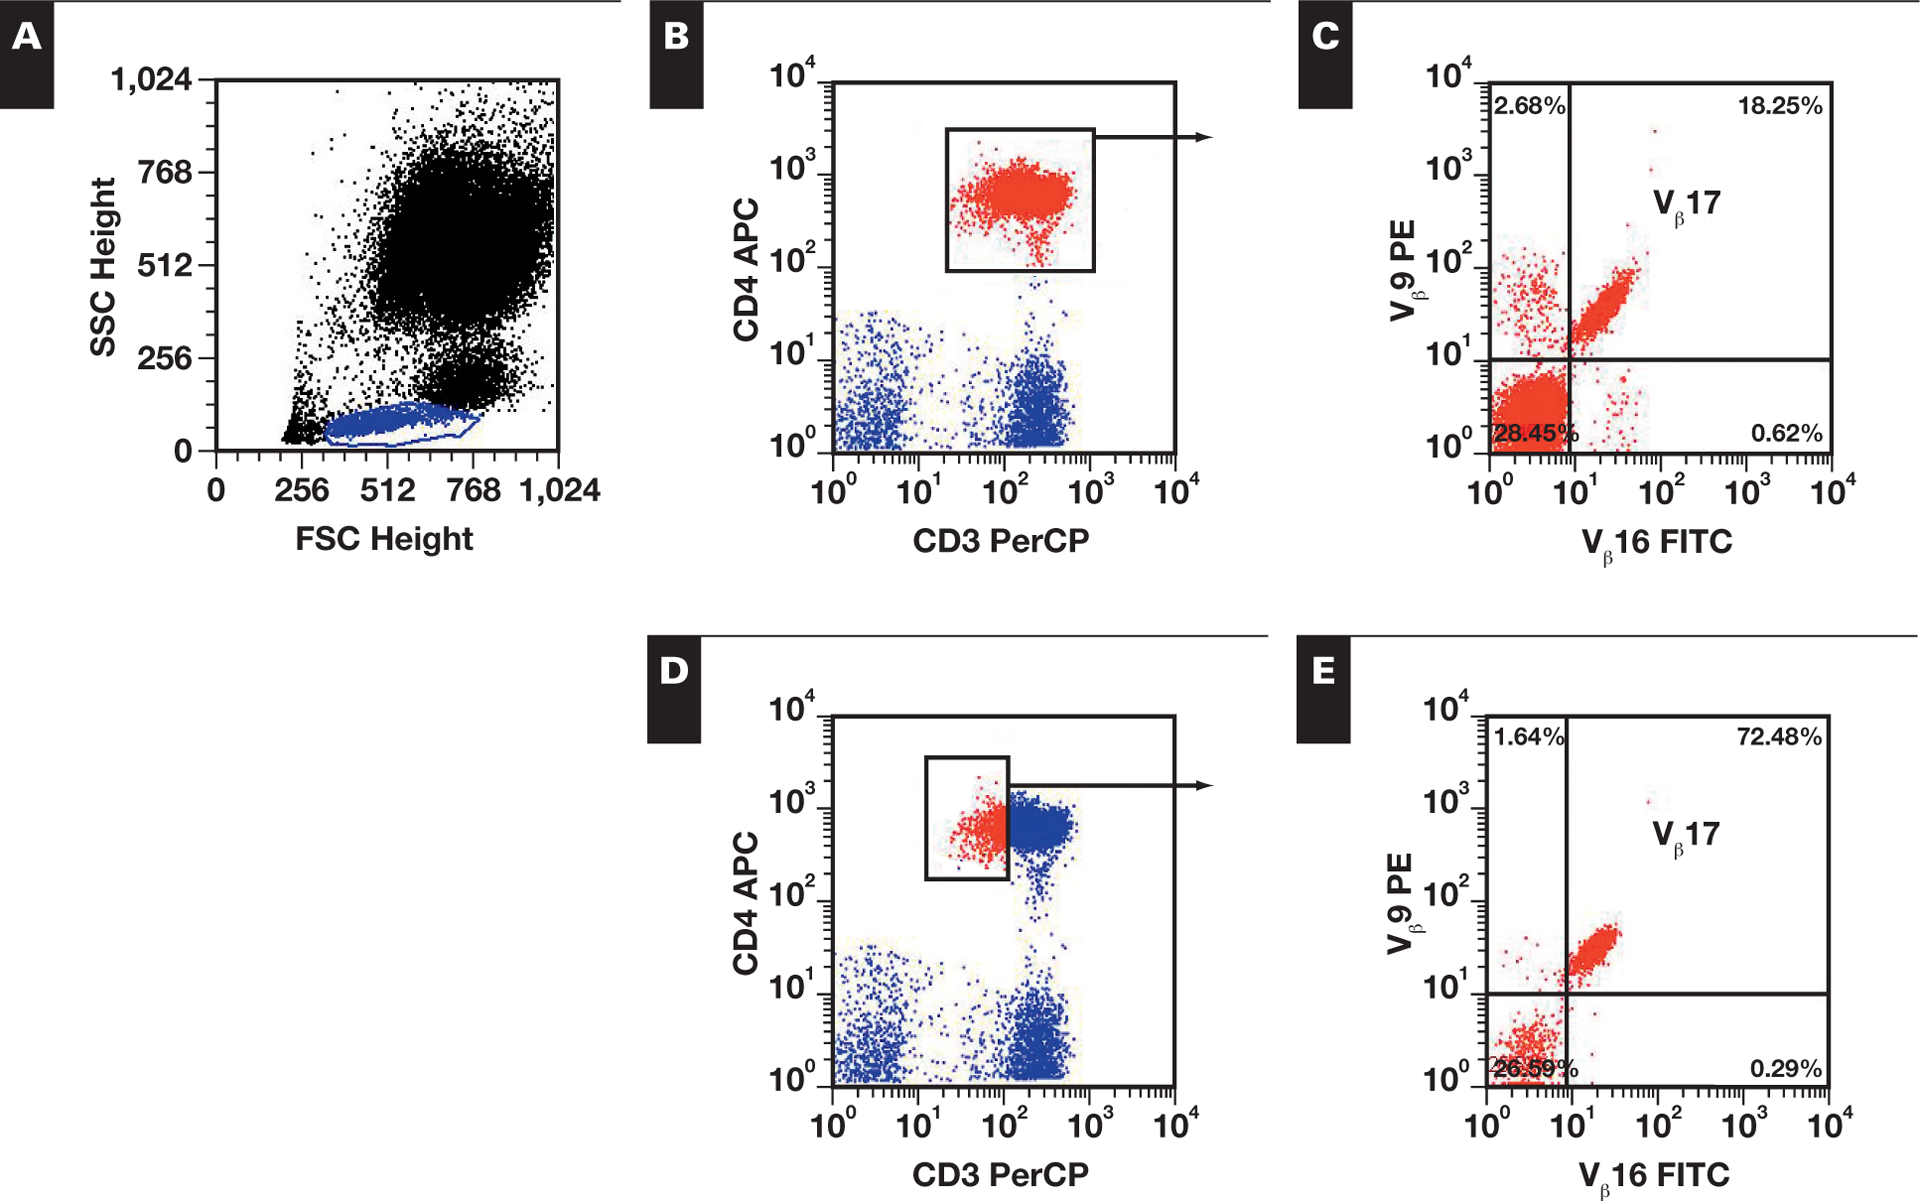
Effect of gating strategy on Vβ analysis. A, Initial lymphocyte gate (blue) was established based on FSC and SSC properties. Subsequently, 2 gating strategies were used. B, Gating strategy 1 gates all CD3+/CD4+ cells (red) to examine the Vβ distribution. C, Vβ17 expression is noted in 18.25% of CD3+/CD4+ cells. D, Gating strategy 2 gates specifically on neoplastic cells of interest, by gating on dim CD3+ and CD4+ cells (red). E, Vβ17 expression is noted in 72.48% of dim CD3+ and CD4+ cells. APC, allophycocyanin; FITC, fluorescein isothiocyanate; FSC, forward light scatter; PE, phycoerythrin; PerCP, peridinin chlorophyll-a protein; SSC, side light scatter.
PCR Studies of TCRG Gene Rearrangements and HTLV-1
T-cell clonality was assessed via 1 of 2 previously described PCR-based assays using gel electrophoresis19 or capillary electrophoresis.12,20
Statistical Analysis
The frequency of TCR-Vβ subset usage, including failure to express a Vβ subclass detected by the antibody set used, was examined in the 41 cases studied; subsequently, the frequency of TCR-Vβ subset usage was compared with that of normal T cells to determine if the data were consistent with random neoplastic transformation of TCR-Vβ subsets or if a specific TCR-Vβ subclass was preferentially used. This was accomplished by using a set of χ2 goodness-of-fit tests to determine if the usage of TCR-Vβ subsets was present at the same frequency as in the mean normal T-cell distribution (ie, data were consistent with a random neoplastic transformation of TCR-Vβ subsets) or if a specific TCR Vβ subclass was present in a higher frequency.
The normal T-cell mean percentages of the TCR-Vβ subclasses were considered to be based on large enough samples to be treated as the true probabilities of a multinomial random variable. The set of Vβ frequencies of each study population or subgroup was taken to be an observed value of this variable; therefore, its overall deviation from the mean was assessed by the χ2 statistic summed over subclasses. The 2-tailed P value was calculated from its exact permutation distribution. For the comparison of the ATLL frequencies against those of the other neoplasms, the null hypothesis of unknown but equal multinomial probabilities was tested using the exact conditional distribution in the Fisher-Freeman-Halton test, the extension of the Fisher exact test to tables of 3 or more columns or rows.
Results
Immunophenotypic Analysis
Aberrant T-cell populations were detected based on expression patterns of multiple antigens ▮Table 1▮. In 24 ATLL cases, the neoplastic cells characteristically showed abnormally dim CD3 expression (21/24 cases), CD25 positivity (abnormally bright in 15/24), CD7 negativity (19/24 cases, 4 partially positive), CD26 negativity (24/24), and positivity for CD4 (21/24, CD4+/CD8–; 2/24, CD4+/CD8+; and 1/24, CD4–/CD8–). ATLL cells were separated from normal CD7– T cells using a multiparametric approach to identify dim CD3 expression, increased CD25 expression, and CD26 negativity in CD4+ T cells. CD26 negativity was particularly useful in cases in which abnormal levels of CD3 expression were not distinctly apparent.
▮Table 1▮.
Immunophenotypic Profiles of Mature T-Cell Neoplasia Cases*
| Diagnosis/Case No. | Specimen | Immunophenotypic Profile | |||||||||
|---|---|---|---|---|---|---|---|---|---|---|---|
| CD2 | CD3 | CD4 | CD5 | CD7 | CD8 | CD25 | CD27 | CD52 | CD57 | ||
| ATLL | |||||||||||
| 1 | PB | + | ± | + | + | − | − | 2+ | + | + | − |
| 2 | PB | + | ± | + | + | − | − | 2+ | + | − | − |
| 3 | PB | + | ± | + | + | − | − | 2+ | + | + | − |
| 4 | PB | + | ± | + | + | − | − | 2+ | + | + | − |
| 5 | PB | + | ± | + | + | − | − | + | + | + | − |
| 6 | PB | ± | ± | + | 2+ | − | − | + | + | + | − |
| 7 | PB | + | ± | + | 2+ | − | − | + | + | + | − |
| 8 | PB | + | + | + | + | + | − | 2+ | + | + | − |
| 9 | PB | + | + | + | + | − | − | + | + | − | − |
| 10 | PB | + | ± | + | + | − | − | + | + | + | − |
| 11 | PB | + | ± | + | + | − | − | 2+ | + | + | − |
| 12 | PB | + | + | + | + | +† | ± | + | + | + | − |
| 13 | PB | − | + | − | ± | − | − | 2+ | + | + | − |
| 14 | PB | + | + | + | + | +† | + | + | + | + | − |
| 15 | PB | + | + | + | + | +† | − | 2+ | + | + | − |
| 16 | PB | + | + | + | ± | − | − | + | + | + | − |
| 17 | PB | + | + | + | − | − | − | 2+ | + | + | − |
| 18 | PB | + | 2+ | 2+ | + | +† | − | + | + | + | − |
| 19 | PB | + | ± | + | + | − | − | 2+ | + | + | − |
| 20 | PB | + | + | 2+ | + | − | − | 2+ | + | + | − |
| 21 | PB | + | + | + | ± | − | − | 2+ | + | 2 + | − |
| 22 | PB | + | ± | + | + | − | − | 2+ | + | + | − |
| 23 | BM | ± | ± | + | + | − | − | 2+ | + | + | − |
| 24 | PB | + | + | + | + | − | − | 2+ | + | + | − |
| CTCL | |||||||||||
| 25 | PB | + | ± | + | + | − | − | 2+ | + | ND | − |
| 26 | PB | + | ± | + | + | +† | − | + | + | ND | − |
| 27 | PB | + | + | + | − | − | ND | + | |||
| 28 | PB | +† | + | + | + | − | − | +† | + | + | − |
| 29 | PB | + | ± | + | + | − | − | +† | ± | + | − |
| 30 | PB | + | + | + | 2+ | − | − | ± | + | + | − |
| 31 | BM | + | ±† | + | + | − | − | ± | + | ND | − |
| PTCL | |||||||||||
| 32 | PB | + | + | +† | + | +† | ± | − | + | + | +† |
| 33 | PB | + | ± | + | 2+ | − | − | + | + | + | − |
| 34 | FNALN | − | 2+ | + | + | − | ± | − | ± | − | − |
| TPLL | |||||||||||
| 35 | PB | + | ± | + | 2+ | − | − | − | + | + | − |
| LGL | |||||||||||
| 36 | PB | 2+ | + | − | + | + | + | − | − | ND | + |
| 37 | PB | + | + | − | ± | +† | + | − | − | ND | + |
| 38 | PB | ± | ± | − | − | ± | + | − | − | ND | + |
| 39 | PB | ± | + | − | − | ± | + | − | − | + | − |
| 40 | PB | ± | + | − | + | − | + | − | − | + | + |
| 41 | PB | + | + | − | + | ± | + | − | − | + | + |
ATLL, human T-lymphotropic virus-1–associated adult T-cell leukemia/lymphoma; BM, bone marrow; CTCL, cutaneous T-cell lymphoma; FNALN, fine-needle aspirate lymph node; LGL, T-cell large granular lymphocytic leukemia; ND, not done; PB, peripheral blood; PTCL, peripheral T-cell lymphoma, not otherwise specified; TPLL, T-cell prolymphocytic leukemia; −, negative; ±, dim; +, positive; 2+, bright positive.
CD10, CD26, CD56, and T-cell receptor (TCR)γδ were negative in all cases, whereas TCRαβ was positive in all cases.
Partial.
In 6 LGL cases, the neoplastic cells were positive for CD2, CD3, and CD8 with aberrant expression of at least 2 T-cell markers (CD2, CD3, CD5, and CD7) in all cases and variable expression of CD5 and CD7. Of the antigens relevant to the identification of LGL, CD8 was positive in all cases, CD57 was positive in 5 cases, CD16 was positive in 2 cases, and CD56 was negative in all cases.
In 7 cases of CTCL, neoplastic T cells demonstrated the typical immunophenotype of dim CD3 expression (5/7 cases), CD4+/CD8–, CD26–, and predominantly CD7– (6/7 cases). In 3 cases of peripheral T-cell lymphoma, tumor cells were positive for CD3 and CD4 and negative for CD7 and CD26. Multiple antigens demonstrated abnormal levels of expression. A single case of T-cell prolymphocytic leukemia (small cell variant) expressed CD2, dim CD3, CD4, and bright CD5 but was negative for CD7 and CD26.
Of 41 cases, 27 (66%) showed an obvious expansion in the usage of a single TCR-Vβ family. In the remaining 14 cases (34%), clonality was inferred based on the failure of the majority of the gated cells to react with any of the TCR-Vβ antibodies tested (ie, T cells staining negatively for TCR-Vβ antibodies, with negativity defined as equal to or less than the intensity of B-cell reactivity with TCR-Vβ antibodies). The use of a full panel of TCR-Vβ antibodies accounts for the TCR-Vβ usage of 70% of normal T cells, while 30% are not examined; these 14 cases likely express a TCR-Vβ representing the 30% that are not examined.
Assessment of T-Cell Clonality by Immunophenotypic Analysis of the TCR-Vβ Repertoire
Gating Strategy
TCR-Vβ usage by neoplastic T cells was analyzed by using 2 gating strategies (Image 1) ▮Table 2▮ in 27 of the 41 cases exhibiting restricted TCR-Vβ expression. GS-1 examined all CD3+/CD4+ or CD3+/CD8+ T cells for TCR-Vβ usage. GS-2 used specific immunophenotypic abnormalities to isolate aberrant T cells for TCR-Vβ usage. GS-1 was applicable to all cases. GS-2 was applicable to all except 11 cases (2 ATLLs, 4 CTCLs, and 5 LGLs) in which no apparent aberrancy in T-cell antigen expression was noted in that antibody combination (2 LGLs and 1 CTCL) or all of the CD4+ or CD8+ T cells were tumor cells (2 ATLLs, 3 CTCLs, and 3 LGLs). Concurrent TCR PCR studies confirmed T-cell clonality in all but 3 cases (24/27).
▮Table 2▮.
Comparison of GS-1 and GS-2 in Cases Demonstrating TCR-Vβ Restriction*
| Diagnosis/Case No. | TCR−Vβ Family | GS−1: Vβ−Restricted Gated Cells (%) | GS−2: Vβ−Restricted Gated Cells (%) | Clonality by TCR PCR |
|---|---|---|---|---|
| ATLL | ||||
| 3 | 8 | 30.16 | 60.49 | + |
| 6 | 9 | 54.54 | 58.32 | + |
| 7 | 22 | 86.45 | 89.13 | + |
| 8 | 17 | 18.4 | 77.46 | + |
| 10 | 1 | 28.49 | 84.53 | + |
| 11 | 1 | 9.2 | 67.86 | + |
| 12 | 1 | 54.42 | 82.84 | + |
| 14 | 22 | 69.09 | 81.83 | + |
| 15 | 18 | 86.04 | 92.06 | + |
| 16 | 17 | 95.45 | 98.23 | + |
| 17 | 5.1 | 98.02 | † | + |
| 19 | 17 | 53.6 | 70.75 | + |
| 21 | 5.1 | 87.91 | 98.37 | + |
| 22 | 9 | 6.72 | 63.05 | + |
| 24 | 13.1 | 80.19 | 83.56 | ND |
| CTCL | ||||
| 26 | 21.3 | 91.71 | 97.91 | + |
| 28 | 8 | 92.02 | 98.60 | + |
| 29 | 14 | 99.31 | † | ND |
| 30 | 13.2 | 87.0 | 92.70 | + |
| 31 | 20 | 97.78 | † | ND |
| PTCL | ||||
| 32 | 4 | 53.06 | 86.67 | + |
| 33 | 17 | 80.94 | 98.68 | + |
| 34 | 17 | 91.27 | 95.15 | + |
| TPLL | ||||
| 35 | 13.1 | 93.79 | 98.00 | + |
| LGL | ||||
| 36 | 3 | 63.58 | ‡ | + |
| 39 | 7.1 | 98.45 | † | + |
| 40 | 8 | 97.49 | † | + |
ATLL, human T-lymphotropic virus-1–associated adult T-cell leukemia/lymphoma; CTCL, cutaneous T-cell lymphoma; GS-1, gating strategy 1; GS-2, gating strategy 2; LGL, T-cell large granular lymphocytic leukemia; ND, not done; PCR, polymerase chain reaction; PTCL, peripheral T-cell lymphoma, not otherwise specified; TCR, T-cell receptor; TPLL, T-cell prolymphocytic leukemia; +, TCR clonal rearrangement detected.
Mean (range) for GS-1, 70.6% (6.72%−99.31%); and for GS-2, 84.6% (58.32%−98.68%).
All CD4+ or CD8+ T cells are neoplastic, and GS-2 is not applicable.
No apparent aberrancy in T-cell antigen expression detected, and GS-2 is not applicable.
Use of GS-1 resulted in an average of 70.6% of gated cells exhibiting restricted TCR-Vβ expression (range, 6.72%−99.31%). Five cases demonstrated a low percentage of GS-1 Vβ-restricted cells (cases 3, 8, 10, 11, and 22 at 30.16%, 18.4%, 28.49%, 9.2%, and 6.72%, respectively) owing to a low proportion of neoplastic cells among the T cells. The percentage of GS-1 Vβ-restricted cells was more than 51% in the remaining cases. In the 30 cases in which GS-2 was applicable, the use of GS-2 resulted in an average of 84.6% of gated cells exhibiting restricted TCR-Vβ expression (range, 58.32%−98.68%). The percentage of gated cells exhibiting TCR-Vβ restriction was more than 58% of the GS-2 gated cells in all cases. Notably, the 5 cases demonstrating a low percentage of GS-1 Vβ-restricted cells were greater than 58% by the GS-2 approach (cases 3, 8, 10, 11, and 22 at 60.49%, 77.46%, 84.53%, 67.86%, and 63.05%, respectively). These results indicate that use of GS-2, when applicable, is superior for demonstrating restricted TCR-Vβ usage among neoplastic T cells.
In 14 (34%) of 41 cases, clonality was inferred; this inference was based on the failure of the majority of the gated cells to react with any of the TCR-Vβ antibodies tested, despite the use of a panel of TCR-Vβ antibodies accounting for the TCR-Vβ usage of 70% of normal T cells ▮Table 3▮. Concurrent PCR studies were available for 12 cases and confirmed clonality. With GS-1, a mean of 80.7% of gated cells (range, 52.46%−98.6%) were negative for all TCR-Vβ subsets studied (70% of normal T cells are positive for TCR-Vβ subsets studied). Although less than 70% of the GS-1 gated cells were TCR-Vβ– in 2 cases owing to low tumor cell number (cases 2 and 20 at 61.06% and 52.46%, respectively), the percentage of GS-1 gated cells negative for TCR-Vβ clones studied was more than 70% in the remaining cases. In the 9 cases in which GS-2 was applicable, GS-2 revealed that a mean 87.7% of gated cells (range, 71.65%−99.03%) were negative for all TCR-Vβ subsets studied. The percentage of TCR-Vβ–T cells was more than 70% of the GS-2 gated cells in all cases. These results indicate that use of GS-2, when applicable, is also superior to GS-1 for identifying a significant population of aberrant T cells failing to demonstrate restricted TCR-Vβ usage and, hence, providing indirect evidence for a clonal T-cell expansion.
▮Table 3▮.
Comparison of GS-1 and GS-2 in Cases Not Demonstrating TCR-Vβ Restriction*
| Diagnosis/Case No. | T Cells in GS−1 Negative f or All Vp Tested (%) |
T Cells in GS−2 Negative for All Vp Tested (%) | Clonality by TCR PCR |
|---|---|---|---|
| ATLL | |||
| 1 | 90.76 | † | + |
| 2 | 61.06 | 73.4 | + |
| 4 | 83.05 | 86.76 | + |
| 5 | 89.79 | 90.16 | + |
| 9 | 98.6 | 99.03 | + |
| 13 | 78.64 | 92.79 | + |
| 18 | 95.26 | 97.49 | + |
| 20 | 52.46 | 71.65 | + |
| 23 | 71.81 | 82.63 | + |
| CTCL | |||
| 25 | 81.44 | ‡ | + |
| 27 | 94.4 | † | ND |
| LGL | |||
| 37 | 71.55 | † | + |
| 38 | 90.02 | 95.5 | ND |
| 41 | 70.56 | ‡ | + |
ATLL, human T-lymphotropic virus-1–associated adult T-cell leukemia/lymphoma; CTCL, cutaneous T-cell lymphoma; GS, gating strategy; LGL, T-cell large granular lymphocytic leukemia; ND, not done; PCR, polymerase chain reaction; TCR, T-cell receptor; +, clonal rearrangement detected.
Mean (range) for GS-1, 80.7% (52.46%−98.6%); and for GS-2, 87.7% (71.65%−99.03%).
All CD4+ or CD8+ T cells are tumor, and GS-2 not different from GS-1.
No aberrancy in T-cell antigen expression detected, and GS-2 is not applicable.
Comparison of Frequency of TCR-Vβ Subset Usage in T-Cell Leukemia/Lymphoma and Normal T Cells
The frequency of TCR-Vβ subset usage, including failure to express a Vβ subclass detected by the antibody set used, was examined in the 41 cases studied ▮Table 4▮; subsequently, their frequency was compared with that of normal T cells using a set of χ2 goodness-of-fit tests. This was performed to determine if the data were consistent with a random neoplastic transformation of TCR-Vβ subsets (ie, same frequency as in the mean normal T-cell distribution) or if a specific TCR-Vβ subclass was present in a higher frequency. For all 41 patients, the exact P value was .82. Thus, none of the observed percentages of the TCR-Vβ subsets in the T-cell malignancies differed significantly from the normal T-cell TCR-Vβ subset ranges. Because ATLL has a known viral etiology and distinct biologic course, ATLL TCR-Vβ subclass usage was compared with the other T-cell neoplasms (Table 4) using a Fisher-Freeman-Halton test. The 2-tailed P value was .25; thus, no significant difference between ATLL and non-ATLL cases was observed in Vβ subclass frequencies.
▮Table 4▮.
TCR-Vβ Subset Usage: Frequency Among Normal T Cells and Mature T-Cell Malignancies*
| TCR−Vp Family | Normal T Cells, Mean (SD) | No. (%) of All Cases (n = 41) | No. (%) of ATLL Cases (n = 24) |
|---|---|---|---|
| 1 | 3.53 (1.35) | 3 (7) | 3 (13) |
| 2 | 8.30 (2.46) | 0 (0) | 0 (0) |
| 3 | 4.68 (3.13) | 0 (0) | 0 (0) |
| 4 | 1.91 (0.48) | 1 (2) | 0 (0) |
| 5.1 | 5.45 (1.6) | 2 (5) | 2 (8) |
| 5.2 | 1.33 (0.52) | 0 (0) | 0 (0) |
| 5.3 | 1.08 (0.42) | 1 (2) | 0 (0) |
| 7.1 | 2.56 (2.08) | 1 (2) | 0 (0) |
| 7.2 | 1.46 (1.03) | 0 (0) | 0 (0) |
| 8 | 4.68 (2.94) | 3 (7) | 1 (4) |
| 9 | 3.13 (1.15) | 2 (5) | 2 (8) |
| 11 | 1.04 (0.62) | 0 (0) | 0 (0) |
| 12 | 1.65 (0.54) | 0 (0) | 0 (0) |
| 13.1 | 3.83 (1.06) | 2 (5) | 1 (4) |
| 13.2 | 2.80 (1.23) | 1 (2) | 0 (0) |
| 13.6 | 1.86 (0.96) | 0 (0) | 0 (0) |
| 14 | 3.49 (1.36) | 1 (2) | 0 (0) |
| 16 | 0.92 (0.29) | 0 (0) | 0 (0) |
| 17 | 5.15 (1.28) | 5 (12) | 3 (13) |
| 18 | 1.49 (0.74) | 1 (2) | 1 (4) |
| 20 | 2.52 (1.38) | 1 (2) | 0 (0) |
| 21.3 | 2.38 (0.72) | 1 (2) | 0 (0) |
| 22 | 3.84 (1.17) | 2 (5) | 2 (8) |
| 23 | 0.85 (0.65) | 0 (0) | 0 (0) |
| Negative | 30.07 | 14 (34) | 9 (38) |
ATLL, human T-lymphotropic virus-1–associated adult T-cell leukemia/lymphoma; TCR, T-cell receptor.
Normal T cells refers to normal CD3+ T cells expressing each Vβ family member; all cases refers to T-cell leukemias/lymphomas expressing each Vβ family member; ATLL cases refers to the ATLL cases expressing each Vβ family member; negative refers to cases not expressing any of Vβ families studied. There was no significant difference in Vβ usage.
TCR-Vβ Monitoring of MRD
MRD was monitored in 61 (48 PB, 7 FNA, 4 CSF, and 2 BM) sequential samples from 14 patients. FCI analysis was accomplished using limited immunophenotypic panels and single-clone-specific TCR-Vβ antibody cocktails to quantitate MRD. T-cell clonality was demonstrated by FCI in all follow-up specimens, including 5 FNA and 4 CSF specimens, indicating that this approach is useful in low-cellularity specimens when the specific restricted TCR-Vβ family is known and a single-clone-specific TCR-Vβ antibody cocktail can be used.
MRD after therapy was quantitated in the 48 PB specimens. The number of tumor cells, expressed as a percentage of lymphocytes, was determined by conventional FCI using a limited T-cell immunophenotypic panel and clone-specific TCR-Vβ antibody cocktails ▮Table 5▮. The number of tumor cells per microliter of blood was then determined using the absolute lymphocyte count from a concurrent CBC. We found that by using limited tumor cell–specific markers and single-clone-specific TCR-Vβ antibody cocktails, MRD can be successfully and easily quantitated, allowing monitoring of treatment response in the T-cell leukemia/lymphoma cases studied. The minimum level of clonal T cells detected was 0.8/μL. The number of clonal T cells ranged from 0.8/μL to 306,603/μL, with a median value of 1,132/μL. The trend in the number of tumor cells per microliter (decreasing, increasing, or no change) correlated with overall response to therapy (responsive or nonresponsive) (Table 5).
▮Table 5▮.
Flow Cytometric Quantitation of Minimal Residual Disease After Therapy
| Diagnosis/ Case Number | No. of Tumor Cells on Initial PB Specimen (/u.L) | No. of Tumor Cells on Follow−up PB Specimens (/uL) | Response to Therapy* | |||||
|---|---|---|---|---|---|---|---|---|
| ATLL | ||||||||
| 10 | 552 | 11 | 1,167 | 1,345 | — | — | — | RD, PD |
| 13 | 969 | 38,893 | 16,986 | 3 | 0.8 | 13.2 | 22,095 | PD, RD, SD, PD |
| 14 | 3,819 | 1,567 | 10,379 | — | — | — | — | RD, PD |
| 15 | 20,417 | 2,075 | 1,383 | 17,218 | 70 | — | — | RD |
| 18 | 1,086 | 0 | 1,313 | — | — | — | — | RD, PD |
| 20 | 1,034 | 632 | — | — | — | — | — | RD |
| 21 | 66 | 66 | 151 | 119 | — | — | — | SD |
| 24 | 687 | 400 | 426 | 63 | 592 | 1,032 | 103 | RD |
| CTCL | ||||||||
| 26 | 11,976 | 2,530 | 4,325 | 10,598 | 9,840 | — | — | RD, PD |
| 29 | 3,743 | 17,152 | — | — | — | — | — | PD |
| 30 | 759 | 618 | 1,149 | 817 | 960 | 2,610 | — | SD, PD |
| PTCL | ||||||||
| 32 | 1,132 | 1,276 | 710 | 44 | 13 | — | — | DR |
| TPLL | ||||||||
| 35 | 10,441 | 9,189 | — | — | — | — | — | SD |
| LGL | ||||||||
| 36 | 1,894 | 1,878 | 1,629 | 1,123 | 497 | 1,178 | — | SD |
ATLL, human T-lymphotropic virus-1–associated adult T-cell leukemia/lymphoma; CTCL, cutaneous T-cell lymphoma; LGL, T-cell large granular lymphocytic leukemia; PB, peripheral blood; PD, progressive disease; PTCL, peripheral T-cell lymphoma, not otherwise specified; RD, responsive disease; SD, stable disease; TPLL, T-cell prolymphocytic leukemia.
Based on overall clinical assessment and listed in chronological order.
Discussion
FCI is useful in diagnosis and subclassification of mature T-cell neoplasms.5,21,22 Typically, subset restriction; absent, diminished, or abnormally increased expression of T-cell antigens; presence of aberrant antigens; and expansion of normally rare T-cell populations are indicators of T-cell neoplasia. In addition, T-cell clonality can be detected by FCI analysis of the β chain variants of the TCR. Detection of a significant abnormal T-cell population expressing a single TCR-Vβ protein is consistent with a T-cell clone, just as detection of a κ- or λ-restricted abnormal B-cell population is consistent with a B-cell clone. Although multiparametric FCI can be highly sensitive in the detection of T-cell leukemia and lymphoma, neoplastic T cells may not always have an aberrant T-cell immunophenotype, and when overlap with normal T-cell immunophenotype occurs, discrimination of small tumor cell populations is difficult.5,22,23 Molecular techniques are highly sensitive for determining T-cell clonality but do not allow quantitative measurement of tumor levels for precise measurement of treatment response. Flow cytometric TCR-Vβ repertoire analysis is a rapid quantitative method to detect clonality of T-cell populations in patients with suspected T-cell lymphoproliferative disorders, providing a high degree of sensitivity and specificity for T-cell clonality assessment.10,13,15,16,24
The IOTest Beta Mark TCR-Vβ Repertoire kit includes antibodies against 24 TCR-Vβ antigens covering approximately 70% of the normal human TCR-Vβ repertoire. In healthy people, 72.25% of all CD4+/CD3+ and 66.58% of all CD8+/CD3+ T cells react with antibodies in this TCR-Vβ repertoire kit. The maximum percentages of CD3+/CD4+ and CD3+/CD8+ T cells that react with any specific TCR-Vβ antibody are 14.2% and 13.8%, respectively. An expansion of a single Vβ family to an abnormally high percentage of the CD4+/CD3+ or CD8+/CD3+ T cells is considered evidence of T-cell clonality. However, consensus has not been reached as to the cutoff percentage of T cells expressing a single Vβ family required to define clonality in neoplastic T-cell proliferation.15,16,25 In a study by Morice et al,15 clonality was defined as the expression of a single TCR-Vβ 10-fold more than its normal maximum or by greater than 50% of the T cells in any analyzed population. Cases were considered suggestive of containing clonal T cells by TCR-Vβ FCI if greater than 70% of the cells failed to react with any of the TCR-Vβ antibodies tested.15,24 Lima et al13 compared results for FCI T-cell clonality testing via TCR-Vβ repertoire analysis when criteria were set as 60% or 40% of total CD4 or CD8 T cells in 1 TCR-Vβ subset. The specificity of T-cell clonality detection by FCI TCR-Vβ analysis increased from 81% to 100% when 60% or greater Vβ restriction was used compared with 40%. The sensitivity, however, decreased from 93% to 81%.13 Others have suggested the use of gating strategies based on tumor-specific immunophenotype to increase the specificity of T-cell clonality detection by TCR-Vβ repertoire analysis.12
In the present study, we compared TCR-Vβ repertoire analysis using a T-cell subset–specific (CD3+/CD4+ or CD3+/CD8+) and a neoplastic T-cell–specific gating strategy (Tables 2 and 3). Vβ subset restriction was demonstrated in 27 of 41 cases of confirmed T-cell leukemia/lymphoma. We found that the percentage of T cells in a specific Vβ subclass was more than 58% in all 27 cases (mean, 84.6%; range, 58.32%−98.68%) when a tumor-specific immunophenotype was used in setting analysis gates. However, this percentage decreased when analysis gates were set on all CD3+/CD4+ or CD3+/CD8+ T cells (mean, 70.6%; range, 6.72%−99.31%) owing to the dilutional effect of a significant population of normal T cells (Table 2). As a result, only 22 of 27 cases exhibited more than 50% gated T cells exhibiting TCR-Vβ restriction. The data confirm that T-cell clonality is best assessed by using aberrant immunophenotypes to gate on tumor cells for TCR-Vβ repertoire analysis. With flow cytometers allowing 8 or more antibodies per tube, inclusion of antibodies to CD7, CD25, CD26, CD5, CD2, or CD57 in addition to CD3 and CD4 or CD8 may improve the characterization of each patient’s neoplastic T cells for TCR-Vβ repertoire analysis. This approach would essentially create an individualized, patient-specific TCR-Vβ cocktail, possibly increasing the sensitivity for MRD analysis.
In 14 of 41 cases, T-cell clonality was inferred by a significant proportion of T cells failing to react with any of the TCR-Vβ antibodies tested (Table 3). The percentage of T cells failing to react with the TCR-Vβ antibodies tested was more than 70% in all cases when a tumor-specific immunophenotype was used in setting analysis gates (mean, 87.7%; range, 71.65%−99.03%), but in 2 cases, less than 70% negativity was observed when analysis gates were set on all CD3+/CD4+ or CD3+/CD8+ T cells (mean, 80.7%; range, 52.46%−98.6%), again confirming that T-cell clonality is best assessed by using aberrant immunophenotypes to gate on tumor cells for TCR-Vβ repertoire analysis. The TCR-Vβ negative populations in the 14 cases are likely due to a T-cell clone expressing a less common TCR-Vβ region not studied. In addition, polymorphisms in the V regions of the β gene loci have been reported26 that could conceivably lead to expression of a TCR-Vβ protein containing an altered antigenic site that is not recognizable by the antibody used. An expansion of a clonal Vβ population containing a polymorphism could result in an observed high percentage of TCR-Vβ negative cells; however, because the maximum percentage of normal T cells reacting with any specific TCR-Vβ antibody is low (<14.2%), TCR-Vβ polymorphisms among normal T cells would not result in a large enough number of TCR-Vβ– cells (>70%) to be mistakenly interpreted as T-cell clonality.
Our findings are consistent with previously reported TCR-Vβ percentage cutoffs, that is, demonstrating greater than 50% Vβ subset restriction or greater than 70% negativity for all Vβ subsets assessed with the IOTest Beta Mark TCR-Vβ Repertoire kit. The frequency of each Vβ subset usage by ATLL and the other T-cell leukemias and lymphomas did not differ significantly from that of normal T cells (Table 4). Selective Vβ subset usage remains a possibility in patients with T-cell lymphoma; however, larger cohorts must be studied to definitively make this determination.
Quantitation of MRD is useful in monitoring response to therapy and predicting relapse in many hematolymphoid malignancies.2,6–9,12,25 Although molecular techniques are highly sensitive for detecting clonal T-cell populations, they do not allow precise quantitative measurement of tumor levels. In the present study, FCI monitoring of MRD was accomplished in 61 (48 PB, 7 FNA, 4 CSF, and 2 BM) sequential samples from 14 patients. FCI testing in these specimens was based on using limited immunophenotypic panels and single-clone-specific TCR-Vβ antibody cocktails. Based on results with the 7 FNA and 4 CSF specimens studied, we conclude that this approach is useful in low-cellularity specimens as long as the specific TCR-Vβ subset is known and a single-clone-specific TCR-Vβ antibody cocktail can be used. MRD after therapy was quantitated as the number of tumor cells per microliter in the 48 PB specimens. MRD was readily quantitated using TCR-Vβ repertoire analysis. This method was highly sensitive in documenting treatment response, detecting as low as 0.8 clonal T cells per microliter. Further studies are required to determine the coefficient of variation for this testing and the intralaboratory and interlaboratory variation in MRD quantitation by TCR-Vβ repertoire analysis. Once such limits are defined, apparent changes in MRD can be appropriately interpreted as greater than inherent variation of the technique and a diagnosis of early relapse, stable disease, or further decline in response to therapy can be made.
TCR-Vβ repertoire analysis is a sensitive method for the detection of T-cell clonality that is useful in multiple specimen types. The identification of T-cell clonality alone, however, is not sufficient to make a determination of malignancy, and FCI immunophenotypic data should be correlated with other laboratory and clinical features for definitive diagnosis. T-cell clonality can be best assessed by using aberrant immunophenotypes to gate on tumor cells for TCR-Vβ repertoire analysis and demonstrating greater than 50% TCR-Vβ subset restriction or greater than 70% negativity for all Vβ subsets assessed with the IOTest Beta Mark TCR-Vβ Repertoire kit. This approach is useful in low-cellularity specimens, such as FNA and CSF, as long as the specific TCR-Vβ subset is known and a single-clone-specific TCR-Vβ antibody cocktail can be used. MRD can be quantitated via TCR-Vβ repertoire analysis and is highly sensitive for documenting treatment response and early relapse.
Upon completion of this activity you will be able to:
apply Vβ repertoire analysis to detection of T-cell clonality.
describe Vβ repertoire analysis in normal T cells.
define the role of Vβ repertoire analysis in minimal residual disease detection.
The ASCP is accredited by the Accreditation Council for Continuing Medical Education to provide continuing medical education for physicians. The ASCP designates this educational activity for a maximum of 1 AMA PRA Category 1 Credit ™ per article. This activity qualifies as an American Board of Pathology Maintenance of Certification Part II Self-Assessment Module.
The authors of this article and the planning committee members and staff have no relevant financial relationships with commercial interests to disclose.
Questions appear on p 975. Exam is located at www.ascp.org/ajcpcme.
Acknowledgments
Supported by the Intramural Research Program of the National Institutes of Health, National Cancer Institute.
References
- 1.Rawstron AC, Villamor N, Ritgen M, et al. International standardized approach for flow cytometric residual disease monitoring in chronic lymphocytic leukaemia. Leukemia. 2007;21:956–964. [DOI] [PubMed] [Google Scholar]
- 2.Rawstron AC, Kennedy B, Evans PAS, et al. Quantitation of minimal disease levels in chronic lymphocytic leukemia using a sensitive flow cytometric assay improves the prediction of outcome and can be used to optimize therapy. Blood. 2001;98:29–35. [DOI] [PubMed] [Google Scholar]
- 3.Sausville J, Salloum RG, Sorbara L, et al. Minimal residual disease detection in hairy cell leukemia: comparison of flow cytometric immunophenotyping with clonal analysis using consensus primer polymerase chain reaction for the heavy chain gene. Am J Clin Pathol. 2003;119:213–217. [DOI] [PubMed] [Google Scholar]
- 4.Stetler-Stevenson MA, Ahmad E, Barnett D, et al. Clinical Flow Cytometric Analysis of Neoplastic Hematolymphoid Cells; Approved Guideline 2nd ed Wayne, PA: Clinical and Laboratory Standards Institute; 2005. CLSI document H43–A2. [Google Scholar]
- 5.Shao H, Yuan CM, Xi L, et al. Minimal residual disease detection by flow cytometry in adult T-cell leukemia/ lymphoma. Am J Clin Pathol. 2010;133:592–601. [DOI] [PMC free article] [PubMed] [Google Scholar]
- 6.Al-Mawali A, Gillis D, Lewis I. The role of multiparameter flow cytometry for detection of minimal residual disease in acute myeloid leukemia. Am J Clin Pathol. 2009;131:16–26. [DOI] [PubMed] [Google Scholar]
- 7.Coustan-Smith E, Sancho J, Hancock ML, et al. Clinical importance of minimal residual disease in childhood acute lymphoblastic leukemia. Blood. 2000;96:2691–2696. [PubMed] [Google Scholar]
- 8.Neale GAM, Coustan-Smith E, Pan Q, et al. Tandem application of flow cytometry and polymerase chain reaction for comprehensive detection of minimal residual disease in childhood acute lymphoblastic leukemia. Leukemia. 1999;13:1221–1226. [DOI] [PubMed] [Google Scholar]
- 9.Borowitz MJ, Devidas M, Hunger SP, et al. Clinical significance of minimal residual disease in childhood acute lymphoblastic leukemia and its relationship to other prognostic factors: a Children’s Oncology Group study. Blood. 2008;111:5477–5485. [DOI] [PMC free article] [PubMed] [Google Scholar]
- 10.Langerak AW, van den Beemd R, Wolvers-Tettero ILM,et al. Molecular and flow cytometric analysis of the Vβ repertoire for clonality assessment in mature TCRαβ T-cell proliferations. Blood. 2001;98:165–173. [DOI] [PubMed] [Google Scholar]
- 11.van den Beemd R, Boor PPC, van Lochem EG, et al. Flow cytometric analysis of the Vβ repertoire in healthy controls. Cytometry. 2000;40:336–345. [DOI] [PubMed] [Google Scholar]
- 12.Li Y, Braylan R, Al-Quran SZ. Flow-cytometric assessment of T-cell clonality in clinical specimens. Lab Med. 2007;38:477–482. [Google Scholar]
- 13.Lima M, Almeida J, Santos AH, et al. Immunophenotypic analysis of the TCR-V repertoire in 98 persistent expansions of CD3+/TCR large granular lymphocytes. Am J Pathol. 2001;159:1861–1868. [DOI] [PMC free article] [PubMed] [Google Scholar]
- 14.Ferenczi K, Yawalkar N, Jones D, et al. Monitoring the decrease of circulating malignant T cells in cutaneous T-cell lymphoma during photopheresis and interferon therapy. Arch Dermatol. 2003;139:909–913. [DOI] [PubMed] [Google Scholar]
- 15.Morice WG, Kimlinger T, Katzmann JA, et al. Flow cytometric assessment of TCR-Vβ expression in the evaluation of peripheral blood involvement by T-cell lymphoproliferative disorders: a comparison with conventional T-cell immunophenotyping and molecular genetic techniques. Am J Clin Pathol. 2004;121:373–383. [DOI] [PubMed] [Google Scholar]
- 16.Beck RC, Stahl S, O’Keefe CL, et al. Detection of matureT-cell leukemias by flow cytometry using anti–T-cell receptor Vβ antibodies. Am J Clin Pathol. 2003;120:785–794. [DOI] [PubMed] [Google Scholar]
- 17.Jasper GA, Arun I, Venzon D, et al. Variables affecting the quantitation of CD22 in neoplastic B cells [published online ahead of print September 24, 2010]. Cytometry B Clin Cytom. 2011;80:83–90. doi: 10.1002/cyto.b.20567. [DOI] [PMC free article] [PubMed] [Google Scholar]
- 18.Borowitz M, Bray R, Gascoyne R, et al. U.S.-Canadian consensus recommendations on the immunophenotypic analysis of hematologic neoplasia by flow cytometry: data analysis and interpretation. Cytometry B Clin Cytom. 1997;30:236–244. [DOI] [PubMed] [Google Scholar]
- 19.McCarthy KP, Sloane JP, Kabarowski JH, et al. A simplified method of detection of clonal rearrangements of the T-cell receptor-gamma chain gene. Diagn Mol Pathol. 1992;1:173–179. [PubMed] [Google Scholar]
- 20.Lawnicki LC, Rubocki RJ, Chan WC, et al. The distribution of gene segments in T-cell receptor gamma gene rearrangements demonstrates the need for multiple primer sets. J Mol Diagn. 2003;5:82–87. [DOI] [PMC free article] [PubMed] [Google Scholar]
- 21.Gorczyca W, Weisberger J, Liu Z, et al. An approach to diagnosis of T-cell lymphoproliferative disorders by flow cytometry. Cytometry. 2002;50:177–190. [DOI] [PubMed] [Google Scholar]
- 22.Arun I, Wulu JA, Janik JE, et al. Visual inspection versus quantitative flow cytometry to detect aberrant CD2 expression in malignant T cells. Cytometry B Clin Cytom. 2010;78:169–175. [DOI] [PMC free article] [PubMed] [Google Scholar]
- 23.Yokote T, Akioka T, Oka S, et al. Flow cytometric immunophenotyping of adult T-cell leukemia/lymphoma using CD3 gating. Am J Clin Pathol. 2005;124:199–204. [DOI] [PubMed] [Google Scholar]
- 24.Fitzgerald JE, Ricalton NS, Meyer AC, et al. Analysis of clonal CD8+ T cell expansions in normal individuals and patients with rheumatoid arthritis. J Immunol. 1995;154:3538–3547. [PubMed] [Google Scholar]
- 25.Feng B, Jorgensen JL, Hu Y, et al. TCR-Vbeta flow cytometric analysis of peripheral blood for assessing clonality and disease burden in patients with T cell large granular lymphocyte leukaemia. J Clin Pathol. 2010;63:141–146. [DOI] [PubMed] [Google Scholar]
- 26.Vissinga C, Charmley P, Concannon P. Influence of coding region polymorphism on the peripheral blood expression of a human TCR Vβ gene. J Immunol. 1994;152:1222–1227. [PubMed] [Google Scholar]