

Abstract
Intracellular concentration of imatinib in leukemic cells is thought to affect the clinical efficacy of this drug in patients with chronic myeloid leukemia (CML); however, there is no report that directly indicates the relationship between intracellular concentration and clinical outcome and/or, plasma concentration. In addition, the impacts of genetic variations of drug transporters, which mediate leukocyte concentration of imatinib, are unknown. In the present study, we investigated the correlation between intracellular imatinib concentrations in leukocytes, plasma imatinib levels, and genotypes of drug transporters, including ATP binding cassette B1 (ABCB), ABCG2, solute carrier 22A1 (SLC22A1), solute carrier organic anion transporter family members 1B1 (SLCO1B1) and SLCO1B3. The imatinib levels in leukocytes were determined using HPLC in 15 patients with chronic phase CML. No significant correlation between intracellular and plasma concentrations of imatinib was observed. The intracellular concentration was comparable in both patients with or without complete cytogenetic response. The intracellular imatinib concentration was significantly higher in patients with SLCO1B3 334TT than in those with 334TG/GG (p=0.0188). Plasma concentrations were similar in both SLCO1B3 genotypes (p=0.860), thereby resulting in the intracellular to plasma concentration ratio being higher in patients with SLCO1B3 334TT than those with 334 TG/GG (p=0.0502). These results suggested that the SLCO1B3 334T>G polymorphism could have a significant impact on the intracellular concentration of imatinib in leukocytes as a promising biomarker for personalized treatment of CML patients.
Keywords: imatinib, polymorphism, chronic myeloid leukemia, organic anion transporter
Imatinib, an inhibitor specific for the breakpoint cluster region-Abelson (BCR-ABL), has been shown to be highly effective in the treatment of patients with chronic myeloid leukemia (CML).1,2) The relationships between pharmacokinetics and pharmacodynamics of imatinib at steady state have been reported.3—5) Picard et al. suggested that trough plasma imatinib levels at steady-state are required to exceed 1002 ng/ml to obtain a clinical benefit in patients with CML, and that plasma concentrations of imatinib were associated with the clinical response.3) These findings suggest that therapeutic drug monitoring of imatinib is useful for personalized management of patients with CML.
Recent study suggested that the intracellular concentration of imatinib in leukocytes is important for clinical outcome in patients with CML.6—10) White et al. demonstrated that the inhibitory concentration 50% for imatinib (IC50) in the level of phosphorylated Crkl on mononuclear cells, which correlated with intracellular uptake and retention (IUR) of imatinib, was a predictor of molecular response in patients with de novo CML.6—8) Thus, monitoring intracellular imatinib levels in leukocytes might accurately predict clinical outcome, and be useful in combination with monitoring plasma imatinib levels to establish personalized treatment of patients with CML. However, there is no report that directly identifies the relationship between intracellular imatinib concentration, plasma concentration, and clinical response.
Widmer et al. showed that active transport processes could mediate the concentration of imatinib into mononuclear cells.11) Imatinib was known to be substrate for efflux transporter, ABCB1 (ATP binding cassette B1, multidrug resistance 1, MDR1), and ABCG2 (ATP binding cassette G2, breast cancer resistance protein, BCRP) and influx transporter, SLC22A1 (solute carrier 22A1, organic cation transporter 1, OCT1), and SLCO1B3 (solute carrier organic anion transporter family member 1B3, organic anion transporting polypeptide 1B3, OATP1B3).8—10,12—15) Previous study have indicated that the genetic variation in drug transporters affect imatinib pharmacokinetics and/or clinical response to imatinib; however the influence of variants of drug transporters on the intracellular concentration of imatinib has not been reported.9,16—18)
In this study, we measured intracellular imatinib levels in leukocytes and investigated the correlation between leukocytes imatinib levels and clinical outcome, plasma concentrations, and/or an impact of genotype of drug transporters on leukocyte concentration of imatinib in CML patients.
MATERIALS AND METHODS
Patients
Intracellular and plasma concentrations of imatinib at steady-state (on day 30 of treatment or later) were assessed in 15 patients with CML who were followed up at Kumamoto University Hospital during 2003 to 2008. Approval from the ethics committee in Kumamoto University Hospital was obtained, and all patients provided informed consent to participate in this study, which was performed in accordance with the Declaration of Helsinki. Cytogenetic responses to imatinib were assessed using a conventional cytogenetic analysis of bone marrow metaphases. Complete cytogenetic response (CCR) was defined as 0% of Philadelphia chromo-some-positive cells in bone marrow aspirate.19) For assay of molecular responses, total RNA was isolated from peripheral blood cells or bone marrow cells, and BCR-ABL transcript levels were quantified using real-time quantitative polymerase chain reaction (PCR). Three or more log reduction in the transcript levels was determined to be a major molecular response (MMR).
Buffy Coat Cells Isolation
Two milliliters of 6% dextran was added to 10 ml blood and incubated at room temperature for 30 min.20) After incubation, the upper layer containing the leukocytes was separated from the red blood cell layer and centrifuged at 2000 rpm for 10 min at 4 °C. The cell pellet was washed once in ice-cold phosphate buffered saline (PBS) containing 1% bovine serum albumin (BSA) and twice with ice-cold PBS. The obtained pellets were called the buffy coat cells.
Measurements of Intracellular and Plasma Concentrations of Imatinib
Quantitative analysis of imatinib in leukocytes was performed using HPLC as described previously with some modifications.10,21) Buffy coat cells were added to 1 ml water containing 5.25 μg/ml internal standard, clozapine, and the resultant suspension was sonicated. The cellular imatinib were then purified by solid phase extraction by Oasis HLB (Waters, Milford, MA, U.S.A.). Imatinib and clozapine were eluted with 1500 μl of methanol and evaporated to dryness under vacuum. The residue was resuspended in 70 μl mobile phase solution of HPLC, and a volume of 50 μl was injected into the HPLC column. Plasma concentrations of imatinib were measured using an HPLC method described previously.5) The protein concentration was determined by the method of BCA protein assay (Pierce, Rockford, IL, U.S.A.) with bovine serum albumin as a standard.
Genotype Analysis
Genomic DNA was isolated from whole blood using MagNA Pure LC DNA isolation Kit I (Roche Diagnostics, Mannheim, Germany). TaqMan SNP Genotyping Assays from Applied Biosystems (Foster City, CA, U.S.A.) were used to determine the 6 single nucleotide polymorphisms (SNPs) including SLC22A1 1022C>T (C_15877554_40), SLCO1B1 521T>C (C_30633906_10), SLCO1B3 334T>G (C_25639181_40), ABCB1 1236C>T (C_7586662_10), ABCB1 3435C>T (C_7586657_20), and ABCG2 421C>A (C_15854163_70). The genotype of ABCB1 12677G>T/A was analyzed by Sigma-Aldrich DNA Sequencing Service, Japan.
Statistical Analysis
Correlations between two continuous variables were analyzed using Pearson’s correlation coefficient test. The Mann–Whitney U test and Student’s t test were used to determine differences between two groups with normal and non-normal distribution, respectively. Differences were considered statistically significant at p<0.05.
RESULTS
Intracellular and Plasma Concentration of Imatinib
Characteristics of the 15 patients are summarized in Table 1. Each patient started with the standard recommended daily dose (400 mg) of imatinib. However, the daily dose was subsequently modified due to adverse events including cytopenia, nausea, edema, and skin rash. The dose of imatinib was reduced to 100—300 mg/d in 7 of 15 patients. The trough intracellular concentrations of imatinib were measured in 19 samples from 15 patients at steady-state. Intracellular concentration of imatinib (mean±S.D.) were 92.1±47.7 ng/mg protein. The inter-individual variation was 51.7% in intracellular levels of imatinib. No correlation was observed between intracellular and plasma concentrations of imatinib in patients with chronic phase CML (Fig. 1, r=0.281, p=0.310).
Table 1.
Characteristics of 15 Patients Treated with Imatinib
| Characteristics | |
|---|---|
| Total | 15 |
| Response | |
| with CHR | 3 |
| with minor CR | 1 |
| with CCR | 7 |
| with MMR | 4 |
| Gender | |
| Male | 11 |
| Female | 4 |
| Age at diagnosis (year) | |
| Median | 51 |
| Range | 21—77 |
| BSA | |
| Mean | 1.68 |
| SD | 0.16 |
| Duration of treatment (month) | |
| Median | 19 |
| Range | 3—84 |
| Dose | |
| 400 mg | 8 |
| 300 mg | 4 |
| 200 mg | 2 |
| 100 mg | 1 |
Fig. 1. Association between Intracellular and Plasma Concentrations of Imatinib.
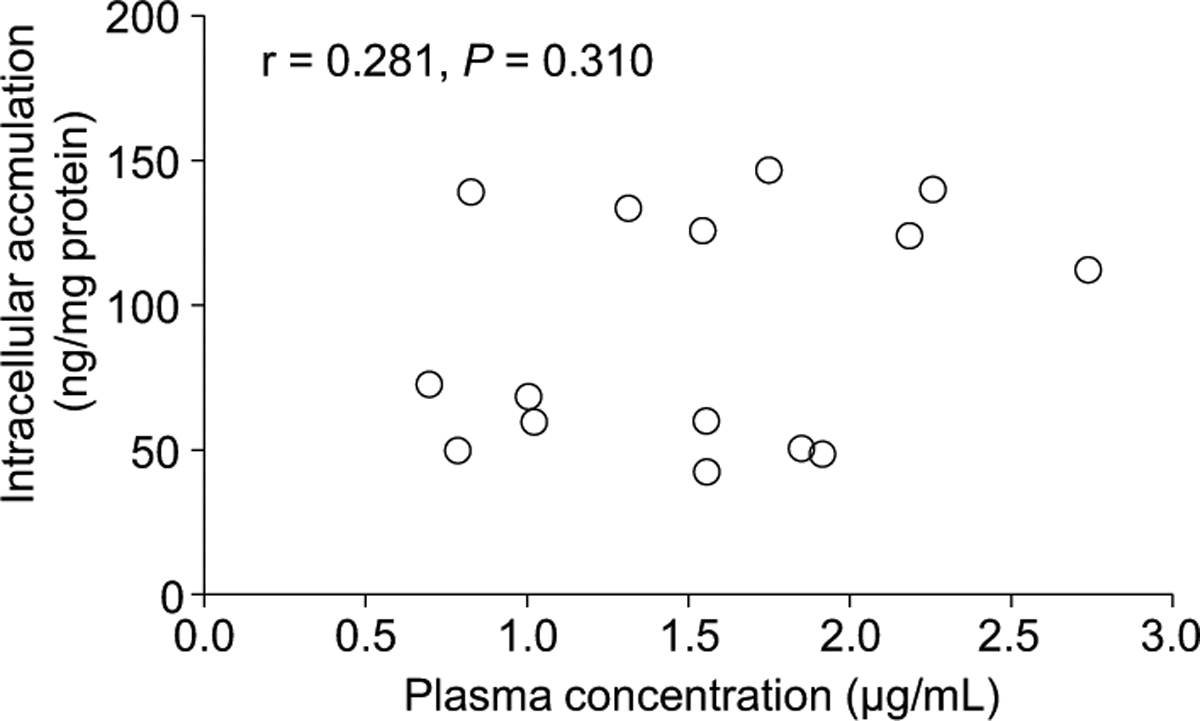
Each point represents the mean value of individual patients. There was no correlation between the intracellular and plasma concentrations of imatinib in patients with CML (r=0.281, p=0.310). Correlations between intracellular and plasma concentration were analyzed using Pearson’s correlation coefficient test.
Intracellular Concentration of Imatinib and Clinical Outcome
Clinical characteristics of the 15 patients with CCR (n=11) or without CCR (n=4) are shown in Table 1. There was no difference in the dose of imatinib (<400 mg or 400 mg) between patients with CCR and those without CCR (Fisher’s exact probability test, p=0.231). There was no relationship between intracellular concentration, plasma concentration, and intracellular to plasma concentration ratio and cytogenetic response to imatinib (Fig. 2). Similarly, no significant association between these levels of imatinib and molecular response to imatinib was observed (data not shown).
Fig. 2. Association between Clinical Response and the Intracellular Concentrations (A), the Plasma Concentration (B), and the Intracellular to Plasma Concentration Ratio (C) of Imatinib.
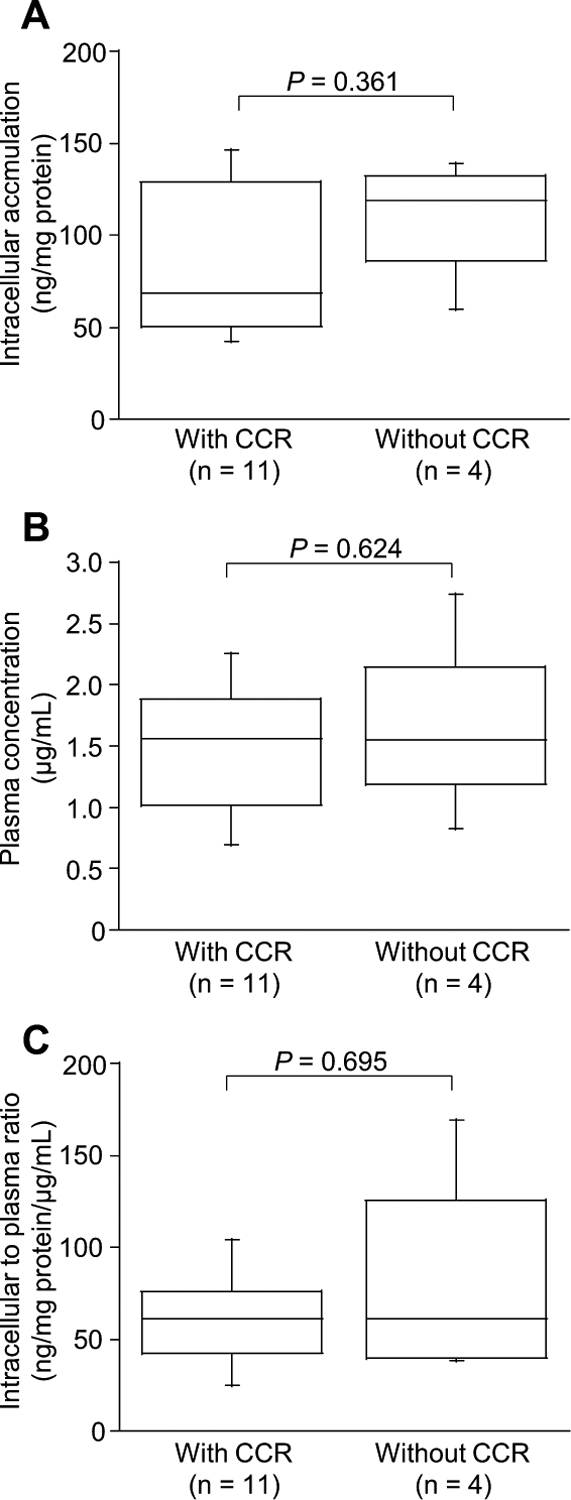
Boxes represent the distribution of the 25th and 75th percentiles; lines within boxes represent median values. Bars represent ranges. The Mann–Whitney U test (A and C) and Student’s t test (B) were used for two-group comparisons. Differences were considered statistically significant at p<0.05.
Intracellular Concentrations of Imatinib and Geno-types of Drug Transporters
Seven SNPs were analyzed in five genes, including ABCB1, ABCG2, SLC22A1, SLCO1B1, and SLCO1B3. The relative frequencies of the variant alleles were comparable with previous reported estimates (Table 2). The intracellular concentrations, plasma concentrations, and intracellular to plasma concentration ratios of imatinib for each genotype of transporters were determined and summarized in Table 3. There were no significant differences in intracellular concentrations, plasma concentrations, and intracellular to plasma concentration ratios of imatinib among the ABCB1, ABCG2, SLC22A1, and SLCO1B1 polymorphisms. However, the intracellular levels of imatinib (median S.D., ng/mg protein) were statistically higher in patients with the SLCO1B3 334TT (136±6.56) than in patients with the 334TG/GG (60.0±35.25, p=0.0188, Fig. 3A). In contrast, imatinib plasma levels were similar in both patients with SLCO1B3 TT and TG/GG (p=0.860, Fig. 3B). The intracellular to plasma concentration ratio of imatinib (median±S.D., ng/mg protein/μg/ml) appeared to be higher in patients with the SLCO1B3 334TT (91.5±47.0) than in patients with the 334TG/GG (56.7±25.3), although there was no statistical significance (p=0.0502, Fig. 3C). Despite difference in cellular imatinib levels, there were no differences in the dose of and response to imatinib between patients with the 334TT and patients with the SLCO1B3 TG/GG (Mann–Whitney U test, p=0.720, and p=0.440, respectively).
Table 2.
Genotype and Allele Frequencies of the Studied Variants
| Gene | Genotype frequency (No. of patients (%)) | Allele frequency | |||
|---|---|---|---|---|---|
| Wt | Her | Var | p | q | |
| ABCB1 | |||||
| 1236C>T | 1 (6.7) | 13 (86.7) | 1 (6.7) | 0.5 | 0.5 |
| 2677G>T/A | 7 (46.7) | 5 (33.3) | 3 (20.0) | 0.633 | 0.367 |
| 3435C>T | 5 (33.3) | 9 (60.0) | 1 (6.7) | 0.633 | 0.367 |
| ABCG2 | |||||
| 421C>A | 8 (53.3) | 7 (46.7) | 0 (0) | 0.767 | 0.233 |
| SLC22A1 | |||||
| 1022C>T | 10 (66.7) | 4 (26.7) | 1 (6.7) | 0.8 | 0.2 |
| SLCO1B1 | |||||
| 521T>C | 12 (80.0) | 2 (13.3) | 1 (6.7) | 0.867 | 0.133 |
| SLCO1B3 | |||||
| 334T>G | 4 (26.7) | 3 (20.0) | 8 (53.3) | 0.367 | 0.633 |
Table 3.
Summary of Genotype and Intracellular Concentration of Imatinib
| Gene | n | Intra | Plasma | Intracellular to plasma | p-value | |||||
|---|---|---|---|---|---|---|---|---|---|---|
| Intra | Plasma | Intracellular to plasma | ||||||||
| ABCB1 1236C>T | Median | Range | Mean | Range | Mean | Range | ||||
| CC | 1 | 125 | 1.54 | 81.4 | ||||||
| CT | 13 | 68.4 | (42.4—147) | 1.44 | (0.696—2.26) | 68.1 | (25.1—169) | |||
| TT | 1 | 112 | 2.74 | 41.0 | ||||||
| ABCB1 2677G>T/A | Mean | Range | Mean | Range | Mean | Range | 0.817c) | 0.258c) | 0.169c) | |
| GG | 7 | 85.1 | (42.4—147) | 1.60 | (0.785—2.74) | 60.0 | (27.2—83.8) | |||
| GT+GA | 5 | 101 | (48.5—140) | 1.74 | (1.02—2.26) | 60.6 | (25.1—101) | |||
| TT+TA | 3 | 90.5 | (60.0—139) | 1.03 | (0.696—1.56) | 104 | (38.5—169) | |||
| ABCB1 3435C>T | Mean | Range | Mean | Range | Mean | Range | 0.733a) | 0.740a) | 0.613a) | |
| C | 5 | 86.3 | (42.4—147) | 1.46 | (0.785—2.85) | 59.8 | (27.2—83.8) | |||
| CT+TT | 10 | 94.2 | (48.5—140) | 1.57 | (0.696—2.74) | 70.8 | (25.1—162) | |||
| ABCG2 421C>A | Mean | Range | Mean | Range | Mean | Range | 0.874a) | 0.846a) | 0.674a) | |
| CC | 8 | 93.2 | (49.8—140) | 1.50 | (0.785—2.74) | 71.2 | (27.3—169) | |||
| CA | 7 | 89.7 | (42.0—147) | 1.57 | (0.696—2.18) | 62.5 | (25.1—104) | |||
| SLC22A1 1022C>T | Median | Range | Mean | Range | Median | Range | 0.713b) | 0.611a) | 0.142b) | |
| CC | 10 | 64.2 | (42.4—147) | 1.59 | (0.826—2.26) | 57.5 | (25.1—169) | |||
| CT+TT | 5 | 112 | (49.8—134) | 1.42 | (0.696—2.74) | 81.4 | (41.0—104) | |||
| SLCO1B1 521T>C | Median | Range | Mean | Range | Mean | Range | 0.149b) | 0.963a) | 0.0685a) | |
| TT | 12 | 64.2 | (42.4—147) | 1.54 | (0.696—2.74) | 58.3 | (25.1—104) | |||
| TC/CC | 3 | 126 | (124—139) | 1.52 | (0.826—2.19) | 103 | (56.7—169) | |||
| SLCO1B3 334T>G | Median | Range | Mean | Range | Median | Range | 0.0188b) | 0.860a) | 0.0502b) | |
| TT | 4 | 136 | (125—140) | 1.49 | (0.825—2.26) | 91.5 | (61.3—169) | |||
| TG+GG | 11 | 60.0 | (42.4—147) | 1.55 | (0.696—2.74) | 56.7 | (25.1—104) | |||
Student’s t test.
Mann–Whitney U test.
One-way ANOVA.
Fig. 3. Association between the SLCO1B3 334T G Polymorphism and the Intracellular Concentration of Imatinib in Leukocytes (A), the Plasma Concentration (B), and the Intracellular to Plasma Concentration Ratio (C).
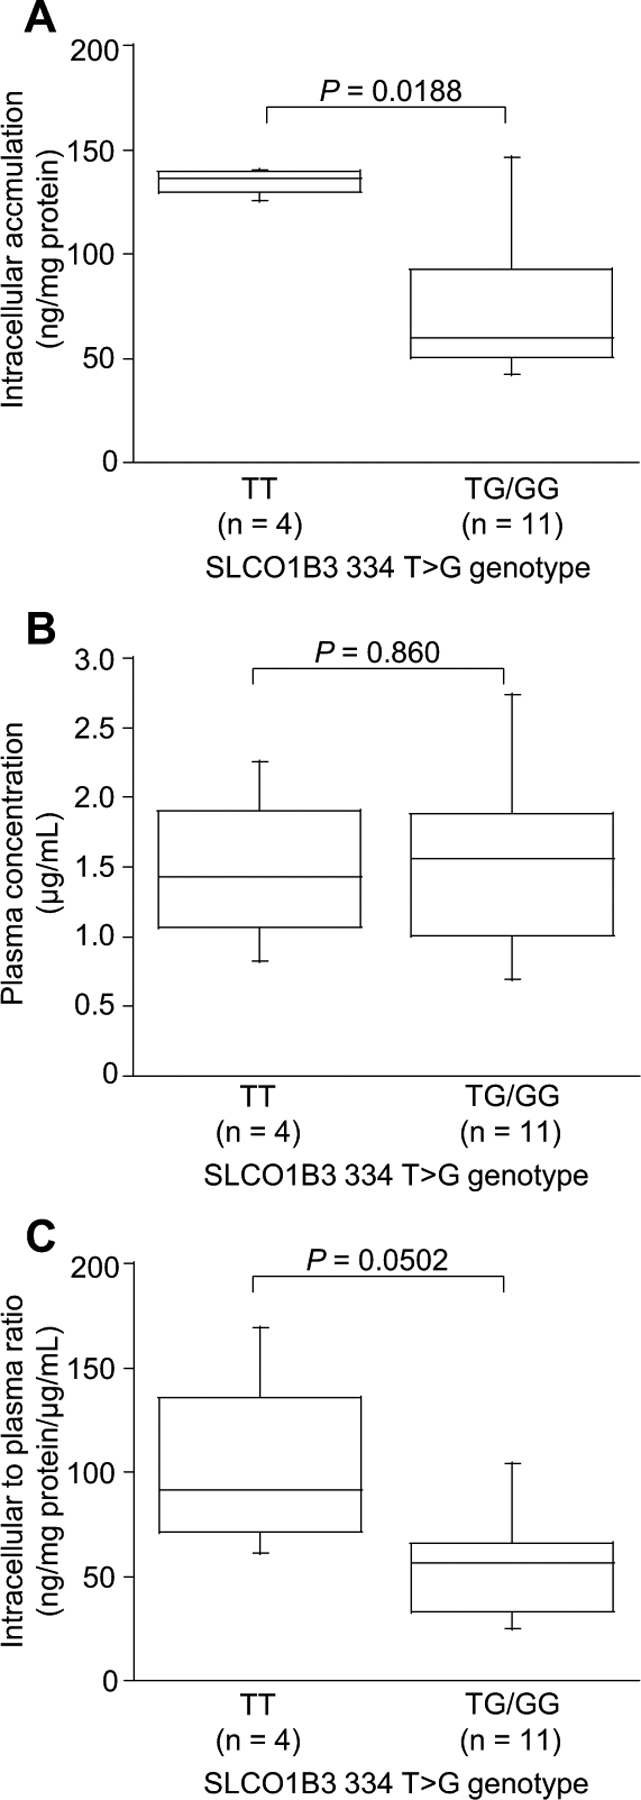
Boxes represent the distribution of the 25th and 75th percentiles; lines within boxes represent median values. Bars represent ranges. The Mann–Whitney U test (A and C) and Student’s t test (B) were used for two-group comparisons. Differences were considered statistically significant at p<0.05.
DISCUSSION
We investigated the relationship between intracellular concentrations, and clinical outcome and/or plasma concentrations of imatinib, as well as genotypes of transporters mediating leukocyte uptake of imatinib in CML patients. There was no difference in leukocytes imatinib levels between patients with CCR and those without CCR. No correlation was observed between intracellular and plasma concentration in patients with CML. It is noteworthy that the intracellular concentration and the intracellular to plasma concentration ratio of imatinib appeared to be higher in patients with the SLCO1B3 334TT than in patients with the 334TG/GG, although the plasma imatinib levels were comparable in both genotypes (Table 3, Fig. 3). The SLCO1B3 334T>G polymorphism could affect the leukocyte imatinib levels and possibly clinical response to imatinib in patients with CML.
There was no relationship between the intracellular concentration of imatinib and response to imatinib. The leukemia initiating cells are thought to be important for disease eradication.22) In the present study, we did not separate mature leukocytes and leukemia initiating cells, because the population of leukemia initiating cells is relatively small and these cells could be insensitive to imatinib. Recently, Engler et al. suggested that the poor response to imatinib is not associated with the uptake of imatinib into primitive CD34 CML+cells.23) According to this study, the reason for no relationship between the intracellular concentration and response may not be due to no separation between mature leukocytes and leukemia initiating cells. Therefore, in patients without CCR, intrinsic property of leukemic cells such as mutations of BCR-ABL, or alternative survival pathways could be responsible for imatinib insensitivity,24—27) because the intracellular and plasma concentration of imatinib are comparable between the patients with and without CCR.
In the present study, there were no significant associations between intracellular and plasma concentrations of imatinib (Fig. 1). The active transport processes including influx transporters might determine the intracellular concentration of imatinib.11) Imatinib is also known to be approximately 95% bound to human plasma proteins, mainly albumin and α1-acid glycoprotein28) and the amount of α1-acid glycoprotein plasma concentrations have previously been shown to affect imatinib pharmacokinetics.11) Unbound imatinib fraction, which can be taken up by the targeted cells, may be affected by plasma α1-acid glycoprotein. Therefore, the activity of drug transporters, unbound fraction of imatinib or concentration of α1-acid glycoprotein may influence intracellular imatinib levels.
We showed that the intracellular concentrations of imatinib were higher in patients with the SLCO1B3 334TT than in patients with the 334TG/GG (Table 3, Fig. 3). The SLCO1B3 334T>G polymorphism is known to show a difference in transport activity of endogenous steroids and several drugs.29,30) This polymorphism is complete linkage disequilibrium with the 699G>A polymorphism. The non-synonymous polymorphism 334T>G and 699G>A result in the amino acid exchange Ser112Ala and Met233Ile, respectively. Thus, SLCO1B3 334TG/GG may affect the leukocyte imatinib levels by modulating transport activity and/or its affinity against imatinib. The uptake assay using cells transfected with variant of SLCO1B3 will need to be confirmed the influence of SLCO1B3 polymorphism to imatinib transport.
Imatinib is also recognized by the influx transporter SLC22A1 (OCT1).31,32) White et al. demonstrated that the OCT1 activity determined the IUR of imatinib and this activity was good predictor of response to imatinib treatment.6—8) We observed no relationship between the intracellular concentration and SLC22A1 1022C>T polymorphism, which has a decreased ability to transport test compound.33,34) Despite the importance of SLC22A1 for the IUR and the clinical response to imatinib, there is no report that the SLC22A1 polymorphisms influences on pharmacokinetics of imatinib.14,16) While Takahashi et al. indicated that the SLC22A1 1022A>G polymorphism is probably associated with achieving a major molecular response, although this variant did not affect pharmacokinetics of imatinib.17) Thus, further work is required to clarify the influence of SLC22A1 polymorphisms to intracellular concentration of imatinib, because another SLC22A1 156T>C, 480C>G, and 1222A>G polymorphisms may affect the intracellular concentration of imatinib. The SLCO1B1 521T>C polymorphism, which is associated with reduced transport activity of several drugs,35,36) could not affect the intracellular concentration of imatinib. This result is consistent with the previous report that imatinib is not transported by SLCO1B1.14) Imatinib was also transported by efflux transporters including ABCB1 and ABCG2.12,13,15) White et al. indicated that these transporters had no contribution to the variability in IC50 in mononuclear cells because of low expression of these transporters.7) Similarly, we observed no correlation between the variants of ABCB1 and ABCG2 and leukocytes imatinib levels.
The differences in the transport activity and expression levels of drug transporters between leukocytes and BCR-AB-expressing leukemic cells remain unclear; therefore it might be possible that the uptake process is different between normal leukocytes and leukemic cells. We have assessed the intracellular imatinib concentration in the mixture of normal leukocytes and leukemic cells, although the ratio of leukemic cells in peripheral blood is different in each patient with the variable responses to imatinib. To investigate the intracellular concentration of imatinib in chronic phase CML patients whose proportion of leukemic cells is high such as patients in the early period of medication may be required to verify the impact of SLCO1B3 polymorphism on imatinib-targeted leukemic cells.
Previous study demonstrated that high-dose imatinib could achieve early molecular and cytogenetic response to imatinib.37,38) In phase III study of daily imatinib 400 mg versus 800 mg in patients with CML, patients in the 800 mg/d arm who received less than 400 mg/d had lower response rate than patients in the 400 mg/d arm, because of the number of days off medication due to causing adverse effects.38) Thus, to identify the patients who should be received high dose of imatinib is important to adjust treatment strategies. White et al. indicated that patients with low OCT1 activity have worse imatinib response and the negative impact of low OCT1 activity on mononuclear cells might be overcome by high dose of imatinib.8) We observed no difference in the clinical response to imatinib between patients with the SLCO1B3 334TT genotype and those with the SLCO1B3 TG/GG geno-type. It is not clear whether the SLCO1B3 polymorphism affects the clinical outcome and could become predictor for dose escalation or not, because this study is small in scale.
In conclusions, we showed no significant correlations between intracellular concentration, clinical outcome, and plasma concentration of imatinib. Meanwhile, we have found that the SLCO1B3 334T>G polymorphism was associated with intracellular levels of imatinib in leukocytes of CML patients. Thus, the SLCO1B3 334T>G polymorphism could be a promising biomarker for personalized treatment with imatinib for CML patients. To confirm the relationship between the SLCO1B3 genotypes, the intracellular imatinib concentration, and clinical outcome, a large-scale cohort study will be required.
Acknowledgement
This work was supported in part by a Grant-in-Aid for Scientific Research from the Japan Society for the Promotion of Science for Hideyuki Saito (KAKENHI 21390048) and Akinobu Hamada (KAKENHI 21590167).
REFERENCES
- 1).Druker BJ, Guilhot F, O’Brien SG, Gathmann I, Kantarjian H, Gattermann N, Deininger MW, Silver RT, Goldman JM, Stone RM, Cervantes F, Hochhaus A, Powell BL, Gabrilove JL, Rousselot P, Reiffers J, Cornelissen JJ, Hughes T, Agis H, Fischer T, Verhoef G, Shepherd J, Saglio G, Gratwohl A, Nielsen JL, Radich JP, Simonsson B, Taylor K, Baccarani M, So C, Letvak L, Larson RA, Engl N. J. Med, 355, 2408—2417 (2006). [DOI] [PubMed] [Google Scholar]
- 2).Capdeville R, Buchdunger E, Zimmermann J, Matter A, Nat. Rev. Drug Discov, 1, 493—502 (2002). [DOI] [PubMed] [Google Scholar]
- 3).Picard S, Titier K, Etienne G, Teilhet E, Ducint D, Bernard MA, Lassalle R, Marit G, Reiffers J, Begaud B, Moore N, Molimard M, Mahon FX, Blood, 109, 3496—3499 (2007). [DOI] [PubMed] [Google Scholar]
- 4).Larson RA, Druker BJ, Guilhot F, O’Brien SG, Riviere GJ, Krahnke T, Gathmann I, Wang Y, Blood, 111, 4022—4028 (2008). [DOI] [PubMed] [Google Scholar]
- 5).Kawaguchi T, Hamada A, Hirayama C, Nakashima R, Nambu T, Yamakawa Y, Watanabe H, Horikawa K, Mitsuya H, Saito H, Int. J. Hematol, 89, 642—648 (2009). [DOI] [PubMed] [Google Scholar]
- 6).White D, Saunders V, Lyons AB, Branford S, Grigg A, To LB, Hughes T, Blood, 106, 2520—2526 (2005). [DOI] [PubMed] [Google Scholar]
- 7).White DL, Saunders VA, Dang P, Engler J, Zannettino AC, Cambareri AC, Quinn SR, Manley PW, Hughes TP, Blood, 108, 697—704 (2006). [DOI] [PubMed] [Google Scholar]
- 8).White DL, Saunders VA, Dang P, Engler J, Venables A, Zrim S, Zannettino A, Lynch K, Manley PW, Hughes T, Blood, 110, 4064—4072 (2007). [DOI] [PubMed] [Google Scholar]
- 9).Wang L, Giannoudis A, Lane S, Williamson P, Pirmohamed M, Clark RE, Clin. Pharmacol. Ther, 83, 258—264 (2008). [DOI] [PubMed] [Google Scholar]
- 10).Hirayama C, Watanabe H, Nakashima R, Nanbu T, Hamada A, Kuniyasu A, Nakayama H, Kawaguchi T, Saito H, Pharm. Res, 25, 827—835 (2008). [DOI] [PubMed] [Google Scholar]
- 11).Widmer N, Decosterd LA, Csajka C, Leyvraz S, Duchosal MA, Rosselet A, Rochat B, Eap CB, Henry H, Biollaz J, Buclin T, Br. J. Clin. Pharmacol, 62, 97—112 (2006). [DOI] [PMC free article] [PubMed] [Google Scholar]
- 12).Mahon FX, Deininger MW, Schultheis B, Chabrol J, Reiffers J, Goldman JM, Melo JV, Blood, 96, 1070—1079 (2000). [PubMed] [Google Scholar]
- 13).Burger H, van Tol H, Boersma AW, Brok M, Wiemer EA, Stoter G, Nooter K, Blood, 104, 2940—2942 (2004). [DOI] [PubMed] [Google Scholar]
- 14).Hu S, Franke RM, Filipski KK, Hu C, Orwick SJ, de Bruijn EA, Burger H, Baker SD, Sparreboom A, Clin. Cancer Res, 14, 3141—3148 (2008). [DOI] [PubMed] [Google Scholar]
- 15).Hamada A, Miyano H, Watanabe H, Saito H, J. Pharmacol. Exp. Ther, 307, 824—828 (2003). [DOI] [PubMed] [Google Scholar]
- 16).Zach O, Krieger O, Foedermayr M, Zellhofer B, Lutz D, Leuk. Lymphoma, 49, 2222—2223 (2008). [DOI] [PubMed] [Google Scholar]
- 17).Takahashi N, Miura M, Scott SA, Kagaya H, Kameoka Y, Tagawa H, Saitoh H, Fujishima N, Yoshioka T, Hirokawa M, Sawada K, J. Hum. Genet, 55, 731—737 (2010). [DOI] [PubMed] [Google Scholar]
- 18).Gardner ER, Burger H, van Schaik RH, van Oosterom AT, de Bruijn EA, Guetens G, Prenen H, de Jong FA, Baker SD, Bates SE, Figg WD, Verweij J, Sparreboom A, Nooter K, Clin. Pharmacol. Ther, 80, 192—201 (2006). [DOI] [PubMed] [Google Scholar]
- 19).Colombat M, Fort MP, Chollet C, Marit G, Roche C, Preudhomme C, Reiffers J, Praloran V, Mahon FX, Haematologica, 91, 162—168 (2006). [PubMed] [Google Scholar]
- 20).Thierfelder S, Vox Sang, 9, 447—454 (1964). [DOI] [PubMed] [Google Scholar]
- 21).Widmer N, Beguin A, Rochat B, Buclin T, Kovacsovics T, Duchosal MA, Leyvraz S, Rosselet A, Biollaz J, Decosterd LA, Chromatogr J. B Analyt. Technol. Biomed. Life Sci, 803, 285—292 (2004). [DOI] [PubMed] [Google Scholar]
- 22).Bhatia R, Holtz M, Niu N, Gray R, Snyder DS, Sawyers CL, Arber DA, Slovak ML, Forman SJ, Blood, 101, 4701—4707 (2003). [DOI] [PubMed] [Google Scholar]
- 23).Engler JR, Frede A, Saunders V, Zannettino A, White DL, Hughes TP, Blood, 116, 2776—2778 (2010). [DOI] [PubMed] [Google Scholar]
- 24).Branford S, Rudzki Z, Walsh S, Grigg A, Arthur C, Taylor K, Herrmann R, Lynch KP, Hughes TP, Blood, 99, 3472—3475 (2002). [DOI] [PubMed] [Google Scholar]
- 25).Donato NJ, Wu JY, Stapley J, Gallick G, Lin H, Arlinghaus R, Talpaz M, Blood, 101, 690—698 (2003). [DOI] [PubMed] [Google Scholar]
- 26).Dai Y, Rahmani M, Corey SJ, Dent P, Grant S, J. Biol. Chem, 279, 34227—34239 (2004). [DOI] [PubMed] [Google Scholar]
- 27).Nambu T, Araki N, Nakagawa A, Kuniyasu A, Kawaguchi T, Hamada A, Saito H, Cancer Sci, 101, 137—142 (2010). [DOI] [PMC free article] [PubMed] [Google Scholar]
- 28).Gambacorti-Passerini C, Barni R, le Coutre P, Zucchetti M, Cabrita G, Cleris L, Rossi F, Gianazza E, Brueggen J, Cozens R, Pioltelli P, Pogliani E, Corneo G, Formelli F, D’Incalci M, Natl J. Cancer Inst, 92, 1641—1650 (2000). [DOI] [PubMed] [Google Scholar]
- 29).Letschert K, Keppler D, Konig J, Pharmacogenetics, 14, 441—452 (2004). [DOI] [PubMed] [Google Scholar]
- 30).Hamada A, Sissung T, Price DK, Danesi R, Chau CH, Sharifi N, Venzon D, Maeda K, Nagao K, Sparreboom A, Mitsuya H, Dahut WL, Figg WD, Clin. Cancer Res, 14, 3312—3318 (2008). [DOI] [PMC free article] [PubMed] [Google Scholar]
- 31).Thomas J, Wang L, Clark RE, Pirmohamed M, Blood, 104, 3739—3745 (2004). [DOI] [PubMed] [Google Scholar]
- 32).Crossman LC, Druker BJ, Deininger MW, Pirmohamed M, Wang L, Clark RE, Blood, 106, 1133—1134; author reply 1134 (2005). [DOI] [PubMed] [Google Scholar]
- 33).Sakata T, Anzai N, Shin HJ, Noshiro R, Hirata T, Yokoyama H, Kanai Y, Endou H, Biochem. Biophys. Res. Commun, 313, 789—793 (2004). [DOI] [PubMed] [Google Scholar]
- 34).Shu Y, Leabman MK, Feng B, Mangravite LM, Huang CC, Stryke D, Kawamoto M, Johns SJ, DeYoung J, Carlson E, Ferrin TE, Herskowitz I, Giacomini KM, Proc. Natl. Acad. Sci. U.S.A, 100, 5902—5907 (2003). [DOI] [PMC free article] [PubMed] [Google Scholar]
- 35).Mwinyi J, Johne A, Bauer S, Roots I, Gerloff T, Clin. Pharmacol. Ther, 75, 415—421 (2004). [DOI] [PubMed] [Google Scholar]
- 36).Kameyama Y, Yamashita K, Kobayashi K, Hosokawa M, Chiba K, Pharmacogenet. Genomics, 15, 513—522 (2005). [DOI] [PubMed] [Google Scholar]
- 37).Cortes JE, Kantarjian HM, Goldberg SL, Powell BL, Giles FJ, Wetzler M, Akard L, Burke JM, Kerr R, Saleh M, Salvado A, McDougall K, Albitar M, Radich J, J. Clin. Oncol, 27, 4754—4759 (2009). [DOI] [PMC free article] [PubMed] [Google Scholar]
- 38).Cortes JE, Baccarani M, Guilhot F, Druker BJ, Branford S, Kim DW, Pane F, Pasquini R, Goldberg SL, Kalaycio M, Moiraghi B, Rowe JM, Tothova E, De Souza C, Rudoltz M, Yu R, Krahnke T, Kantarjian HM, Radich JP, Hughes TP, J. Clin. Oncol, 28, 424—430 (2010). [DOI] [PMC free article] [PubMed] [Google Scholar]