Abstract
The purpose of this study was to quantify the potential dosimetric impact of delineation variability (DV) in head and neck radiation therapy (RT) when inherent patient setup variability (SV) is also considered.
The impact of DV was assessed by generating plans with multiple structure sets, cross-evaluating them, including SV, across sets, and determining PPQM: the probability of achieving organ-specific plan quality metrics (PQM). DV was incorporated by: (1) using multiple organ at risk (OAR) structure sets delineated by independent manual observers; and (2) randomly perturbing manually generated OARs to generate alternatives with varying levels of uncertainty (low, medium, and high DV). For each structure set, independent VMAT plans were auto-generated to meet clinical PQMs. Each plan was cross-evaluated using OARs from multiple structure sets with simulated SV including per-fraction random (σs) and per-treatment-course systematic (Σs) setup errors. The dosimetric impact of DV was assessed by examining PPQM with and without SV/DV. Clinically significant differences were defined by those that exceeded differences caused by a +2% output variation.
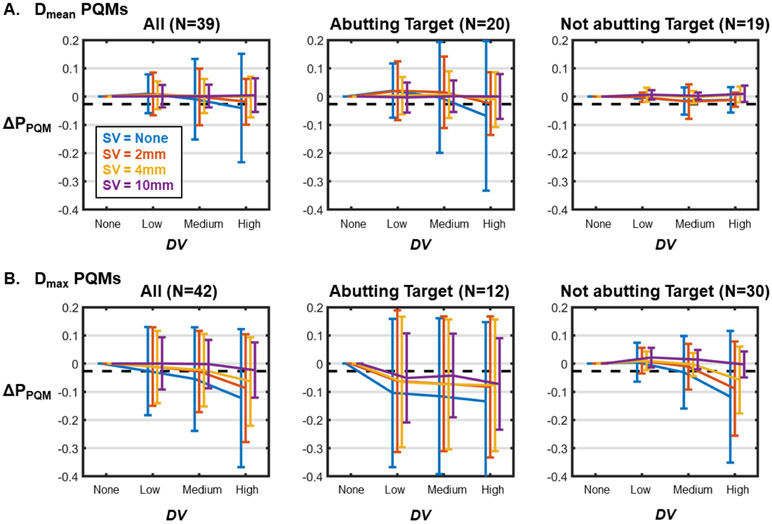
Without including SV, simulated DV at the medium level reduced PPQM by an average of 5.5% for all OARs with Dmax PQMs. This reduction decreased to 2.8% for SV = 2 mm and 2.4% for SV = 4 mm (the average PPQM reduction due to 2% output errors was 2.7%). For OARs with Dmean PQMs, the average PPQM reduction was 0.9% for SV = 0 and ⩽0.1% for SV ⩾ 2 mm. The effect of DV was larger for OARs that directly abutted a target volume than for those that did not. These trends were also observed with real DV from multi-observer delineations.
The dosimetric impact of DV appeared to decrease when random and systematic SV was considered. Sensitivity to DV was affected by OAR objective type (i.e. Dmean versus Dmax objectives) as well as distance from the target volume.
Keywords: uncertainty in radiation therapy, delineation variability, robustness analysis
Introduction
The accurate delineation of imaging volumes into treatment targets and organs at risk (OAR) is a critical component in the radiation therapy (RT) treatment process. Because structure delineation is among the first steps in treatment planning, variability at this stage leads to systematic treatment differences that could impact efficacy and/or healthy tissue toxicity.
While RT planning and plan evaluation typically proceeds under the assumption that all structure delineations represent the true underlying tissue, delineation variability (DV) is a recognized uncertainty (Vinod et al 2016). DV can stem from multiple sources, including inter-observer variability (i.e. multiple delineators will not generate precisely the same structures) (Bhardwaj et al 2008, Caravatta et al 2014, Xu et al 2016), intra-observer variability (i.e. the same delineator will not generate precisely the same structures in two different sessions) (Fiorino et al 1998, Petric et al 2008, Xu et al 2016), and methodological variability (i.e. manual delineators and algorithmic auto-delineators will not generate precisely the same structures) (Bondiau et al 2005, McWilliam et al 2015, Nourzadeh et al 2017).
Most studies that have assessed DV have done so by computing the geometric agreement between contour delineations via metrics such as the Dice similarity coefficient or Hausdorff distance (Vinod et al 2016). While this type of analysis is important in understanding the magnitude of DV, it does not provide a clinically meaningful endpoint. A smaller group of studies have examined the dosimetric consequences of DV by generating independent treatment plans using different delineations (Rasch et al 2002, Nelms et al 2012, McWilliam et al 2015, Martin et al 2015, Nourzadeh et al 2017). These studies found that DV leads to significant dosimetric variability in the resulting treatment plans. Notably, through this analysis, it has been observed that geometric contouring agreement metrics do not correlate strongly with dosimetric agreement (McWilliam et al 2015, Beasley et al 2016).
Other sources of uncertainty in RT can impact the true clinical consequences of DV. For example, variations in the location of a given organ between CT simulation and treatment clearly impact the effective accuracy of any delineation. This setup variability (SV) is known to occur and can stem from both random, day-to-day patient setup uncertainty and systematic setup errors that persist throughout a course of treatment (Ekberg et al 1998, van Herk 2004). To date, most studies that have characterized the dosimetric impact of DV have assessed it in isolation from these errors despite this not being a realistic scenario (Rasch et al 2002, Barghi et al 2013, McWilliam et al 2015, Martin et al 2015). To our knowledge, only Nourzadeh et al has incorporated SV in a dosimetric comparison between autocontours and manual contours in prostate IMRT (Nourzadeh et al 2017).
While DV and SV both certainly impact the dosimetry of an intended RT plan, it is unclear how the two sources of error cross-interact at different scales of uncertainty. For example, if SV is negligibly small (i.e. setup is highly reproducible), even a slight DV may have a clinically significant dosimetric impact, but if SV is large (i.e. setup reproducibility is poor), the same DV may have a negligible effect. DV is known to vary between organs (Fiorino et al 1998, Collier et al 2003, Bondiau et al 2005, Chao et al 2007, Nelms et al 2012, Brouwer et al 2012, Breunig et al 2012, Beadle et al 2013) and is likely to vary between delineation methods (i.e. manual delineators are likely more variable than computer-based auto-delineators). Furthermore, SV is known to vary between treatment sites and setup methodologies (Weltens et al 1995, Ekberg et al 1998, Tinger et al 1998, Hurkmans et al 2001, de Boer et al 2001, Velec et al 2010, Ove et al 2012, Verma et al 2016). It is therefore important to evaluate their relative contributions in varying uncertainty regimes.
In this study, we assessed the potential dosimetric impact of OAR DV when varying degrees of SV are considered in head and neck RT. DV was incorporated by: (1) using several structure sets containing OARs manually defined on a common image set by multiple independent delineators and (2) simulating variability at different magnitudes by applying random contour perturbations to manually delineated structures. To capture the dosimetric impact of DV, treatment plans were generated using each set of OARs for optimization and cross-comparison with other sets. For each combination of plan and structure set, SV was simulated by applying random and systematic patient setup errors over many virtual treatment courses to generate distributions of potential delivered dose distributions. With SV simulated at several magnitudes, changes in the probabilities of achieving clinically defined OAR plan quality metrics (PQM) with and without DV were computed.
Methods
CT scans and structure sets from N = 6 head and neck RT plans were evaluated in this study. One case contained 14 structure sets with all OARs defined by multiple independent delineators. These manual delineations and the associated image set were part of the European Society for Radiotherapy and Oncology (ESTRO) Falcon project and were obtained from EduCase.
The other cases (N = 5) were collected from patients who were previously treated at our institution and each contained a single, manually defined and clinically used OAR structure set. These plans were all treated to a prescription dose of 70 Gy in either 33 (N = 2) or 35 (N = 3) fractions. Specific treatment sites and prescriptions are listed in table 1. The local Institutional Review Board (IRB) approved this retrospective analysis of this data.
Table 1.
Description of patients evaluated in this study.
| Treatment Site | PTV1 Rx | PTV2 Rx | PTV3 Rx | Fractions |
|---|---|---|---|---|
| Supraglottis | 70 Gy | 56 Gy | N/A | 35 |
| Base of Tongue | 70 Gy | 56 Gy | N/A | 35 |
| Soft Palate | 70 Gy | 56 Gy | N/A | 35 |
| Nasopharynx | 70 Gy | 60 Gy | 54 Gy | 33 |
| Oropharynx | 70 Gy | 60 Gy | 54 Gy | 33 |
| Larynxa | 70 Gy | 60 Gy | 54 Gy | 35 |
The Larynx patient was not treated at our institution and the Rx was defined for the purposes of this study to match our clinical protocols.
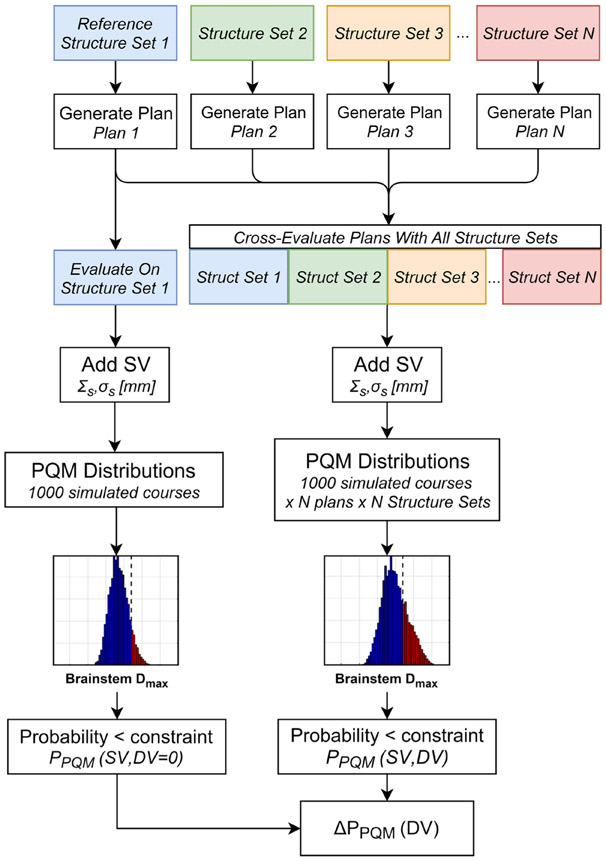
The study design broadly consisted of: (1) collecting or generating multiple distinct OAR structure sets for each patient; (2) generating multiple treatment plans with different structure sets considered as truth; and (3) evaluating each treatment plan as though each other structure set were actually truth. A flowchart depicting the study design is provided in figure 1.
Figure 1.
Flowchart describing how changes in the probability of achieving a clinical OAR objective (ΔPPQM) caused by DV were computed. This process for all OARs and subjects with varying setup variabilities (SV), which were simulated using a radiation therapy robustness analysis (RTRA) tool.
Alternative contour generation
For the five cases which did not have multiple structure sets available, DV was simulated by generating alternative contours with random perturbations from the manually defined clinical OAR contours. This was done using the average surface of standard deviation (ASSD) method (Xu et al 2016). In this method, contour points are perturbed by a spatially varying offset that is sampled from a probability distribution centered on zero with a user-defined standard deviation (σc). Perturbations are additionally scaled by the local CT image intensity gradient to reduce variability in areas with distinct boundaries. Gradient-based scaling factors were normalized to lie between 0 and 1 using a constant factor of 50 HU mm−1 as described in Xu et al (2016).
We varied σc to vary the amount that perturbed contours can deviate from the initial state and thus modulate the amount of DV that is generated across multiple repetitions. For each patient, five alterative structure sets were generated containing OARs perturbed using each of three σc values: σc = 2 mm, 5 mm, and 10 mm. Because σc does not directly describe the magnitude of the resulting DV (which is also modulated by local CT gradients), these settings will be referred to as simply ‘low’, ‘medium’, and ‘high’ DV.
Contour evaluation
For the case that was contoured by multiple delineators, 14 repetitions of each OAR were available, including a single reference contour. For each of the other five cases, the contour augmentation process resulted in a total of 16 repetitions of each OAR, including the initial manual structure. Agreement between a structure and its corresponding reference structure was computed using both Dice overlap and Hausdorff distance. Dice overlap describes global agreement between two regions and is a unitless value between 0 and 1 while Hausdorff distance describes the maximum local distance between surfaces and is measured in units of cm or mm. Median Dice values and Hausdorff distances were computed for each OAR across the independent delineators and for low, medium, and high simulated DV. Comparisons between multiple manual delineations of spinal cord, brainstem, and esophagus were limited in the cranio-caudal direction to the common contoured extent so as not to overestimate differences between structures that do not affect in-plane dosimetry.
Plan generation
Two-arc VMAT treatment plans were generated for all patients using an in-house autoplanning algorithm that was written in Pinnacle 16.2 for this study. Plans were optimized to meet clinical OAR PQM objectives as described in table 2. While the PQMs were mostly common across patients, varying objectives were used for the larynx and cochlea when specifically identified in the patient’s planning directive. Also note that not all of the OARs listed in table 2 were present for all patients.
Table 2.
List of PQMs used as dosimetric OAR objectives in this study. PQMs were kept consistent between patients except when planning directives specified alternative PQMs (there were varying PQMs for larynx and cochlea). Note that not all OARs were present in all cases.
| AR | PQM | Dose |
|---|---|---|
| Larynx | DMean | 30–45 Gy |
| Esophagus | 35 Gy | |
| Pharyngeal constrictors | 54 Gy | |
| Parotid (Rt. & Lt.) | 26 Gy | |
| Cochlea (Rt. & Lt.) | 35–45 Gy | |
| Oral cavity | 40 Gy | |
| Brainstem | DMax | 54 Gy |
| Optic nerves | 54 Gy | |
| Chiasm | 54 Gy | |
| Spinal cord | 45 Gy | |
| Eye (Rt. & Lt.) | 54 Gy | |
| Mandible | 75 Gy | |
| Brachial plexus | 66 Gy |
The autoplanning algorithm was initialized for each patient using a set of initial IMRT objectives defined on target-based planning structures (i.e. rings) and with OAR IMRT objectives set ~10 Gy below the dose level of each clinical PQM. Following an optimization run with these initial objectives, the success or failure of each OAR PQM was evaluated. For any OARs with unmet PQMs at this stage, IMRT planning objective dose levels were reduced by 2 Gy prior to re-running the optimization. This process was repeated twice for each plan prior to final dose calculation. Target coverage was ensured by keeping PTV minimum dose objective weights several orders of magnitude larger than OAR objectives (100 to ~0.01).
Separate plans were generated with this algorithm, each using a different structure set for optimization (i.e. 14–16 plans were generated for each patient).
Plan cross-comparison
To capture the effect of DV on plan generation, each plan was evaluated using the alternative structure sets for a given patient (i.e. the dose map from the plan optimized using structure set 1 was evaluated using the OARs in structure sets 2, 3, 4, etc). For multiple manual delineations, this cross comparison was performed across all structure sets which resulted in 196 plan-structure set combinations. For augmented delineations, cross comparisons were performed only across structure sets generated using the same DV level and the manual reference set. This resulted in 36 plan-structure set combinations for each of the three simulated DV levels (low, medium, high). Each of these plan-structure set combinations produced a measure of each clinical PQM (e.g. spinal cord Dmax) and the resulting PQM distributions reflected the effect of DV on clinically relevant plan characteristics.
SV simulation
SV was simulated using a previously described radiation therapy robustness analysis (RTRA) tool (Nourzadeh et al 2017). RTRA applies random rigid body displacements to simulated treatment courses with prescribed per-fraction random errors (σS) and per-course systematic errors (ΣS) to generate a range of possible dosimetric outcomes from a given plan. For this study, each evaluation simulated 1000 treatment courses. RTRA output was used to compute the distribution of potential PQMs (e.g. spinal cord Dmax) that are possible given the defined SV parameters.
For each combination of plan and structure set, RTRA was performed using three uncertainty settings to reflect different levels of SV: σS = ΣS = 2 mm, 4 mm, and 10 mm in the left-right, anterior-posterior, and superior-inferior directions. These values were chosen to cover both a range of clinically expected uncertainties (2 mm and 4 mm) as well much larger uncertainties (10 mm) in order to observe an exaggerated effect.
The cumulative effect of DV and SV was determined by combining PQM distributions output from RTRA across all plan-structure set combinations at a given DV level. Note that this analysis contains the case in which the plan generated using the reference structure set (i.e. the reference plan) was evaluated on the reference structure set. In this case, the resulting PQM distribution represents the effect of SV alone.
Quantification of dosimetric impact
The previous sections describe the generation of PQM distributions that represent the range of potential outcomes from a plan given DV alone, SV alone, and the combination of DV and SV. To assess the differences between these scenarios and thus the marginal impact of each source of error, each distribution was reduced to the probability of the relevant PQM being met, PPQM.
For each SV level (0, 2 mm, 4 mm, or 10 mm), the difference in PPQM, ΔPPQM, was computed between distributions that did and did not contain DV: ΔPPQM(DV) = PPQM(SV, DV) − PPQM(SV, DV = 0). This was computed for each OAR (i.e. each PQM) and for each DV level in the case of simulated DV.
Quantification of clinical significance
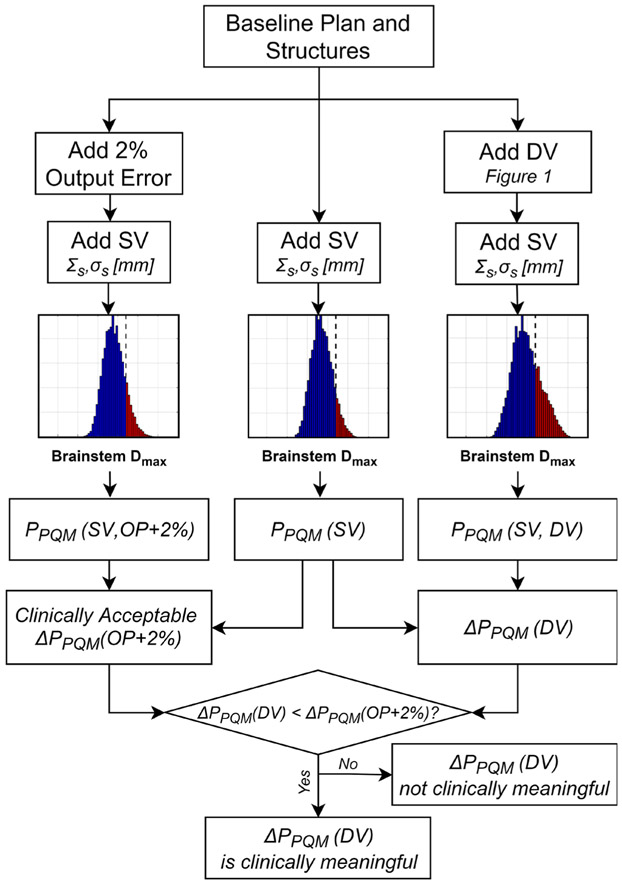
To determine whether ΔPPQM values caused by DV were potentially clinically meaningful, they were compared with the ΔPPQM that would result from clinically published acceptable machine variability. According to the report of AAPM task group 142, variations in linac output up to 2% are within tolerance for monthly quality assurance (QA) tests (Klein et al 2009). As such, we consider that any ΔPPQM due to DV does not exceed that of a uniform +2% error in linac output throughout a course of treatment (the worst case scenario that can occur within tolerance for an OAR) should not be considered clinically relevant. All PPQM calculations were thus also computed with +2% output errors (OP + 2%) by uniformly scaling the dose in all voxels. The effect of DV and SV was then compared with the effect of SV and OP + 2% wherein only cases in which ΔPPQM(DV) exceeded ΔPPQM(OP + 2%) in magnitude (i.e. more negative) were considered clinically significant. −2% output errors were also similarly simulated. This procedure is diagrammed in a flow chart in figure 2. Note that ΔPPQM was always computed with a fixed level of SV and thus SV is not included in the notation.
Figure 2.
Flowchart describing how it was determined whether ΔPPQM measurements were clinically meaningful. Assuming any ΔPPQM caused by a uniform 2% output error (which is within monthly QA tolerance levels) represents a clinically acceptable change, only ΔPPQM which exceeded this (i.e. were more negative) were considered clinically meaningful.
To generalize our results, average ΔPPQM values from the simulated DV cases were computed as a function of DV across OARs and patients for each SV level. For this analysis, OARs were grouped into those with Dmean and Dmax PQMs and into those that were directly abutting a target volume and those that were not. These average values were compared against the average ΔPPQM(OP + 2%) valued computed across all OARs and patients.
Results
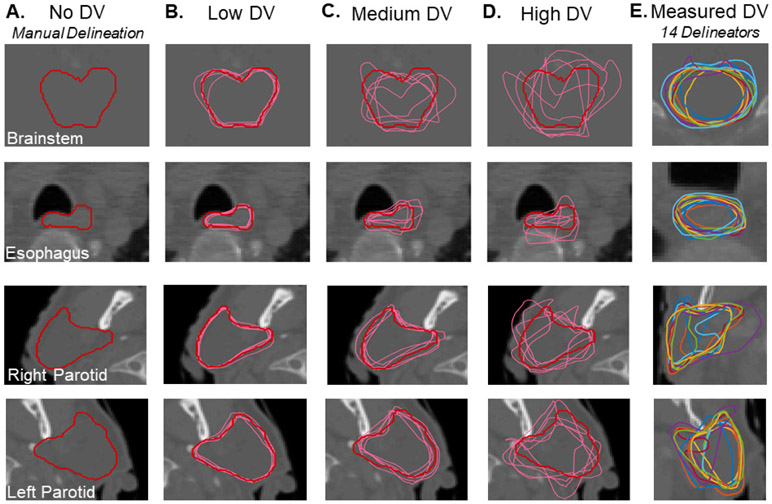
Several example contours that were used in this study are shown in figure 3 including the clinically used, manual delineations (figure 3(A)) and augmented contours generated with varying DV levels (figures 3(B)–(D)). In general, augmented structures generated with the low and medium DV settings represented realistic variations from baseline but the high DV setting tended to produce less realistic structures. Contours generated by 14 manual delineators from a different patient are shown in figure 3(E).
Figure 3.
Example contours used in this study generated via manual delineation (A) and random augmentation to simulate varying levels of DV (B)–(D). Also shown are a set of contours drawn by multiple manual delineators for one other patient (E).
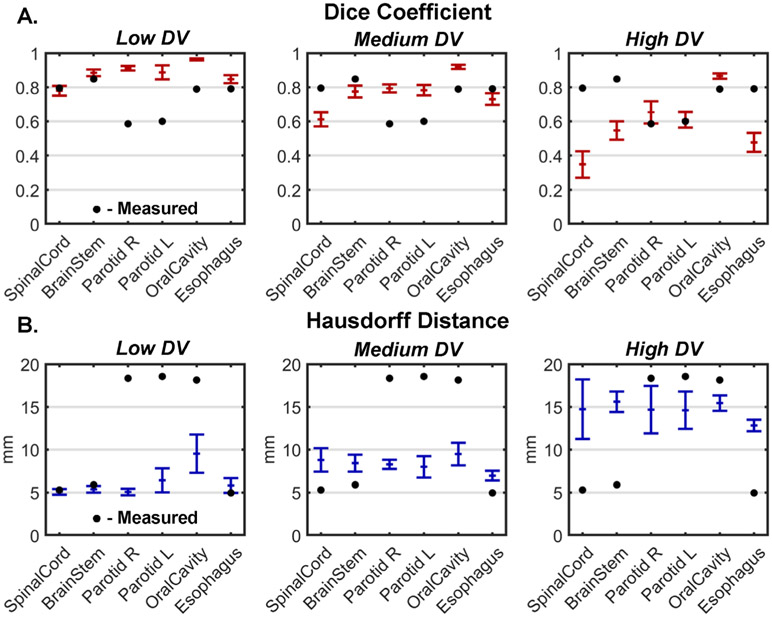
Dice coefficients and Hausdorff distances with respect to baseline are shown for multiple human delineators as well as augmented structures at each DV level in figure 4. The multiple manual delineations had a median Dice of 0.79 ± 0.11 and a median Hausdorff distance of 12.0 ± 7.1 mm. In comparison, across all structures and patients, augmented contours had median Dice coefficients of 0.86 ± 0.01 for low DV, 0.76 ± 0.03 for medium DV, and 0.57 ± 0.06 for high DV and median Hausdorff distances of 5.2 ± 0.5 mm for low DV, 7.8 ± 0.6 mm for medium DV, and 13.6 ± 1.2 mm for high DV. Therefore, DV from multiple manual delineations fell between the low and medium simulated DV levels in terms of Dice coefficient and was closest to the high simulated DV level in terms of Hausdorff distance. Note, however, that the multiple manual delineations were performed on a different image set from the simulated structures.
Figure 4.
Median dice similarity coefficients (A) and Hausdorff distances (B) between augmented contours and manually generated contours from each of five patients with low, medium, and high levels of DV applied using the ASSD method. Bars represent the median ± one standard deviation across five subjects. Black dots indicate the corresponding values measured from structures contoured by 14 independent delineators on one additional patient.
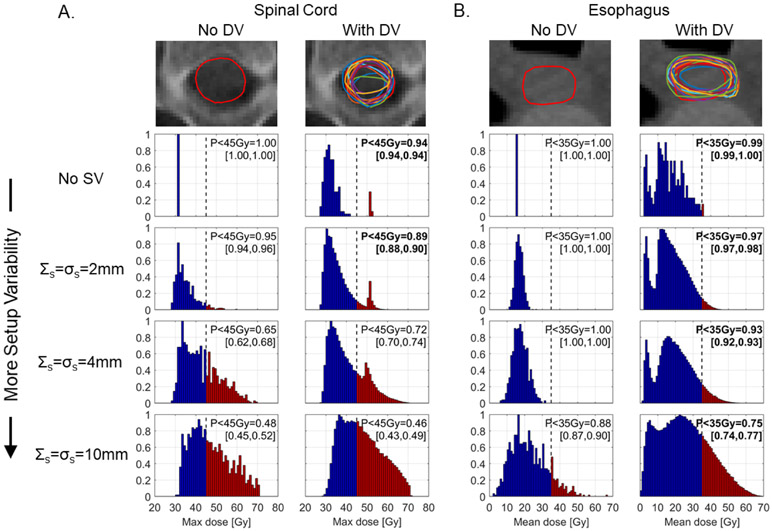
Example PQM distributions from the larynx case which had multiple structure sets with unique manually delineated OARs are shown in figure 5. For spinal cord, DV led to a clinically significant ΔPPQM with SV = 0 and 2 mm (ΔPPQM = −6% in both cases), but insignificant ΔPPQM with SV = 4 mm and 10 mm (ΔPPQM = +7% and −2%, respectively). For esophagus, however, ΔPPQM was clinically significant for all SV levels ranging −1% for SV = 0 to −13% for SV = 10 mm.
Figure 5.
Example contours and PQM distributions for spinal cord (A) and esophagus (B) from a laryngeal case which had manual contouring performed by 14 independent delineators. Histograms represent the distribution of possible Dmax or Dmean values that might be delivered when different degrees of SV (top to bottom) and DV (left to right) are considered. PPQM values in brackets indicate the values observed when a uniform ± 2% output error was applied. Bold numbers indicate the effect of DV exceeds the effect of a +2% output variation. Histogram element color indicates whether a dose level is below (blue) or above (red) the clinical PQM.
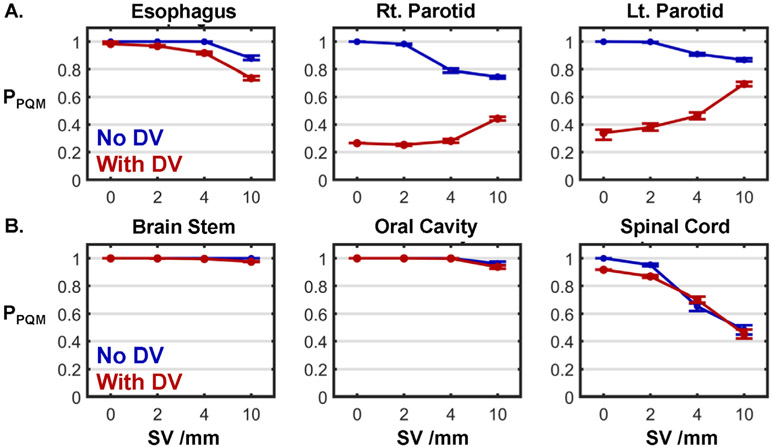
PPQM values from all six OARs in this case are plotted in figure 6. For three of the OARs (esophagus, right parotid, and left parotid), the ΔPPQM due to DV was clinically significant for all SV (figure 6(A)). Notably, all three of these structures overlapped with or abutted the target volume. For the remaining three structures which did not overlap with or abut the target volume (brainstem, oral cavity, and spinal cord), no ΔPPQM was clinically significant for SV = 4 mm or 10 mm (figure 6(B)). For oral cavity and brainstem, ΔPPQM was insignificant for all SV.
Figure 6.
PPQM as a function of SV for each OAR from the same laryngeal case shown in figure 5 when DV was (red lines) and was not (blue lines) considered. Error bars indicate the range of PPQM when ±2% output errors were applied. OARs in the top row (A) directly abutted the target volume, while those in the bottom row (B) did not.
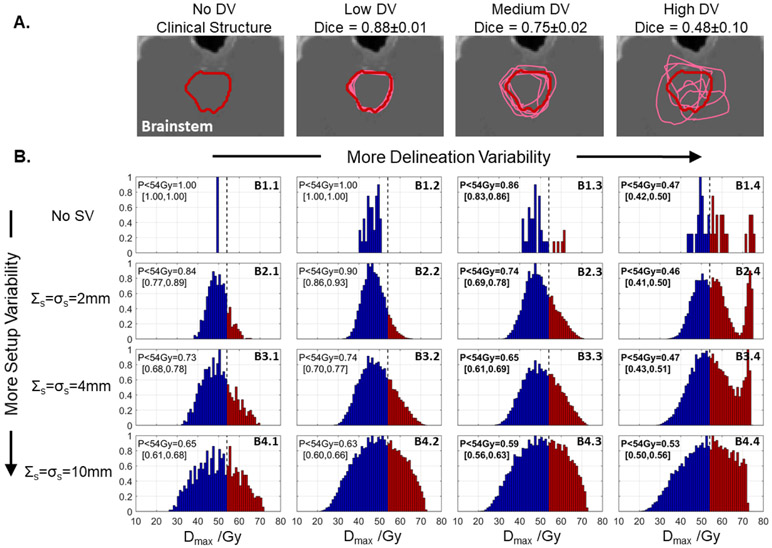
Example brainstem contours and PQM (Dmax) distributions from a nasopharyngeal case to which simulated DV was applied are shown in figure 7. In general, increasing both SV and DV spread out the distributions, thus decreasing the likelihood of achieving the clinical objective of 54 Gy (PPQM). However, as more SV was considered, the relative impact of DV decreased. For example, without considering SV, DV degraded PPQM by ΔPPQM = −53% from 100% (no DV, panel B1.1) to 47% (high DV, panel B1.4), but this change reduced to ΔPPQM = −38% when 2 mm SV was considered (B2.4 versus B2.1), ΔPPQM = −26% with 4 mm SV (B3.4 versus B3.1), and ΔPPQM = −12% with 10 mm SV (B4.4 versus B4.1).
Figure 7.
(A) One slice of a clinical brainstem contour from a patient with a nasopharyngeal cancer (red) and perturbed contours (pink) which simulate DV at ‘low’ (σc = 2 mm), ‘medium’ (σc = 5 mm), and ‘high’ (σc = 10 mm) levels. (B) Distributions of brainstem Dmax computed when considering setup variability (SV, top-to-bottom) and DV (left-to-right, cross-comparisons with different contours). The relative effect of DV decreased when more SV was considered. PPQM values in brackets indicate the values observed when a uniform positive or negative 2% output error was applied. Bold text indicates cases where PPQM due to SV and DV is lower than that caused by SV and a positive 2% output error. Histogram element color indicates whether a dose level is below (blue) or above (red) the clinical PQM.
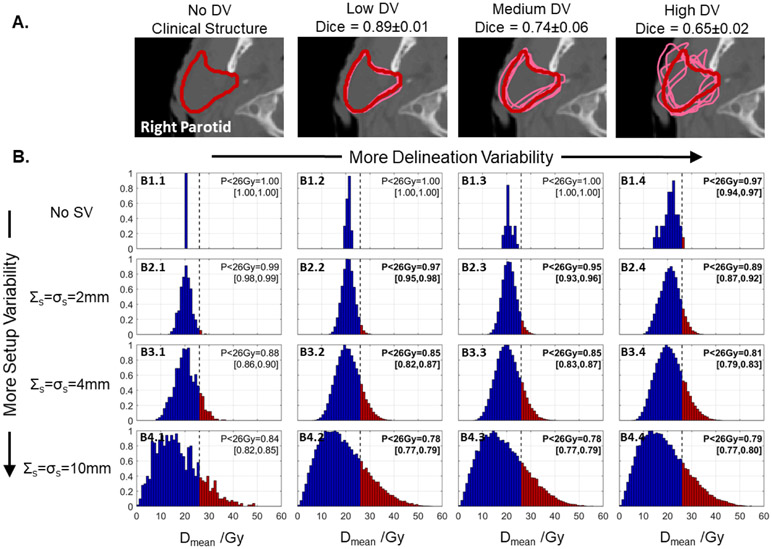
Similar effects were observed in contours with Dmean PQMs. An example showing contours and PQM (Dmean) distributions from the right parotid in a base of tongue case are shown in figure 8. As in the brainstem, both DV and SV spread out the PQM distributions, but as more SV was considered, the relative impact of DV on PPQM (probability of achieving Dmean < 26 Gy) decreased. In this case, with 2 mm SV, DV degraded PPQM by ΔPPQM = −10% from 99% (no DV, panel B2.1) to 89% (‘high’ DV, panel B2.4), but this change reduced to ΔPPQM = −7% when 4 mm SV was considered (B3.4 versus B3.1), and ΔPPQM = −5% with 10 mm SV (B4.4 versus B4.1). Interestingly, in this case, the reduction in PPQM was less when no SV was considered (ΔPPQM = −3%, B1.4 versus B1.1). This is likely due to the fact that the baseline plan (no DV or SV) was far enough from the 26 Gy DMean objective in this case that DV alone was not sufficient to reduce PPQM appreciably.
Figure 8.
(A) One slice of a clinical right parotid contour from a base of tongue case (red) and perturbed contours (pink) which simulate DV at ‘low’ (σc = 2 mm), ‘medium’ (σc = 5 mm), and ‘high’ (σc = 10 mm) levels. (B) Distributions of right parotid Dmean computed when considering setup variability (SV, top-to-bottom) and DV (left-to-right, cross-comparisons with different contours). The relative effect of DV decreased when more SV was considered. Histogram element color indicates whether a dose level is below (blue) or above (red) the clinical PQM.
ΔPPQM values averaged across OARs and patients as a function of simulated DV level are shown in figure 9. Results are averaged across OARs with Dmean PQMs (figure 9(A)) and Dmax PQMs (figure 9(B)) and including all OARs (left), only OARs that overlap with or abut the target volume (center), and only non-target-abutting OARs (right). In all cases, the reduction in ΔPPQM was largest when SV was not considered and reduced in magnitude as more SV was considered. ΔPPQM values were larger (in absolute terms) for OARs with Dmax PQMs than for OARs with Dmean PQMs and also for OARs overlapping with or abutting a target volume.
Figure 9.
The change in probability of achieving clinical PQM (ΔPPQM) as a function of DV for different SV levels across all OARs with mean dose PQMs (A) and max dose PQMs (B). Plots represent mean ΔPPQM values and error bars indicate one standard deviation. Results are shown for all OARs (left), only OARs directly abutting a target volume (center), and only OARs not abutting a target (right). Black dotted lines represent the average ΔPPQM from a 2% increase in linac output (ΔPPQM(OP + 2%) = −2.7%) which is within clinical tolerance and can thus serve as a threshold for clinical significance.
The average effect of a +2% output error, ΔPPQM(OP + 2%), across all patients and OARs was −2.7% ± 1.4%. This value is plotted as a black dashed line in all panels of figure 9. The minimum level of simulated DV whose average ΔPPQM exceeded this value for each SV level are shown in table 3. For OARs with Dmax PQMs that abutted a target volume, even low DV led to a clinically significant ΔPPQM for all SV levels. But when only non-target-abutting OARs were considered, only medium and high DV was clinically significant for SV = 0, and only high DV was significant for SV = 2 and 4 mm. With SV = 10 mm, even high DV was not clinically significant for these OARs. For OARs with Dmean PQMs that abutted a target volume, medium and high DV were clinically significant with SV = 0, but no level of DV was clinically significant (on average) for any SV level. No clinically significant average ΔPPQM values were observed for non-target-abutting OARs with Dmean PQMs.
Table 3.
The minimum DV level that had a clinically significant impact on PPQM (defined by mean ΔPPQM values lower than that caused by a 2% output error, ΔPPQM(OP + 2%) = −2.7%) at each level of SV. Values in parentheses indicate the mean ΔPPQM for the indicated SV and DV levels. N/A indicates that even High DV did not produce a significant effect. Values in parentheses for these cases indicate the maximum absolute ΔPPQM from all DV levels.
| Minimum DV with clinically relevant average ΔPPQM | |||
|---|---|---|---|
| Dmean PQMs | Any OAR | Abutting target | Not abutting target |
| SV = 0 | High (−4.1%) | High (−6.8%) | N/A (max −1.6%) |
| SV = 2 mm | N/A (max −1.8%) | N/A (max −2.5%) | N/A (max −1.8%) |
| SV = 4 mm | N/A (max −0.2%) | N/A (max −1.1%) | N/A (max −2.3%) |
| SV = 10 mm | N/A (max 0.0%) | N/A (max −0.3%) | N/A (max −0.0%) |
| Dmax PQMs | Any OAR | Abutting target | Not abutting target |
| SV = 0 | Medium (−5.5%) | Low (−10.4%) | Medium (−3.1%) |
| SV = 2 mm | Medium (−2.8%) | Low (−6.2%) | High (−8.9%) |
| SV = 4 mm | High (−6.3%) | Low (−6.5%) | High (−5.1%) |
| SV = 10 mm | N/A (max −2.3%) | Low (−5.1%) | N/A (max −0.3%) |
Discussion
Previous studies have shown that DV can lead to significant dosimetric variability when viewed in isolation. For example, Loo et al found that when comparing IMRT plans optimized using multiple independent delineations, parotid gland DV led to sufficient dosimetric differences to warrant a plan change in 46% of cases (Loo et al 2012). Similarly, Nelms et al found that DV in an oropharyngeal case resulted in significant variation in OAR Dmean and Dmax values for several head and neck structures (Nelms et al 2012). When SV was not included in analysis, our results are consistent with these findings, with DV uniformly leading to increases in OAR Dmean and Dmax values (i.e. the top rows in figures 5, 7(B) and 8(B)). However, when viewed in terms of probabilities of meeting clinical PQMs (PPQM) the significance of these differences was less pronounced in many cases (i.e. figures 5(A) and 8(B)). When a plan’s OAR dose was close to its dosimetric objective, these variations did result in substantial reductions in PPQM (e.g. the brainstem in figure 7), but, even in these cases, the inclusion of SV showed that realistic PPQM values, as well as the reductions in PPQM due to DV, were actually quite a bit lower than those indicated by static dosimetry. Our approach is similar to that of Nourzadeh et al who assessed the probabilities of exceeding OAR dose tolerance levels in prostate RT when using autodelineations versus manual contours while accounting for SV (Nourzadeh et al 2017).
This study thus indicates that the dosimetric impact of DV is overstated when considered in isolation from other sources of error. For example, while the high level of simulated DV (which exceeds the variability expected clinically) reduced PPQM for Dmax objectives by more than 12% on average when SV was not considered, this effect was reduced to 6.4% when 4 mm of SV were included (figure 9). It follows that as other sources of error are reduced in RT, the impact of DV will become more significant.
One example that appears to contradict this trend is the esophagus contour in the larynx case shown in figures 5 and 6. In this particular case, the impact of DV on PPQM (the probability of achieving Dmean < 35 Gy) appears to increase as more SV is considered (ΔPPQM = 1% with SV = 0 and ΔPPQM = 3%, 7%, and 13% with SV = 2 mm, 4 mm, and 10 mm) despite the distributions qualitatively becoming more similar to DV = 0 counterparts. This appears to be a consequence of using PPQM alone to characterize the Dmean distributions. Observing the Dmean distributions in this case shows that this plan is initially quite ‘safe’ with regards to the 35 Gy mean dose objective (with SV = DV = 0, Dmean = 15.7 Gy, PPQM = 100% with SV up to 4 mm). As a result, there is little to no change in PPQM with increasing SV despite the PQM distribution clearly widening. Because only the combination of SV and DV is enough to push the distribution past the 35 Gy limit, the relative impact of DV appears to be exaggerated by PPQM. While this phenomenon may affect other results in this study, it is more likely to affect distal (non-target-abutting) OARs and did not disrupt the trend of decreasing DV importance with increasing SV. However, this may explain the wide range of ΔPPQM values observed, as reflected in the wide error bars in figure 9.
Additional factors that affected the impact of DV were dosimetric objective type and proximity to target volumes. On average, OARs with Dmax objectives (e.g. spinal cord, brainstem) were more sensitive to DV than OARs with Dmean objectives (e.g. parotids, larynx) and OARs that abutted target volumes were more sensitive to DV than those that did not. The latter point is consistent with the observations of others that OAR contouring inaccuracies are most important near high dose and steep dose gradient regions (Nelms et al 2012, Loo et al 2012). While in this work, OAR position was stratified only into target-abutting and non-target-abutting volumes, the relevant proximity metrics are likely organ and prescription dependent. For example, given a fixed distance from a target volume receiving a 70 Gy prescription dose, OARs with a relatively low dose objective such as the parotid glands (Dmean = 26 Gy) may be more sensitive to DV than OARs with higher dose objectives like the brainstem (Dmax = 54 Gy). Proximity to steep dose gradients also likely affects the sensitivity of dosimetric indices to DV which can lead to clinically significant changes if an OAR is also at or near its objective level. Further study is needed to fully characterize the effect of target proximity on OAR delineation accuracy and precision requirements.
One limitation of this study is the simplicity of the algorithm used to augment contours and simulate DV. Random, 2D contour point offsets from a baseline contour do not necessarily produce realistic structures that would be used clinically. However, in terms of Dice overlap with reference, structures generated with simulated DV at the low and medium levels (median Dice of 0.86 and 0.76, respectively) exhibited similar variability to the structures generated by multiple manual delineators in this study (median Dice of 0.79). Furthermore, this level of agreement was in line with previous reports of DV in head and neck OARs. For example, Beadle et al found Dice coefficients between multiple parotid contours of ~0.8 that increased to ~0.9 with guidance from a contouring atlas (Beadle et al 2013). Nelms et al found Dice coefficients across several head and neck contours between 0.67 to 0.98 across 32 delineators (Nelms et al 2012) and similar results were reported by Chao et al (2007).
While Dice overlap showed good agreement between measured DV from manual delineators and simulated DV at the low and medium levels, Hausdorff distances showed closer agreement with the high simulated DV level (figure 4). This is likely caused by the fact that Hausdorff distance is more sensitive than Dice overlap to large, localized disagreements. Manual DV is caused not only by random differences in cursor placement during contouring (i.e. ‘random’ DV), but also by differences in judgement as to what image features do and do not belong in a particular structure (i.e. ‘systematic’ DV). Only random variability is generated in the ASSD model which may lead to smaller localized variabilities than manual DV (and thus lower Hausdorff distances) while maintaining similar overall overlap (i.e. Dice). To truly characterize the effects of DV, future studies will need to incorporate more realistic variability models. Future study should also examine the impact of OAR expansions into Planning Risk Volumes (PRV) (Landberg et al 1999) or the use of plan optimization schemes that specifically account for DV (Xu et al 2016, Balvert et al 2019). These methods are not widely used clinically, but likely reduce the impact of DV.
Another limitation is the possibility that our sample of manual DV is not a fair representative of true DV that occurs in the clinic. This data was produced in a non-clinical setting in a training session where attendees knew that their delineations would not be used for any treatment. However, it is unclear whether this would lead to an increase or decrease in the apparent DV. Larger and more controlled sets of multi-observer structure delineations must be collected in the future to more closely capture the DV that is clinically present. Furthermore, while no single set of OARs was treated as a reference in plan cross-comparisons, a single plan-structure set combination was used as a basis for all ΔPPQM calculations. Baseline sets consisted solely of manual, non-augmented contours but inaccuracies in these OARs could potentially confound results.
The range of SV parameters used in this study cover a clinically meaningful range of setup uncertainties in head and neck RT as well as larger uncertainties that are unlikely to occur in modern clinical practice. Many studies have examined SV in these treatments with various immobilization methods and tracking strategies and reported both random and systematic setup uncertainties between approximately 1 mm and 4 mm (Tsai et al 1999, Velec et al 2010, Tryggestad et al 2011, Ove et al 2012, Li et al 2013, Verma et al 2016, Park and Park 2016, Kaur et al 2016). We thus expect our lowest (Σs = σs = 2 mm) and medium (Σs = σs = 4 mm) SV levels to represent a reasonable range of clinical variability, while the Σs = σs = 10 mm level represents an atypical worst-case scenario. Note, the systematic errors applied in these simulations were consistent across all fractions and thus do not explicitly account for mid-course corrections that may be applied when large systematic shifts are identified during review of initial fractions. Such corrections are intended to reduce the systematic setup error averaged over all fractions; thus the ‘wash-out’ due to the overall systematic error would likely be applicable.
It is worth noting that this analysis only incorporates rigid, whole volume displacements that are either consistent throughout each fraction (i.e. random errors) or each course (i.e. systematic errors). Non-rigid anatomical deformations that may occur due to differences in neck positioning or treatment response are not included. Intrafraction motion is also not considered which may not be a significant factor in the head and neck, but will certainly need to be considered in extending this analysis to thoracic or abdominal applications where respiratory and intestinal motion are prevalent. This approach also relies on the assumption of dose shift invariance (i.e. dose map shifting can be used in place of dose recalculation) to enable efficient computation. This assumption has been shown to be only a small source of error in the prostate (Sharma et al 2012) and head and neck (Fung et al 2013). However, it has been noted that this assumption can lead to larger errors near the patient surface (Craig et al 2003) which may be significant for some head and neck plans.
This study has shown that the importance of OAR delineation accuracy and precision is directly linked with the reproducibility of patient setup. This indicates that more resources should be dedicated to reducing DV for treatments which have more stringent limits on clinically acceptable setup errors (Klein et al 2009). However, these stringent limits tend to be applied to hypofractionated treatments and the present analysis focused only on conventionally fractionated treatments delivered in 30–35 fractions. The interactions between random and systematic setup errors with DV may be different for hypofractionated treatments. This study also focused only on two-arc VMAT deliveries and thus the results may vary for different delivery techniques (i.e. 3D conformal, static beam IMRT, Tomotherapy, proton beam, etc). Furthermore, even given a fixed delivery technique, several clinically acceptable plans can be generated for a given case that may vary in terms of sensitivity to DV. Specifically, the extent to which different plans (given fixed or variable delivery technique) conformally avoid OARs may affect the sensitivity of OAR dosimetry to delineation and setup uncertainties. However, the trend of decreased sensitivity to DV with increased setup uncertainty is expected to remain. A more comprehensive analysis which includes multiple plans, delivery methods and fractionation schemes should be examined separately.
In conclusion, we have quantified the potential dosimetric impact of OAR DV in head and neck RT while also considering random and systematic SV. While DV reduced the probabilities of achieving clinical OAR objectives, the impact decreased when SV was considered. In general, DV appeared to be most significant in OARs with Dmax objectives and in OARs that abutted with target volumes than in OARs with Dmean objectives and nontarget-abutting OARs. Future studies which generalize these results, employ more instances of human DV and/or more sophisticated DV models, and characterize different treatment sites, delivery methods, and fractionation schemes are warranted.
Acknowledgments
The authors thank the ESTRO Falcon project team and Scott Kaylor of EduCase for the multi-delineator contour data presented in this work. This work was supported by NIH R01CA222216.
References
- Balvert M, den Hertog D and Hoffmann AL 2019. Robust optimization of dose-volume metrics for prostate HDR-brachytherapy incorporating target and OAR volume delineation uncertainties INFORMS J. Comput 31 100–14 [Google Scholar]
- Barghi A, Johnson C, Warner A, Bauman G, Battista J and Rodrigues G 2013. Impact of contouring variability on dose-volume metrics used in treatment plan optimization of prostate IMRT Cureus 5 e144 [Google Scholar]
- Beadle M, Garden AS, Phan J and Holliday E 2013. Quantitative assessment of conformance to expert delineation Pract. Radiat. Oncol 3 1–14 [DOI] [PMC free article] [PubMed] [Google Scholar]
- Beasley WJ, McWilliam A, Aitkenhead A, Mackay RI and Rowbottom CG 2016. The suitability of common metrics for assessing parotid and larynx autosegmentation accuracy J. Appl. Clin. Med. Phys 17 41–9 [DOI] [PMC free article] [PubMed] [Google Scholar]
- Bhardwaj AK et al. 2008. Variations in inter-observer contouring and its impact on dosimetric and radiobiological parameters for intensity-modulated radiotherapy planning in treatment of localised prostate cancer J. Radiother. Pract 7 77–88 [Google Scholar]
- Bondiau P-Y et al. 2005. Atlas-based automatic segmentation of MR images: validation study on the brainstem in radiotherapy context Int. J. Radiat. Oncol. Biol. Phys 61 289–98 [DOI] [PubMed] [Google Scholar]
- Breunig J et al. 2012. A system for continual quality improvement of normal tissue delineation for radiation therapy treatment planning Radiat. Oncol. Biol 83 e703–8 [DOI] [PubMed] [Google Scholar]
- Brouwer CL, Steenbakkers RJHM, Van Den Heuvel E, Duppen JC and Navran A 2012. 3D Variation in delineation of head and neck organs at risk Radiat. Oncol 32 1–9 [DOI] [PMC free article] [PubMed] [Google Scholar]
- Caravatta L. et al. Inter-observer variability of clinical target volume delineation in radiotherapy treatment of pancreatic cancer: a multi-institutional contouring experience. Radiat. Oncol. 2014;9:198. doi: 10.1186/1748-717X-9-198. [DOI] [PMC free article] [PubMed] [Google Scholar]
- Chao KSC et al. 2007. Reduce in variation and improve efficiency of target volume delineation by a computer-assisted system using a deformable image registration approach Int. J. Radiat. Oncol. Biol. Phys 68 1512–21 [DOI] [PubMed] [Google Scholar]
- Collier DC et al. 2003. Assessment of consistency in contouring of normal-tissue anatomic structures J. Appl. Clin. Med. Phys 4 17–24 [DOI] [PMC free article] [PubMed] [Google Scholar]
- Craig T, Battista J and Van Dyk J 2003. Limitations of a convolution method for modeling geometric uncertainties in radiation therapy. I. The effect of shift invariance Med. Phys 30 2001–11 [DOI] [PubMed] [Google Scholar]
- de Boer HC, van Sörnsen de Koste J R, Senan S, Visser AG and Heijmen BJ 2001. Analysis and reduction of 3D systematic and random setup errors during the simulation and treatment of lung cancer patients with CT-based external beam radiotherapy dose planning Int. J. Radiat. Oncol. Biol. Phys 49 857–68 [DOI] [PubMed] [Google Scholar]
- Ekberg L, Holmberg O, Wittgren L, Bjelkengren G and Landberg T 1998. What margins should be added to the clinical target volume in radiotherapy treatment planning for lung cancer? Radiother. Oncol 37 S19. [DOI] [PubMed] [Google Scholar]
- Fiorino C, Reni M, Bolognesi A, Cattaneo GM and Calandrino R 1998. Intra- and inter-observer variability in contouring prostate and seminal vesicles: implications for conformal treatment planning Radiother. Oncol 47 285–92 [DOI] [PubMed] [Google Scholar]
- Fung W, Chiu G and Lee L 2013. Can planned dose shifting method be used in place of dose recalculation method for dose evaluation in adaptive radiation therapy of head-and-neck cancer? Int. J. Radiat. Oncol. Biol. Phys 87 S703–4 [Google Scholar]
- Hurkmans CW, Remeijer P, Lebesque JV and Mijnheer BJ 2001. Set-up verification using portal imaging; review of current clinical practice Radiother. Oncol 58 105–20 [DOI] [PubMed] [Google Scholar]
- Kaur I. et al. Dosimetric impact of setup errors in head and neck cancer patients treated by image-guided radiotherapy. J. Med. Phys. 2016;41:144. doi: 10.4103/0971-6203.181640. [DOI] [PMC free article] [PubMed] [Google Scholar]
- Klein E E et al. 2009. Task group 142 report: quality assurance of medical accelerators Med. Phys 36 4197–212 [DOI] [PubMed] [Google Scholar]
- Landberg T. et al. ICRU report 62. J. Int. Comm. Radiat. Units Meas. 1999:os32. [Google Scholar]
- Li G et al. 2013. Migration from full-head mask to ‘open-face’ mask for immobilization of patients with head and neck cancer J. Appl. Clin. Med. Phys 14 243–54 [DOI] [PMC free article] [PubMed] [Google Scholar]
- Loo SW, Martin WMC, Smith P, Cherian S and Roques TW 2012. Interobserver variation in parotid gland delineation: a study of its impact on intensity-modulated radiotherapy solutions with a systematic review of the literature Br. J. Radiol 85 1070–7 [DOI] [PMC free article] [PubMed] [Google Scholar]
- Martin S et al. 2015. Impact of target volume segmentation accuracy and variability on treatment planning for 4D-CT-based non-small cell lung cancer radiotherapy Acta Oncol. 54 322–32 [DOI] [PubMed] [Google Scholar]
- McWilliam A, Beasley W and Rowbottom CG 2015. Relationship between geometric and dosimetric accuracy of auto-contouring in head and neck VMAT treatment planning Radiother. Oncol 115 S489 [Google Scholar]
- Nelms BE, Tomé WA, Robinson G and Wheeler J 2012. Variations in the contouring of organs at risk: test case from a patient with oropharyngeal cancer Int. J. Radiat. Oncol. Biol. Phys 82 368–78 [DOI] [PubMed] [Google Scholar]
- Nourzadeh H, Watkins WT, Ahmed M, Hui C, Schlesinger D and Siebers JV 2017. Clinical adequacy assessment of autocontours for prostate IMRT with meaningful endpoints Med. Phys 44 1525–37 [DOI] [PMC free article] [PubMed] [Google Scholar]
- Ove R, Cavalieri R, Noble D and Russo SM 2012. Variation of neck position with image-guided radiotherapy for head and neck cancer Am. J. Clin. Oncol 35 1–5 [DOI] [PubMed] [Google Scholar]
- Park E-T and Park SK 2016. Setup uncertainties for inter-fractional head and neck cancer in radiotherapy Oncotarget 7 46662–7 [DOI] [PMC free article] [PubMed] [Google Scholar]
- Petric P, Dimopoulos J, Kirisits C, Berger D, Hudej R and Pötter R 2008. Inter- and intraobserver variation in HR-CTV contouring: Intercomparison of transverse and paratransverse image orientation in 3D-MRI assisted cervix cancer brachytherapy Radiother. Oncol 89 164–71 [DOI] [PubMed] [Google Scholar]
- Rasch C et al. 2002. Irradiation of paranasal sinus tumors, a delineation and dose comparison study Int. J. Radiat. Oncol. Biol. Phys 52 120–7 [DOI] [PubMed] [Google Scholar]
- Sharma M, Weiss E and Siebers JV 2012. Dose deformation-invariance in adaptive prostate radiation therapy: implication for treatment simulations Radiother. Oncol 105 207–13 [DOI] [PMC free article] [PubMed] [Google Scholar]
- Tinger A et al. 1998. A critical evaluation of the planning target volume for 3D conformal radiotherapy of prostate cancer Int. J. Radiat. Oncol. Biol. Phys 42 213–21 [DOI] [PubMed] [Google Scholar]
- Tryggestad E et al. 2011. Inter- and intrafraction patient positioning uncertainties for intracranial radiotherapy: a study of four frameless, thermoplastic mask-based immobilization strategies using daily cone-beam CT Int. J. Radiat. Oncol. Biol. Phys 80 281–90 [DOI] [PubMed] [Google Scholar]
- Tsai J-S et al. 1999. A non-invasive immobilization system and related quality assurance for dynamic intensity modulated radiation therapy of intracranial and head and neck disease Int. J. Radiat. Oncol. Biol. Phys 43 455–67 [DOI] [PubMed] [Google Scholar]
- van Herk M 2004. Errors and margins in radiotherapy Semin. Radiat. Oncol 14 52–64 [DOI] [PubMed] [Google Scholar]
- Velec M et al. 2010. Cone-beam CT assessment of interfraction and intrafraction setup error of two head-and-neck cancer thermoplastic masks Int. J. Radiat. Oncol. Biol. Phys 76 949–55 [DOI] [PubMed] [Google Scholar]
- Verma M, Sait A, Senthil Kumar S, Maria Das K, Lal P and Kumar S 2016. An audit of setup reproducibility in radiotherapy of head and neck cancers J. Radiat. Cancer Res 7 85 [Google Scholar]
- Vinod SK, Jameson MG, Min M and Holloway LC 2016. Uncertainties in volume delineation in radiation oncology: a systematic review and recommendations for future studies Radiother. Oncol 121 169–79 [DOI] [PubMed] [Google Scholar]
- Weltens C, Kesteloot K, Vandevelde G and Van Den Bogaert W 1995. Comparison of plastic and orfit@ masks for patient head fixation during radiotherapy: precision and costs Int. J. Radiat. Oncol. Biol. Phys 33 499–507 [DOI] [PubMed] [Google Scholar]
- Xu H, Gordon JJ and Siebers JV 2016. Coverage-based treatment planning to accommodate delineation uncertainties in prostate cancer treatment Med. Phys 42 5435–43 [DOI] [PMC free article] [PubMed] [Google Scholar]


