

Abstract
Integrins regulate mechanotransduction between smooth muscle cells (SMCs) and the extracellular matrix (ECM). SMCs resident in the walls of airways or blood vessels are continuously exposed to dynamic mechanical forces due to breathing or pulsatile blood flow. However, the resulting effects of these forces on integrin dynamics and associated cell-matrix adhesion are not well understood. Here we present experimental results from atomic force microscopy (AFM) experiments, designed to study the integrin response to external oscillatory loading of varying amplitudes applied to live aortic SMCs, together with theoretical results from a mathematical model. In the AFM experiments, a fibronectin-coated probe was used cyclically to indent and retract from the surface of the cell. We observed a transition between states of firm adhesion and of complete detachment as the amplitude of oscillatory loading increased, revealed by qualitative changes in the force timecourses. Interestingly, for some of the SMCs in the experiments, switching behaviour between the two adhesion states is observed during single timecourses at intermediate amplitudes. We obtain two qualitatively similar adhesion states in the mathematical model, where we simulate the cell, integrins and ECM as an evolving system of springs, incorporating local integrin binding dynamics. In the mathematical model, we observe a region of bistability where both the firm adhesion and detachment states can occur depending on the initial adhesion state. The differences are seen to be a result of mechanical cooperativity of integrins and cell deformation. Switching behaviour is a phenomenon associated with bistability in a stochastic system, and bistability in our deterministic mathematical model provides a potential physical explanation for the experimental results. Physiologically, bistability provides a means for transient mechanical stimuli to induce long-term changes in adhesion dynamics—and thereby the cells’ ability to transmit force—and we propose further experiments for testing this hypothesis.
Keywords: integrins, dynamic loading, mechanotransduction, bistability
Introduction
Integrins are transmembrane proteins that regulate mechanotransduction between smooth muscle cells (SMCs) and the surrounding extracellular matrix (ECM). It is well-known that integrins are highly mechanosensitive; they adapt their conformation and binding affinities in response to mechanical cues from their local environment (Katsumi et al., 2004; Hoffman et al., 2011) and they can both strengthen and unbind under mechanical strain (Kong et al., 2009). There are numerous in vivo scenarios where SMCs are subject to fluctuating mechanical environments, for example in the airways during breathing or in blood vessels undergoing pulsatile flow (Suki et al., 2020). An important area of study is therefore how integrin dynamics are affected by fluctuating mechanical forces. A number of experimental studies have considered whole-cell responses to dynamic forces. For example, cultured cells are observed to reorientate under cyclic stretch (Livne et al., 2014), aided by the disassembly and reassembly of integrin-mediated adhesions. However, there are still relatively few experimental studies where dynamic forces are applied directly to the integrins or focal adhesions. Atomic force microscopy (AFM) is an experimental technique where forces can be applied with high precision, and it can be used to either study the rupture of single integrins or to measure their collective behaviour in larger focal adhesions. AFM provides extremely high resolution measurements, and is able to detect forces as small as 10−15N at room temperature (Binnig et al., 1986) by using photodiode detectors and a laser to track the deflection of a metal cantilever as it interacts with the surface of a cell. The position of the cantilever relative to the cell is controlled by a piezoelectric scanner, and the cantilever could either have a small tip functionalised with ligands for integrin binding, be attached to a larger substrate-coated microbead, or be attached to another cell. To measure adhesion dynamics, the cantilever is lowered vertically to the cell surface where adhesion occurs. It is later retracted, and the upward motion of the cantilever is resisted by the adhesions that have formed, causing the cantilever to bend. The cantilever is of known mechanical properties and its deflection can therefore be used to calculate adhesion forces throughout the retraction; individual bond rupture events can be detected since there are abrupt changes in force when bonds break, reflected in jumps in the force timecourse. However, the analysis can be complicated due to difficulty in determining whether these jumps correspond to a single bond rupturing or simultaneous rupture of multiple bonds; models for this have been proposed (Karácsony and Akhremitchev, 2011), accounting for probabilities of coinciding events. At a finer level of detail, single-molecule force spectroscopy methods, reviewed in Puchner and Gaub (2009), have been developed to measure rupture characteristics by applying loads (‘pulling experiments’) directly to individual bonds (Weisel et al., 2003). Although a more challenging task, single-molecule force spectroscopy methods can also be used to determine binding rates (Baumgartner et al., 2000; Van Es et al., 2014). In addition to adhesion forces and the kinetics of bonds, conformal changes of proteins at the nanometre scale (including potassium channels, in Mari et al. (2011)) have been measured. The scanners are also able to move laterally and this method is often used to produce images and high resolution information about cell surface topography (Le Grimellec et al., 1998; Whited and Park, 2014) and to determine local mechanical properties such as variations in cell elasticity (Touhami et al., 2003; Kuznetsova et al., 2007).
Complementary to experimental studies, mathematical models can provide additional insight into integrin binding dynamics, for example by simultaneously tracking multiple variables that may not be measurable through a single experimental technique. Theoretical models can also be used to inform the design of novel (and optimal) experiments or generate new hypotheses. For example, the size and lifetime of integrin clusters have previously been simulated under static loads (Erdmann and Schwarz, 2004; Qian et al., 2009). Erdmann and Schwarz (2004) show that the rebinding of ruptured bonds is necessary in order to obtain physiological cluster lifetimes, whilst Qian et al. (2009) are able to relate cluster lifetimes to non-uniform stresses, calculated from their model, that occur due to an inclined loading angle. Mechanosensitive integrin behaviours have been captured by Chan and Odde (2008) and Walcott et al. (2011), where adhesion size and dynamics simulated on stiff and compliant substrates agree with experimentally observed trends. In particular, Walcott et al. (2011) show that the different stiffness-dependent behaviours emerge naturally when load-dependent reaction rates are considered. In addition to the effect of static loads, previous studies incorporating oscillatory loading (Kong et al., 2008; Irons et al., 2018) predict that oscillation amplitude, frequency and material stiffnesses all affect cluster stability. In our previous modelling study (Irons et al., 2018), we further predicted the existence of a bistable adhesion regime, where mechanical cooperativity and cell deformation could promote increased integrin adhesion instead of a lower adhesion state. A consequence of this bistability is that loading history affects future adhesion dynamics. Interpreted physiologically, it is possible that transient mechanical stimuli could result in long-term changes in adhesion dynamics. In both of these cases the model predictions are yet to be verified experimentally.
In the present study, we use both in vitro AFM experiments and a deterministic mathematical model related to our previous work (Irons et al., 2018), to measure and predict the integrin response to fixed amplitude vertical oscillations of the AFM probe. In both the experimental and theoretical results, as the amplitude of oscillatory loading increases we observe a transition between states of firm adhesion and of complete integrin detachment from the ECM. In the experimental data, some cells exhibited switching behaviour between the two adhesion states during a single experiment. In the model, and analogous to our previous study (where lateral oscillations were simulated (Irons et al., 2018)), for intermediate amplitudes of oscillation we observe a region of bistability where both the firm adhesion and detachment states can occur depending on the initial adhesion strength. This difference in outcomes is due to a mechanical cooperativity of bound integrins and a resulting change in the level of cell deformation. Stochastic switching is a phenomenon known to be associated with underlying multistability in systems with noise (see Kochańczyk et al. (2013); Stamatakis and Mantzaris (2009); Frigola et al. (2012); Norman et al. (2015); Tian and Burrage (2006); McAdams and Arkin (1999) and Discussion), as would be the case in single-cell experiments. Further experimental validation is needed, but cooperativity-induced bistability could therefore be a potential physical mechanism behind this behaviour; in the Discussion we suggest future experiments that could test our hypothesis.
Methods
Experimental methods
The experimental results were obtained using atomic force microscopy (AFM). Vertical oscillatory displacements of various amplitudes were applied to a fibronectin-coated probe (to which integrins bind), which was used cyclically to indent and retract from the surface of live aortic SMCs. For each experiment, cells were randomly selected and indented above the cell nucleus, and force curves for 60 approach-retract cycles were recorded over 10 minutes as an indication of the time-dependent adhesion strength and dynamics. Here we briefly describe the procedures directly relevant to the AFM measurements analysed; further details of the materials and reagents used, cell preparation and probe functionalisation are provided in S.1 in the Supplementary Material.
In order to determine the effect of different oscillation amplitudes on the adhesion characteristics between fibronectin and the SMCs, measurements were made with oscillation amplitudes varying between 400nm and 2000nm. Two protocols were followed for each amplitude: ‘prebind’ and ‘non-prebind’. In the ‘prebind’ protocol, an AFM probe with a fibronectin-coated bead attached was brought into contact with the SMC surface. The probe with bead was maintained in contact with the cell membrane for 20 minutes to allow formation of stable focal adhesions (Sun et al., 2005, 2008). After 20 minutes, the probe was retracted and the oscillation experiments were performed. In the ‘non-prebind’ protocol, an AFM probe with a fibronectin-coated bead attached was brought into contact with the SMC surface, immediately after which the approach-retract cycles were commenced. In this protocol, there was no delay period of contact with the cell to allow formation of a focal adhesion. For each oscillation amplitude, the same number of cells were used in each protocol (5 ≤ n ≤ 8). In total we analysed 152 force timecourses (76 prebind, 76 non-prebind), with the breakdown of amplitudes and sample sizes, n, given in Table 1. All AFM measurements were conducted at room temperature in serum-free medium.
Table 1:
Sample sizes, n, used for both prebind and non-prebind cells in each amplitude category (A).
| A (nm) | 400 | 800 | 1000 | 1100 | 1150 | 1200 | 1250 | 1300 | 1400 | 1600 | 1800 | 2000 |
|---|---|---|---|---|---|---|---|---|---|---|---|---|
| n | 5 | 5 | 8 | 6 | 6 | 6 | 7 | 7 | 6 | 6 | 6 | 8 |
During the approach-retract cycles, which are applied as triangle-wave oscillations (Eq. (10)), measurements of cantilever displacement, bead displacement, and cantilever deflection were collected over time. As the bead makes contact with the cell surface, subsequent cell indentation generates a bending of the AFM cantilever. On retraction, bending in the opposite direction occurs as a result of integrin adhesion. The force is calculated according to Hooke’s law as F = dk where F is force (in pN), d is cantilever deflection (in nm), and k is the cantilever spring constant (k = 18.1pN/nm, here); positive force reflects indentation, and negative force shows adhesion.
Mathematical model
In our mathematical model, the cell, integrins and ECM are represented by a system of springs (Fig. 1), incorporating a partial differential equation (PDE) description for the integrin binding dynamics, in which the model of Lacker and Peskin (1986) is adapted to allow for vertical motion. Individual integrins are considered as linear springs that bind and unbind from the ECM, but in parallel they act as a nonlinear ‘effective spring’ whose stiffness depends on deformation and loading history via the governing PDEs. Our model has two parts, each described below: a force-balance for cell, integrin and ECM deformations, coupled to a partial differential equation model for the integrin binding dynamics. Note that we restrict our attention to the direct mechanical role of integrins, which is to transmit forces between SMCs and the ECM. Alongside this, but not considered in the model, there are strain-dependent conformal changes within the adhesion complex that modulate adhesion strength (Humphries et al., 2007) and intracellular signalling pathways triggered or altered by integrin activity, including the focal adhesion kinase (FAK) pathway and downstream targets such as Rho GTPase and ROCK signalling, which mediate cytoskeletal organisation and contractility (Huveneers and Danen, 2009). These pathways are important in mechanosensing and adhesion maturation via further protein recruitment (Dumbauld et al., 2010); the additional role of signalling will be of interest in future work.
Figure 1:
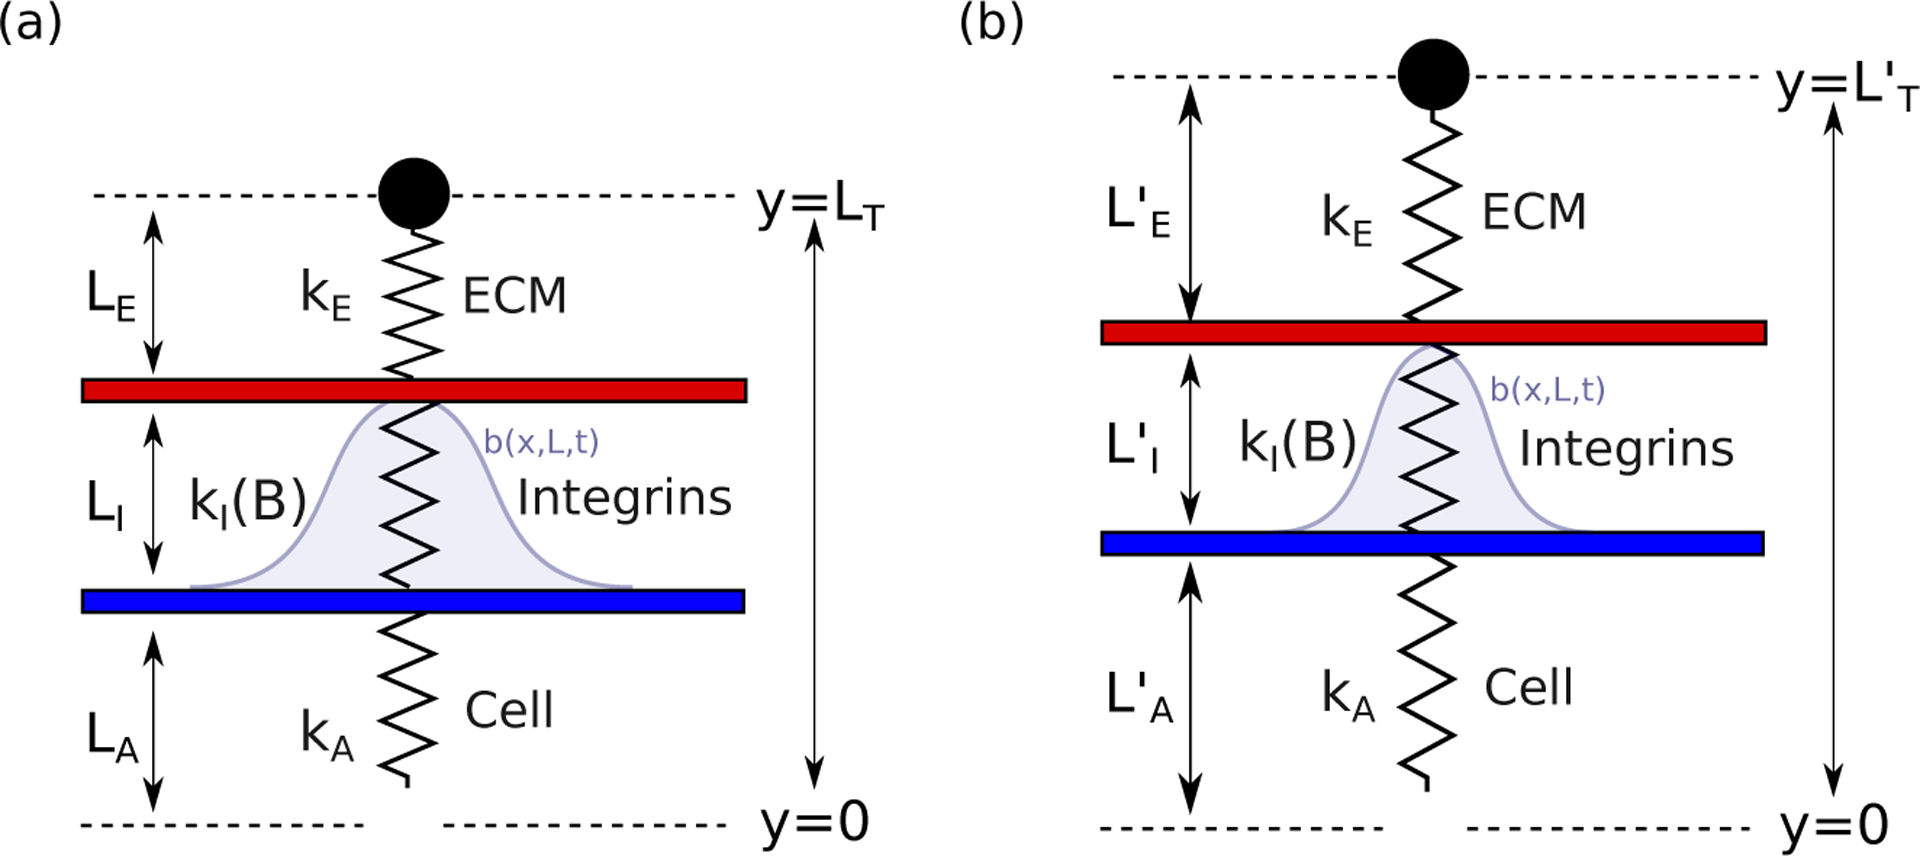
The cell, bound integrins (collectively) and ECM are represented by a set of springs with spring constants kA, kI(B) and kE, where 0 ≤ B ≤ 1 is an evolving fraction of integrins bound to the cell and the ECM at any time. The springs have deformed lengths , and , respectively, and the vertical integrin extension is , where LI is the integrin rest length. Note that the ‘effective spring’ that represents the bound integrin population is nonlinear and has a deformation-dependent stiffness, with its spring constant, kI(B), evolving according to a separate PDE model for the integrin binding dynamics (described below).
As depicted in Fig. 1, the cell and ECM are assumed (for simplicity) to be linear elastic springs with spring constants kA and kE respectively. A PDE model, described in detail below, is used to determine the fraction of available integrins, 0 ≤ B ≤ 1, that are bound to both the cell and the ECM at any time. The effective integrin spring constant, kI, is then calculated as
| (1) |
where ρ is the total number of integrins expressed on the cell surface and λb is the individual integrin spring constant.
To model the AFM experiments described above, we impose an oscillatory displacement to the ECM (, Fig. 1) and solve force balance equations to calculate the resulting deformations of each component. In addition to force, we will also directly track the bound integrin fractions and the corresponding cell deformations—measurements that are not available from the AFM experiments.
Force-balance equations
We consider separate cases depending on whether the fraction of bound integrins, B, is zero or non-zero, and whether the cell is under compression or tension. We assume that when the integrins behave as rigid beams.
Case 1. B ≠ 0
In the case where some integrins are bound to the cell and the ECM (B ≠ 0) and , the force balance equations are
| (2) |
where the deformed lengths , , and (Fig. 1) are unknown but the rest lengths LA, LI, and LI are known parameters. Since is known, we use the relation to eliminate , leaving two equations with two unknowns ( and ). These give
| (3) |
and
| (4) |
where
| (5) |
In the case where (compression) we assume rigidity of the integrins and instead obtain
| (6) |
We now have and
| (7) |
Case 2. B = 0
When B = 0 there are no integrins bound to the cell and the ECM; therefore the middle spring is no longer present (i.e. kI = 0 using Eq. (1)). There are two subcases to consider depending on whether or not the cell and ECM are in contact. When there is no contact between the cell and ECM; in this case we simply have and . When there is compression of the cell and we consider force balance to obtain
| (8) |
This time we have , giving
| (9) |
and . In all of the above cases we can directly calculate the resulting three spring deformations for any applied deformation, .
Triangle wave oscillatory displacement
To match the experimental protocol, we apply a vertical triangle-wave oscillatory displacement. This is applied via the y-coordinate of the top of the ECM (see Figure 1) as
| (10) |
where LA + D is the minimum height imposed on the ECM (i.e. when the approach is complete), A is the magnitude of the oscillation, ⌊·⌋ denotes the floor function, and ω is the frequency of oscillation.
Model of integrins binding to ECM
To determine the bound integrin fraction, 0 ≤ B ≤ 1, featuring in Eq. (1), we adapt the model of Lacker and Peskin (1986). Integrin binding and rupture events are considered as state transitions of the integrins between bound (to the ECM) and unbound states, with each integrin undergoing the reactions
| (11) |
where kb(d) and ku(d) are local spatial binding and unbinding rate functions respectively (Fig. 2). These rates depend on a distance, d > 0, which is given by for horizontal and vertical extensions of the integrin, x and L, respectively. Importantly, the vertical extension of the integrins is calculated from the cell-scale deformations, allowing the model to capture the two-way coupling between cell-scale deformations and integrin dynamics. By this definition, x = L = 0 denotes an integrin in its rest position. These rates are chosen so that the binding rate, kb(d), is highest when the distance from rest, d, is zero, and rupture rate, ku(d), increases as d increases. The specific form is
| (12) |
and
| (13) |
where h is the integrin binding range, f1 is the maximum binding rate and g1 is the unbinding rate when the integrin is in its rest position. Following Huxley (1957), we have made a simplification by using piecewise linear rates, and the rupture rate (ku) increases with linear gradient g2/h as the integrin extension (d) increases. Furthermore, after a maximum extension d = s, any remaining bound integrins are forced to unbind with a high rate g3 (see Fig. 2).
Figure 2:
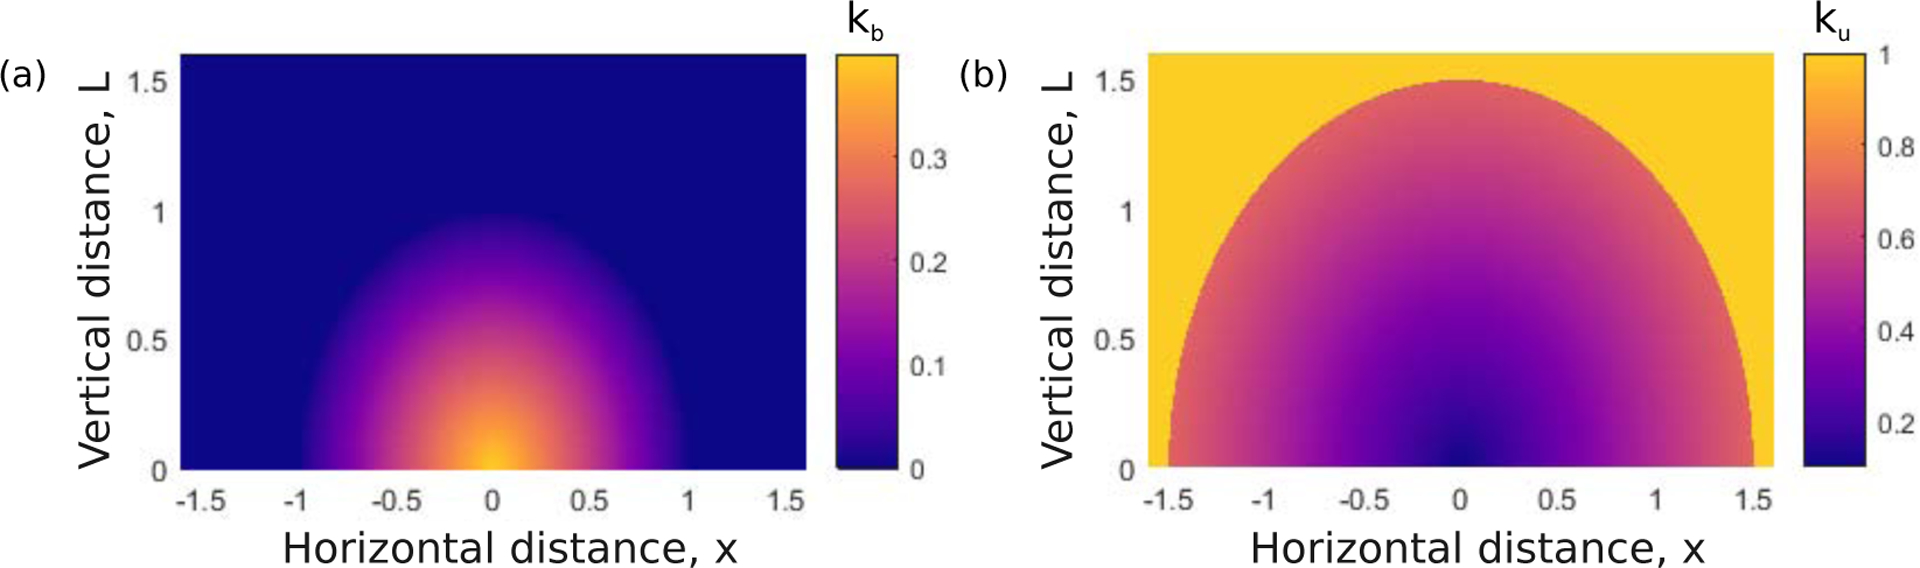
(a) Illustrative integrin binding (kb(x, L)) and (b) unbinding (ku(x, L)) reaction rates, indicated by colour, as a function of distance. The binding rate (in (a)) is highest when the integrin is at a zero distance from its rest position. The rate of unbinding (in (b)) increases as the distance from rest increases.
Following Lacker and Peskin (1986), we denote the fraction of bound integrins with horizontal extension x by a distribution b(x, t). Since we do not apply a horizontal displacement to either surface in this case (only vertical oscillations are applied), and since both rates are symmetric in x, there is no horizontal relative motion of the cell and the ECM. The equation for the distribution of integrins does not require an advection term, and is simply
| (14) |
where reactions account for binding of unbound integrins and unbinding of bound integrins. The original Lacker-Peskin model only accounts for binding rates that are functions of the horizontal extensions, x, but here we consider the rates to be a function of the total extension . However, since the distance L is known, a substitution can be used so that the binding rates are written as time-dependent functions of x only. In Eq. (14), the parameter l is a scale factor which arises in the derivation of the model to allow for multiple binding sites, and B measures the total bound fraction of integrins. This is calculated as
| (15) |
and takes a value between 0 and 1. Note that integrins have a finite binding range, after which kb(d) = 0 (Eq. (12)). A zero bound fraction of integrins, B = 0, can therefore be obtained due to a lack of binding (Eq. (14)). The derivation of the original Lacker-Peskin model is discussed in detail by Srinivasan and Walcott (2009), where it is used as a microscopic model of frictional bonds, and we have previously used it to examine integrin dynamics under lateral oscillations (Irons et al., 2018).
Initial conditions
In order to mimic the experimental ‘prebind’ and ‘non-prebind’ protocols, we begin simulations with either a saturated initial condition (the steady state solution with the cell and ECM layers in contact) or a zero initial condition (B = 0, and the cell separated from the ECM) for the integrin distribution. In the prebind experiments, an initial retraction is performed before t = 0 so that oscillations begin from their peak height (consistent with the non-prebind protocol), and we replicate this in the simulations too.
Results
Force timecourses with rupture and adhesion
We first compare experimental and model timecourses in cases where the applied oscillations lead to either periodic rupture of integrin adhesions, or sustained adhesion (Fig. 3). First, consider AFM force data for a cell with no prebinding where the AFM cantilever was subject to approach-retract cycles, each with amplitude 1400nm (Fig. 3a–c). Under these high amplitude vertical oscillations, we see periodic binding and then rupture of bound integrins at the same frequency as the applied oscillatory displacement. In each 10 second cycle, the first half consisted of an approach and indentation of the cell, during which adhesion occurs, followed by probe retraction. By focussing on the lowest part of the curves (Fig. 3c) individual rupture events can be seen within each cycle, with subsequent flat sections indicating full rupture. Note that these are raw data; however, to obtain accurate values for the magnitude of force this measurement needs to be corrected to account for the initial deflection of the cantilever, which is not perfectly horizontal at t = 0. The correction is simple in this case since we know that at t = 0 the force should be identically zero because there is no adhesion and no contact with the cell; the force should therefore be shifted by its initial value. However, in the corresponding data with prebinding, correcting the force data is problematic since we do not always have a point of reference where the force is known to be zero. Since we cannot account for this shift consistently when there is prebinding, we classify adhesion behaviour by considering qualitative characteristics of the curves. In the following, we will therefore analyse shape and asymmetry (which is characteristic of rupture events) rather than magnitude of the forces.
Figure 3:
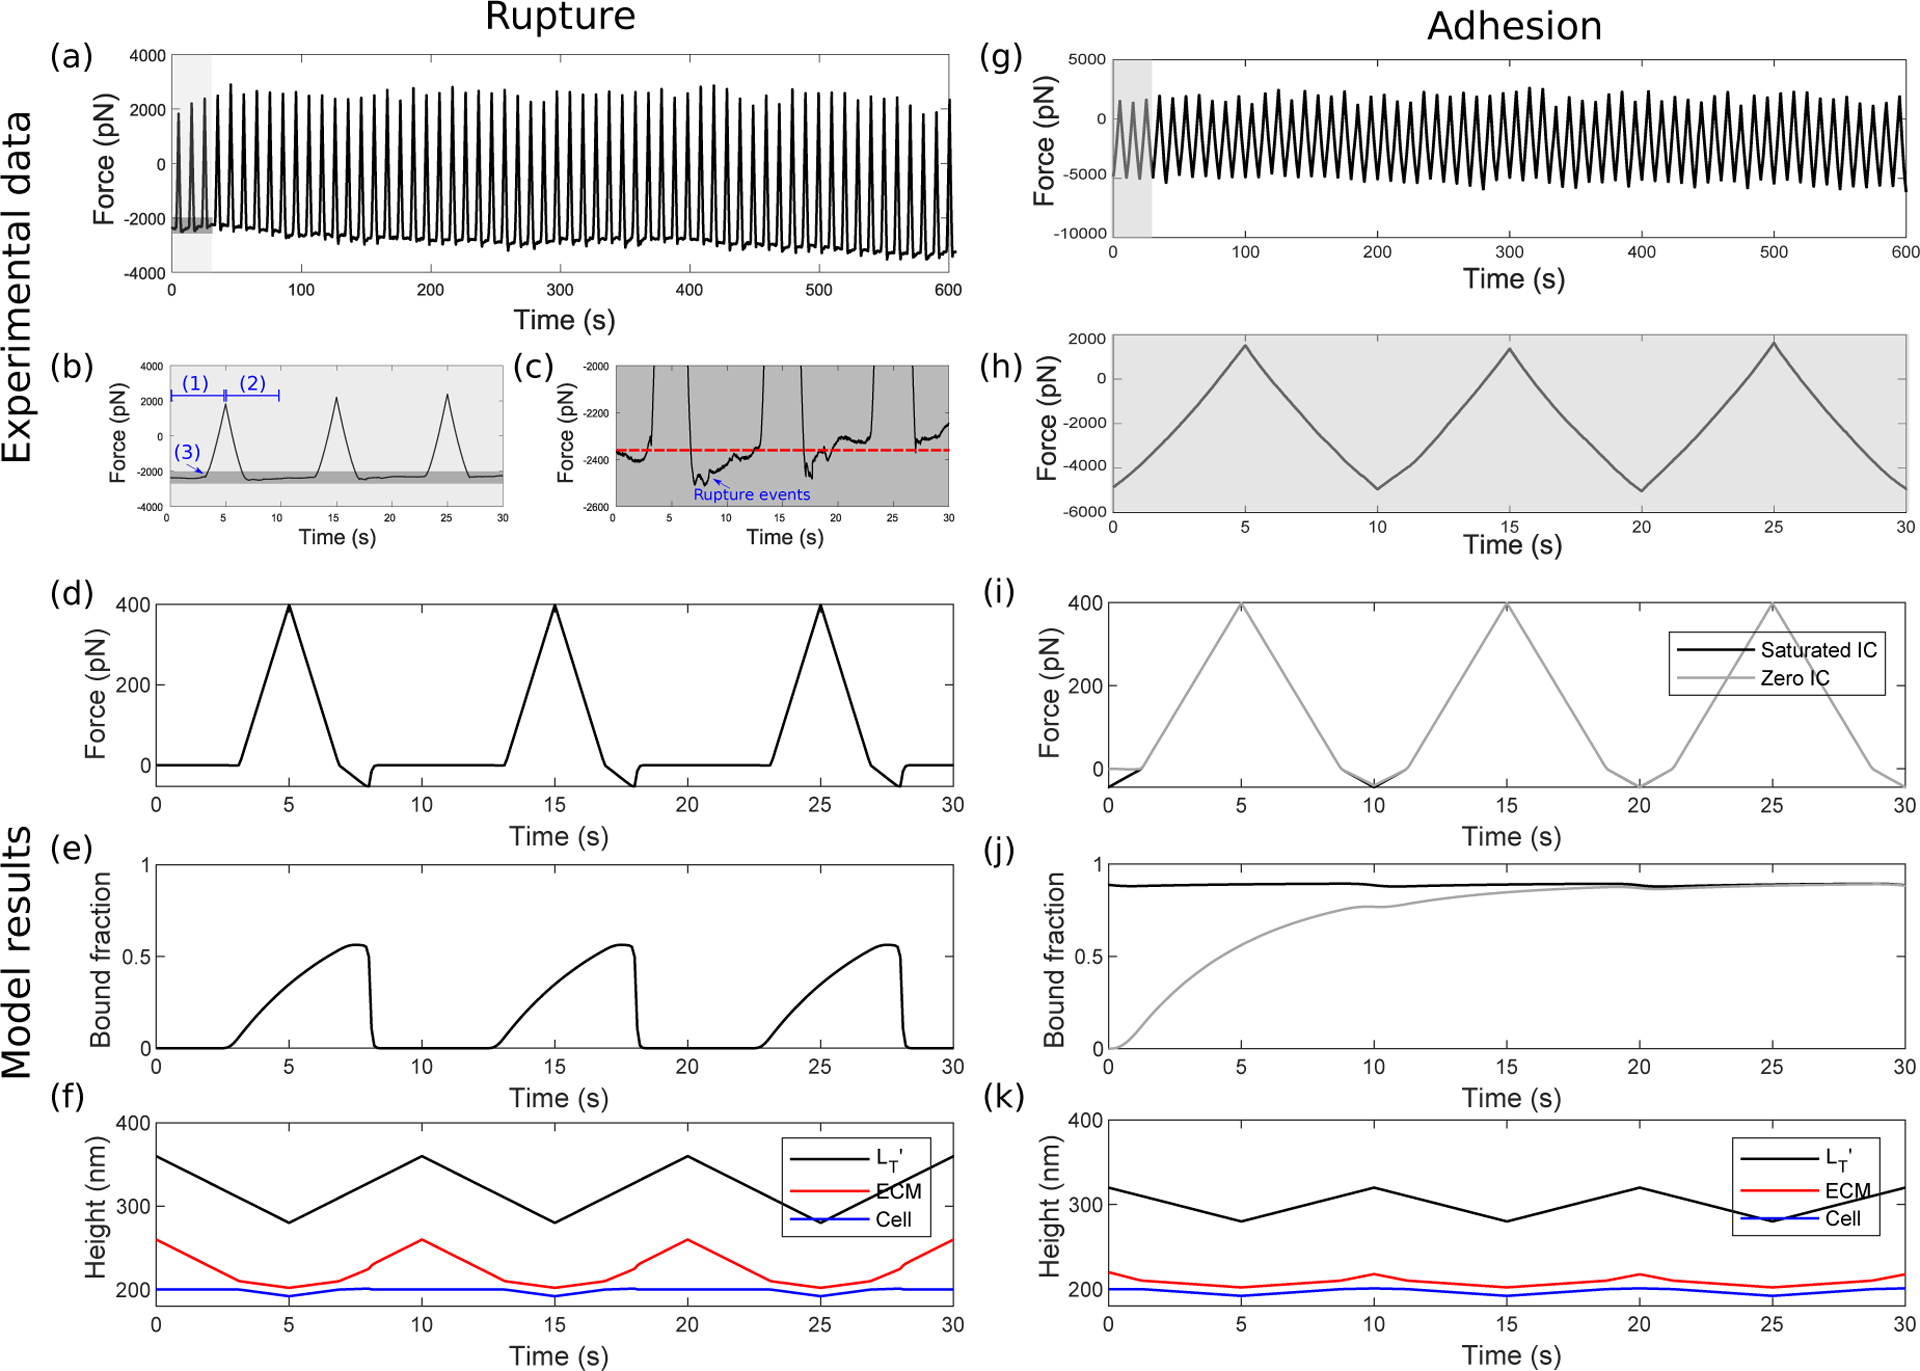
Experimental data and model results for either rupture or adhesion. (a–c) Experimental rupture. Raw AFM data for a cell with no prebinding, measured whilst the AFM probe was subject to vertical oscillations (with a triangular waveform) of amplitude 1400nm. The force is shown over (a) 10 minutes, (b) the first 3 approach-retract cycles, corresponding to the shaded region in (a), and (c) a limited range of force corresponding to the darker shaded region in (b), allowing us to see the rupture behaviour more clearly. The blue labels (1) and (2) denote approach and retraction, respectively, and (3) shows a contact point. (d–f) Model rupture. Timecourses for (d) the adhesion force (e) the corresponding bound integrin fraction and (f) heights of each of the three layers (Cell, ECM and ) in the presence of high amplitude (A = 80) approach-retract cycles. In this case a zero initial condition of bound integrins was used, but both saturated and zero initial conditions produce similar results as any preexisting bound integrins rupture during the first retraction. (g, h) Experimental adhesion. Raw AFM data for a cell with no prebinding, with vertical oscillations of amplitude 400nm showing force over (g) 10 minutes and (h) the first 3 approach-retract cycles. (i, j) Model adhesion. Timecourses for (i) adhesion force (j) bound integrin fraction and (k) heights of each of the three layers (Cell, ECM and ) in the presence of low amplitude (A = 40) approach-retract cycles. The black and grey lines show timecourses for saturated and zero initial conditions respectively, mimicking prebind and non-prebind experimental conditions. All parameter values are in S.4 in the Supplementary Material, where we also discuss differences in model and experimental oscillation amplitudes.
Qualitatively, the force timecourse from the model (Fig. 3d) is in agreement with the AFM approach-retract curves (Fig. 3a–c), showing compressive forces (maxima at t = 5s, 15s, …) followed by increasing adhesive forces before a return to the initial force via rupture events. There are slight differences in the rupture characteristics, since rupture events occur stochastically in reality, whereas in the deterministic model they are synchronous (and appear more abrupt) due to all integrins acting identically. From the bound fractions in Fig. 3e, the model supports the notion that there is full rupture of integrins. Timecourses for the heights of each of the three layers (probe, ECM, cell) illustrate the corresponding cell deformations (Fig. 3f). During the first approach (0 ≤ t < 5), we observe a reduction in cell height (blue line in Fig. 3f) due to indentation. As retraction (5 ≤ t < 10) begins, the cell height increases due to adhesions that have formed. Once the bound fraction reaches zero the cell returns to its rest height. Temporal measurements of cell deformation cannot yet be obtained directly with AFM, and bound integrin timecourses during loading also cannot yet be quantified, although optical techniques such as fluorescence resonance energy transfer (FRET) (Kemp-O’Brien and Parsons, 2013) may make this possible in future. Note that there are quantitative differences between the experimental and model results, most notably in the oscillation amplitudes applied. This is discussed further in S.4 in the Supplementary Material but, briefly, is due to two factors. Firstly, our model uses parameter estimates from the literature, some of which vary through wide ranges. Secondly, on later analysis of the experimental data, we found that significantly larger cell indentations (up to several hundred nanometers, see Section S.2 in the Supplementary Material) were applied, resulting in higher oscillation amplitudes as well as higher compressive forces. In the model, we find that the qualitative behaviours—which is our focus here—remain similar for a range of parameter values, as we also found, and demonstrated, in our previous work (Irons et al., 2018).
For lower amplitude oscillations (400nm, Fig. 3g, h), the AFM force curves are wider and have a triangular shape (Fig. 3h) that closely follows the form of the applied displacement, and the lack of rupture events indicates that adhesion is maintained throughout the cycle. In the mathematical model (Fig. 3i) we see a similar result, and the fraction of bound integrins (Fig. 3j) confirms an increase in the bound fraction from the zero initial condition (grey line) to a high steady state, i.e. a state of firm adhesion. The same steady state is reached with a saturated initial condition (black line), which mimics the prebind protocol. Corresponding heights of each of the three layers (Fig. 3k) show cell indentation during the first approach (0 ≤ t ≤ 5), and as retraction (5 ≤ t < 10) begins, the cell height increases. Due to stronger adhesions, the cell is stretched upwards and more closely follows the applied triangular waveform (black line). Later in the retraction (t ≈ 8), a small number of bonds rupture and there is a slight rounding of the cell height. We note a more apparent change in gradient of the model force curves upon reaching zero force (cf. Fig. 3h,i), where there is a transition between compression (where integrins do not rupture) and tension (where they can). Under tension, there is a breaking of bonds (as seen by the decreasing bound fraction in Fig. 3j) and this results in a reduced gradient since the effective stiffness of the integrins (at the population level) decreases. Additionally, because we are using a deterministic model, our binding and rupture events begin simultaneously for all integrins rather than stochastically (as in the experiments).
Normalised force timecourses: shape analysis
Following our observations of strong qualitative agreement between the model and experimental force curves in both rupture and adhesion cases, we are interested in analysing features related to their shape. We therefore normalise the model and experimental force data to [0, 1] over each cycle for ease of comparison. We first consider normalised force curves for the experimental data where, for each amplitude, curves are averaged over 60 cycles and over each cell (Fig. 4a, solid lines; shaded regions depict one standard deviation from the mean). We observe a narrowing of force curves as the amplitude increases, and flattening at the ends of each cycle as the behaviour transitions from adhesion to rupture. There is very little difference in the non-prebind (blue) and prebind (red) data in extreme low and high amplitude cases; however, we observe a considerable difference between the two protocols for A = 1200nm, and slight differences for A = 1400nm and A = 1800nm. In each of these cases, prebinding appears to promote increased adhesion, shown by an increased width of the prebind (red) curves, which indicates sustained contact between the bead and cell. However, the overall shape of the curves (in particular, flatness at the ends) indicates that rupture still eventually occurs for A = 1400nm and A = 1800nm. For A = 1200nm, it is not clear if this is the case.
Figure 4:
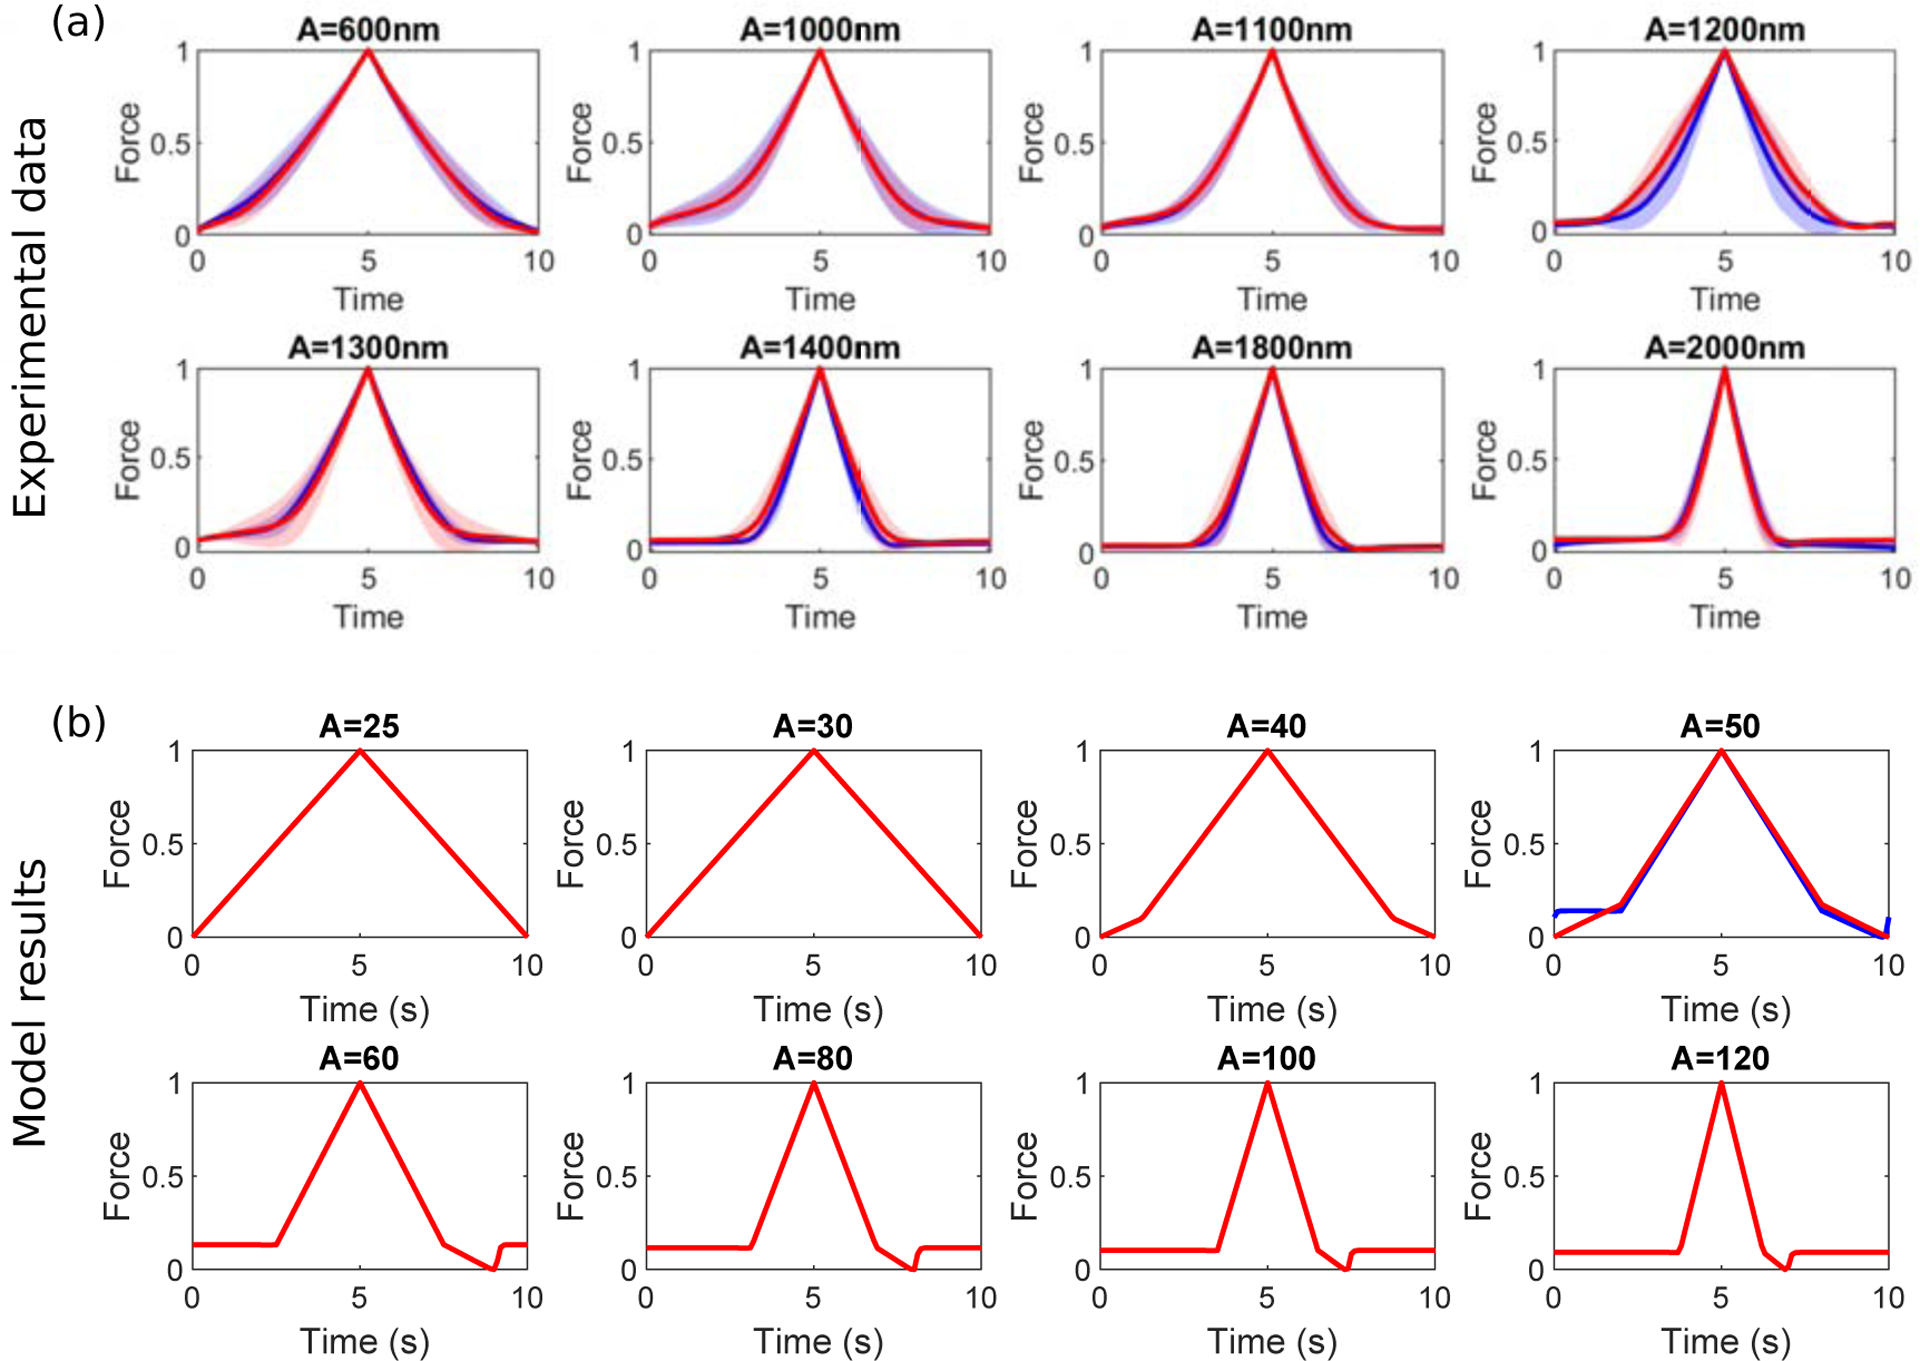
(a) Experimental force curves, normalised to take values between 0 and 1, and averaged over all approach-retract cycles and cells. These show the typical behaviours of the adhesion force during approach (0 ≤ t < 5s) and retraction (5 ≤ t < 10s) for amplitudes, A, with the prebind (red) and non-prebind (blue) protocols. Solid lines denote mean values, whereas the shaded regions are within one standard deviation of the mean. Sample sizes, n, for each amplitude are in Table 1. (b) Model force curves, normalised to take values between 0 and 1, once an oscillatory steady state had been reached. These show the periodic behaviours of the adhesion force during approach (0 ≤ t < 5s) and retraction (5 ≤ t < 10s) for amplitudes, A, with the prebind (red) and nonprebind (blue) protocols. All parameter values are in S.4 in the Supplementary Material, where we also discuss differences in model and experimental oscillation amplitudes.
The corresponding results for the mathematical model exhibit a similar narrowing and transitions between adhesion and rupture regimes (Fig. 4b), although the rupture portion of the curve is much more noticeable in the model. This is due to the fact that the relative magnitude of compressive to adhesive forces is much larger in the experimental data, making the rupture events less dominant when the full curve is normalised to [0, 1]. For an intermediate amplitude (A = 50) the model curves exhibit a difference between saturated and zero initial conditions. Inspection of model timecourses (Fig. 5) reveals that this is due to a cooperativity-induced bistability. The bound integrin fractions for A = 50 (Fig. 5a) show either a low or high adhesion state for a zero (non-prebind) or saturated (prebind) initial condition. In our previous theoretical study in which we applied lateral oscillations (Irons et al., 2018) to integrin-ECM bonds, we also observed bistable behaviour and proposed that it was due to mechanical cooperativity (i.e. shared loading and increased strength) between integrins. As we also track the cell height as a function of time in this model (Fig. 5b), the effect of mechanical cooperativity can be more clearly seen. With a saturated initial condition, the cell height (which is directly influenced by adhesion force) is increased during the retraction phase, which leads to reduced separation between the cell and ECM and allows the integrins to remain bound. This result shows that the bistability we saw and analysed previously (Irons et al., 2018) is a phenomenon that is also observed with vertical oscillations. It also highlights the role of material stiffnesses: for cooperativity to be effective there must be sufficient deformation of the cell or ECM. Additionally, although the bound fraction timecourses clearly show whether adhesion or rupture dominate in the model results, this information is not directly measurable in AFM experiments. The model therefore helps us to interpret experimental force curves by allowing us to relate their shape to underlying bound integrin fractions.
Figure 5:
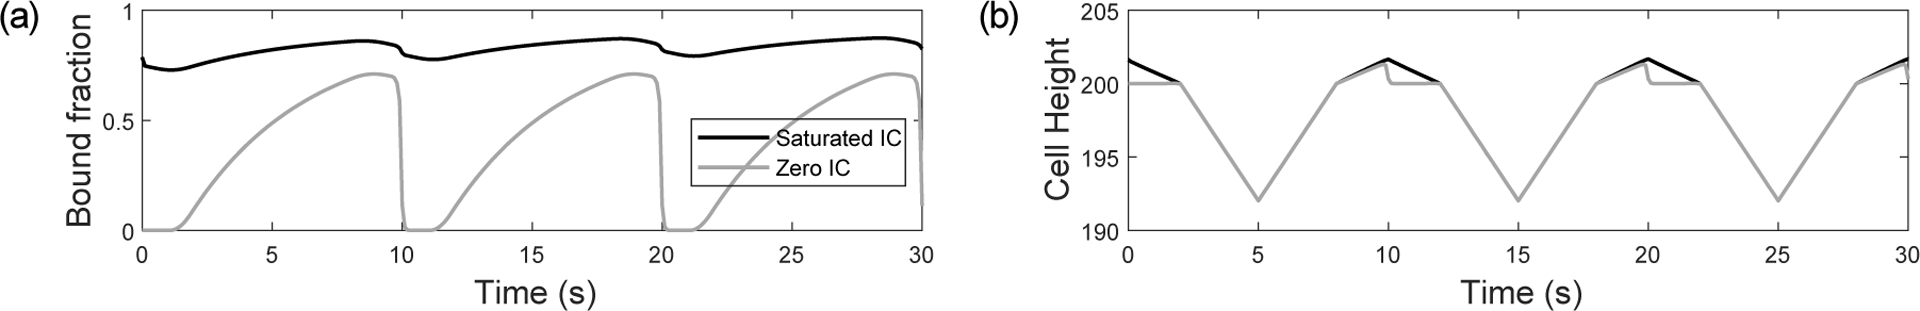
Model timecourses for (a) bound integrin fraction and (b) cell height, in the presence of intermediate amplitude (A = 50) approach-retract cycles with saturated (black line) and zero (grey line) initial conditions. All parameter values are in S.4 in the Supplementary Material.
Switching behaviour in individual timecourses
For each amplitude, we collected data from n prebind and non-prebind experiments, where 5 ≤ n ≤ 8 for the different amplitudes (listed in Table 1). We now consider some of the behaviours observed within single cells. In particular, in several of the force timecourses we observe a dramatic transition between rupture-type and adhesion-type curves within a single experiment. As noted previously, this observation could be critical since switching behaviours are characteristic of bistability in a stochastic system (see e.g. (Kochańczyk et al., 2013; Stamatakis and Mantzaris, 2009; Frigola et al., 2012; Norman et al., 2015; Tian and Burrage, 2006; McAdams and Arkin, 1999) and Discussion); investigating these cases could therefore provide evidence in support of the bistability observed in the mathematical model. In an example of such a force timecourse, for a cell subject to oscillations of amplitude 1000nm under the prebind protocol (Fig. 6a), a sudden large drop in the amplitude of force appears to occur after 160 seconds. There are also qualitative shape differences, as seen in the normalised force curves overlayed for each 10 second cycle (Fig. 6b). By comparing them in this way, we observe two distinct types of curves; wider curves that are characteristic of adhesion (Fig. 3g–i) and narrower curves characteristic of rupture (Fig. 3a–d). We interpret the two curve types in this way since a reduced width corresponds to less time with the bead and cell in contact. Note that corresponding differences were seen in prebind and non-prebind curves, from different cells, at A = 1200nm in Fig. 4a. The same normalised force data presented as a surface plot (Fig. 6c) indicates that a reduction in width of the curves occurs after the 16th cycle (t = 160s), where the switch is observed in the timecourse (Fig. 6a)—the behaviour therefore switches in the direction of adhesion to rupture.
Figure 6:
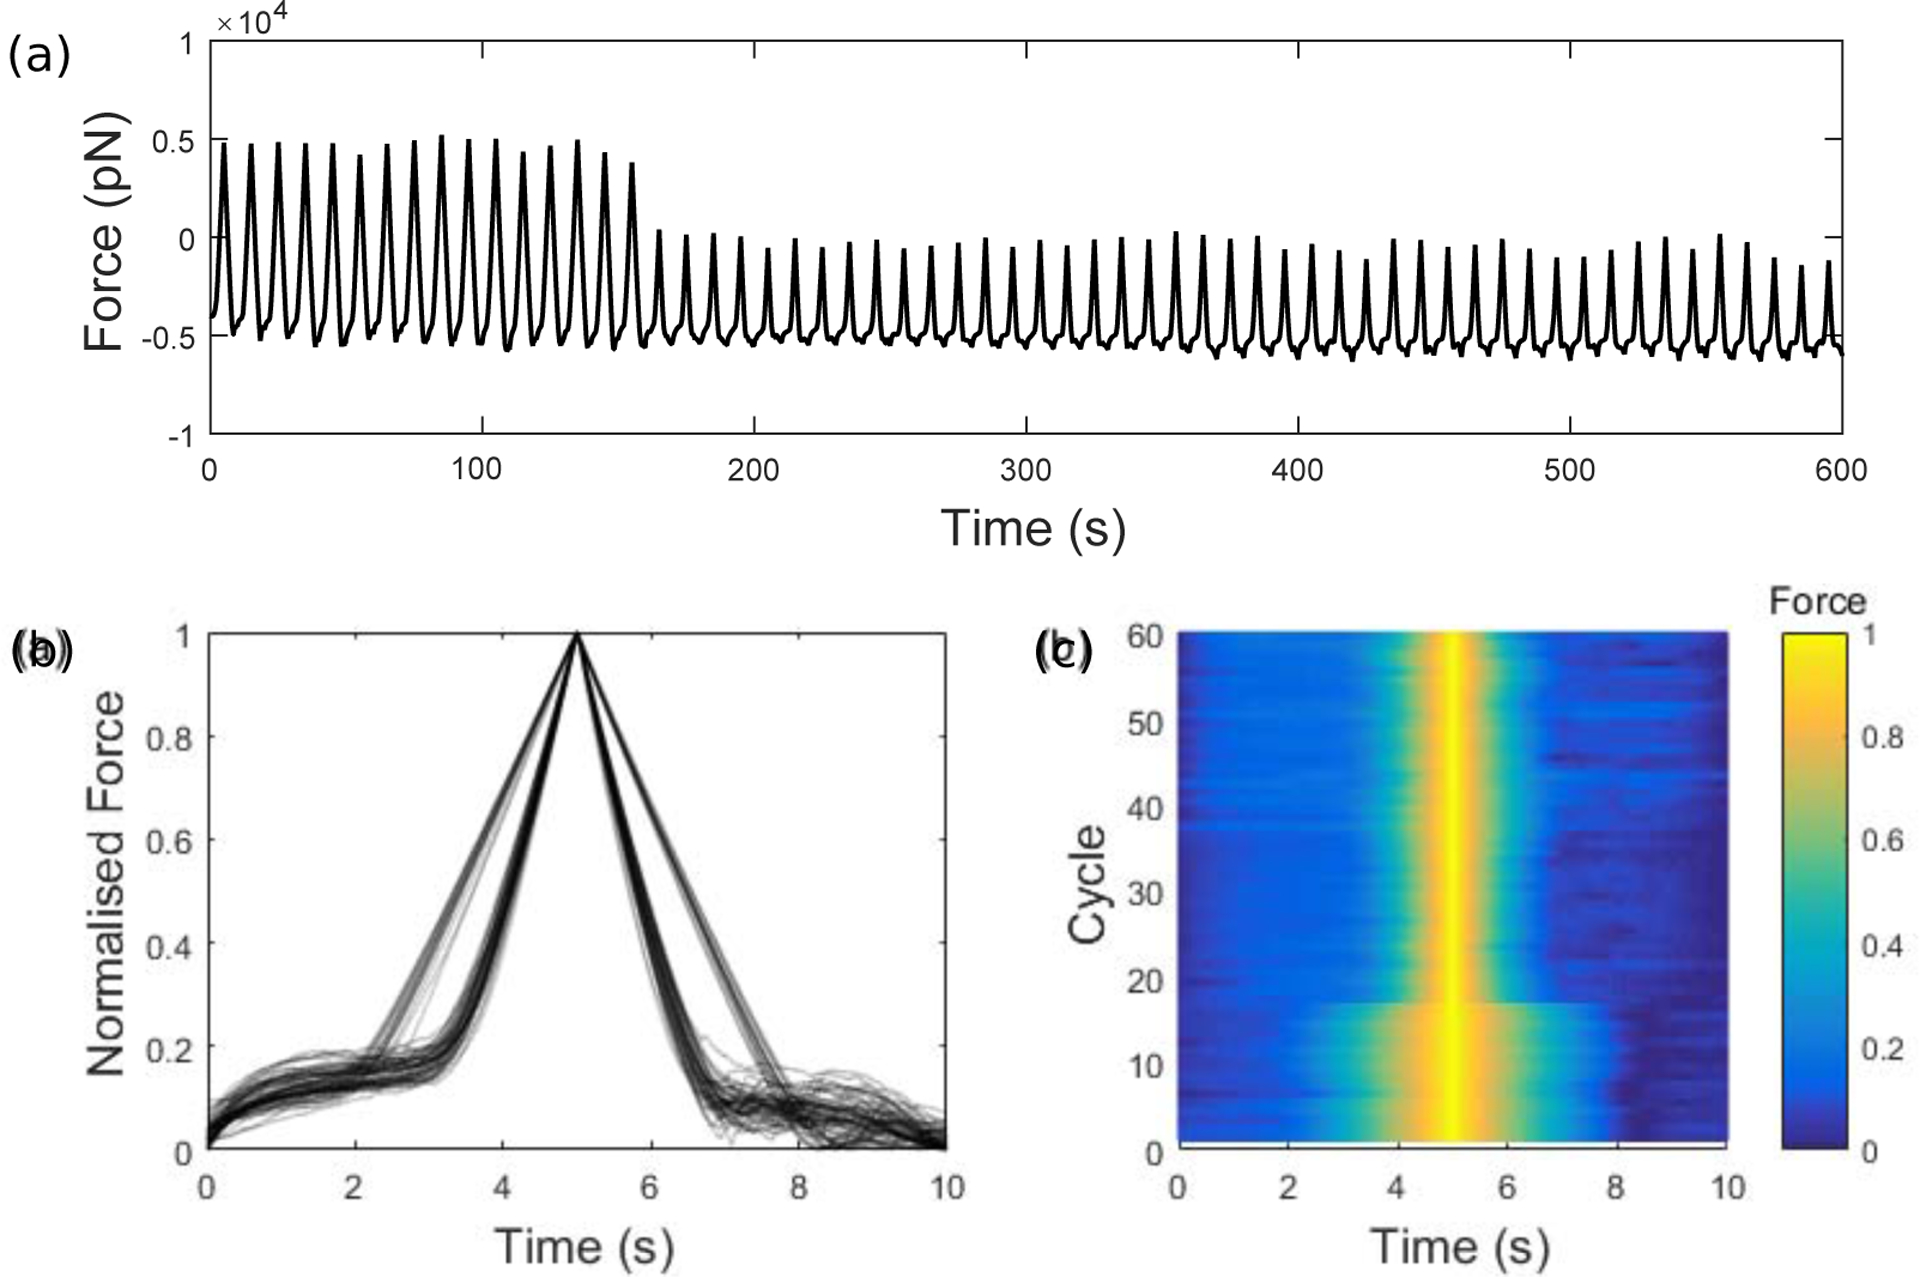
(a) Raw force timecourse that undergoes a sudden change at t = 160s. The cell was subject to oscillations of amplitude 1000nm under the prebind protocol. At earlier times, the force curves are characteristic of adhesion curves (Fig. 3g–i). At later times, there is more rupture, characteristic of full detachment curves (Fig. 3a–d). Normalised force curves from the raw timecourse are shown (b) overlayed for each 10 second cycle and (c) presented as a surface plot. We observe two distinct types of curves, where a reduced width corresponds to a reduced time with the bead and cell in contact (similar to the differences in prebind and non-prebind curves at A = 1200nm in Fig. 4a). A switch between the two curve types occurs suddenly after the 16th cycle, which corresponds to t = 160s.
In a similar example (Fig. 7a), a cell with prebinding subject to oscillations of amplitude 1000nm again undergoes a transition from adhesion to rupture. In a contrasting example, for a cell with prebinding subject to oscillations of amplitude 1150nm (Fig. 7b) the switch is in the opposite direction (to stronger adhesion). After identifying candidate cells that exhibit switching behaviours by visual inspection of their force timecourses, we used k-means cluster analysis (details below) to classify the 60 individual cycles within each timecourse into two clusters, where darker shaded regions indicate classification into an adhesion cluster. The temporal grouping of these clusters strongly supports the occurrence of discrete switching events. Further examples in Fig. 7c–e are for amplitudes 1150nm with the prebind condition and 1100nm and 1250nm with the non-prebind condition. Importantly, transitions in both directions (adhesion to rupture, and rupture to adhesion) as well as a temporary transition (Fig. 7d) are seen, and we observe these switching behaviours only within a small range of amplitudes (1000 ≤ A ≤ 1250)—this is consistent with our model result suggesting the existence of a bistable region at intermediate amplitudes in which stochastic switching is possible. Note that in this analysis of experimental switching, we may be capturing additional features that we do not account for in our mathematical model. For example, as well as just binding and rupture of integrins, force curves could contain artefacts of fibronectin unfolding (Krammer et al., 1999) or membrane tethering.
Figure 7:
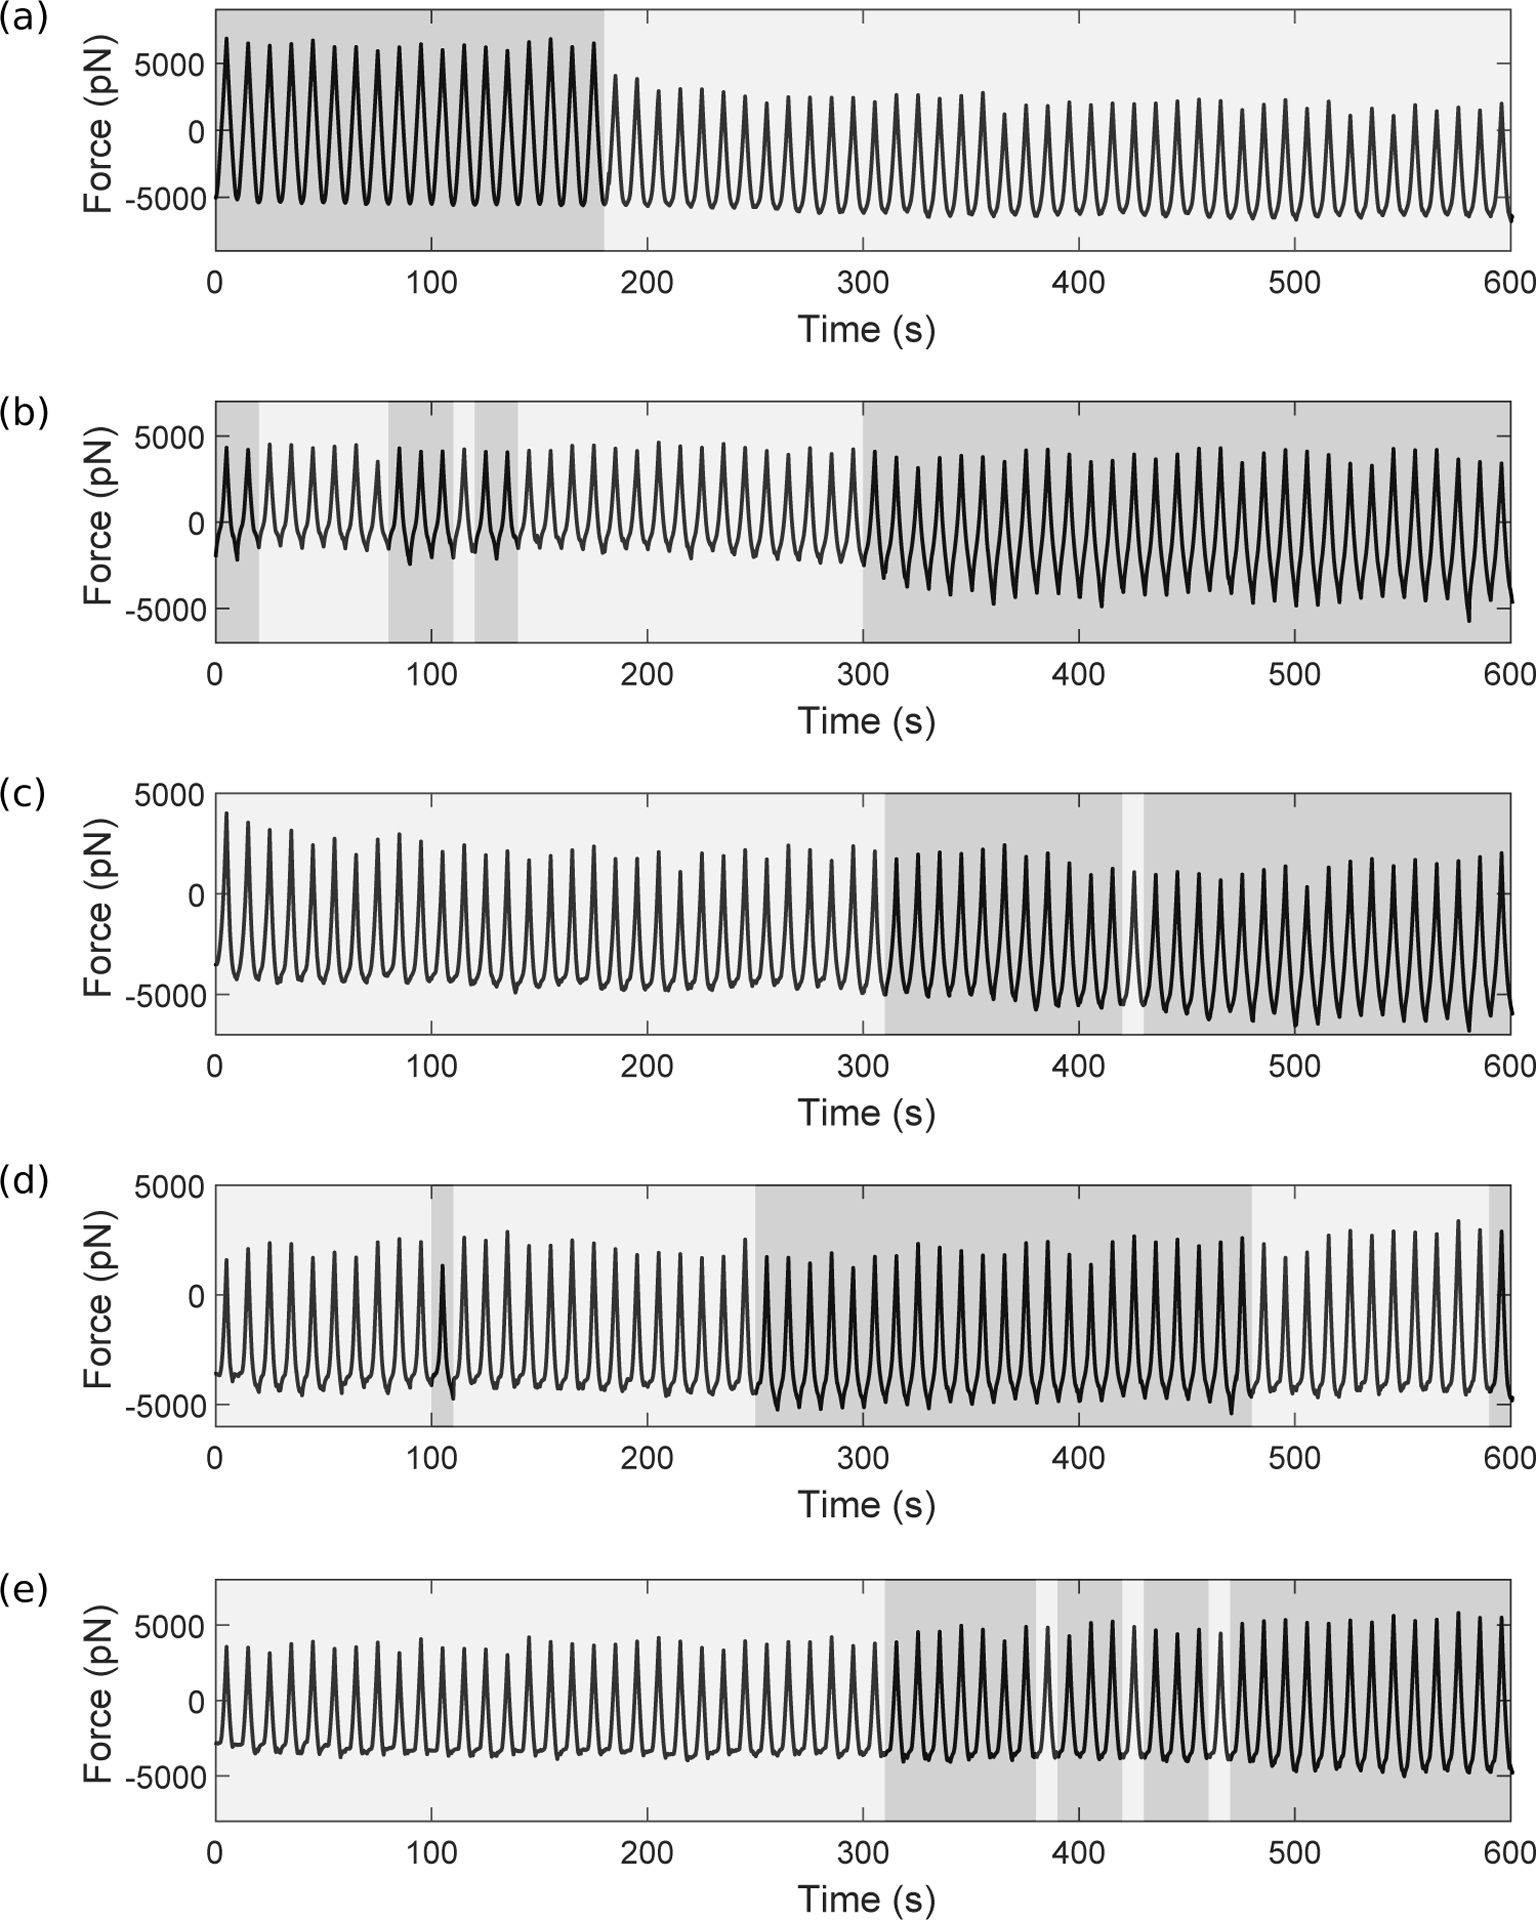
Experimental force timecourses from single cells that show switches in behaviour, subject to amplitudes ranging from 1000nm to 1250nm including prebind and non-prebind cells, as detailed. We used k-means cluster analysis (details below) to classify the 60 individual cycles within each timecourse into two clusters, where darker shaded regions indicate classification into an adhesion cluster. Switching in both directions (adhesion to rupture and rupture to adhesion) is seen, as well as a temporary switch. (a) 1000nm, prebind. At earlier times, the force curves are characteristic of adhesion curves (Fig. 3g–i). At later times (t > 180s), there is increased rupture (Fig. 3a–d) and a drop in magnitude. (b) 1150nm, prebind. After t = 300s, there is a sustained switch to increased adhesion. (c) 1100nm, no prebinding. Initially, rupture events are seen but there is a transition to stronger adhesion shortly after t = 300 seconds. (d) 1150nm, prebinding. There is a temporary transition to stronger adhesion between 250 and 480 seconds. (e) 1250nm, no prebinding. Initially, rupture events are seen but there is a transition to stronger adhesion, which becomes more noticeable over time.
Quantification of switching behaviour
The examples above were originally detected by visually inspecting the raw force data; now we demonstrate how cluster analysis can be used and refined to classify force curves and detect such switches automatically, using the data in Fig. 6 as an example. This would be useful for larger datasets, for quantifying mean behaviour within a cluster and for establishing a standardised approach for identifying bistability in an experimental setting. Firstly, we use the fit function in MATLAB to fit each normalised force curve in Fig. 6b to Gaussian functions of the form
| (16) |
where a, μ and σ influence the peak height and position and the standard deviation respectively (Fig. 8a). Although the fitting only provides a coarse approximation of the shape of the curves in Fig. 6b, the three parameters capture key features that allow us to separate the data into two distinct families of curves. Each force timecourse (consisting of 60 approach-retract cycles) is reduced to 60 triplets , and by visualising the triplet that represents each fit, we observe a clear separation of the data into two corresponding clusters (Fig. 8b). To formally specify these clusters, we apply a k-means++ algorithm to these points (Arthur and Vassilvitskii, 2007), using the kmeans function in MATLAB. Using k = 2 (Fig. 8b), the centroids of each cluster are shown by blue and orange diamonds for the adhesion and rupture clusters, respectively. The adhesion cluster is characterised by a larger width, σ, and increased symmetry, shown by the mean, μ, being closer to 5 (the midpoint of one 10 second cycle). Force curves with strong adhesion are therefore near-symmetric; however, when rupture dominates, the curves become increasingly asymmetric due to differences during approach and retraction. An alternative, one-dimensional, method is therefore to exploit directly the asymmetry of the rupture curves. This can be quantified via a skewness parameter (see S.3 in the Supplementary Material), shown in Fig. 8c. After the sixteenth cycle, where the switch in curve types was previously observed to occur (Fig. 6a,c), we see a corresponding sudden increase in skewness.
Figure 8:
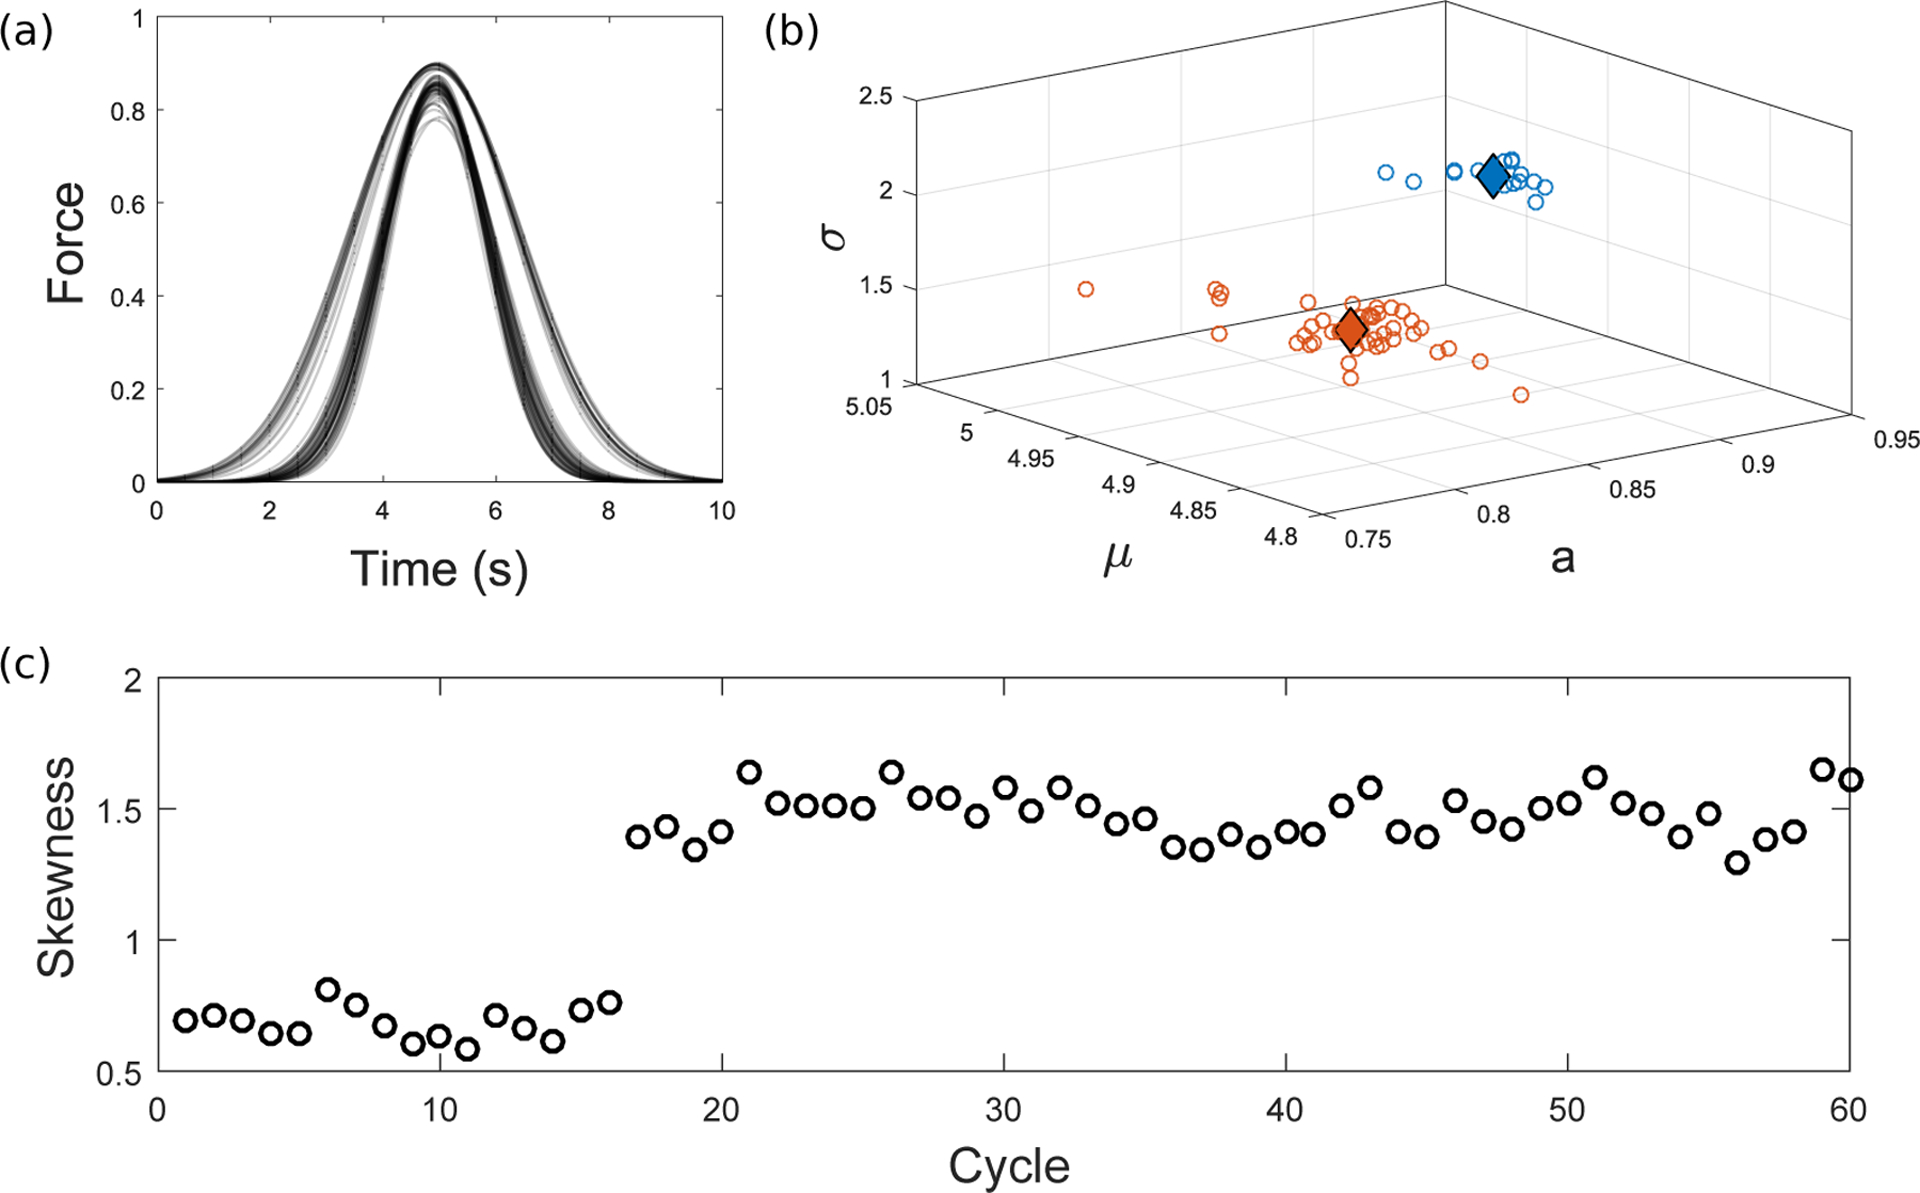
(a) Each normalised force curve in Fig. 6 has been fitted to a Gaussian function. (b) The three parameters uniquely defining the Gaussian (Eq. (16)) are plotted in 3D space. A k-means algorithm with k = 2 gives two distinct clusters, with centroids for the adhesion and rupture clusters shown by blue and orange diamonds respectively. (c) Skewness gives a one-dimensional measure of asymmetry (see S.3 in the Supplementary Material), and in this case also clearly separates the two distinct curve types. There is a sudden increase in skewness at the transition from adhesion to rupture curves (after Cycle 16, see Fig. 6), reflecting the more noticeable asymmetry of rupture.
Discussion
With a view to better understand the effect of dynamic loading on integrin adhesion dynamics, we used a combined experimental and mathematical modelling approach. Live SMCs were isolated from the thoracic aorta of rats, and vertical oscillations of varying amplitudes were applied to the cells via an AFM probe (and the attached fibronectin-coated bead). During this process, force timecourses from 60 consecutive approach-retract cycles were collected. Two protocols were followed for each amplitude: ‘prebind’, in which 20 minutes of adhesion formation preceded the oscillations, or ‘non-prebind’ in which oscillations began immediately at the time of initial approach. The mathematical model was based on our previous model developed for lateral oscillations (Irons et al., 2018), which we adapted to consider integrin binding dynamics in the presence of vertical motion between the cell and the ECM. We simulated varying amplitudes of vertical oscillations applied to the ECM with either a saturated or zero initial condition for the number of bound integrins, mimicking the two experimental AFM protocols: prebind or non-prebind. The theoretical results are qualitatively similar to those obtained for lateral oscillations (Irons et al., 2018): low amplitude oscillations resulted in a high fraction of bound integrins (Fig. 3j), and high amplitude oscillations resulted in a low fraction of bound integrins (Fig. 3e). For intermediate amplitude oscillations, we observed bistability (Fig. 5) due to mechanical cooperativity between integrins. The model provides insight into the mechanisms behind the two distinct behaviours observed, by revealing the corresponding patterns in bound integrin fractions and cell deformations. These are factors that cannot be measured by the current experimental setup.
For both low and high oscillation amplitudes, which produced distinct patterns in force, the experimentally measured force qualitatively matched the force predicted by the model. Additionally, for some intermediate amplitudes of oscillation such as 1200nm (Fig. 4a), prebinding, on average, induced a slight widening of the experimental force curves, which could be indicative of increased adhesion. We believe that the population- and individual-level results shown here suggest that the bistability predicted by the model is present in cells in vitro, although we discuss below some future improvements that will help to determine this conclusively. If present, the existence of bistability could have important physiological consequences, as transient mechanical stimuli could induce long-term changes in adhesion dynamics and, as a result, in the ability of smooth muscle cells to transmit contractile forces.
Although we found good qualitative agreement between model and experiments, there are a number of challenges and limitations that could be addressed in future studies. A notable experimental challenge is an inherent variability in cell properties, which make direct comparisons between small groups of cells challenging. We analysed variability in cell height for a specific amplitude category, A = 1200nm (see S.2 in the Supplementary Material) where we showed that differences up to several hundred nanometres could occur. To more accurately use discrete amplitude categories, an initial measurement of cell height should therefore be taken, with oscillation amplitude applied relative to this value rather than absolutely. Our deterministic model shows bistability as two differing outcomes where only the initial condition for integrins varies. However, because of the variability between cells in vitro, it is harder to make this comparison in an experimental setting. This led us primarily to consider timecourses from single cells. To fully make use of groups of cells in future, other key factors such as stiffness and basal integrin expression (which were both assumed to be constant in the theoretical model) should be controlled as much as is possible. For example, to minimise differences in cell stiffness, cytoskeletal polymerisation could be manipulated consistently between cells. This would also help us to understand the importance of cell deformation, which the model predicts to be crucial to the cooperative behaviour that drives bistability. Consideration of different contractile states (via contractile agonists and relaxants) would also be of interest, where contractility is known to alter adhesion (Hong et al., 2012, 2014). Finally, instead of live SMCs, the cells could be fixed by treatment with paraformaldehyde (PFA) so that the cytoskeleton would be locked and no active changes in cell binding can be induced. This would help to determine whether the changes in integrin behaviour are induced actively (due to intracellular signalling) or passively (due to the load-dependent binding/rupture modelled here). When using live cells, the effect of intracellular signalling is an important future consideration, in both model and experiment, as it regulates matrix stiffness, cytoskeletal stiffness and integrin expression via mechanosensitive pathways.
A further consideration for future experimental design is the contribution of other interactions between fibronectin and the cell, not mediated by integrins. The specific interaction between fibronectin and integrins has previously been demonstrated by Sun et al. (2005), who showed that their binding probability was significantly reduced by function-blocking integrin antibodies, such as anti-β1-integrin and anti-α5-integrin. The specific interaction between fibronectin and integrins is also supported by other studies, such as Francis et al. (2002), where integrin α5-null embryos showed decreased fibronectin expression but not other ECM proteins, such as laminin or collagen IV. To quantify the specificity of the fibronectin-integrin interactions, a direct comparison with a control group using bovine serum albumin (BSA)-coated beads could be considered in future studies. A previous study showed only a 4% probability of adhesion to cells (Sun et al., 2005), whereas, in the same study, fibronectin-coated beads showed a 75% probability of adhesion.
Several force timecourses from single cells exhibited some interesting behaviour, where a sudden switch in both the magnitude and shape of the force curves were seen (Figs. 6, 7). In our deterministic model, although we showed two adhesion states to coexist for a given amplitude (Figs. 4, 5), both states cannot be obtained within a single timecourse. Instead, for a given initial condition, a deterministic trajectory was followed to one of the two stable states, where the solution remained. However, if stochastic fluctuations are introduced into a bistable system, perturbations are known to be able to drive the solution across an unstable (separating) branch towards the other stable state, giving rise to the phenomenon of ‘stochastic switching’ (Norman et al., 2015). This is a known indicator of underlying bistability, shown in theoretical and experimental studies (Kochańczyk et al., 2013; Stamatakis and Mantzaris, 2009; Frigola et al., 2012; Norman et al., 2015; Tian and Burrage, 2006; McAdams and Arkin, 1999). Switching behaviour within individual timecourses could therefore provide an alternative indicator of bistability to the comparisons between prebind and non-prebind cells. Importantly, switching was observed in both directions (adhesion to rupture and rupture to adhesion) and only in a narrow range of intermediate amplitudes, which is consistent with the notion of a bistable window, seen in the deterministic model. An additional future consideration could be the extension of the mathematical model to consider stochastic, rather than deterministic, integrin binding and rupture events (e.g. Paszek et al. (2009); Chan and Odde (2008); Walcott et al. (2011)). This would minimise qualitative differences seen (for example the smooth rather than discrete binding and rupture events) and stochastic switching could then be explored theoretically.
Although the switching examples (Figs. 6, 7) were originally detected by visual inspection of the raw force data, we demonstrated cluster analysis methods that could be used and refined to classify force curves and detect such switches automatically. One method was to fit the data to Gaussian functions (Fig. 8), defined uniquely by three parameters. Plotting these parameters in three-dimensional space produces two distinct clusters of points, corresponding to the adhesion- and rupture-type curves. An alternative to fitting the data to Gaussian functions is to consider the skewness (normalised third central moment) of the force curves (Fig. 8c), which produces a single parameter for each curve. For switching behaviour alone to provide strong evidence for bistability, a larger number of examples will be necessary. In these cases, it may be desirable for the detection of switching to be automated rather than detected visually. Both clustering methods mentioned above require a subjective threshold parameter for cluster detection to be specified, and this should be carefully considered. Further discussion of these (and alternative) clustering methods, and their advantages and disadvantages is provided in S.3 in the Supplementary Material. Experiments focussed around the intermediate range of amplitudes (here, A = 1000–1250nm) appeared to yield a higher likelihood of switching. If this continues to be the case, the hypothesis of bistability will be strengthened: stochastic switches due to bistability would be expected to lie near, and to be especially likely near the boundaries of, a bistable region. The goal should therefore be to identify the range and frequency of amplitudes in which switching behaviours occur.
Supplementary Material
Acknowledgements
This study was supported in part by NIH grant NIH 1PO1HL095486 to Gerald A. Meininger.
Footnotes
Publisher's Disclaimer: This is a PDF file of an unedited manuscript that has been accepted for publication. As a service to our customers we are providing this early version of the manuscript. The manuscript will undergo copyediting, typesetting, and review of the resulting proof before it is published in its final form. Please note that during the production process errors may be discovered which could affect the content, and all legal disclaimers that apply to the journal pertain.
Conflict of interest: None.
References
- Arthur D, Vassilvitskii S, 2007. k-means++: The advantages of careful seeding, in: Proceedings of the Eighteenth Annual ACM-SIAM Symposium on Discrete Algorithms, Society for Industrial and Applied Mathematics. pp. 1027–1035. [Google Scholar]
- Baumgartner W, Hinterdorfer P, Ness W, Raab A, Vestweber D, Schindler H, Drenckhahn D, 2000. Cadherin interaction probed by atomic force microscopy. Proceedings of the National Academy of Sciences 97, 4005–4010. [DOI] [PMC free article] [PubMed] [Google Scholar]
- Binnig G, Quate CF, Gerber C, 1986. Atomic force microscope. Physical Review Letters 56, 930. [DOI] [PubMed] [Google Scholar]
- Chan CE, Odde DJ, 2008. Traction dynamics of filopodia on compliant substrates. Science 322, 1687–1691. [DOI] [PubMed] [Google Scholar]
- Dumbauld DW, Shin H, Gallant ND, Michael KE, Radhakrishna H, García AJ, 2010. Contractility modulates cell adhesion strengthening through focal adhesion kinase and assembly of vinculin-containing focal adhesions. Journal of Cellular Physiology 223, 746–756. [DOI] [PMC free article] [PubMed] [Google Scholar]
- Erdmann T, Schwarz US, 2004. Stability of adhesion clusters under constant force. Physical Review Letters 92, 108102. [DOI] [PubMed] [Google Scholar]
- Francis SE, Goh KL, Hodivala-Dilke K, Bader BL, Stark M, Davidson D, Hynes RO, 2002. Central roles of α5β1 integrin and fibronectin in vascular development in mouse embryos and embryoid bodies. Arteriosclerosis, thrombosis, and vascular biology 22, 927–933. [DOI] [PubMed] [Google Scholar]
- Frigola D, Casanellas L, Sancho JM, Ibañes M, 2012. Asymmetric stochastic switching driven by intrinsic molecular noise. PloS One 7. [DOI] [PMC free article] [PubMed] [Google Scholar]
- Hoffman BD, Grashoff C, Schwartz MA, 2011. Dynamic molecular processes mediate cellular mechanotransduction. Nature 475, 316–323. [DOI] [PMC free article] [PubMed] [Google Scholar]
- Hong Z, Sun Z, Li M, Li Z, Bunyak F, Ersoy I, Trzeciakowski JP, Staiculescu MC, Jin M, Martinez-Lemus L, et al. , 2014. Vasoactive agonists exert dynamic and coordinated effects on vascular smooth muscle cell elasticity, cytoskeletal remodelling and adhesion. The Journal of Physiology 592, 1249–1266. [DOI] [PMC free article] [PubMed] [Google Scholar]
- Hong Z, Sun Z, Li Z, Mesquitta WT, Trzeciakowski JP, Meininger GA, 2012. Coordination of fibronectin adhesion with contraction and relaxation in microvascular smooth muscle. Cardiovascular Research 96, 73–80. [DOI] [PMC free article] [PubMed] [Google Scholar]
- Humphries JD, Wang P, Streuli C, Geiger B, Humphries MJ, Ballestrem C, 2007. Vinculin controls focal adhesion formation by direct interactions with talin and actin. The Journal of Cell Biology 179, 1043–1057. [DOI] [PMC free article] [PubMed] [Google Scholar]
- Huveneers S, Danen EHJ, 2009. Adhesion signaling-crosstalk between integrins, Src and Rho. Journal of Cell Science 122, 1059–1069. [DOI] [PubMed] [Google Scholar]
- Huxley AF, 1957. Muscle structure and theories of contraction. Prog. Biophys. Biophys. Chem 7, 255–318. [PubMed] [Google Scholar]
- Irons L, Owen MR, O’Dea RD, Brook BS, 2018. Effect of loading history on airway smooth muscle cell-matrix adhesions. Biophysical Journal 114, 2679–2690. [DOI] [PMC free article] [PubMed] [Google Scholar]
- Karácsony O, Akhremitchev BB, 2011. On the detection of single bond ruptures in dynamic force spectroscopy by AFM. Langmuir 27, 11287–11291. [DOI] [PubMed] [Google Scholar]
- Katsumi A, Orr AW, Tzima E, Schwartz MA, 2004. Integrins in mechanotransduction. Journal of Biological Chemistry 279, 12001–12004. [DOI] [PubMed] [Google Scholar]
- Kemp-O’Brien K, Parsons M, 2013. Using FRET to analyse signals controlling cell adhesion and migration. Journal of Microscopy 251, 270–278. [DOI] [PubMed] [Google Scholar]
- Kochańczyk M, Jaruszewicz J, Lipniacki T, 2013. Stochastic transitions in a bistable reaction system on the membrane. Journal of the Royal Society Interface 10, 20130151. [DOI] [PMC free article] [PubMed] [Google Scholar]
- Kong D, Ji B, Dai L, 2008. Stability of adhesion clusters and cell reorientation under lateral cyclic tension. Biophysical Journal 95, 4034–44. [DOI] [PMC free article] [PubMed] [Google Scholar]
- Kong F, García AJ, Mould AP, Humphries MJ, Zhu C, 2009. Demonstration of catch bonds between an integrin and its ligand. The Journal of Cell Biology 185, 1275–1284. [DOI] [PMC free article] [PubMed] [Google Scholar]
- Krammer A, Lu H, Isralewitz B, Schulten K, Vogel V, 1999. Forced unfolding of the fibronectin type iii module reveals a tensile molecular recognition switch. Proceedings of the National Academy of Sciences 96, 1351–1356. [DOI] [PMC free article] [PubMed] [Google Scholar]
- Kuznetsova TG, Starodubtseva MN, Yegorenkov NI, Chizhik SA, Zhdanov RI, 2007. Atomic force microscopy probing of cell elasticity. Micron 38, 824–833. [DOI] [PubMed] [Google Scholar]
- Lacker HM, Peskin CS, 1986. A mathematical method for unique determination of crossbridge properties from steady-state mechanical and energetic experiments on macroscopic muscle, in: Some Mathematical Questions in Biology-Muscle Physiology The American Mathematical Society, Providence, RI: volume 16, pp. 121–153. [Google Scholar]
- Le Grimellec C, Lesniewska E, Giocondi M, Finot E, Vié V, Goudonnet J, 1998. Imaging of the surface of living cells by low-force contact-mode atomic force microscopy. Biophysical Journal 75, 695–703. [DOI] [PMC free article] [PubMed] [Google Scholar]
- Livne A, Bouchbinder E, Geiger B, 2014. Cell reorientation under cyclic stretching. Nature Communications 5, 3938. [DOI] [PMC free article] [PubMed] [Google Scholar]
- Mari SA, Pessoa J, Altieri S, Hensen U, Thomas L, Morais-Cabral JH, Müller DJ, 2011. Gating of the MlotiK1 potassium channel involves large rearrangements of the cyclic nucleotide-binding domains. Proceedings of the National Academy of Sciences 108, 20802–20807. [DOI] [PMC free article] [PubMed] [Google Scholar]
- McAdams HH, Arkin A, 1999. It’s a noisy business! Genetic regulation at the nanomolar scale. Trends in Genetics 15, 65–69. [DOI] [PubMed] [Google Scholar]
- Norman TM, Lord ND, Paulsson J, Losick R, 2015. Stochastic switching of cell fate in microbes. Annual Review of Microbiology 69, 381–403. [DOI] [PubMed] [Google Scholar]
- Paszek MJ, Boettiger D, Weaver VM, Hammer DA, 2009. Integrin clustering is driven by mechanical resistance from the glycocalyx and the substrate. PLoS Computational Biology 5. [DOI] [PMC free article] [PubMed] [Google Scholar]
- Puchner EM, Gaub HE, 2009. Force and function: probing proteins with AFM-based force spectroscopy. Current Opinion in Structural Biology 19, 605–614. [DOI] [PubMed] [Google Scholar]
- Qian J, Wang J, Lin Y, Gao H, 2009. Lifetime and strength of periodic bond clusters between elastic media under inclined loading. Biophysical Journal 97, 2438–2445. [DOI] [PMC free article] [PubMed] [Google Scholar]
- Srinivasan M, Walcott S, 2009. Binding site models of friction due to the formation and rupture of bonds: State-function formalism, forcevelocity relations, response to slip velocity transients, and slip stability. Physical Review E - Statistical, Nonlinear, and Soft Matter Physics 80, 1–15. [DOI] [PubMed] [Google Scholar]
- Stamatakis M, Mantzaris NV, 2009. Comparison of deterministic and stochastic models of the lac operon genetic network. Biophysical journal 96, 887–906. [DOI] [PMC free article] [PubMed] [Google Scholar]
- Suki B, Parameswaran H, Alves C, Araújo AD, Bartolák-Suki E, 2020. Cellular and extracellular homeostasis in fluctuating mechanical environments, in: Multi-scale Extracellular Matrix Mechanics and Mechanobiology. Springer, pp. 83–121. [Google Scholar]
- Sun Z, Martinez-Lemus LA, Hill MA, Meininger GA, 2008. Extracellular matrix-specific focal adhesions in vascular smooth muscle produce mechanically active adhesion sites. American Journal of Physiology-Cell Physiology 295, C268–C278. [DOI] [PMC free article] [PubMed] [Google Scholar]
- Sun Z, Martinez-Lemus LA, Trache A, Trzeciakowski JP, Davis GE, Pohl U, Meininger GA, 2005. Mechanical properties of the interaction between fibronectin and α5β1-integrin on vascular smooth muscle cells studied using atomic force microscopy. American Journal of Physiology-Heart and Circulatory Physiology 289, H2526–H2535. [DOI] [PubMed] [Google Scholar]
- Tian T, Burrage K, 2006. Stochastic models for regulatory networks of the genetic toggle switch. Proceedings of the National Academy of Sciences 103, 8372–8377. [DOI] [PMC free article] [PubMed] [Google Scholar]
- Touhami A, Nysten B, Dufrêne YF, 2003. Nanoscale mapping of the elasticity of microbial cells by atomic force microscopy. Langmuir 19, 4539–4543. [Google Scholar]
- Van Es MH, Tang J, Preiner J, Hinterdorfer P, Oosterkamp TH, 2014. Single molecule binding dynamics measured with atomic force microscopy. Ultramicroscopy 140, 32–36. [DOI] [PubMed] [Google Scholar]
- Walcott S, Kim DH, Wirtz D, Sun SX, 2011. Nucleation and decay initiation are the stiffness-sensitive phases of focal adhesion maturation. Biophysical Journal 101, 2919–2928. [DOI] [PMC free article] [PubMed] [Google Scholar]
- Weisel JW, Shuman H, Litvinov RI, 2003. Protein-protein unbinding induced by force: single-molecule studies. Current Opinion in Structural Biology 13, 227–235. [DOI] [PubMed] [Google Scholar]
- Whited AM, Park PSH, 2014. Atomic force microscopy: a multifaceted tool to study membrane proteins and their interactions with ligands. Biochimica et Biophysica Acta (BBA)-Biomembranes 1838, 56–68. [DOI] [PMC free article] [PubMed] [Google Scholar]
Associated Data
This section collects any data citations, data availability statements, or supplementary materials included in this article.