

Abstract
ETS homologous factor (EHF) plays a critical function in epithelial cell differentiation and proliferation. However, the roles of EHF in cancer remain largely unknown. In the present study, we investigated the expression levels, precise function and mechanism of EHF in colorectal carcinoma (CRC). We observed significantly elevated EHF expression in CRC cell lines and tissues. EHF overexpression correlated positively with poor differentiation, advanced T stage, and shorter overall survival of CRC patients. Function experiments revealed that EHF overexpression promoted CRC cell proliferation, migration, and invasion in vitro and in vivo. Mechanistically, EHF could directly upregulate transforming growth factor β1 (TGF‐β1) expression at the transcription level, thereby activating canonical TGF‐β signaling. Our findings provide novel insights into the mechanisms of EHF in tumorigenesis, invasion, and metastasis of CRC, which may help to provide new therapeutic targets for CRC intervention.
Keywords: colorectal carcinoma, EHF, proliferation and migration, TGF‐β signaling, transcription factor
1, EHF is upregulated in colorectal carcinoma (CRC). 2, The EHF overexpressing contributes to CRC cell proliferation, invasion and metastasis in vitro and in vivo. 3, EHF is a transcript activator for promoting TGF‐β1 transcription, thereby activating the canonical TGF‐β signaling.

Abbreviations
- CRC
colorectal carcinoma
- DEGs
different expressed genes
- EBS
EHF binding sites
- EHF
ETS transcription factors
- ETS
E26 transformation‐specifics
- GO
Gene Ontology
- GSEA
gene set enrichment analysis
- GTEx
The Genotype‐Tissue Expression
- IHC
immunohistochemistry
- TCGA
The Cancer Genome Atlas
- TF
transcription factors
1. INTRODUCTION
Colorectal carcinoma (CRC) is the third most common malignancy and the second leading cause of cancer‐related death worldwide. 1 Diverse genetic and clinical manifestations contribute to highly heterogeneous CRC, and have significant impact on therapeutic outcomes. 2 Despite significant recent advances in the diagnosis and treatment of patients with CRC, the prognosis for patients remains poor. Metastatic CRC accounts for 40‐50% of newly diagnosed CRCs, and is the main cause of CRC‐related death. 3 Thus, a complete understanding of CRC tumorigenesis and progression, and the development of new diagnostic and treatment strategies for metastatic CRC are urgently needed.
The epithelium‐specific ETS (ESE) TFs are a subgroup of the larger E26 transformation‐specific (ETS) TF family. 4 The ESE TFs can be divided into 2 groups based on the homology of the ETS DNA binding domain—(1) ELF3 (ESE1), ELF5 (ESE2) and EHF (ESE3), and (2) SPDEF—but are grouped together based on their common epithelial‐specific expression profiles. 5 ESEs are expressed primarily in cells of epithelial origin and may have a critical function in epithelial cell differentiation and proliferation. 6 , 7 , 8 ESE factors have also been implicated in the pathogenesis of a wide range of cancers, with both oncogenic and tumor suppressive roles described depending on tumor type. 9 , 10 , 11 , 12 , 13 , 14 , 15 In prostate cancer, EHF mRNA and protein expression is decreased. 9 Re‐expression of EHF in prostate cancer cells inhibits clonogenic survival and stem‐like properties and promotes epithelial differentiation by repressing epithelial‐to‐mesenchymal transition (EMT). 9 , 10 , 11 In contrast with the tumor suppressor roles described above, an oncogenic role for EHF has been described in gastric, 12 thyroid, 13 and ovarian cancers. 14 In CRC, Taniue and colleagues reported that EHF was required for the survival of the TP53 wild‐type CRC cell line. 15 However, the precise function and mechanism of EHF in CRC are largely unknown. Therefore, investigations into EHF in CRC will lead to a better understanding of the molecular mechanisms underlying CRC development and progression.
Here, we examined EHF expression in CRC tissues and cell lines using real‐time PCR, western blot and immunohistochemistry (IHC). The effects of aberrant EHF expression on cellular biological behavior were investigated both in vitro and in vivo by gain‐of‐function and loss‐of‐function experiments. We further presented evidence of EHF activating transforming growth factor β (TGF‐β) signaling pathways in CRC cells. Our findings provide novel insights into the mechanisms of EHF in tumorigenesis, invasion, and metastasis of CRC, which may help to provide new therapeutic targets for CRC intervention.
2. MATERIALS AND METHODS
2.1. Tissue specimens
The tissue specimens used for this study were obtained with informed consent from the Ethics Committee of Nanfang Hospital, Southern Medical University (Guangzhou, China). All CRC specimens were obtained from patients who had been diagnosed with primary CRC and had subsequently undergone elective surgery in Nanfang Hospital, Southern Medical University, and their comprehensive set of clinicopathological data had been recorded. Freshly frozen samples from CRC patients were selected for real‐time PCR and western blotting. Formalin‐fixed tumor tissues specimens, comprising 54 CRC tumor tissues and 61 adjacent non‐tumors tissues, were used for IHC analysis.
2.2. Cell culture
The human embryonic kidney cell line 293T (HEK293T), immortalized colon mucosa epithelial cell line (FHC), and human CRC cell lines HT29, LoVo, HCT116, SW480, DLD1, LS174t, SW620 and RKO were obtained from the American Type Culture Collection (ATCC, Manassas, VA, USA). A subclone named M5, which has enhanced metastatic abilities in the liver, was isolated by the in vivo selection of SW480 cells in our laboratory. 16 All CRC cell lines were cultured in RPMI 1640 medium (Gibco, Gaithersburg, MD, USA) with 10% fetal bovine serum (FBS, Gibco) and 100 U/ml penicillin/streptomycin (Gibco). 293T cells were maintained in Dulbecco's modified Eagle's medium (DMEM) supplemented with 10% FBS. FHC cells were cultured in DMEM:F12 medium (Gibco) with 10% FBS, 25 mmol/L HEPES, 10 mg/L cholera toxin, 5 mg/L insulin, 5 mg/L transferrin, 100 mg/L hydrocortisone, and 20 mg/L human recombinant epidermal growth factor (EGF). To examine the effects of TGF‐β signaling, LoVo, HCT116, SW480 and HT29 cells were treated with 10 ng/mL recombinant human TGF‐β1 (PeproTech Inc, Rocky Hill, NJ, USA) for 48 h, or with 1 μΜ TGFβR1 inhibitor (SB525334, Selleckchem, Houston, TX, USA) for 48 h, respectively. All of the cell lines were cultured at 37°C and in 5% CO2 in air in an humidified incubator.
2.3. RNA extraction and quantitative real‐time PCR
Total RNA from tissues and cell lines were extracted using TRIzol Reagent (TaKaRa, Dalian, China) following the manufacturer’s protocol. cDNA was synthesized with 500 ng total RNA using the PrimeScript RT Reagent Kit (TaKaRa). Real‐time PCR was carried out on an ABI PRISM 7500 Sequence Detection System (Applied Biosystems, Foster City, CA) using TB Green Premix Ex Taq™ (TaKaRa). PCR was performed under the following conditions: 95°C for 30 s, followed by 40 cycles of amplification (95°C for 5 s, 55°C for 30 s, and 72°C for 40 s), and then 72°C for 10 min. ACTB was chosen as an internal quantitative reference. The assay was performed in triplicate for each case to allow the assessment of technical variability. Comparative quantification was determined using the 2‐ΔΔCt method. All primer sequences are listed in Supporting Information (Data S1).
2.4. Nuclear‐cytoplasmic protein fractionation
Subcellular protein fractionation was performed as described previously. 17 Briefly, cells were harvested and washed in PBS and then lysed in hypotonic buffer (10 mmol/L HEPES‐KOH, 1.5 mmol/L MgCl2, 10 mmol/L KCl, 0.5 mmol/L DTT, 0.2 mmol/L PEFA 1023, pH 7.9, and 0.5% NP‐40). Cell lysates were centrifuged for 10 s at 16 000 g at 4°C. The supernatants were collected (cytoplasmic extracts), and the pellets were washed twice with hypotonic buffer, lysed with high‐salt buffer (450 mmol/L NaCl, 1 mmol/L PMSF, 50 mmol/L Tris pH 7.4, 0.2 mmol/L Na3VO4, 5 mmol/L β‐glycerophosphate, 20% glycerol, 2 mmol/L DTT, 1% NP‐40), and incubated for 10 min on an end‐over‐end rotator at 4°C. Cell lysates were centrifuged for 15 min at 16 000 g at 4°C, and the supernatants were collected (nuclear extracts).
2.5. Western blotting analysis
Cells and tissues were lysed in prechilled RIPA buffer containing phosphatase inhibitors, protease inhibitors and PMSF. The protein lysates were separated by 10% SDS‐PAGE and transferred to polyvinylidene fluoride (PVDF) membranes (Millipore, Darmstadt, Germany). The membranes were blocked in 5% skimmed milk in 1× PBS‐T (0.5% Tween‐20) and incubated overnight at 4°C with the following primary antibodies: anti‐EHF (Thermo Fisher Scientific, MA, USA), anti‐TGF‐β1 (Cell Signaling Technology, MA, USA), anti‐SMAD2 (Cell Signaling Technology), anti‐SMAD3 (Cell Signaling Technology), anti‐p‐SMAD2 (Cell Signaling Technology), anti‐p‐SMAD3 (Cell Signaling Technology) or anti‐SMAD4 (Cell Signaling Technology). Anti‐tubulin (Proteintech Group, Wuhan, China) and anti‐histone3 (Proteintech Group) were used as protein‐loading controls. Blots were incubated with HRP‐conjugated secondary antibodies for 1 h at room temperature, and visualized with ECL Western Blotting Substrate (Thermo Fisher Scientific). Immunoblotting signals were detected by densitometry using Quantity One Software (Bio‐Rad, West Berkeley, CA, USA).
2.6. Immunohistochemistry analysis
Immunohistochemistry (IHC) was performed as described previously, 18 with the following modifications. The slides were incubated overnight with anti‐EHF antibody (1:50, Thermo Fisher Scientific) at 4°C. Immunodetection was performed using diaminobenzidine (DAB) (Dako) according the manufacture's protocol and the reaction times of each section were consistent, followed by counterstaining with hematoxylin.
IHC‐stained tissue sections were reviewed and scored separately by double‐blinded procedure. Scores were determined based on both the intensity and proportion of EHF‐positive cells, as described previously. 16 Extent of staining, defined as the percentage of the positive stained areas in relation to the entire section, was scored on a scale of 0‐4 as follows: 0% (0); 1%‐25% (1); 26%‐50% (2); 51%‐75% (3); and 76%‐100% (4). Staining intensity was scored on a scale of 0‐3 as follows: negative (no staining, 0), weak (1), medium (2) or strong (3). The summation of the staining‐extent and staining‐intensity scores was regarded as the final score for EHF (on a scale of 0‐7). A final staining score of ≥3 was considered to indicate high level of EHF.
2.7. Construction of cell lines with stably downregulated EHF
Four siRNA sequences specifically targeting EHF and a control siRNA (Data S2) were designed and synthesized (GenePharma, Shanghai, China). The most effective siRNA sequence (5′‐GCCGAGCUAUGAGAUAUUATT‐3′) in achieving knockdown of EHF was selected to be constructed into a lentivirus vector by GenePharma (China). HCT116 and LoVo cells were infected with the lentivirus plus 5 μg/mL Polybrene (Sigma Aldrich, St. Louis, MO, USA). Stable cell lines of knockdown EHF expression were selected by fluorescence‐activated cell sorting (FACS) analysis for GFP expression. GFP‐positive cells were sorted into RPMI 1640 medium supplemented with 10% FBS and plated out.
2.8. Construction of cell lines with upregulated EHF
The full‐length open reading frame (ORF) of EHF was amplified and cloned into the pcDNA4.0 vector. CRC cell lines HT29 and SW480 were transfected with pcDNA4.0‐EHF or the empty pcDNA4.0 vector (Control). Transfection was conducted using Lipofectamine 2000 (Thermo Fisher Scientific) according to the manufacturer's instructions. G418 (600 µg/mL for HT29 and 500 µg/mL for SW480) was used to select stable EHF‐overexpressing cells and EHF expression levels were determined by RT‐PCR and western blotting analysis.
2.9. Cell proliferation, cell cycle, cell apoptosis, colony formation, wound‐healing, and Transwell invasion assays in vitro
Cell proliferation, flow cytometry cell cycle, cell apoptosis, colony formation, wound‐healing, and invasion assays were performed in vitro according to standard protocols, as described previously. 19 Details are described in Supporting Information (Data S3). All experiments were performed in triplicate.
2.10. In vivo functional assays in nude mouse models
Male, 4‐ to 6‐wk‐old BALB/c‐nu/nu nude mice were obtained from the Laboratory Animal Center of Southern Medical University and housed in a specific pathogen‐free (SPF) environment. For in vivo tumorigenicity, the mice were divided randomly into 2 groups (10 mice per group). In total, 1 × 10⁷ EHF‐depleted LoVo cells or control cells were injected subcutaneously into the right and left flanks of the mice, respectively. Tumor size was measured every 3 d using calipers. Tumor volume was calculated according to the formula: (D × d2)/2 (D being the longest diameter and d being the shortest diameter). After 30 d of monitoring, mice were sacrificed by cervical dislocation and tumors were dissected.
For developing an in vivo metastatic model, mice were injected intrasplenically with 5 × 10⁶ cells. After 4 wk of monitoring, the mice were sacrificed by cervical dislocation. Spleens and livers were removed by dissection away from adjacent organs, and fixed using 10% neutral‐buffered formalin. Subsequently, consecutive tissue sections were obtained and stained with hematoxylin‐eosin (H&E) to observe the metastatic nodules of the livers under the microscope. This investigation was carried out in strict accordance with ethical standards in the Guide for the Care and Use of Laboratory Animals of the National Institutes of Health. The protocol was approved by the Committee on the Ethics of Animal Experiments of Southern Medical University.
2.11. Electrophoretic mobility shift assay (EMSA)
One oligonucleotide sequence containing the putative EHF binding site from the TGF‐β1 promoter was labeled with biotin. EMSA was performed to examine whether EHF protein directly interacted with the TGF‐β1 promoter. EMSA was carried out using an EMSA/Gel‐shift kit (Beyotime, Shanghai, China) following the manufacturer's protocol. The binding reaction mixtures containing 5 μg protein from LoVo cell lysates, 100 fmol of biotin‐labeled oligonucleotide probes, 2.5% glycerol, 5 mmol/L MgCl2, 50 ng/μL poly (dl‐dc) and 1% NP‐40 were incubated in binding buffer at room temperature for 20 min. Unlabeled wild‐type or mutant oligonucleotides (10 pmol) were incubated with cell lysates at room temperature for 15 min prior to the addition of biotin‐labeled probes. The mixtures containing loading buffer were separated on a 6% nondenaturing polyacrylamide gel in 0.5× TBE buffer at 100 V, and oligonucleotides were transferred electrophoretically onto a nylon membrane (GE Healthcare, USA). The membrane was detected using the LightShift Chemiluminescent EMSA Kit (Beyotime). Unlabeled wild‐type and mutant probes were used for competition experiments. For each probe, complementary strands were synthesized and equimolar concentrations of complementary strands were annealed for use in EMSA. All probe sequences are listed in Supporting Information (Data S4).
2.12. Dual‐luciferase reporter assay
Wild‐type and the mutated promoter segment sequences of the TGF‐β1 gene were amplified from genomic DNA of LoVo cells, and inserted into a pre‐digested pGL3‐basic vector (Promega, WI, USA). HEK‐293T cells were cotransfected with pcDNA4.0‐EHF and pGL3‐TGF‐β1‐wt or pGL3‐TGF‐β1‐mut in six‐well plates. The pRL‐TK plasmid containing Renilla luciferase was used to normalize transfection efficiency. At 36 h after cotransfection, luciferase activity was measured on an EnSpire Multimode Plate Reader (PerkinElmer, Waltham, MA, USA) using the Dual‐Luciferase Reporter Assay System (Beyotime) and according to the manufacturer's instructions. The primers for plasmid constructs are listed in Supporting Information (Data S5). Experiments were performed in at least triplicate.
2.13. Chromatin immunoprecipitation assay
Chromatin immunoprecipitation (ChIP) assays were performed using the Magna ChIP™ A/G Kit (Merck Millipore, Darmstadt, Germany). LoVo cells (1 × 10⁷ cells) were cross‐linked with formaldehyde (final concentration 1%) for 10 min at 37°C, and the cross‐linking reaction was stopped by addition of glycine. After cell lysis, DNA was fragmented by sonication. Next, 10% of chromatin from each lysate was saved as an input control. The remaining chromatin was immunoprecipitated using rabbit polyclonal anti‐EHF antibody (Thermo Fisher Scientific). The same amount of nonspecific IgG was used as a control. The immunoprecipitated protein‐DNA complex was then captured with magnetic protein A/G beads. Immunoprecipitated DNA was purified and quantified by RT‐PCR with special primers. Agarose gel electrophoresis experiments were performed based on the PCR results. Primer sequences are listed in Supporting Information (Data S6).
2.14. Statistical analysis
All the statistical analyses were performed using SPSS version 20.0 software (SPSS, Chicago, Illinois, USA). Differences between groups were identified using two‐tailed Student t test. Associations between EHF expression and clinicopathological characteristics were determined using the χ 2 test. Survival curves were plotted using the Kaplan‐Meier method and compared by log‐rank test. A probability value of .05 or less was considered to be significant.
3. RESULTS
3.1. EHF expression is upregulated in CRC and is positively associated with poor prognosis in patients with CRC
Endogenous mRNA and protein levels of EHF were examined by real‐time PCR and western blotting in a panel of CRC cell lines, an immortalized colon mucosa epithelial cell line (FHC), and paired CRC and adjacent noncancerous mucosa tissues. As shown in Figure 1A, compared with FHC cells, EHF expression was significantly upregulated in 8 out of 9 CRC cell lines, with the exception of HT29 (P < .0001). Western blotting also showed that EHF protein levels were elevated in most CRC cell lines (P < .0001; Figure 1B). Consistent with the cell line data, an increase in EHF mRNA (P = .0065, Figure 1C) and protein expression (P < .0001, Figure 1D) was observed in CRC tissue samples compared with paired noncancerous mucosa tissues. In addition, by analyzing TCGA and the Genotype‐Tissue Expression (GTEx) databases, we also found that EHF was more highly expressed in transcript levels in colon and rectum adenocarcinoma than in normal mucosa according to a Gene Expression Profiling Interactive Analysis website (GEPIA) (gepia.cancer‐pku.cn/) (Figure 1E).
Figure 1.
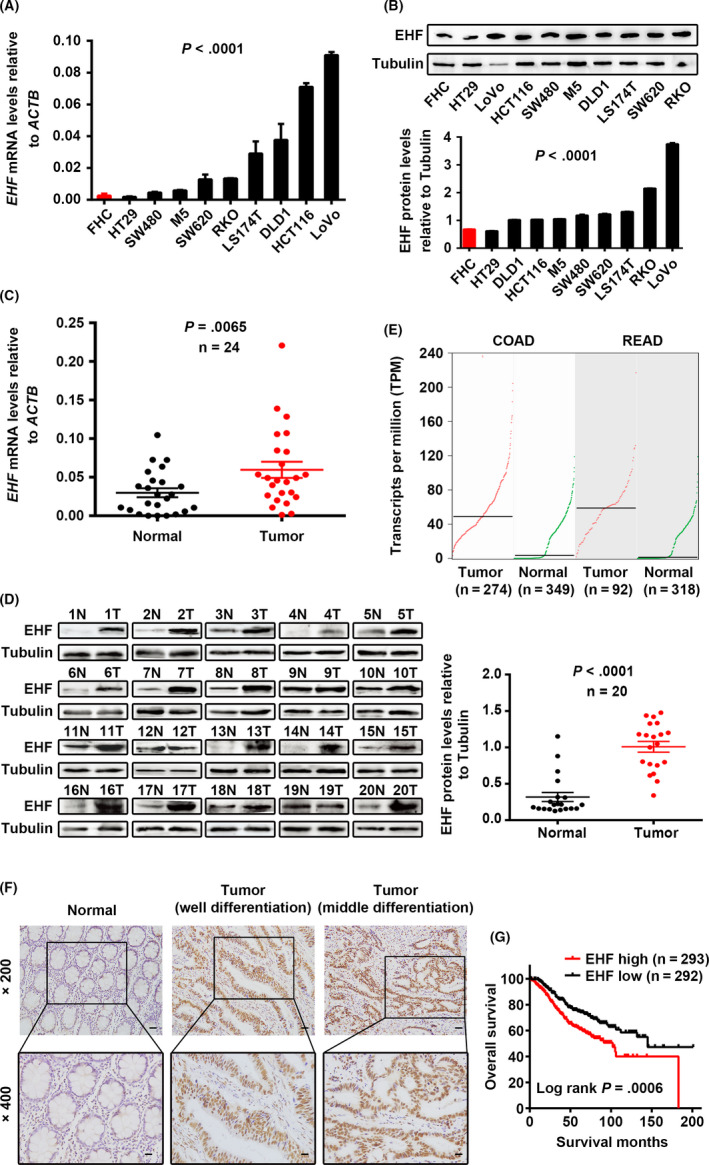
ETS homologous factor is upregulated in CRC and positively associated with poor prognosis in CRC patients. A, B, Expression levels of EHF mRNA (A) and protein (B) in CRC and colon mucosa epithelial (FHC) cell lines. C, D, Expression levels of EHF mRNA (C) and protein (D) in paired CRC and adjacent noncancerous tissues. E, Analysis of EHF expression in colon and rectum adenocarcinoma compared with in normal mucosa according to TCGA and GTEx databases. F, Expression analysis of EHF protein in CRC and normal colorectal mucosa tissues by IHC. Scale bars, 50 μm (×200 magnification) or 20 μm (×400 magnification). G, Correlation between EHF expression and overall survival in CRC patients. The median value of EHF expression was chosen as the point for separating tumors into low‐level and high‐level expression groups (log‐rank P = .0006)
We also assessed EHF protein in CRC tissues by IHC. We observed that EHF was highly expressed in 98.14% (53 of 54) of CRC samples, and in only 14.8% (9 of 61) of normal mucosa tissues. The levels of EHF were significantly upregulated in CRC tissues (P < .001, Figure 1F). High levels of EHF expression were associated with poorer tumor differentiation (P = .026) and advanced T stage (P = .020) (Table 1). In addition, we also analyzed the prognostic significance of EHF expression in published CRC data sets (GSE39582). As shown in Figure 1G, it was revealed that high expression of EHF was significantly correlated with poor survival in patients with CRC (log‐rank P = .0006). Taken together, these findings suggest that high EHF expression is upregulated in CRC and is a poor prognostic biomarker for patients with CRC, which indicates that EHF might behave as an oncogene in CRC.
Table 1.
Correlation between the clinicopathological features and EHF expression
| Characteristics | n | Cancer expression | ||
|---|---|---|---|---|
| Low (%) | High (%) | P value | ||
| Gender | ||||
| Male | 28 | 14 (50.0) | 14 (50.0) | .151 |
| Female | 26 | 8 (30.8) | 18 (69.2) | |
| Age (y) | ||||
| <57 | 18 | 10 (55.6) | 8 (44.4) | .117 |
| ≥57 | 36 | 12 (33.3) | 24 (66.7) | |
| Tumor site | ||||
| Proximal colon | 16 | 5 (31.3) | 11 (68.7) | .271 |
| Distal colon | 12 | 4 (25.0) | 8 (75.0) | |
| Rectum | 26 | 14 (53.8) | 12 (46.2) | |
| Tumor size (cm in diameter) | ||||
| <5 | 39 | 14 (35.9) | 25 (64.1) | .243 |
| ≥5 | 15 | 8 (53.3) | 7 (46.7) | |
| Tumor differentiation | ||||
| Good | 11 | 8 (72.7) | 3 (27.3) | .026 |
| Moderate | 18 | 4 (22.2) | 14 (77.8) | |
| Poor | 25 | 12 (48.0) | 13 (52.0) | |
| T stage | ||||
| T1‐T2 | 12 | 9 (75.0) | 3 (25.0) | .020 |
| T3 | 40 | 12 (30.0) | 28 (70.0) | |
| T4 | 2 | 1 (50.0) | 1 (50.0) | |
| N stage | ||||
| N0 | 32 | 12 (37.5) | 20 (62.5) | .814 |
| N1 | 16 | 7 (43.8) | 9 (56.2) | |
| N2 | 6 | 3 (50.0) | 3 (50.0) | |
| M stage | ||||
| M0 | 53 | 21 (39.6) | 32 (60.4) | .223 |
| M1 | 1 | 1 (100.0) | 0 (0) | |
3.2. Knockdown of EHF represses CRC cell proliferation and migration in vitro
To determine whether EHF overexpression plays a critical role in CRC carcinogenesis, we first downregulated EHF expression by transfecting lentivirus with EHF‐targeted shRNA into CRC cells. LoVo and HCT116 cells, which have the highest endogenous mRNA expression and relatively high protein levels, were used to establish 2 stable EHF‐knockdown cell lines. Expression of EHF after lentivirus infection was detected in 2 cell lines by real‐time PCR and western blotting. As shown in Figure 2A,B, the relative level of EHF in CRC cells was decreased significantly compared with that in control cell lines. Depletion of EHF resulted in a significant decrease in the proliferation of both cell lines in vitro (LoVo, P < .001 and HCT116, P = .0267, Figure 2C). Similarly, EHF downregulation clearly suppressed colony formation in LoVo (P = .002) and HCT116 cells (P = .004, Figure 2D). Moreover, we assessed the cell cycle and apoptosis ratio in CRC cells with EHF knockdown and control cells by flow cytometry. The results showed that knockdown of EHF resulted in an increased percentage in incidences of early apoptosis (LoVo, P = .0196 and HCT116, P = .0138, Figure 2E) and cell cycle arrest in G1 phase (LoVo, P = .002 and HCT116, P = .004, Figure 2F) in both CRC cell lines compared with controls.
Figure 2.
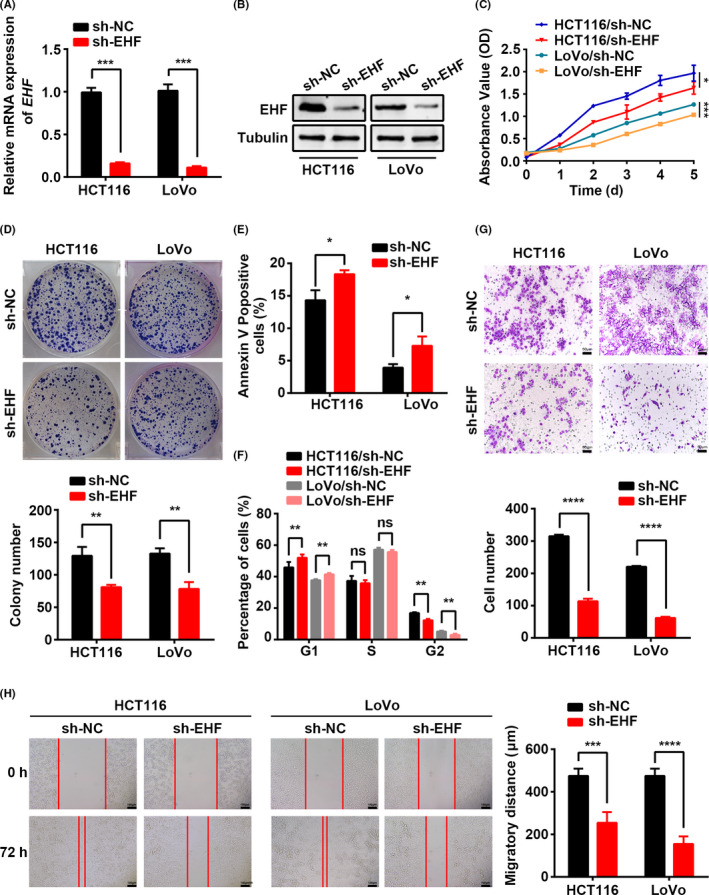
EHF depletion mediated by shRNA suppresses CRC cell proliferation, migration, and invasion in vitro. A, B, Decreased expression of EHF after infection of lentivirus vector harboring shRNA‐EHF was confirmed in 2 CRC cell lines by real‐time RT‐PCR (A) and western blotting (B). C, D, Effects of EHF depletion on CRC cell proliferation by CCK‐8 (C) and colony formation assays (D). E, F, The effects of EHF depletion on cell apoptosis (E) and cell cycle progression (F) by flow cytometry. G, Transwell assays were used to determine the effects of EHF depletion on the invasion ability of CRC cells. Representative images (upper) and quantitative analyses (lower) H, The effects of EHF depletion on the migration potencies of CRC cells by using wound‐healing assay. Representative images (left) and quantitative analyses (right) are shown. Data are expressed as the means ± SD in 3 independent experiments. *P < .05, **P < .01, ***P < .001, and ****P < .0001
In addition to proliferation, one of the hallmarks of cancer is the acquisition of migratory and invasion capacity, leading to metastasis. Furthermore, we also observed the effects of EHF on the migration capacity of CRC cells using a Transwell assay and a wound‐healing assay. As shown in Figure 2G, downregulation of EHF expression induced a decrease in cell invasiveness of 72.6% (P < .0001) in LoVo cells and 65.0% (P < .0001) in HCT116 cells. The wound‐healing assay also illustrated that EHF knockdown suppressed the cell migration capacity (LoVo, P < .0001 and HCT116, P = .0003, Figure 2H). These results indicated that EHF downregulation was sufficient to repress both cell proliferation and migration in vitro.
3.3. Knockdown of EHF inhibits CRC tumorigenesis and metastasis in mice in vivo
To confirm our in vitro findings, we also assessed the effects of EHF knockdown on the growth of xenograft tumors in nude mice. LoVo cells with EHF depletion and control cells were implanted in nude mice, and the growth of tumors was measured for 30 d. As shown in Figure 3A‐C, tumor volumes and growth rates were decreased significantly in mice injected with cells with EHF knockdown compared with those injected with control cells (P < .0001).
Figure 3.

EHF depletion suppresses CRC cell proliferation and metastasis in vivo. A, EHF downregulation inhibited subcutaneous tumor formation in nude mice. LoVo cells with EHF depletion and control cells were inoculated into nude mice (n = 10 per group). The graphs show the tumor xenografts 30 d after ectopic‐subcutaneous implantation in nude mice with EHF depletion and control cells. B, The gross of xenografts. C, The effect of EHF depletion on CRC tumor growth was evaluated based on tumor volume in the 2 groups. D, Tumor cells were transplanted by intrasplenic injection to evaluate liver metastasis potential. The representative photographs of gross and H&E staining are shown
Next, we performed intrasplenic injection to establish a liver metastasis model in nude mice. At 4 wk after injection, the mice were sacrificed and the livers and spleens were subjected to histological analysis. The results showed that EHF knockdown could dramatically decrease liver metastasis of CRC cells. EHF downregulation of LoVo cells only caused tumor increases without any metastasis, whereas 3 out of 6 control mice exhibited liver metastasis (P = .046, Figure 3D). Consistent with the in vitro results, the in vivo data also indicated an important promoting role for EHF in CRC growth and metastasis.
3.4. Overexpression of EHF enhances CRC growth and migration in vitro
To further confirm the effects of EHF on the biological behavior of CRC cells, we also established gain‐of‐function models by transfecting the pcDNA4.0‐EHF plasmid into HT29 and SW480 cells to establish 2 CRC cells stably overexpressing EHF. Real‐time RT‐PCR and western blot analysis revealed that EHF was significantly upregulated in both HT29 and SW480 cells compared with the control group (Figure 4A,B). As shown in Figure 4C, overexpression of EHF caused a significant increase in cell proliferation in both HT29 (P = .0009) and SW480 cells (P < .0001). Similarly, compared with that in the control cells, the capacity to form colonies was increased in the cells overexpressing EHF (HT29, P = .0049 and SW480, P = .0001; Figure 4D). Moreover, the proportion of cells in early‐stage apoptosis was lower in EHF‐overexpressing cells than in control cells (HT29, P < .0001 and SW480; P = .0002; Figure 4E). We also observed that EHF overexpression increased the capacity of migration and invasion in both cell lines, as detected by the Transwell invasion assay (HT29, P = .0009 and SW480, P = .0003; Figure 4F) and wound‐healing assay (HT29, P = .0014 and SW480, P < .0001; Figure 4G).
Figure 4.

EHF overexpression promotes cell proliferation, migration, and invasion of CRC cells in vitro. A, B, Increased expression of EHF after transfection of the pcDNA4.0‐EHF vector was confirmed in 2 CRC cell lines by real‐time RT‐PCR (A) and western blotting (B). C, EHF overexpression promoted cell proliferation in HT29 and SW480 cells. D, EHF overexpression increased the capacity to form colonies in HT29 and SW480 cells. E, EHF overexpression repressed the apoptosis ratio relative to control cells. F, G, Matrigel invasion chamber and wound‐healing assays showed that EHF overexpression induced cell invasiveness (F) and migration (G) in both SW480 and HT29 cells. Representative images (left) and quantitative analyses (right) are shown. Data are presented as the mean ± SD. The results were reproducible in 3 independent experiments. * P < .05, ** P < .01, *** P < .001, and ****P < .0001
3.5. EHF promotes TGF‐β1 transcription and activates canonical TGF‐β pathway signaling
GSEA and GO enrichment analysis were used to analyze EHF‐regulated gene signatures. The results showed that higher expression of EHF was positively correlated with an enrichment of TGF‐β signaling pathway gene signatures (GSE21510, Figure 5A‐C). Interestingly, a positive correlation between EHF and TGF‐β1 was also found in the TCGA cohort (Figure 5D; n = 695, R = 0.1859, P < .0001), suggesting that EHF could exert its biological effects by TGF‐β signaling. To further validate this hypothesis, we detected the expression levels of TGF‐β1 in EHF‐overexpressing and EHF‐knockdown CRC cells. Indeed, overexpression of EHF could significantly induce TGF‐β1 expression, while knockdown of EHF reduced the levels of TGF‐β1 expression (Figure 5E; P = .0009 and P = .0004). These results indicated that EHF can regulate TGF‐β1 expression at the transcription level.
Figure 5.

EHF activates TGF‐β1 transcription. A, The different expressed genes (DEGs) in the GSE21510 microarray dataset (n = 104) analyzed by Qlucore Omics Explorer software. B, DEGs were involved in different pathways and biological processes, as indicated by GO enrichment analysis. C, GSEA showed the enrichment of TGF‐β pathway in CRC cells with EHF upregulation. D, Expression correlation analysis between EHF (x) and TGF‐β1 (y) in 695 CRC tissues (R = 0.1859, P < .0001). E, Expression levels of TGF‐β1 in SW480 cells after EHF overexpression and in LoVo cells after knockdown of EHF. F, Schematic depiction of the TGF‐β1 promoter with 2 putative EHF binding sites (EBS). G, ChIP analysis of EHF occupancy on the TGF‐β1 promoter. H, EMSA assay showed that EHF protein directly interacts with the sequence of the first EBS in TGF‐β1 promoter. I, Dual‐luciferase assays showed that EHF activated TGF‐β1 transcription in 293T cells. The results were reproducible in 3 independent experiments. *P < .05, **P < .01, ***P < .001, and ***P < .0001
To further explore the regulatory mechanism underlying TGF‐β1 activated by EHF, we searched the TGF‐β1 promoter sequence using the JASPAR online database and found that there was one putative promoter from −1451 to +190 bp at the 5′‐flanking of the TGF‐β1 gene and 2 putative EBS embedded in the TGF‐β1 promoter (Figure 5F). ChIP assay also revealed that endogenous EHF was bound to the first EBS (−1077 to −1066 bp) of the TGF‐β1 promoter (Figure 5G), and but not to the second EBS (Supporting Information Figure S1). To further confirm the interaction of EHF with the first EBS in the TGF‐β1 promoter, EMSA was performed with oligonucleotide probes, which contained the first EBS from the TGF‐β1 promoter. The unlabeled probes and unlabeled mutation probes with mutated sequences of the EHF binding site were also prepared for competition experiments. As shown in Figure 5H, the gel mobility shift was changed when labeled wild‐type probes were incubated with nuclear proteins from LoVo cells (Figure 5H, lanes 2). The unlabeled specific competitor probes (WT) completely competed with EBS for EHF binding, whereas those unlabeled competitor probes with mutations in EBS failed to compete against EBS for EHF binding. In addition, a dual‐luciferase report showed that EHF activated TGF‐β1 transcription in 293T cells (Figure 5I), but had no effect on the mutated promoter sequence. Taken together, these results suggested that EHF, as a transcription activator, is involved in the regulation of TGF‐β1 gene expression.
In canonical TGF‐β signaling activated TGFβR1 phosphorylates SMAD2/3, which then forms a heterotrimeric complex with SMAD4, moves to the nucleus, and activates gene expression. 20 We found that EHF depletion decreased the levels of phosphorylated SMAD2 (p‐SMAD2) and p‐SMAD3 in vitro, but had little effect on the total protein levels of SMAD2 and SMAD3. As expected, EHF depletion in LoVo cells resulted in a statistically significant decrease of SMAD4 protein in the nuclei but an accumulation in the cytoplasm (Figure 6A). In addition, we also determined the level of several downstream genes of TGF‐β signaling in EHF‐depleted CRC cells in the presence or absence of TGF‐β1. As expected, significant downregulation of both SMAD7 and TMEPAI expression was observed in EHF‐knockdown LoVo cells compared with control cells. However, these changes were completely attenuated by TGF‐β1 (10 ng/mL, 48 h; Figure S2), suggesting that EHF promoted CRC progression by activating the canonical TGF‐β signaling pathway, which depends on EHF‐mediated TGF‐β1 transcription activation. To assess the contribution of the TGF‐β signaling pathway to the important role of EHF, we inactivated TGF‐β signaling in EHF‐overexpressing CRC cells with an inhibitor of TGFβR1 (SB525334). Upregulation of EHF significantly promoted cell proliferation, migration, and invasion in SW480 cells. Similar results were observed in the presence of TGF‐β1. However, the effects mediated by EHF overexpression or TGF‐β1 were completely abolished to the levels similar to the control cells when cells were treated with SB525334 (1 µmol/L, 48 h). These results suggest that activation of TGF‐β signaling is required for EHF‐mediated CRC behaviors (Figure 6B‐E). Interestingly, we also found that TGF‐β1 could significantly induce EHF expression, while the inhibitor SB525334 reduced EHF mRNA levels to some extent (Figure 6F), which indicated a positive feedback loop between EHF and TGF‐β1 in CRC cells.
Figure 6.

EHF activates the activity of canonical TGF‐β signaling. A, Western blotting was performed to detect SMAD3, p‐SMAD3, SMAD2, p‐SMAD2, nuclear SMAD4, and cytoplasmic SMAD4 in EHF‐depleted and control CRC cells. B‐E, EHF overexpression and TGF‐β1 (10 ng/mL, 48 h) significantly promoted CRC cell proliferation (B), colony formation (C), migration (D) and invasion (E). The potential effects of EHF on CRC cells were completely abolished similar to the control cells by TGF‐β inhibitor (SE525334, 1 μm, 48 h, B‐E). F, TGF‐β1 induced EHF expression (upper) and TGF‐β inhibitor repressed EHF expression (lower). G, Schematic diagram showing the mechanism of action of EHF in CRC
4. DISCUSSION
The key findings of the present study show that EHF is dramatically upregulated in CRC cells and tissues and positively correlated with advanced clinicopathological features, including poor tumor differentiation, advanced T stage, and poor prognosis in patients with CRC. Moreover, the promoting effects of EHF on cell proliferation, invasion, and metastasis were confirmed by gain‐of‐function and loss‐of‐function experiments in vitro and in vivo. Interestingly, we also found that EHF, as a transcription activator, promoted TGF‐β1 transcription, thereby activating canonical TGF‐β signaling. Therefore, our study provides strong evidence supporting the oncogenic roles of EHF in CRC.
The ETS TF family is one of the largest TF families, and can be grouped structurally into 11 subfamilies, including ESE. 21 , 22 , 23 EHF is a new member of the ESE TF family and is exclusively expressed in a subset of epithelial cells, such as ESE‐1 and ESE‐2. 24 Previous studies have reported that dysregulation of EHF may regulate the normal process of epithelial cell differentiation and contribute to cell transformation. 10 , 24 , 25 However, the function of EHF in tumor development is seemingly controversial in the literature. On the one hand, EHF is consistently downregulated in prostate cancer and is correlated with good prognosis of patients with prostate cancer. 10 , 11 EHF controls prostate epithelial cell differentiation and stem‐like potential, and the loss of EHF induces EMT and stem‐like features. 10 EHF is also downregulated in pancreatic ductal adenocarcinoma (PDAC), and the downregulation of EHF expression promotes PDAC cell motility and invasiveness. 26 On the other hand, EHF maintains oncogenic roles by activating HER family signaling in gastric 12 and thyroid cancer. 13 In ovarian cancer, EHF overexpression promotes cell growth by regulating the G1‐S phase checkpoint. 14 Indeed, we found elevated expression of EHF in CRC cell lines and tissue samples, and also found that the high EHF expression levels were significantly associated with advanced characteristics and poor survival of CRC patients. These findings support the hypothesis that EHF might be a potential oncogene in CRC.
Previous studies have shown the anti‐apoptotic role of EHF in gastric, 12 thyroid 13 and ovarian cancer. 14 Cheng et al reported that EHF may exert its anti‐apoptotic functions via the Akt signaling pathway. 14 Proapoptotic factors, including Bad and caspase 9, can be phosphorylated and inactivated by Akt. 27 , 28 In the present study, we found that EHF activated TGF‐β1 transcription, thereby activating canonical TGF‐β signaling. Indeed, several other pathways, including MAPK and PI3K/Akt, are susceptible to modulation by TGF‐β. 29 , 30 TGF‐β phosphorylates Akt in a PI3K‐dependent manner. 31 Therefore, in CRC, EHF may play an anti‐apoptotic role via TGF‐β‐mediated Akt phosphorylation. Moreover, EHF, as a transcription activator, might directly/indirectly regulate the expression of a number of genes contributing to apoptosis. Further characterization of these genes will provide new insights into EHF‐mediated antiapoptosis. Moreover, using gain‐of‐function and loss‐of‐function assays, we clearly demonstrated that EHF overexpression not only promotes cell growth and migration in CRC cells in vitro, but also promotes tumor growth and metastasis in mouse models in vivo. To be best of our knowledge, we determined for the first time that EHF promotes CRC growth and progression. Most importantly, we demonstrated that EHF knockdown exerted inhibitory effects on cell proliferation and metastasis. These data suggest that EHF is a potential therapeutic target for CRC.
One previous study found that EHF could modulate the expression of the HER2 gene in gastric cancer 12 and breast cancer. 32 However, as a transcription factor, the downstream targets of EHF in cancer remain largely unknown, especially in CRC. Interestingly, we discovered that the EHF overexpression was correlated with activation of the TGF‐β signaling pathway. The TGF‐β family comprises 3 highly homologous isoforms TGF‐β1, TGF‐β2 and TGF‐β3. We searched the promoter sequences of TGF‐β1 gene and found putative EBS in the TGF‐β1 promoter. Markedly, EHF abundance through ectopic overexpression of siRNA‐mediated knockdown specifically affects TGF‐β1 mRNA expression. Consistently, we also found a positive correlation between expression of EHF and TGF‐β1 in a CRC cohort from the TCGA database. ChIP, EMSA and luciferase reporter gene assays also demonstrated that EHF could occupy the promoter region of the TGF‐β1 gene and activate TGF‐β1 transcription. These data suggest that TGF‐β1 may be a direct target of EHF.
The TGF‐β superfamily signaling pathways have crucial roles in both the development and progression of tumors, 33 including CRC. 34 At advanced stages of cancer, the TGF‐β pathway promotes tumor progression and metastasis by promoting cancer cell motility, invasion, EMT, and cell stemness. 35 The pleiotropy of TGF‐β‐induced effects can be explained in part by the intricate signaling mechanism involved. TGFβR1 and TGFβR2 each exist in a homodimeric form on the cell surface and have relatively low affinities for each other in the absence of ligand. Once TGF‐β is bound by TGFβR2, TGFβR1 is recruited into the oligomeric complex and transphosphorylated, thereby enabling it to initiate signaling in a number of different cascades. 36 The TGFβR2 gene contains a 10‐base pair polyadenine repeat, which is exposed to replication errors leading to gene inactivation. Most CRC cells with high levels of microsatellite instability (MSI‐H) accumulate mutations at a microsatellite sequence in the gene encoding TGFβR2. 37 TGF‐β signaling is therefore believed to be defective in CRC. Although CRC cells have TGFβR2 mutations, some studies have reported that MSI‐H CRC cells remain sensitive to TGF‐β. 29 , 38 , 39 Previous studies found that MSI CRC cells with truncating TGFβR2 mutations, including the LoVo cell line, remain sensitive to endogenous TGF‐β. 29 The results from de Miranda et al showed that SMAD2 phosphorylation was detected in MSI‐H CRC tissues, indicating that the presence of mutations in TGFβR2 was not relate to the SMAD2 activation status. 38 Furthermore, they found that some TGFβR2‐mutated CRC cell lines, including HCT116, remain sensitive to TGF‐β stimulation despite the presence of frameshift mutations in the TGFβR2 gene because the mutated gene still expresses a functional protein. Indeed, in the present study, we also found that TGF‐β1 still induced SMAD2 phosphorylation to some extent, in LoVo and HCT116 cells with MSI‐H, similar to that observed in SW480 and HT29 cell lines with microsatellite stabilization (Figure S3). Therefore, TGF‐β induces SMAD2 phosphorylation even in the presence of TGFβR2‐inactivating mutations.
In canonical TGF‐β signaling, activated TGFβR1 phosphorylates SMAD2/3, which then forms a heterotrimeric complex with SMAD4, moves to the nucleus and activates the expression of target genes, thus facilitating cancer cell migration and invasion. 20 Our study revealed that EHF depletion inactivated canonical TGF‐β signaling by decreasing the levels of phosphorylated SMAD2/3 and the nuclear translocation of SMAD4. Most importantly, the promoting effects exerted by EHF on cell growth and invasion were abolished by a TGF‐β inhibitor. These results further indicated that EHF overexpression promotes the progression of CRC by inducing TGF‐β1 transcription and, in turn, activating TGF‐β signaling activity, which explains the mechanism by which EHF promotes CRC progression (Figure 6G). Interestingly, TGF‐β1 could increase, but TGF‐β inhibitor could repress, the expression of EHF. These data suggest the probable existence of a positive feedback loop between EHF and TGF‐β1 in CRC cells.
In summary, this study demonstrates that EHF is frequently overexpressed in CRC and plays an accelerator role in CRC progression by activating the TGF‐β signaling pathway by targeting TGF‐β1, as a transcription activator. Altogether, EHF may therefore be a useful therapeutic target in CRC, as suppressing its expression has the potential to inhibit the activation of TGF‐β signaling.
CONFLICTS OF INTEREST
The authors have no conflicts of interest.
Supporting information
Figures S1‐S3
Data S1‐S6
ACKNOWLEDGMENT
The National Natural Science Foundation of China (81972754 and 81472318) and the Natural Science Foundation of Guangdong Province (2019A1515012226) supported this work.
Wang L, Ai M, Nie M, et al. EHF promotes colorectal carcinoma progression by activating TGF‐β1 transcription and canonical TGF‐β signaling. Cancer Sci. 2020;111:2310–2324. 10.1111/cas.14444
*Wang and Ai contributed equally to this work.
REFERENCES
- 1. Bray F, Ferlay J, Soerjomataram I, Siegel RL, Torre LA, Jemal A. Global cancer statistics 2018: GLOBOCAN estimates of incidence and mortality worldwide for 36 cancers in 185 countries. CA Cancer J Clin. 2018;68(6):394‐424. [DOI] [PubMed] [Google Scholar]
- 2. Dienstmann R, Vermeulen L, Guinney J, Kopetz S, Tejpar S, Tabernero J. Consensus molecular subtypes and the evolution of precision medicine in colorectal cancer. Nat Rev Cancer. 2017;17:79‐92. [DOI] [PubMed] [Google Scholar]
- 3. Massague J, Obenauf AC. Metastatic colonization by circulating tumour cells. Nature. 2016;529:298‐306. [DOI] [PMC free article] [PubMed] [Google Scholar]
- 4. Sizemore GM, Pitarresi JR, Balakrishnan S, Ostrowski MC. The ETS family of oncogenic transcription factors in solid tumours. Nat Rev Cancer. 2017;17:337‐351. [DOI] [PubMed] [Google Scholar]
- 5. Luk IY, Reehorst CM, Mariadason JM. ELF3, ELF5, EHF and SPDEF transcription factors in tissue homeostasis and cancer. Molecules. 2018;23:2191. [DOI] [PMC free article] [PubMed] [Google Scholar]
- 6. Rubin AJ, Barajas BC, Furlan‐Magaril M, et al. Lineage‐specific dynamic and pre‐established enhancer‐promoter contacts cooperate in terminal differentiation. Nat Genet. 2017;49:1522‐1528. [DOI] [PMC free article] [PubMed] [Google Scholar]
- 7. Fossum SL, Mutolo MJ, Tugores A, et al. Ets homologous factor (EHF) has critical roles in epithelial dysfunction in airway disease. J biol Chem. 2017;292:10938‐10949. [DOI] [PMC free article] [PubMed] [Google Scholar]
- 8. Munoz J, Stange DE, Schepers AG, et al. The Lgr5 intestinal stem cell signature: robust expression of proposed quiescent '+4' cell markers. EMBO J. 2012;31:3079‐3091. [DOI] [PMC free article] [PubMed] [Google Scholar]
- 9. Cangemi R, Mensah A, Albertini V, et al. Reduced expression and tumor suppressor function of the ETS transcription factor ESE‐3 in prostate cancer. Oncogene. 2008;27:2877‐2885. [DOI] [PubMed] [Google Scholar]
- 10. Albino D, Longoni N, Curti L, et al. ESE3/EHF controls epithelial cell differentiation and its loss leads to prostate tumors with mesenchymal and stem‐like features. Cancer Res. 2012;72:2889‐2900. [DOI] [PubMed] [Google Scholar]
- 11. Albino D, Civenni G, Rossi S, Mitra A, Catapano CV, Carbone GM. The ETS factor ESE3/EHF represses IL‐6 preventing STAT3 activation and expansion of the prostate cancer stem‐like compartment. Oncotarget. 2016;7:76756‐76768. [DOI] [PMC free article] [PubMed] [Google Scholar]
- 12. Shi J, Qu Y, Li X, et al. Increased expression of EHF via gene amplification contributes to the activation of HER family signaling and associates with poor survival in gastric cancer. Cell Death Dis. 2016;7:e2442. [DOI] [PMC free article] [PubMed] [Google Scholar]
- 13. Lv Y, Sui F, Ma J, et al. Increased expression of EHF contributes to thyroid tumorigenesis through transcriptionally regulating HER2 and HER3. Oncotarget. 2016;7:57978‐57990. [DOI] [PMC free article] [PubMed] [Google Scholar]
- 14. Cheng Z, Guo J, Chen L, Luo N, Yang W, Qu X. Knockdown of EHF inhibited the proliferation, invasion and tumorigenesis of ovarian cancer cells. Mol Carcinog. 2016;55:1048‐1059. [DOI] [PubMed] [Google Scholar]
- 15. Taniue K, Oda T, Hayashi T, Okuno M, Akiyama T. A member of the ETS family, EHF, and the ATPase RUVBL1 inhibit p53‐mediated apoptosis. EMBO Rep. 2011;12:682‐689. [DOI] [PMC free article] [PubMed] [Google Scholar]
- 16. Wang S, Zhou J, Wang XY, et al. Down‐regulated expression of SATB2 is associated with metastasis and poor prognosis in colorectal cancer. J Pathol. 2009;219:114‐122. [DOI] [PubMed] [Google Scholar]
- 17. Yuan C, Wang L, Zhou L, Fu Z. The function of FOXO1 in the late phases of the cell cycle is suppressed by PLK1‐mediated phosphorylation. Cell Cycle. 2014;13:807‐819. [DOI] [PMC free article] [PubMed] [Google Scholar]
- 18. Yang MH, Zhao L, Wang L, et al. Nuclear lncRNA HOXD‐AS1 suppresses colorectal carcinoma growth and metastasis via inhibiting HOXD3‐induced integrin beta3 transcriptional activating and MAPK/AKT signalling. Mol Cancer. 2019;18:31. [DOI] [PMC free article] [PubMed] [Google Scholar]
- 19. Jiang H, Wang Y, Ai M, et al. Long noncoding RNA CRNDE stabilized by hnRNPUL2 accelerates cell proliferation and migration in colorectal carcinoma via activating Ras/MAPK signaling pathways. Cell Death Dis. 2017;8:e2862. [DOI] [PMC free article] [PubMed] [Google Scholar]
- 20. Moustakas A, Heldin CH. Mechanisms of TGFbeta‐induced epithelial‐mesenchymal transition. J Clin Med. 2016;5(7):63‐96. [DOI] [PMC free article] [PubMed] [Google Scholar]
- 21. Cooper CD, Newman JA, Gileadi O. Recent advances in the structural molecular biology of Ets transcription factors: interactions, interfaces and inhibition. Biochem Soc Trans. 2014;42:130‐138. [DOI] [PMC free article] [PubMed] [Google Scholar]
- 22. Hollenhorst PC, McIntosh LP, Graves BJ. Genomic and biochemical insights into the specificity of ETS transcription factors. Annu Rev Biochem. 2011;80:437‐471. [DOI] [PMC free article] [PubMed] [Google Scholar]
- 23. Kar A, Gutierrez‐Hartmann A. Molecular mechanisms of ETS transcription factor‐mediated tumorigenesis. Crit Rev Biochem Mol Biol. 2013;48:522‐543. [DOI] [PMC free article] [PubMed] [Google Scholar]
- 24. Kas K, Finger E, Grall F, et al. ESE‐3, a novel member of an epithelium‐specific ets transcription factor subfamily, demonstrates different target gene specificity from ESE‐1. J biol Chem. 2000;275:2986‐2998. [DOI] [PubMed] [Google Scholar]
- 25. Stephens DN, Klein RH, Salmans ML, Gordon W, Ho H, Andersen B. The Ets transcription factor EHF as a regulator of cornea epithelial cell identity. The Journal of biological chemistry. 2013;288:34304‐34324. [DOI] [PMC free article] [PubMed] [Google Scholar]
- 26. Zhao T, Jiang W, Wang X, et al. ESE3 Inhibits Pancreatic Cancer Metastasis by Upregulating E‐Cadherin. Cancer Res. 2017;77:874‐885. [DOI] [PMC free article] [PubMed] [Google Scholar]
- 27. Datta SR, Brunet A, Greenberg ME. Cellular survival: a play in three Akts. Genes Dev. 1999;13:2905‐2927. [DOI] [PubMed] [Google Scholar]
- 28. del Peso L, Gonzalez‐Garcia M, Page C, Herrera R, Nunez G. Interleukin‐3‐induced phosphorylation of BAD through the protein kinase Akt. Science. 1997;278:687‐689. [DOI] [PubMed] [Google Scholar]
- 29. Baker K, Raut P, Jass JR. Microsatellite unstable colorectal cancer cell lines with truncating TGFbetaRII mutations remain sensitive to endogenous TGFbeta. J Pathol. 2007;213:257‐265. [DOI] [PubMed] [Google Scholar]
- 30. Zhang YE. Non‐Smad pathways in TGF‐beta signaling. Cell Res. 2009;19:128‐139. [DOI] [PMC free article] [PubMed] [Google Scholar]
- 31. Bakin AV, Tomlinson AK, Bhowmick NA, Moses HL, Arteaga CL. Phosphatidylinositol 3‐kinase function is required for transforming growth factor beta‐mediated epithelial to mesenchymal transition and cell migration. J Biol Chem. 2000;275:36803‐36810. [DOI] [PubMed] [Google Scholar]
- 32. Scott GK, Daniel JC, Xiong X, Maki RA, Kabat D, Benz CC. Binding of an ETS‐related protein within the DNase I hypersensitive site of the HER2/neu promoter in human breast cancer cells. The Journal of biological chemistry. 1994;269:19848‐19858. [PubMed] [Google Scholar]
- 33. Tang X, Shi L, Xie N, et al. SIRT7 antagonizes TGF‐beta signaling and inhibits breast cancer metastasis. Nat Commun. 2017;8:318. [DOI] [PMC free article] [PubMed] [Google Scholar]
- 34. Neuzillet C, Tijeras‐Raballand A, Cohen R, et al. Targeting the TGFbeta pathway for cancer therapy. Pharmacol Ther. 2015;147:22‐31. [DOI] [PubMed] [Google Scholar]
- 35. Drabsch Y, ten Dijke P. TGF‐beta signalling and its role in cancer progression and metastasis. Cancer Metastasis Rev. 2012;31:553‐568. [DOI] [PubMed] [Google Scholar]
- 36. David CJ, Massague J. Contextual determinants of TGFbeta action in development, immunity and cancer. Nat Rev Mol Cell Biol. 2018;19:419‐435. [DOI] [PMC free article] [PubMed] [Google Scholar]
- 37. Markowitz S, Wang J, Myeroff L, et al. Inactivation of the type II TGF‐beta receptor in colon cancer cells with microsatellite instability. Science. 1995;268:1336‐1338. [DOI] [PubMed] [Google Scholar]
- 38. de Miranda NF, van Dinther M, van den Akker BE, van Wezel T, ten Dijke P, Morreau H. Transforming Growth Factor beta Signaling in Colorectal Cancer Cells With Microsatellite Instability Despite Biallelic Mutations in TGFBR2. Gastroenterology. 2015;148:1427‐1437 e8. [DOI] [PubMed] [Google Scholar]
- 39. Carethers JM, Pham TT. Mutations of transforming growth factor beta 1 type II receptor, BAX, and insulin‐like growth factor II receptor genes in microsatellite unstable cell lines. Vivo. 2000;14:13‐20. [PubMed] [Google Scholar]
Associated Data
This section collects any data citations, data availability statements, or supplementary materials included in this article.
Supplementary Materials
Figures S1‐S3
Data S1‐S6