Abstract
As the core element of material and energy metabolism pathways, the biological functions and prognostic significance of ATP metabolism in diffuse gliomas have so far remained unclear. Based on comprehensive analysis of ATP metabolism‐related gene expression profiles, we constructed an ATP metabolism‐related risk signature to determine the role of ATP metabolism. We found that this ATP metabolism‐related gene expression profile could divide patients into 2 robust groups with distinct clinical characteristics and prognosis. Patients in the high‐risk group tended to be predicted as malignant entities, indicating that the activation of ATP metabolism may promote the malignant progress of diffuse gliomas. Cox regression and Kaplan‐Meier analyses suggested that this risk signature was an independent predictor for prognosis. Furthermore, we constructed an individualized prognosis prediction model through nomogram and time‐dependent receiver operating characteristic (ROC) curve analyses. Functional analysis suggested that, in addition to material and energy metabolism, ATP metabolism also played an essential role in the regulation of the tumor immune microenvironment. In brief, the ATP metabolism‐related signature was tightly associated with regulation of the tumor immune microenvironment and could serve as an independent prognostic biomarker in diffuse gliomas.
Keywords: ATP metabolism, glioma, prognosis, risk score, signature, tumor immune environment
In this study, we constructed an ATP metabolism‐related signature to evaluate the ATP metabolic status and prognosis of glioma patients. To clarify the role of ATP metabolism in the tumor immune microenvironment, we further investigated the risk signature‐related immune responses and inflammatory activities.
1. INTRODUCTION
Gliomas are the most common and devastating type of primary tumors found in the central nervous system, 1 , 2 , 3 characterized by a diffuse and infiltrative nature, recurrent local growth, significant heterogeneity between individuals and adverse clinical outcomes. 4 , 5 , 6 Despite standard treatments involving surgical resection, radiotherapy and chemotherapy, both tumor recurrence and drug resistance are still inevitable. 7 , 8 Thus, there is an urgent need to further understanding the molecular mechanism behind tumorigenesis and find new therapies to improve the prognosis for these patients.
In recent years, increasing numbers of studies have shown that multiple material and energy metabolic pathways are involved in the manifestation and progression of human cancers. 9 , 10 , 11 ATP is a universal energy carrier for cells, the energy supply mechanism for the mutual transformation of ATP and ADP is a common feature of the biological world. ATP is the core element of biochemical systems. Multiple material and energy metabolic pathways, such as the tricarboxylic acid cycle, glycolysis, or oxidative phosphorylation (OXPHOS), are all associated with ATP metabolism. Cancer cells employ distinct metabolic pathways to produce more ATP for growth and survival. 12 , 13 Relevant studies have demonstrated that high concentrations of ATP could also cause drug resistance in tumor cells, while ATP depletion was necessary for drug‐induced autophagic cell death. 14 , 15 As an important secondary messenger, ATP plays an essential role in many cellular processes including cell proliferation, apoptosis, and differentiation. 16 , 17 In addition, extracellular ATP could shape the tumor microenvironment and regulate immune and inflammation responses to determine tumor fate. 18 , 19 , 20 , 21 Thus, a deeper understanding of ATP metabolism could make an important step toward the individualized treatment of gliomas.
In this study, we analyzed systemically the expression profile of ATP metabolism‐related genes listed in the Chinese Glioma Genome Atlas (CGGA) and The Cancer Genome Atlas (TCGA) datasets. The results suggested that patients could be divided into 2 subgroups based on different clinical and molecular pathological characteristics. An integrated ATP metabolism‐related risk signature was developed to predict the survival of glioma patients based on the CGGA dataset, and was validated in the TCGA dataset. By applying Kaplan‐Meier (K‐M) survival curves and Cox regression analyses, we found that the risk signature was an independent prognostic biomarker. Next, an individualized prediction model was constructed using time‐dependent receiver operating characteristic (ROC)‐time curves and nomogram plots to predict the 1‐, 3‐, and 5‐y overall survival rates for glioma patients. Bioinformatics analyses indicated that the risk signature was not only closely related to the material and energy metabolism of glioma, but also had a significant effect on regulation of the tumor immune microenvironment, especially the T‐cell‐mediated immune response.
2. MATERIALS AND METHODS
2.1. Datasets
In total, 310 glioma samples from the CGGA RNA‐sequencing (RNA‐seq) dataset were enrolled in our study as the discovery cohort. RNA‐seq data and follow‐up information for these samples were downloaded from the CGGA website (http://www.cgga.org.cn). Details regarding establishment and management of the CGGA dataset were introduced in our previous study 22 . Similarly, 631 glioma samples with RNA‐seq data and corresponding clinical information were obtained from TCGA database (http://cancergenome.nih.gov/) and used as the external validation. The clinical characteristics of patients from these 2 datasets are summarized in Tables 1 and 2. This study was approved by the Institutional Review Boards of Beijing Tiantan Hospital. 22
Table 1.
Characteristics of patients in cluster 1 and cluster 2 in the CGGA database
| Characteristic | N | Cluster 1 | Cluster 2 | P‐value |
|---|---|---|---|---|
| Total cases | 310 | 169 | 141 | |
| Gender | ||||
| Male | 195 | 111 | 84 | .2678 |
| Female | 115 | 58 | 57 | |
| Age (y) | ||||
| ≤40 | 133 | 51 | 82 | <.0001 |
| >40 | 177 | 118 | 59 | |
| Grade | ||||
| II | 105 | 16 | 89 | <.0001 |
| III | 67 | 34 | 33 | |
| IV | 138 | 119 | 19 | |
| Subtype | ||||
| Classical | 70 | 63 | 7 | <.0001 |
| Mesenchymal | 65 | 65 | 0 | |
| Proneural | 99 | 28 | 71 | |
| Neural | 76 | 13 | 63 | |
| IDH status | ||||
| Mutation | 160 | 37 | 123 | <.0001 |
| Wildtype | 150 | 132 | 18 | |
| MGMT promoter | ||||
| Methylation | 134 | 67 | 67 | .0009 |
| Unmethylation | 110 | 78 | 32 | |
| 1p19q | ||||
| Codel | 36 | 5 | 31 | <.0001 |
| Non‐codel | 218 | 126 | 92 | |
Table 2.
Univariate and multivariate analysis of OS in CGGA sequencing database
| Variables | Univariate analysis | Multivariate analysis | ||
|---|---|---|---|---|
| HR (95% CI) | P‐value | HR (95% CI) | P‐value | |
| Risk score | 4.804 (3.734‐6.181) | <.001 | 4.190 (2.576‐6.816) | <.001 |
| Age at diagnosis | 1.038 (1.023‐1.054) | <.001 | 0.995 (0.975‐1.016) | .660 |
| Gender | 1.181 (0.837‐1.666) | .345 | ‐ | ‐ |
| WHO grade | 3.477 (2.716‐4.452) | <.001 | 1.716 (1.141‐2.582) | .010 |
| TCGA subtype | 1.935 (1.641‐2.282) | <.001 | 0.831 (0.619‐1.115) | .217 |
| IDH mutation status | 0.228 (0.158‐0.329) | <.001 | 1.083 (0.522‐2.250) | .830 |
| MGMT methylation | 0.528 (0.374‐0.450) | <.001 | 0.721 (0.461‐1.128) | .152 |
| 1p19q codeletion | 0.134 (0.049‐0.363) | <.001 | 0.712 (0.243‐2.085) | .536 |
| Radiotherapy | 0.429 (0.296‐0.622) | <.001 | 0.446 (0.286‐0.695) | <.001 |
| Chemotherapy | 1.378 (0.963‐1.971) | .079 | ‐ | ‐ |
2.2. Consensus clustering
Three ATP metabolism‐related gene sets (ATP generation from ADP, ATP biosynthetic process and regulation of ATP metabolic process) were obtained from the Molecular Signature Database v5.1 (MSigDB) (http://www.broad.mit.edu/gsea/msigdb/). A gene set containing 110 ATP metabolism‐related genes (Table S1) was obtained after eliminating duplicate genes. The most variable genes were identified by median absolute deviation (MAD) and used for consensus clustering. The R package “ConsensusClusterPlus” was used in R language v3.4.3 for consensus clustering analysis and graphic generation.
2.3. Construction of risk signature
The least absolute shrinkage and selection operator (LASSO), which has been proved suitable for regression analysis of high dimensional data, was employed to identify the optimal risk signature. The risk score for each glioma patients in the CGGA dataset was calculated according to the following formula:
.
Then, the same formula and regression coefficients were applied for the validation set for risk score calculation.
2.4. Bioinformatics analysis
Pearson correlation analysis was performed using R language v3.4.3 (https://cran.r‑project.org/bin/windows/base/old/3.4.3/) to identified the genes most closely related to risk score in the CGGA and TCGA RNA‐seq datasets. Then, these genes were uploaded to the database for annotation, visualization and integrated discovery (DAVID) website (http://david.abcc.ncifcrf.gov/home.jsp) for Gene Ontology (GO) analysis and Kyoto Encyclopedia of Genes and Genomes pathway enrichment (KEGG) analysis. Gene set enrichment analysis (GSEA) software (http://www.broadinstitute.org/gsea/index.jsp) and gene set variation analysis (GSVA) were carried out to detect the association between biological processes and risk score in glioma samples. 23 , 24 Principal component analysis (PCA) was employed based on whole genome expression data to detect differences within stratified patients using the R package “princomp.” 25 A nomogram prediction model was constructed based on the integrated analysis of risk score and clinicopathologic characteristics using R package “rms.”
2.5. Statistical analysis
Statistical analyses were conducted using R language v3.4.3 and SPSS v16.0. Student t test and one‐way ANOVA was performed to compare differences among groups. Chi‐square test was performed to detect the differences in the clinicopathologic characteristics between the 2 clusters of patients. Kaplan‐Meier (K‐M) curve analysis was used to evaluate the survival differences between stratified patients. Univariate and multivariate Cox regression analyses were conducted to test independent prognostic factors. ROC curve analysis was used to predict molecular subtype and overall survival (OS) time with the R package “pROC.” In this study, a 2‐sided test P < .05 was considered significant.
3. RESULTS
3.1. ATP metabolism‐related signature identified in diffuse glioma
First, consensus clustering was performed to explore the association between ATP metabolic status and clinical outcome of glioma patients in the CGGA RNA‐seq dataset. The optimal number of subgroups was evaluated using cumulative distribution function (CDF) and consensus matrices. The results showed that patients could be divided into 2 robust groups (Figure 1A‐C). The heat map of these 2 clusters showed a significant difference in ATP metabolism‐related gene expression (Figure 1D). Chi‐square test was performed to further detect the difference in clinical characteristics between these 2 clusters of patients. The results suggested that patients in cluster 1 had the characteristics of older, higher grade, classical or mesenchymal subtypes, isocitrate dehydrogenase (IDH) wild type, O6‐methylguanine‐DNA methyl‐transferase (MGMT) promoter unmethylated, and 1p19q non‐codeleted. Patients in cluster 2 had completely opposite clinicopathological features (Table 1). Moreover, K‐M curve analysis revealed that the OS time of patients in cluster 1 was significantly shorter than that of patients in cluster 2 (Figure 1E). Similar analyses were also performed in TCGA RNA‐seq dataset and consistent results were obtained (Figure S1 and Table S2). These results indicated that the ATP metabolism status was closely correlated with molecular features and clinical outcomes of patients with glioma.
FIGURE 1.
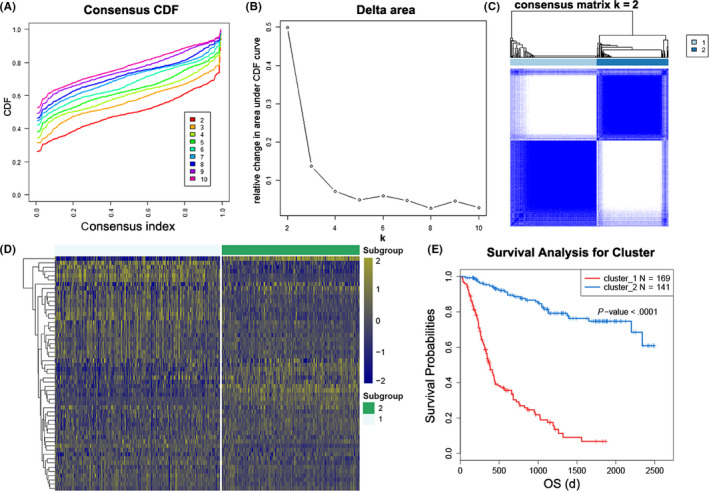
Consensus clustering for ATP metabolism‐related genes in glioma patients from CGGA dataset. A, Consensus clustering cumulative distribution function (CDF) for k = 2 to k = 10. B, Relative change in area under CDF curve for k = 2 to k = 10. C, Consensus clustering matrix of 310 samples from CGGA dataset for k = 2. D, Heat map of 2 clusters defined by the top 55 variable expression genes. E, Kaplan‐Meier (K‐M) survival curve of patients in 2 clusters
In this regard, here we constructed a risk signature to evaluate ATP metabolic status and predict the prognosis of patients with glioma. The LASSO Cox regression algorithm was performed to select the most valuable predictive genes with non‐zero regression coefficients (Figure 2A,B). After that, an 8‐gene signature was constructed and the risk score of each patient was calculated using the formula mentioned in the Materials and Methods section. In TCGA dataset, for validation, risk score was calculated with the same genes and regression coefficients. The heat maps showed an overview of correlation between ATP‐related gene expression and clinical characteristics (Figure 2C,D).
FIGURE 2.
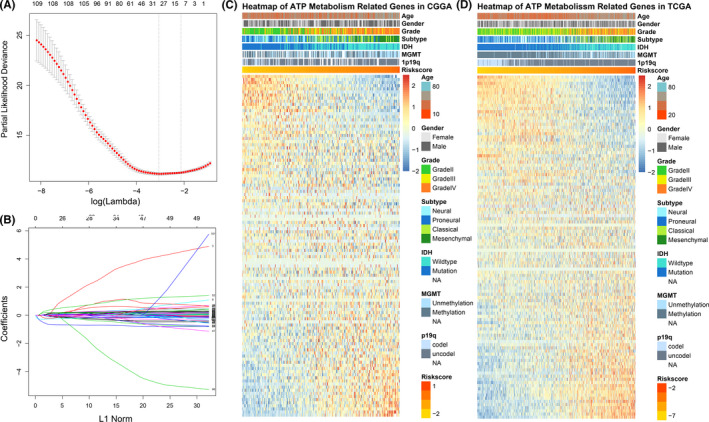
Identification of the ATP metabolism‐related signature. A, Cross‐validation for tuning parameter screening in the LASSO regression model. B, LASSO coefficient profiles of the common genes. C, D, Heat maps of 110 ATP metabolism‐related genes based on the risk score value in CGGA and TCGA RNA‐seq datasets
3.2. Association between the risk signature and clinicopathologic features in glioma
By examining the association between this 8‐gene signature and clinical features in both the CGGA and TCGA RNA‐seq datasets, we found that the signature score was positively correlated with the World Health Organization (WHO) grade of the diffuse glioma (Figures 3A and S2A). In addition, risk score was significantly reduced in IDH‐mutated, MGMT‐methylated or 1p/19q codeleted samples (Figures 3B‐D and S2B‐D). Moreover, we also found that the risk score showed a molecular subtype preference. Among 4 subtypes defined by TCGA network, the mesenchymal subtype, which is typically associated with poor clinical outcome, had the highest risk score (Figures 3E and S2E). To further verify this result, ROC curve analysis was performed. The area under curve (AUC) for risk scores in predicting the mesenchymal subtype in the CGGA and TCGA datasets were 0.901 and 0.890, respectively, (Figures 3F and S2F). These findings suggested that ATP metabolic status may have had a significant impact on the malignant progression of diffuse glioma.
FIGURE 3.
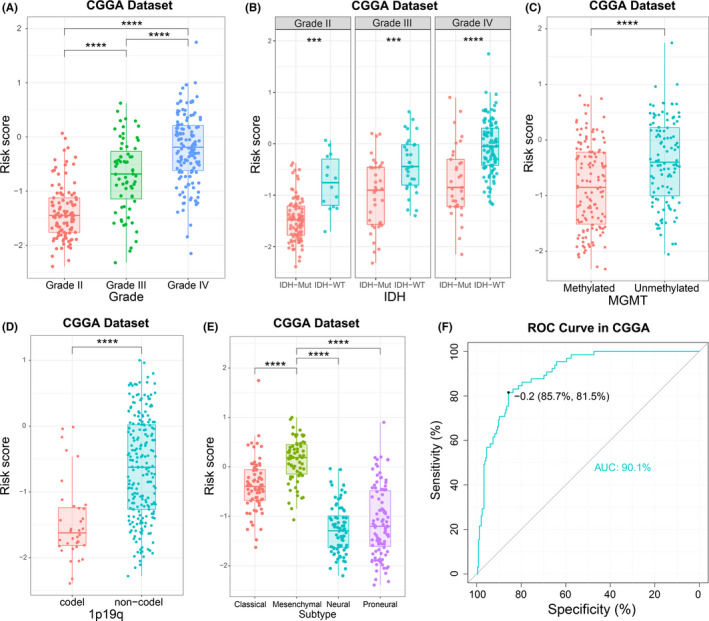
Association between pathologic characteristics and the ATP metabolism‐related signature in the CGGA dataset. A‐E, Distribution of the risk score in glioma patients stratified by WHO grade, isocitrate dehydrogenase (IDH) mutation status, O6‐methylguanine‐DNA methyl‐transferase (MGMT) promoter methylation, 1p/19q codeletion status and TCGA molecular subtypes. F, Receiver operating characteristic (ROC) curves predicted ATP metabolism as a biomarker of mesenchymal subtype glioma. *** P < .001, **** P < .0001
3.3. Prognostic value of the ATP metabolism‐related signature
To get an overview of this risk signature, we further evaluated the association among expression level of each gene, risk score, and patient survival. The results showed that the patients in the CGGA dataset with a high‐risk score tended to have poor prognosis and higher expression of ALDOC, HTR2A, PID1, and SLC25A23 genes. Meanwhile, patients in the low‐risk group tended to have better prognosis and higher expression of ATP5F1, ATP5G3, C12orf5 and HK2 genes (Figure 4A). After dividing the patients into 2 groups using the median expression of each gene, K‐M curve analyses showed that these 8 individual genes could distinguish the prognosis of the patients well (Figure S3). In addition, similar results were also observed in patients from TCGA dataset (Figures S4A and S5).
FIGURE 4.
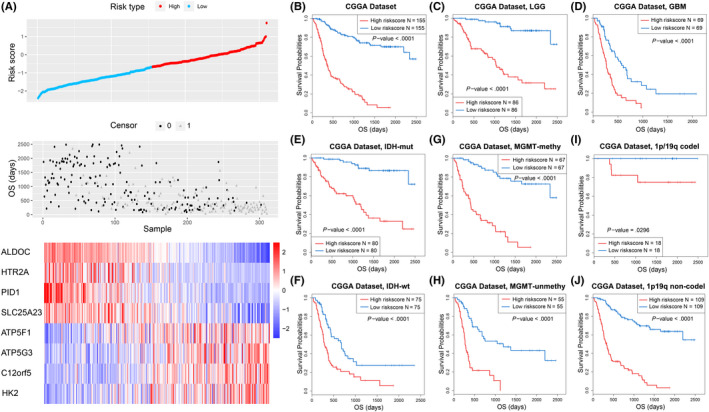
The prognostic value of the risk signature in CGGA dataset. A, Distribution of the risk score, overall survival (OS) and expression level of 8 genes in the risk signature. B‐J, Kaplan‐Meier (K‐M) survival analysis of the risk signature in glioma patients stratified by WHO grade, isocitrate dehydrogenase (IDH) mutation status, O6‐methylguanine‐DNA methyl‐transferase (MGMT) promoter methylation and 1p/19q codeletion status
To further investigate the prognostic value of risk signature in diffuse gliomas, K‐M curve analyses were performed for the CGGA dataset. The results showed that patients in the high‐risk group tended to have shorter OS (Figure 4B). Considering the significant differences in clinical and pathological characteristics between glioblastoma multiforme (GBM) and lower‐grade glioma (LGG), we also performed the same analyses in GBM and LGG patients respectively and achieved similar results (Figure 4C,D). In addition, the risk signature also showed a significant prognostic value in glioma patients stratified by IDH mutation, MGMT promoter methylation and 1p/19q codeletion status. (Figure 4E‐J). These findings were verified in the validation cohort, except for patients with GBM or IDH‐mutated glioma (Figure S4B‐J). In addition, univariate and multivariate Cox regression analyses showed that this risk signature was an independent prognostic factor of patients with glioma (Tables 2 and S3). Taken together, our results demonstrated that the risk signature had a high prognostic value for patients with glioma.
3.4. An individualized prediction model based on the risk signature
We performed ROC curve analysis to evaluate the prediction accuracy of risk score for the survival rate. The results showed that the risk score had high time‐dependent AUC for the CGGA dataset (1 y: 85.71%, 3 y: 91.42%, 5 y: 93.72%) and TCGA (1 y: 81.31%; 3 y: 84.92%, 5 y: 82.21%) datasets (Figure 5A,B). In addition, a nomogram model was constructed with the independent prognostic parameters for OS of patients. The C‐indices were 0.810 and 0.874 in the CGGA and TCGA datasets, respectively (Figure 5C). In addition, a calibration plot for probability of survival also showed satisfactory concordance with the prediction of 1‐, 3‐, and 5‐y OS in both datasets (Figure 5D,E).
FIGURE 5.
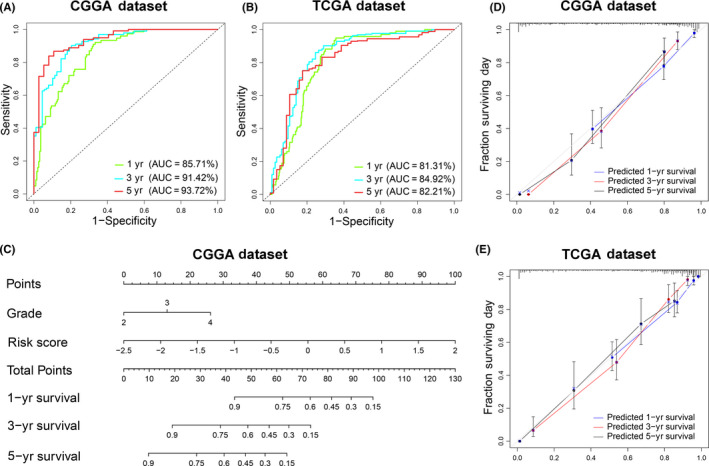
An individualized prediction model for overall survival (OS) of patients with glioma. A, B, The time receiver operating characteristic (ROC) curve analyses to predict 1‐, 3‐, and 5‐y OS according to risk score in CGGA and TCGA datasets. C, A nomogram was developed by integrating the signature risk score with the clinicopathologic features in the CGGA cohort. D, E, Calibration curves of nomogram for predicting OS at 1 y (blue line), 3 y (red line) and 5 y (black line) in the CGGA and TCGA datasets
3.5. Functional annotation of the risk signature
We performed PCA to explore the differential gene expression profiles between high‐risk and low‐risk groups in the CGGA and TCGA datasets. The results suggested that patients in the high‐risk and low‐risk group tended to distribute differently (Figures 6A and S6A). To further investigate the biological feature of glioma with different risk score, we picked genes that tightly correlated with the risk score (|R| > 0.5) by Pearson correlation analysis and annotated their functions using DAVID. GO analysis revealed that carbohydrate and amino acid metabolic processes, immune response, inflammatory response, cell proliferation, and cell division were significantly enriched in the high‐risk group. However, genes that negatively correlated with risk score were more enriched in normal biological processes, such as nervous system development, neuron cell‐cell adhesion (Figure 6B). Furthermore, KEGG pathway analysis showed that the risk score was positively related to PI3K‐AKT and NF‐kappa B signaling pathways and negatively related to MAPK and cAMP signaling pathways (Figure 6C). Similar results were uncovered when GSEA was performed (Figure 6D). To improve accuracy, the same analyses were performed in TCGA dataset as a validation. Consequently, GO and GSEA showed similar outcomes (Figure S6B‐D). These results suggested that the ATP metabolic status was not only tightly associated with substance metabolism functions such as glycolysis, carbohydrate, and amino acid metabolic process, but also had significant effects on the immune microenvironment of diffuse gliomas.
FIGURE 6.
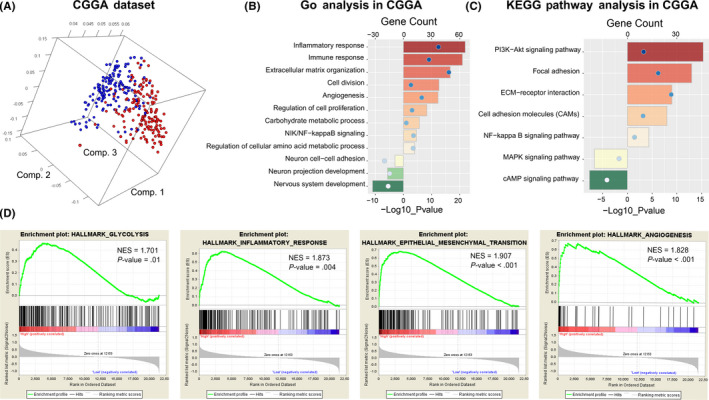
Functional analysis of the ATP metabolism‐related signature in the CGGA dataset. A, Principal components analysis of whole gene expression data between high‐risk and low‐risk groups. B, C, GO and KEGG pathway analyses were performed via the DAVID website to explore the functional annotation of the risk signature. D, GSEA analysis was used to explore the biological functions and pathways that were significantly enriched in patients with high‐risk score
3.6. Association between the risk signature and tumor immune microenvironment
To further understand the relationship between ATP metabolic status and the tumor immune microenvironment, immune checkpoints were enrolled into the analysis. The CIRCOS analysis revealed that risk score was positively related to the expression level of immune check points in both TCGA and the CGGA datasets (Figures 7A‐C and S7A‐C). These results suggested that glioma patients in the high‐risk group tended to be immunosuppressed. In addition, GSVA analysis was performed in the CGGA and TCGA datasets to evaluate the relationship between ATP metabolic status and the T‐cell immune response in gliomas. We found that ATP metabolism was correlated positively with the T‐helper 1/2 type immune response, and T‐helper 1/2 cell cytokine production. Meanwhile, it was negatively correlated with the T‐cell‐mediated immune response to tumor cells, suggesting that enhanced ATP metabolism may play an inhibitory role in T‐cell immunity to tumors in glioma. (Figures 7D and S7D). We also confirmed that ATP metabolism was tightly correlated with natural killer (NK) cell‐mediated and myeloid cell‐mediated immune responses (Figure S8).
FIGURE 7.
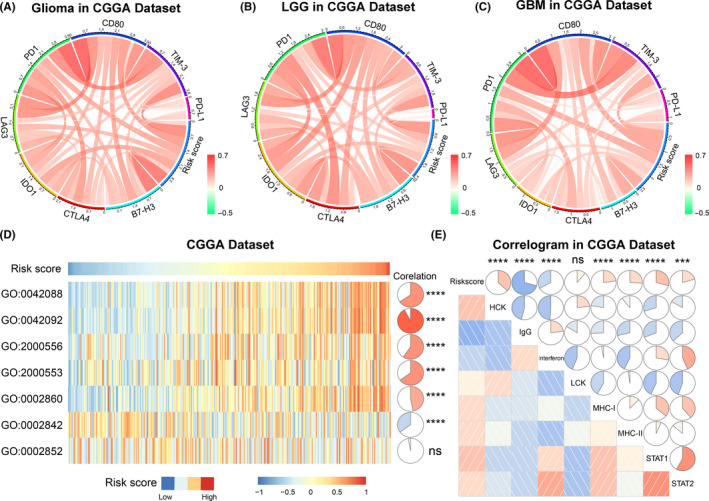
The 8‐gene signature‐related immune responses and inflammatory activities in gliomas in the CGGA dataset. A‐C, Correlation of immune checkpoint members and risk signature in whole gliomas, low‐grade gliomas (LGG), and glioblastoma multiforme (GBM), respectively. D, The relationship between the risk signature and T‐cell‐related immunity. GO:0042088: T‐helper 1 type immune response; GO:0042092: T‐helper 2 type immune response; GO:2000556: positive regulation of T‐helper 1 cell cytokine production; GO:2000553: positive regulation of T‐helper 2 cell cytokine production; GO:0002860: positive regulation of natural killer cell‐mediated cytotoxicity directed against tumor cell target; GO:0002842: positive regulation of T cell‐mediated immune response to tumor cell; GO:0002852: regulation of T cell‐mediated cytotoxicity directed against tumor cell target. E, Relationship between CMTM6 and inflammatory activities. *** P < .001, **** P < .0001, ns: not statistically significant
Considering that ATP metabolism was also involved in the regulation of inflammatory response in gliomas, several inflammatory genes were selected to identify the role of ATP metabolism in the inflammatory response. The results showed that the risk score was also positively associated with multiple inflammatory factors, especially HLA‐A, CCL2, and IL‐6 (Figure S9), indicating that enhancement of ATP metabolism promoted activation of T‐cell‐mediated and macrophage‐mediated inflammatory responses in glioma patients. In addition, we analyzed 7 metagenes mentioned in our previous studies. 26 , 27 The results showed that risk score was positively correlated with HCK, MHC‐I, MHC‐II, STAT1, and STAT2, while negatively associated with IgG in 2 datasets (Figures 7E and S7E). These findings suggested that ATP metabolism played a similar role to that of TIM‐3 and PD‐L1 in the inflammatory response. In brief, ATP metabolism could promote the malignant progression of glioma by shaping the tumor immune microenvironment.
4. DISCUSSION
In recent years, metabolic disorders of cancer have attracted extensive attention. 9 , 10 Cancer cells have prodigious energetic requirements and need active material and energy metabolism to maintain survival and rapid proliferation. 28 In gliomas, relevant studies proved that abnormal regulation of multiple metabolic pathways, such as glycolysis, amino acid, and lipid metabolism, are involved in the occurrence and malignant progression of this disease. 29 , 30 , 31 ATP metabolism, as the core of these metabolic pathways, will inevitably have a significant impact on the biological behavior of gliomas. In this study, we detected the ATP metabolic status of glioma patients and constructed an ATP metabolism‐related signature through the comprehensive analysis of RNA‐seq data. The prognostic value of this risk signature was fully validated by performing K‐M curve analyses and Cox regression analyses in the CGGA and TCGA datasets. In this 8‐gene signature, each individual gene could be regarded as a protective or risky prognostic factor for patients with glioma. However, compared with a single gene, a multiple‐gene signature can evaluate ATP metabolic status more accurately and predict survival more robustly for glioma patients. Therefore, this ATP metabolism‐related signature could serve as a reliable prognostic indicator and provide a theoretical basis for metabolism‐targeted therapies.
ATP is more than just a universal energy currency of our body. It can also regulate multiple biological functions as a crucial ligand or secondary messenger. 32 Several studies have proved that, during cancer formation and progression, ATP, and its main metabolite adenosine, are actively secreted in the extracellular environment, where they play an essential role as extracellular messengers. 33 , 34 The ATP‐gated receptor P2X7, which is tightly associated with enhanced cancer cell survival, proliferation and metastatic potential, can be activated by high concentrations of extracellular ATP. 35 ATP also fulfills a key role in tumor multidrug resistance (MDR). The ATP‐binding cassette (ABC) transporters, such as P‐glycoprotein (P‐gp) can reduce intracellular drug levels to sub‐therapeutic concentrations. 14 This makes ATP depletion a necessary condition for drug‐induced autophagic cell death. In lung cancer, the synergistic effect of ATP‐dependent drug efflux pump and focal adhesion signaling pathways can lead to vinorelbine resistance. 15 These results suggest that we should pay more attention to ATP metabolic status in the individualized treatment of cancers.
In the present study, bioinformatics analysis suggested that risk score was positively related to immune and inflammatory responses, indicating a tight interaction between ATP metabolism and the tumor immune microenvironment in gliomas. Some relevant studies on this point have suggested that ATP could selectively increase the number of immunosuppressive cells in the tumor microenvironment by increasing Treg cell chemotaxis, rather than activating CD4+ T lymphocytes. 36 As a special paracrine signaling molecule, ATP could reduce the motility of T lymphocytes by inducing calcium waves. 37 In addition, ATP can promote the recruitment of inflammatory cells to the tumor tissue. For example, in polymorphonuclear leukocytes and microglia, ATP and its metabolite ADP can serve as chemotactic agents acting at P2 receptor family members. 38 Extracellular ATP can increase the generation of reactive oxygen species in phagocytic cells via P2X7R and further promote cancer malignant progression, invasion, and metastatic spreading. 39 Angiotensin‐converting enzyme (ACE) overexpression in myeloid cells can promote their immune function by directly increasing oxidative metabolism and ATP synthesis. 18 In short, ATP metabolism is closely related to the regulation of the tumor immune microenvironment and this cannot be ignored in the immunotherapy of glioma.
In conclusion, we analyzed comprehensively the expression patterns of ATP metabolism‐related genes and identified an ATP metabolism‐related signature that could evaluate ATP metabolic status and predict the clinical outcome of patients with diffuse glioma. However, more prospective cohort studies are needed to estimate the clinical significance of this risk signature. The specific molecular mechanism behind the interaction between ATP metabolism and the tumor immune microenvironment also needs more in‐depth exploration and experimental verification. Our findings provided new insights into ATP metabolism and might be an important reference in metabolism‐targeted treatments for diffuse glioma patients.
DISCLOSURE
The authors have no conflict of interest to declare.
Supporting information
Figure S1
Table S1
Table S2
ACKNOWLEDGMENTS
We gratefully acknowledge contributions from the CGGA Network and TCGA Research Network. This work was supported by grants from the National Natural Science Foundation of China (81972816, 81702460, and 81802994).
Huang R, Li G, Wang Z, et al. Identification of an ATP metabolism‐related signature associated with prognosis and immune microenvironment in gliomas. Cancer Sci. 2020;111:2325–2335. 10.1111/cas.14484
Wang and Wu contributed equally.
Contributor Information
Kuanyu Wang, Email: wangkuanyu916@126.com.
Fan Wu, Email: wufan0510284@163.com.
REFERENCES
- 1. Wen PY, Kesari S. Malignant gliomas in adults. N Engl J Med. 2008;359(5):492‐507. [DOI] [PubMed] [Google Scholar]
- 2. Jiang T, Mao Y, Ma W, et al. CGCG clinical practice guidelines for the management of adult diffuse gliomas. Cancer Lett. 2016;375(2):263‐273. [DOI] [PubMed] [Google Scholar]
- 3. Vander Heiden MG, DeBerardinis RJ. Understanding the intersections between metabolism and cancer biology. Cell. 2017;168(4):657‐669. [DOI] [PMC free article] [PubMed] [Google Scholar]
- 4. Phillips HS, Kharbanda S, Chen R, et al. Molecular subclasses of high‐grade glioma predict prognosis, delineate a pattern of disease progression, and resemble stages in neurogenesis. Cancer Cell. 2006;9(3):157‐173. [DOI] [PubMed] [Google Scholar]
- 5. Brennan CW, Verhaak RG, McKenna A, et al. The somatic genomic landscape of glioblastoma. Cell. 2013;155(2):462‐477. [DOI] [PMC free article] [PubMed] [Google Scholar]
- 6. Nuno M, Birch K, Mukherjee D, Sarmiento JM, Black KL, Patil CG. Survival and prognostic factors of anaplastic gliomas. Neurosurgery. 2013;73(3):458–465. [DOI] [PubMed] [Google Scholar]
- 7. Osuka S, Van Meir EG. Overcoming therapeutic resistance in glioblastoma: the way forward. J Clin Invest. 2017;127(2):415‐426. [DOI] [PMC free article] [PubMed] [Google Scholar]
- 8. Demuth T, Berens ME. Molecular mechanisms of glioma cell migration and invasion. J Neurooncol. 2004;70(2):217‐228. [DOI] [PubMed] [Google Scholar]
- 9. Fumarola C, Petronini PG, Alfieri R. Impairing energy metabolism in solid tumors through agents targeting oncogenic signaling pathways. Biochem Pharmacol. 2018;151:114‐125. [DOI] [PubMed] [Google Scholar]
- 10. Seyfried TN, Flores R, Poff AM, D'Agostino DP, Mukherjee P. Metabolic therapy: a new paradigm for managing malignant brain cancer. Cancer Lett. 2015;356(2 Pt A):289–300. [DOI] [PubMed] [Google Scholar]
- 11. Biswas SK. Metabolic reprogramming of immune cells in cancer progression. Immunity. 2015;43(3):435‐449. [DOI] [PubMed] [Google Scholar]
- 12. DeBerardinis RJ, Chandel NS. Fundamentals of cancer metabolism. Sci Adv. 2016;2(5):e1600200. [DOI] [PMC free article] [PubMed] [Google Scholar]
- 13. Vander Heiden MG, Cantley LC, Thompson CB. Understanding the Warburg effect: the metabolic requirements of cell proliferation. Science. 2009;324(5930):1029‐1033. [DOI] [PMC free article] [PubMed] [Google Scholar]
- 14. Xu SW, Law BYK, Qu SLQ, et al. SERCA and P‐glycoprotein inhibition and ATP depletion are necessary for celastrol‐induced autophagic cell death and collateral sensitivity in multidrug‐resistant tumor cells. Pharmacol Res. 2020;153:104660. [DOI] [PubMed] [Google Scholar]
- 15. Nakanishi T, Menju T, Nishikawa S, et al. The synergistic role of ATP‐dependent drug efflux pump and focal adhesion signaling pathways in vinorelbine resistance in lung cancer. Cancer Med. 2018;7(2):408‐419. [DOI] [PMC free article] [PubMed] [Google Scholar]
- 16. Burnstock G. Physiology and pathophysiology of purinergic neurotransmission. Physiol Rev. 2007;87(2):659‐797. [DOI] [PubMed] [Google Scholar]
- 17. Burnstock G, Di Virgilio F. Purinergic signalling and cancer. Purinergic Signal. 2013;9(4):491‐540. [DOI] [PMC free article] [PubMed] [Google Scholar]
- 18. Cao DY, Spivia WR, Veiras LC, et al. ACE overexpression in myeloid cells increases oxidative metabolism and cellular ATP. J Biol Chem. 2020;295(5):1369‐1384. [DOI] [PMC free article] [PubMed] [Google Scholar]
- 19. Kepp O, Loos F, Liu P, Kroemer G. Extracellular nucleosides and nucleotides as immunomodulators. Immunol Rev. 2017;280(1):83‐92. [DOI] [PubMed] [Google Scholar]
- 20. Di Virgilio F, Adinolfi E. Extracellular purines, purinergic receptors and tumor growth. Oncogene. 2017;36(3):293‐303. [DOI] [PMC free article] [PubMed] [Google Scholar]
- 21. Di Virgilio F, Dal Ben D, Sarti AC, Giuliani AL, Falzoni S. The P2X7 receptor in infection and inflammation. Immunity. 2017;47(1):15‐31. [DOI] [PubMed] [Google Scholar]
- 22. Hu H, Wang Z, Liu Y, et al. Genome‐wide transcriptional analyses of Chinese patients reveal cell migration is attenuated in IDH1‐mutant glioblastomas. Cancer lett. 2015;357(2):566–574. 10.1016/j.canlet.2014.12.018. [DOI] [PubMed] [Google Scholar]
- 23. Subramanian A, Tamayo P, Mootha VK, et al. Gene set enrichment analysis: a knowledge‐based approach for interpreting genome‐wide expression profiles. Proc Natl Acad Sci U S A. 2005;102(43):15545‐15550. [DOI] [PMC free article] [PubMed] [Google Scholar]
- 24. Hanzelmann S, Castelo R, Guinney J. GSVA: gene set variation analysis for microarray and RNA‐seq data. BMC Bioinformatics. 2013;14:7. [DOI] [PMC free article] [PubMed] [Google Scholar]
- 25. Cheng W, Ren X, Zhang C, et al. Bioinformatic profiling identifies an immune‐related risk signature for glioblastoma. Neurology. 2016;86(24):2226‐2234. [DOI] [PubMed] [Google Scholar]
- 26. Li G, Wang Z, Zhang C, et al. Molecular and clinical characterization of TIM‐3 in glioma through 1,024 samples. Oncoimmunology. 2017;6(8):e1328339. [DOI] [PMC free article] [PubMed] [Google Scholar]
- 27. Wang Z, Zhang C, Liu X, et al. Molecular and clinical characterization of PD‐L1 expression at transcriptional level via 976 samples of brain glioma. Oncoimmunology. 2016;5(11):e1196310. [DOI] [PMC free article] [PubMed] [Google Scholar]
- 28. Weber GF. Time and circumstances: cancer cell metabolism at various stages of disease progression. Front Oncol. 2016;6:257. [DOI] [PMC free article] [PubMed] [Google Scholar]
- 29. Wu F, Zhao Z, Chai RC, et al. Prognostic power of a lipid metabolism gene panel for diffuse gliomas. J Cell Mol Med. 2019;23(11):7741‐7748. [DOI] [PMC free article] [PubMed] [Google Scholar]
- 30. Liu YQ, Chai RC, Wang YZ, et al. Amino acid metabolism‐related gene expression‐based risk signature can better predict overall survival for glioma. Cancer Sci. 2019;110(1):321‐333. [DOI] [PMC free article] [PubMed] [Google Scholar]
- 31. Zhou Z, Huang R, Chai R, et al. Identification of an energy metabolism‐related signature associated with clinical prognosis in diffuse glioma. Aging (Albany NY). 2018;10(11):3185‐3209. [DOI] [PMC free article] [PubMed] [Google Scholar]
- 32. Di Virgilio F, Sarti AC, Falzoni S, De Marchi E, Adinolfi E. Extracellular ATP and P2 purinergic signalling in the tumour microenvironment. Nat Rev Cancer. 2018;18(10):601‐618. [DOI] [PubMed] [Google Scholar]
- 33. Pellegatti P, Raffaghello L, Bianchi G, Piccardi F, Pistoia V, Di Virgilio F. Increased level of extracellular ATP at tumor sites: in vivo imaging with plasma membrane luciferase. PLoS One. 2008;3(7):e2599. [DOI] [PMC free article] [PubMed] [Google Scholar]
- 34. Morciano G, Sarti AC, Marchi S, et al. Use of luciferase probes to measure ATP in living cells and animals. Nat Protoc. 2017;12(8):1542‐1562. [DOI] [PubMed] [Google Scholar]
- 35. Gilbert SM, Oliphant CJ, Hassan S, et al. ATP in the tumour microenvironment drives expression of nfP2X7, a key mediator of cancer cell survival. Oncogene. 2019;38(2):194‐208. [DOI] [PMC free article] [PubMed] [Google Scholar]
- 36. Trabanelli S, Ocadlikova D, Gulinelli S, et al. Extracellular ATP exerts opposite effects on activated and regulatory CD4+ T cells via purinergic P2 receptor activation. J Immunol. 2012;189(3):1303‐1310. [DOI] [PubMed] [Google Scholar]
- 37. Wang CM, Ploia C, Anselmi F, Sarukhan A, Viola A. Adenosine triphosphate acts as a paracrine signaling molecule to reduce the motility of T cells. EMBO J. 2014;33(12):1354‐1364. [DOI] [PMC free article] [PubMed] [Google Scholar]
- 38. Junger WG. Immune cell regulation by autocrine purinergic signalling. Nat Rev Immunol. 2011;11(3):201‐212. [DOI] [PMC free article] [PubMed] [Google Scholar]
- 39. Pfeiffer ZA, Guerra AN, Hill LM, et al. Nucleotide receptor signaling in murine macrophages is linked to reactive oxygen species generation. Free Radic Biol Med. 2007;42(10):1506‐1516. [DOI] [PMC free article] [PubMed] [Google Scholar]
Associated Data
This section collects any data citations, data availability statements, or supplementary materials included in this article.
Supplementary Materials
Figure S1
Table S1
Table S2


