Abstract
Background: Growth charts are an important method for evaluating a child's health, growth, and nutritional status.
Objective: To establish Lambda—Mu- Sigma (LMS) and Z score references for assessment of growth and nutritional status in Egyptian school children and adolescents.
Methods: A total of 34,822 Egyptian school children and adolescents from 5 to 19 years were enrolled in a cross sectional randomized study from December 2017 to November 2019 to create LMS and Z score references for weight, height and body mass index (BMI) corresponding to ages. They were selected from different districts in Egypt. Apparent Healthy children with good nutritional history and not suffering from any chronic diseases were included in the study.
Results: Egyptian children of both sexes (54.3% boys and 45.7 % girls) from 5 to 19 years old were studied. Then LMS and Z scores for weight for age, height for age, BMI for age of both sexes were represented in detailed tables and graphs. There was no statistically significant difference between the Egyptian Z score charts and the reference values of WHO for weight, height and BMI corresponding to age (P > 0.05).
Conclusion: This is the first national reference for growth and nutritional assessment using LMS and Z score charts in Egyptian school children and adolescents, this tool is essential for healthcare and research.
Keywords: adolescent, Egyptian Z score, growth parameters, nutritional status, school children
Introduction
Impairment in growth is one of universal public health problems (1), and its early detection and accurate diagnosis is important for early intervention (2). Age- and sex-specific growth charts are the important tools used for monitoring children's longitudinal growth (3–5).
For investigating a child's growth rate, weight and height are the most common anthropometric measurements used. So assessment of weight and height plays an important role in follow up of the growth and nutritional status and early detection of its abnormalities for early intervention before permanent changes occur (6).
Over the past decades, one of the most important health problem worldwide is the increasing pattern of childhood obesity (7–11). Beyond the research setting, Body mass index is used alone as indicator of overweight and obesity in children and adolescents (12, 13).
In Egypt two thirds of child mortality owed to malnutrition and stands as one of the 36 countries where 90 % of the global burden of malnutrition falls (14). Pediatric overweight and obesity are considered the most prevalent nutritional disorder among both children and adolescents with 21–24% of them are overweight (15).
The first national charts on the physical Growth and development of children were established in 1972 (16, 17). This study was conducted on 2,121 Egyptian children from Cairo area aged from 6 to 18 years and measured weight, stature and weight/stature index using percentiles method.
The second national charts were done in 2002 using the same study design and in the same district but it included more age group (from birth to 18 years) (18).
In Egypt, there are two international references charts used to assess growth and nutritional status of children and adolescents aged 5–19 years, the first one is the recently updated World Health Organization (WHO) 2007 (19). while the second is the reference values from the Centers for Disease Control and Prevention (CDC) (20). Egypt does not have its own growth reference data based on Lambda—Mu- Sigma (LMS) and Z score parameters that is constructed with a representative national sample of children and adolescents, so the aim of this study was to establish a national reference charts for assessment of growth and nutritional status in Egyptian school children and adolescents by using LMS and Z score parameters.
Methods and Design
Participants
Egypt consists of 27 governorates. Cairo is the largest governorates in terms of population, accounting for one-third of Egypt's population according to the latest statistics. Therefore, this was taken into account and the largest number of participants from Cairo. To conduct the study, a cross-sectional design with a multistage random sampling technique was used. Out of 27 governorates, three governorates from Upper Egypt, and five governorates including Cairo from Lower Egypt were chosen in this study. We chose 18 districts from previously chosen governorates randomly. Then facilities including basic education schools and secondary training schools were counted, and 140 facilities in the selected 8 governorates were randomly chosen. The study sample was determined based on Egypt demographic health survey 2015 (21). All the socioeconomic strata were represented with weighted rural-urban representation. All details of the selected households in cities and villages in every single governorate were provided. Any child aged from 5 to 19 years old was eligible to share in the study. The process was totally computerized. The involved team (primary care physicians, pediatricians, and nurses) had been subjected to a training workshop on anthropometric measurements over 2 days followed by testing to avoid inter and intra-observer bias.
Out of the week, the study was conducted in three crowded days to gather more information. They were selected from Primary health centers, Primary school and secondary school as representative of children in Egypt. Between the educational courses and during break time, children were screened in the school that was selected randomly from the list of schools.
A total of 34,822 Egyptian children from 5 to 19 years were studied from December 2017 to November 2019. Firstly, we took 35,042 who were eligible for the study, then 34,822 children and adolescents were selected as a final total sample after exclusion of 220 children on applying the inclusion and exclusion criteria.
Ethics Approval
Institutional Review Boards (IRB) of the Menoufia faculty of medicine had approved the study. Ethical approval ID is 171112Ped. Research work had been performed in accordance with the Declaration of Helsinki. Purpose of the study was explained to all mothers/guardians of the children and adolescents and informed about objective of the study with absence of any risk to their children in participation in this study and those who agreed to participate signed an informed consent to confirm their willingness to participate.
Inclusion and Exclusion Criteria
All apparent healthy children with good developmental and nutritional history were included in this study. We excluded any child suffering from any chronic disease (cardiac, hematological, renal, endocrinal and hepatic diseases), fever or documented underlying disease at the time of examination.
Measurements and Data Collection
We measured weight for age, height for age, and calculate BMI for age for both sexes. All measured were collected by trained medical staff. All children were examined by identical measuring equipment. Weight was measured by a digital balanced scale (Beurer model GS 11, Germany) and height assessed by Harpenden fixed stadiometer. Device was calibrated daily. BMI was calculated using the formula: BMI = weight (Kg)/[height (m)]2.
Patient and Public Involvement
A sample of 99 children and caregivers beside 81 healthcare providers were interviewed and invited to provide us with their background questions related to anthropometric measurements. Four top questions out of 120 related ones were highlighted and studied in the attached figures. The aim of this step was to enlighten the way to our research to be relevant to the health needs.
Statistical Analysis
The LMS parameters were used to determine the standard deviation (−3 to +3) of weight, height and BMI for both sexes. The median (M), the generalized coefficient of variation (S), and the power in the Box–Cox transformation (L) are the content of LMS parameters. To convert the distribution of data to normal distribution, we used method of The Box–Cox transformation. The method models the data taking into consideration the degree of skewness (L), central tendency (M), and dispersion (S). The L, M, and S parameters are calculated and smoothed according to the method of maximum penalized likelihood (22, 23). Z score and LMS parameters were calculated by using the Statistical package SPSS, version 20, for windows (SPSS Inc., Chicago, Illinois, USA) and Excel according to the following formula:
We calculated the z-score values of −3, −2, −1, 0, +1, +2, and +3 for weight, height and BMI for age. The goodness of fit of all L, M, and S models was assessed using Q-test (24).
Student t-test for one sample was used to compare the means values of each group variable with the Egyptian and WHO reference values. For all analyses, the significance level was set at 5%.
Results
A total of 34,822 Egyptian children (54.3% boys and 45.7 % girls), from 5 to 19 years of age (Table 1)
Table 1.
Number of participating children in each age group/year.
| Boy | Girl | |
|---|---|---|
| 5 years | 1,199 | 1,135 |
| 6 years | 1,259 | 1,096 |
| 7 years | 1,288 | 1,082 |
| 8 years | 1,290 | 1,050 |
| 9 years | 1,244 | 1,026 |
| 10 years | 1,283 | 1,088 |
| 11 years | 1,305 | 1,030 |
| 12 years | 1,254 | 1,047 |
| 13 years | 1,284 | 1,063 |
| 14 years | 1,247 | 1,053 |
| 15 years | 1,299 | 1,036 |
| 16 years | 1,261 | 1,049 |
| 17 years | 1,248 | 1,073 |
| 18 years | 1,210 | 1,034 |
| 19 years | 1,243 | 1,046 |
| Total | 18,914 | 15,908 |
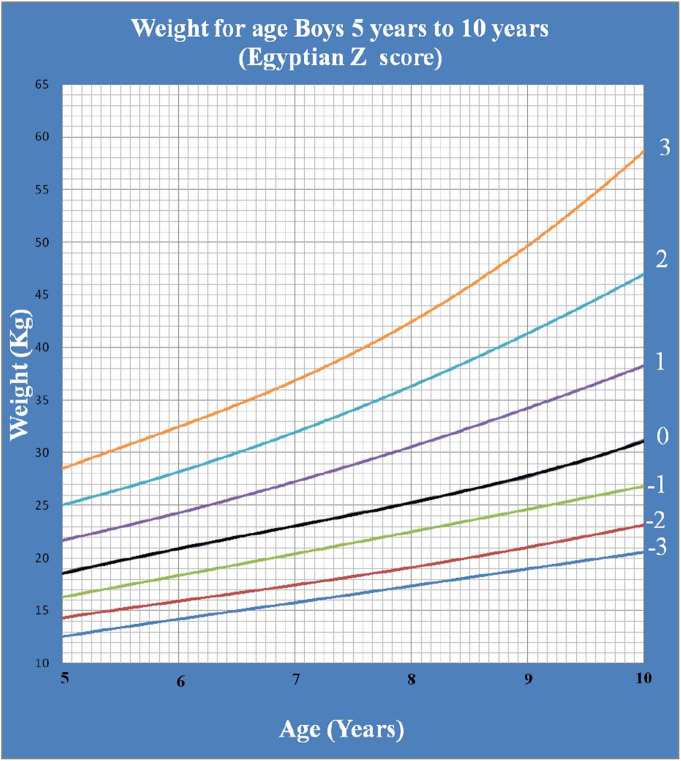
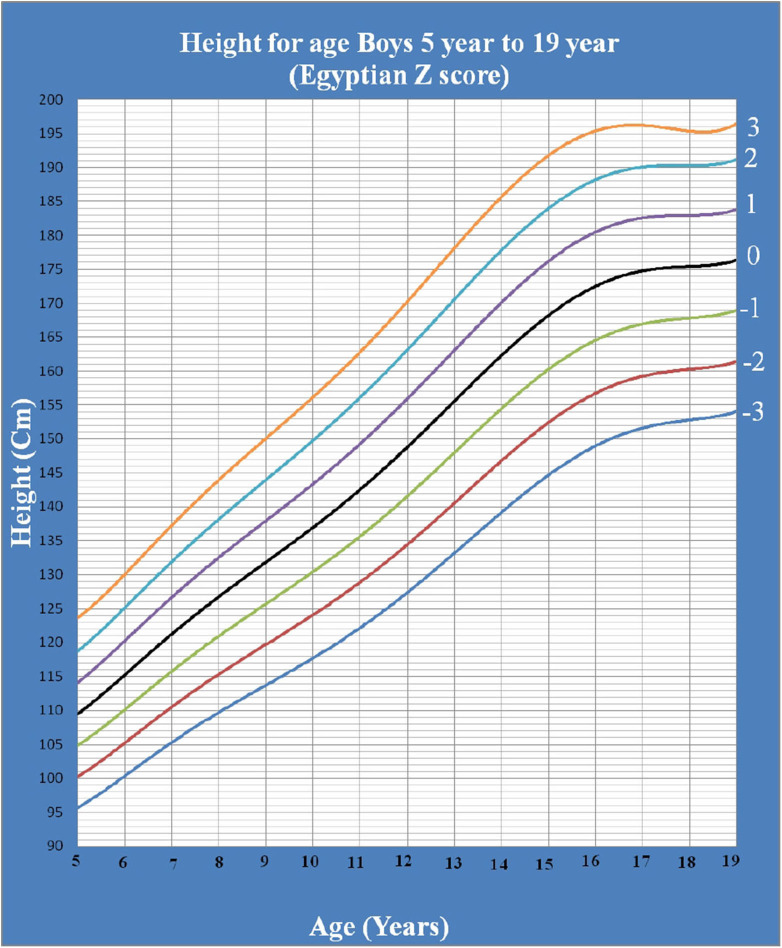
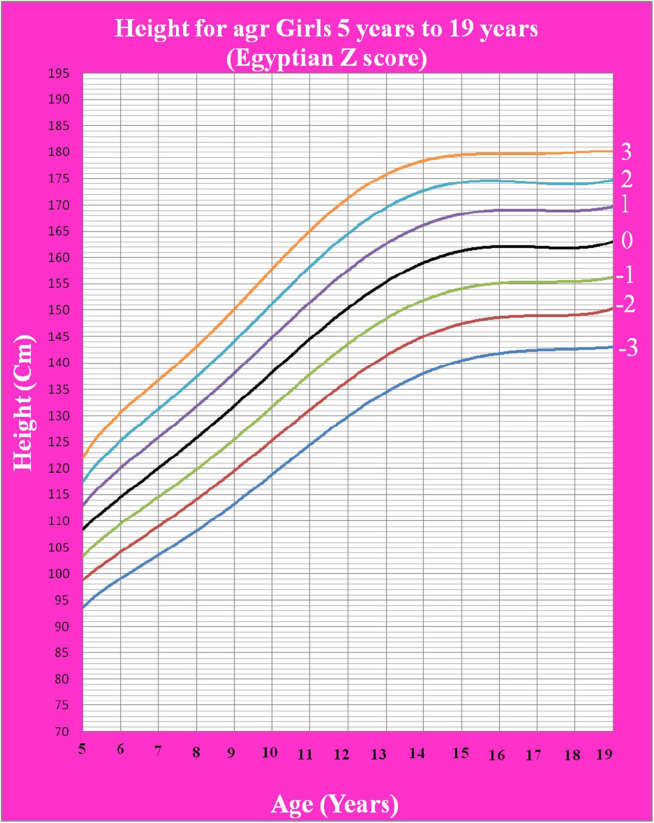
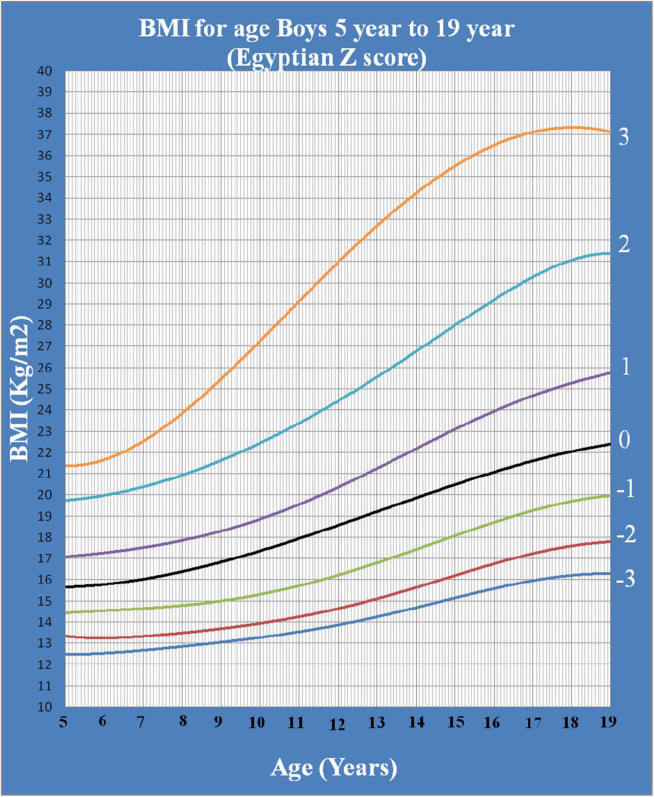
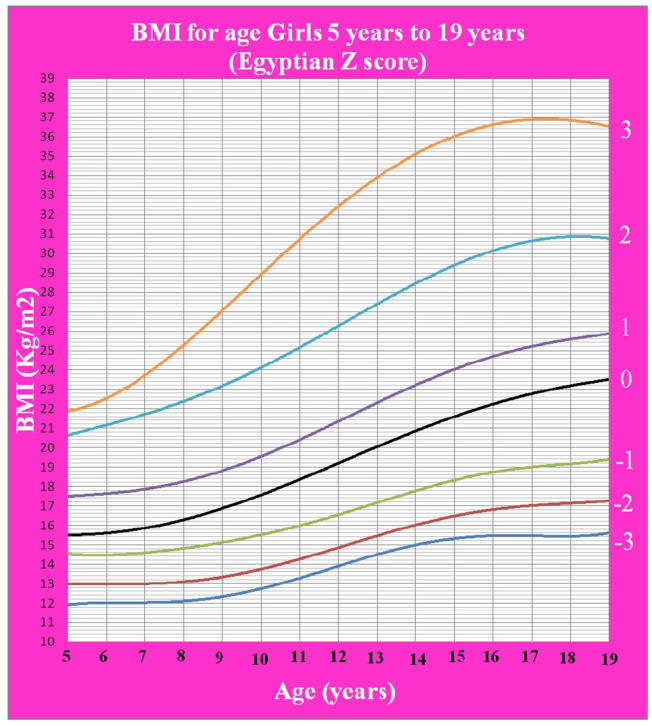
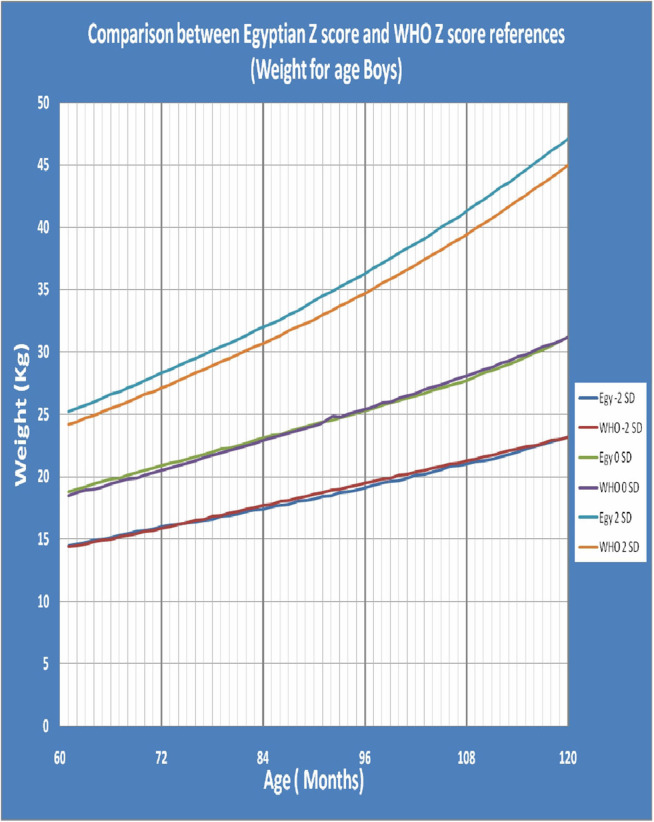
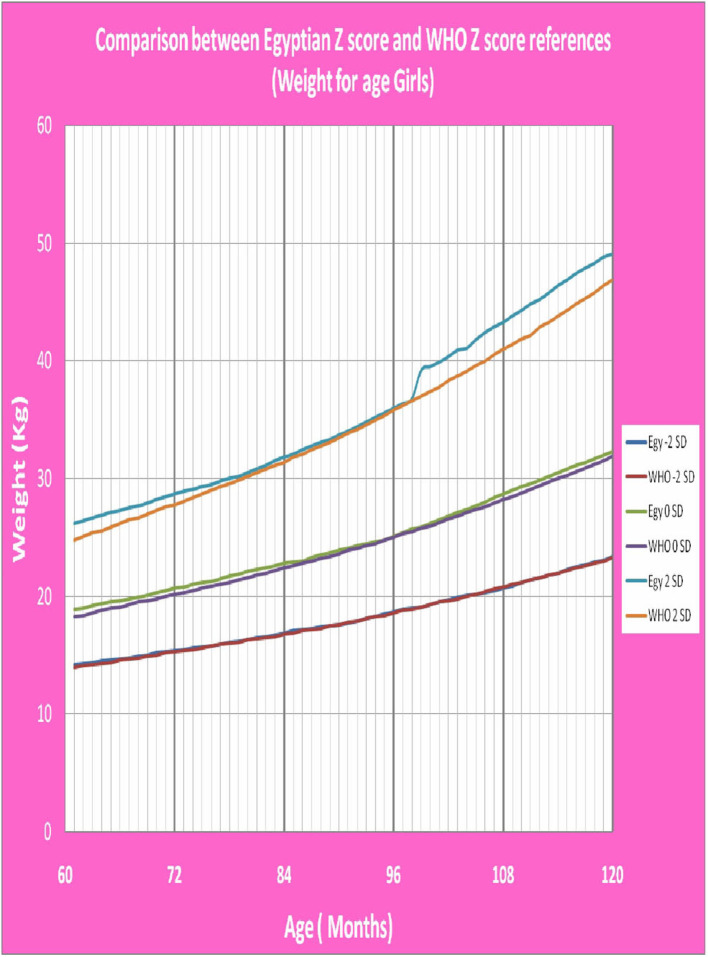
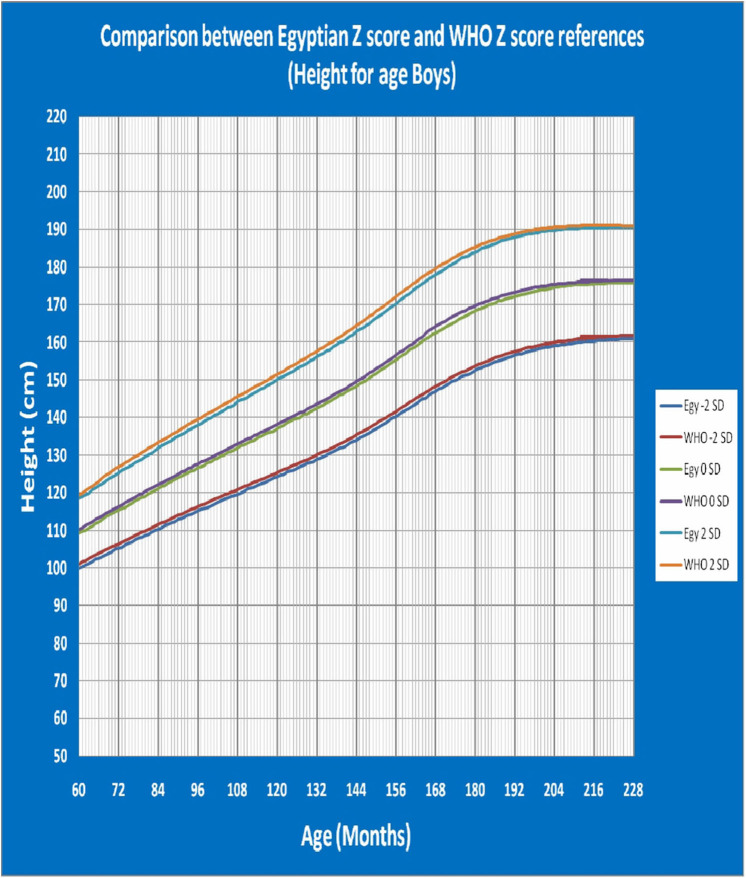
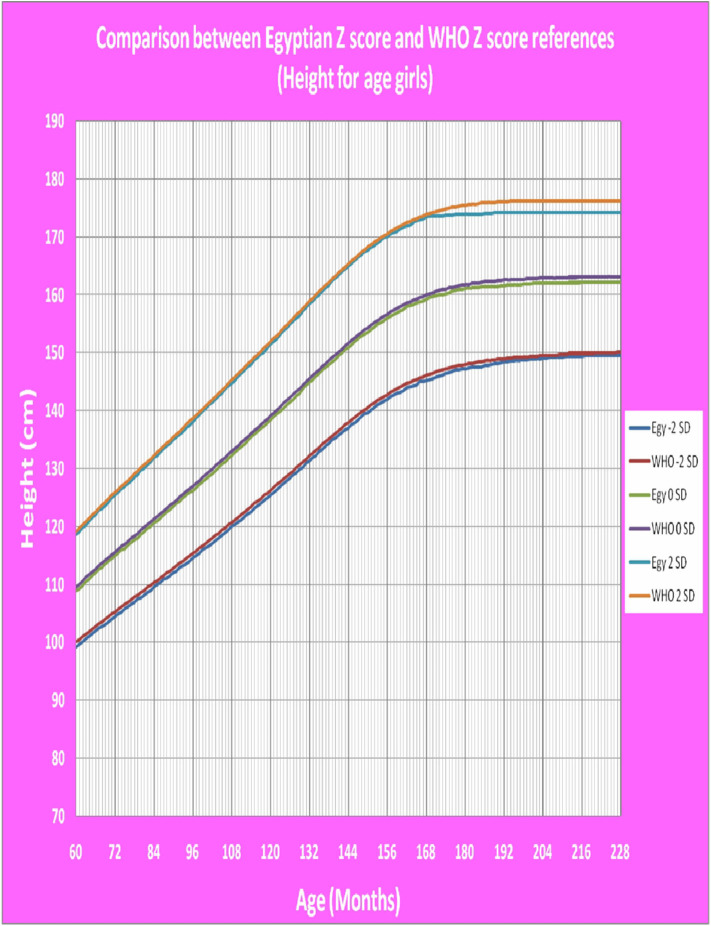
Figure 1 shows Egyptian Z score weight for age from 5 to 19 years for boys. Figure 2 shows Egyptian Z score weight for age from 5 to 19 years for girls. Figure 3 shows Egyptian Z score height for age from 5 to 19 years for boys. Figure 4 shows Egyptian Z score height for age from 5 to 19 years for girls. Figure 5 shows the Egyptian Z score BMI for age from 5 year to 19 years for boys. Figure 6 shows the Egyptian Z score BMI for age from 5 year to 19 years for girl. Figure 7 shows the comparison between Egyptian Z score and WHO Z score references value (weight for age in boys). Figure 8 shows the comparison between Egyptian Z score and WHO Z score references value (weight for age in girls). Figure 9 shows the comparison between Egyptian Z score and WHO Z score references value (Height for age in boys). Figure 10 shows the comparison between Egyptian Z score and WHO Z score references value (Height for age in girls).
Figure 1.
The Egyptian Z score weight for age from 5 years to 10 years for boys.
Figure 2.
The Egyptian Z score weight for age from 5 years to 10 years for girls.
Figure 3.
The Egyptian Z score height for age from 5 years to 19 years for boys.
Figure 4.
The Egyptian Z score height for age from 5 years to 19 years for girls.
Figure 5.
The Egyptian Z score BMI for age from 5 year to 19 years for boys.
Figure 6.
The Egyptian Z score BMI for age from 5 years to 19 years for girls.
Figure 7.
The comparison between Egyptian Z score and WHO Z score references value (weight for age in boys).
Figure 8.
The comparison between Egyptian Z score and WHO Z score references value (weight for age in girls).
Figure 9.
The comparison between Egyptian Z score and WHO Z score references value (Height for age in boys).
Figure 10.
The comparison between Egyptian Z score and WHO Z score references value (Height for age in girls).
Discussion
To assess the growth and nutritional status of a child, percentiles, percent of median, and Z-scores (standard deviation scores) are the available three methods. The Z-score indicates how many standard deviations any value is from the mean (25).
In contrast with a previous research done on 2002, also based on local data, presented the anthropometric parameters using the percentile method (18), our study is the first tool in Egypt to use LMS and Z score growth parameters method that provide more accuracy than percentiles that were used before. When compared with this study in Egypt, the previous study was done only on one governorate of Egypt and was based on percentile, but our report was done in many governorates that were representative to Egypt and based on LMS and Z score method that is more accurate.
Variation in the environmental conditions and the ethnicity factor developed the necessity for the development of tailored charts from representative samples (26, 27), that was and still conducted by many developed (28–30), and developing countries (31–33). In Egypt, this is the first national Z score growth charts for school children and adolescents that was developed in spite of using other charts.
Weight for age was not calculated beyond 10 years of age as during the pubertal growth spurt, the height increases rapidly more than weight making it not an accurate measure of nutritional status beyond 10 years (19).
After comparison of weight, height and BMI for age values of both sexes of the children and adolescents who participated in the present study with the WHO values (19), there was no statistically significant difference between the Egyptian Z score charts and the reference values of WHO. The P-values of weight for age in boys and girls were 0.142 and 0.229 (P > 0.05), respectively. The P-values of height for age in boys and girls were 0.469 and 0.361 (P > 0.05), respectively. The P-values of BMI for age in boys and girls were 0.492 and 0.316 (P > 0.05), respectively. This mean that WHO growth charts may be appropriate for monitoring growth and nutritional status on Egyptian children as the growth pattern in our large population were closer to growth charts of WHO.
WHO Multicenter Growth Reference Study was conducted to provide a single international standard representative for the physiological growth for all children everywhere, regardless of ethnicity, socio-economic status and type of feeding, and our study supports this hypothesis.
Conclusion
The L, M, and S parameters and Z-scores for Egyptian school children and adolescents presented in this report provide nationally representative reference that will facilitate more accurate assessment of growth and nutritional status of Egyptian children and comparison with other populations under different clinical conditions. In absence of these local charts, we recommend using WHO growth charts.
Data Availability Statement
All datasets presented in this study are included in the article/ Supplementary Material.
Ethics Statement
The studies involving human participants were reviewed and approved by Institutional Review Boards (IRB) of the Menoufia Faculty of Medicine. Written informed consent to participate in this study was provided by the participants or their legal guardian/next of kin.
Author Contributions
AE, ZO, AE-B, and WB: idea and design and data interpretation. AE, ZO, AE-B, MA, AA, AK, HR, GB, AS, WG, and WB: participant enrolment and data collection. AE-B and ZO: manuscript writing. ZK: statistical analysis. AE, ZO, FE-G, DA, MS, AE-B, WB, and ZK: manuscript revision. All authors contributed to the article and approved the submitted version.
Conflict of Interest
The authors declare that the research was conducted in the absence of any commercial or financial relationships that could be construed as a potential conflict of interest.
Supplementary Material
The Supplementary Material for this article can be found online at: https://www.frontiersin.org/articles/10.3389/fped.2020.00368/full#supplementary-material
References
- 1.Black RE, Allen LH, Bhutta ZA, Caulfield LE, de Onis M, Ezzati M, et al. Maternal and child undernutrition: global and regional exposures and health consequences. Lancet. (2008). 371:243–60. 10.1016/S0140-6736(07)61690-0 [DOI] [PubMed] [Google Scholar]
- 2.Bonthuis M, van Stralen KJ, Verrina E, Edefonti A, Molchanova EA, Hokken-Koelega AC, et al. Use of national and international growth charts for studying height in European children: development of up-to-date European height-for-age charts. PLoS ONE. (2012) 7:e42506. 10.1371/journal.pone.0042506 [DOI] [PMC free article] [PubMed] [Google Scholar]
- 3.De Onis M, Wijnhoven TM, Onyango AW. Worldwide practices in child growth monitoring. J Pediatr. (2004) 144:461–5. 10.1016/j.jpeds.2003.12.034 [DOI] [PubMed] [Google Scholar]
- 4.Foster BJ, Leonard MB. Measuring nutritional status in children with chronic kidney disease. Am J ClinNutr. (2004) 80:801–14. 10.1093/ajcn/80.4.801 [DOI] [PubMed] [Google Scholar]
- 5.WHO Physical status the use and interpretation of anthropometry. Report of a WHO Expert Committee. World Health Organ Tech Rep Ser. (1995) 854:1–452. [PubMed] [Google Scholar]
- 6.Ayatollahi SM, Sharafi Z, Haem E. Child weight growth chart and its associated factors in birth cohort of maku using a growth curve model and lms method. Glob J Health Sci. (2015) 7:181–6. 10.5539/gjhs.v7n6p181 [DOI] [PMC free article] [PubMed] [Google Scholar]
- 7.Abalkhail B, Shawky S. Comparison between body mass index, triceps skin fold thickness and mid-arm muscle circumference in aaudi adolescents. Ann Saudi Med. (2002) 22:324-8. 10.5144/0256-4947.2002.324 [DOI] [PubMed] [Google Scholar]
- 8.Wang C, Hou XH, Zhang ML, Bao YQ, Zou YH, Zhong WH, et al. Comparison of body mass index with body fat percentage in the evaluation of obesity in Chinese. Biomed Environ Sci. (2010) 23:173–9. 10.1016/S0895-3988(10)60049-9 [DOI] [PubMed] [Google Scholar]
- 9.Nooyens AC, Koppes LL, Visscher TL, Twisk JW, Kemper HC, Schuit AJ, et al. Adolescent skinfold thickness is a better predictor of high body fatness in adults than is body mass index: the amsterdam growth and health longitudinal Study. Am J ClinNutr. (2007) 85:1533–9. 10.1093/ajcn/85.6.1533 [DOI] [PubMed] [Google Scholar]
- 10.Welborn TA, Knuiman MW, Vu HT. Body mass index and alternative indices of obesity in relation to height, triceps skinfold and subsequent mortality: the Busseltonhealth study. Int J Obes Relat Metab Disord. (2000) 24:108–15. 10.1038/sj.ijo.0801093 [DOI] [PubMed] [Google Scholar]
- 11.de Almeida CA, Pinho AP, Ricco RG, Elias CP. Abdominal circumference as an indicator of clinical and laboratory parameters associated with obesity in children and adolescents: comparison between two reference tables. J Pediatr. (2007) 83:181–5. 10.2223/JPED.1604 [DOI] [PubMed] [Google Scholar]
- 12.Himes JH. Challenges of accurately measuring and using BMI and other indicators of obesity in children. Pediatrics. (2009) 124 (Suppl 1):S3–22. 10.1542/peds.2008-3586D [DOI] [PubMed] [Google Scholar]
- 13.Krebs NF, Himes JH, Jacobson D, Nicklas TA, Guilday P, Styne D. Assessment of child and adolescent overweight and obesity. Pediatrics. (2007) 120 (Suppl 4):S193–228. 10.1542/peds.2007-2329D [DOI] [PubMed] [Google Scholar]
- 14.Walker CL, Rudan I, Liu L, Nair H, Theodoratou E, Bhutta ZA, et al. Global burden of childhood pneumonia and diarrhoea. Lancet. (2013) 381:1405–16. 10.1016/S0140-6736(13)60222-6 [DOI] [PMC free article] [PubMed] [Google Scholar]
- 15.Xu S, Xue Y. Pediatric obesity: causes, symptoms, prevention and treatment. Exp Ther Med. (2016) 11:15–20. 10.3892/etm.2015.2853 [DOI] [PMC free article] [PubMed] [Google Scholar]
- 16.Abassy A, Hussein M, Aref M, Hamad S, Morsy M, Kassem A, et al. Growth and Development of the Egyptian Child. 1st edition. (1972). [Google Scholar]
- 17.El-Nofely A, Kamel N, Abou-Zeid AW, Massoud A. Attained weight, stature and weight/stature index for egyptian children aged 6–18 Years. Cairo Area, 1980–1982. Int J Anthropol. (1989) 4: 275–86. 10.1007/BF02444643 [DOI] [Google Scholar]
- 18.Ghali I, Salah N, Hussien F, Erfan M, El-Ruby M, Mazen I, et al. Egyptian growth curves for infants, children and adolescents. In: Satorio A, Buckler JMH, Marazzi N, editors. Crecerenelmondo. Ferring Publisher. (2008). Available online at: https://scholar.google.com/scholar_lookup?title=Crecere+nel+mondo&author=I+Ghali&author=N+Salah&author=F+Hussien&author=M+Erfan&author=M+El-Ruby&publication_year=2002&
- 19.DeOnis M, Onyango AW, Borghi E, Siyam A, Nishida C, Siekmann J. Development of a WHO growth reference for school-aged children and adolescents. Bull World Health Organ. (2007) 85:660–7. 10.2471/BLT.07.043497 [DOI] [PMC free article] [PubMed] [Google Scholar]
- 20.Kuczmarski RJ, Ogden CL, Guo SS, Grummer-Strawn LM, Flegal KM, Mei Z, et al. 2000 CDC growth charts for the united states: methods and development. Vital Health Stat. (2002) 11:1–190. Available online at: https://pubmed.ncbi.nlm.nih.gov/12043359/ [PubMed] [Google Scholar]
- 21.El-Zanaty F, Way A. Egypt Health Issue Survey 2015. Cairo: Egyptian Ministry of Health and Population. (2015) Available online at: https://dhsprogram.com/pubs/pdf/FR313/FR313.pdf
- 22.Cole TJ, Green PJ. Smoothing reference centile curves:the LMS method and penalized likelihood. Stat Med. (1992) 11:1305–19. 10.1002/sim.4780111005 [DOI] [PubMed] [Google Scholar]
- 23.Cole TJ, Freeman JV, Preece MA. British 1990 growth reference centiles for weight, height, body mass index and head circumference fitted by maximum penalized likelihood. Stat Med. (1998) 17:407–29. 10.1002/SICI1097-02581998022817:4407::AID-SIM7423.0.CO;2-L [DOI] [PubMed] [Google Scholar]
- 24.Pan H, Cole TJ. A comparison of goodness of fit tests for age-related reference ranges. Stat Med. (2004) 23:1749–65. 10.1002/sim.1692 [DOI] [PubMed] [Google Scholar]
- 25.El Mouzan MI, Al Salloum AA, Alqurashi MM, AlHerbish AS, Al Omar A. The LMS and Z scale growth reference for saudi school-age children and adolescents. Saudi J Gastroenterol. (2016) 22:331–6. 10.4103/1319-3767.187608 [DOI] [PMC free article] [PubMed] [Google Scholar]
- 26.Freedman DS, Khan LK, Serdula MK, Ogden CL, Dietz WH. Racial and ethnic differences in secular trends for childhood BMI, weight, and height. Obesity. (2006) 14:301–8. 10.1038/oby.2006.39 [DOI] [PubMed] [Google Scholar]
- 27.Deaton A. Height, health, and development. Proc Natl Acad Sci USA. (2007) 104:13232–7. 10.1073/pnas.0611500104 [DOI] [PMC free article] [PubMed] [Google Scholar]
- 28.Wright CM, Booth IW, Buckler JM, Cameron N, Cole TJ, Healy MJ, et al. Growth reference charts for use in the United Kingdom. Arch Dis Child. (2002) 86:11–14. 10.1136/adc.86.1.11 [DOI] [PMC free article] [PubMed] [Google Scholar]
- 29.Tinggaard J, Aksglaede L, Sørensen K, Mouritsen A, Wohlfahrt-Veje C, Hagen CP, et al. The (2014) Danish references from birth to 20 years for height, weight and body mass index. ActaPædiatrica. (2014) 103:214–24. 10.1111/apa.12468 [DOI] [PubMed] [Google Scholar]
- 30.Scherdel P, Botton J, Rolland-Cachera MF, Léger J, Pelé F, Ancel PY, et al. Should the WHO growth charts be used in france? PLoS ONE. (2015) 10:e0120806. 10.1371/journal.pone.0120806 [DOI] [PMC free article] [PubMed] [Google Scholar]
- 31.Bong Y, Shariff AA, Mohamed AM, Merican AF. Malaysian growth centiles for children under six years old. Ann Hum Biol. (2015) 42:108–15. 10.3109/03014460.2014.912679 [DOI] [PubMed] [Google Scholar]
- 32.Payande A, Tabesh H, Shakeri MT, Saki A, Safarian M. Growth curves of preschool children in the northeast of iran: a population-based study using quantile regression approach. Glob J Health Sci. (2013) 5:9–15. 10.5539/gjhs.v5n3p9 [DOI] [PMC free article] [PubMed] [Google Scholar]
- 33.Zong XN, Li H. Construction of a new growth references for china based on urban chinese children: comparison with the WHO growth standards. PLoS ONE. (2013) 8:e59569 10.1371/journal.pone.0059569 [DOI] [PMC free article] [PubMed] [Google Scholar]
Associated Data
This section collects any data citations, data availability statements, or supplementary materials included in this article.
Supplementary Materials
Data Availability Statement
All datasets presented in this study are included in the article/ Supplementary Material.


