

Abstract
The innate immune system, the first line of defense against pathogens, is activated by nucleic acids from microbial invaders that are recognized by nucleic acid‐sensing receptors. Recent evidence affirms the ability of these receptors to respond to nucleic acids released by damaged cancer cells. The innate immune system is also involved in cancer immunosurveillance, and could be modulated for devising effective antitumor therapies by targeting nucleic acid‐sensing pathways. A systematic, comprehensive analysis of dysregulation in nucleic acid‐sensing pathways in cancer is required to fully understand its role. Based on multidimensional data of The Cancer Genome Atlas pan‐cancer cohort, we revealed that upregulation of cytosolic DNA‐sensing genes like AIM2 and CGAS was common in tumor tissues. We used 15 genes in the nucleic acid‐sensing pathway to cluster all tumor patients into 2 subgroups and found that the subgroup with higher expression of nucleic acid‐sensing pathway genes was associated with poorer prognosis across cancer types. However, in homologous recombination deficient patients, the nucleic acid recognition activated subgroup was associated with better prognosis, which confirms the therapeutic effect of nucleic acid recognition. This study contributes to a better understanding of the functions and mechanisms of nucleic acid recognition in cancer, lays the foundation for new therapeutic strategies, and enlarges the scope of development of new drugs.
Keywords: cancer prognosis, innate immunity, nucleic acid‐sensing, pancancer cohort, tumor immunology
Overview of the analysis workflow.

Abbreviations
- CNA
copy number alteration
- DDR
DNA damage repair
- EMT
epithelial‐to‐mesenchymal transition
- GSEA
Glioblastoma multiforme
- GTEx
Genotype‐Tissue Expression project
- HR
homologous recombination
- HRD
homologous recombination deficiency
- IFN
interferon
- IL
interleukin
- KICH
Kidney Chromophobe
- MAVS
mitochondrial antiviral signaling protein
- NA
nucleic acid
- OS
overall survival
- PRR
pattern recognition receptor
- RPPA
reverse‐phase‐protein array
- STING
stimulator of interferon genes
- TCGA
The Cancer Genome Atlas
- TNF
tumor‐necrosis factor
- TLR
Toll‐like receptor
- TSS
transcription start site
1. INTRODUCTION
Nucleic acid‐sensing pathways, an integral part of innate immune system, detect NAs by a specialized group of germline‐encoded PRRs. These sensors include but are not limited to endosomal TLRs and cytosolic sensors, upstream of STING and MAVS. 1
Nucleic acid recognition plays a key role in defense against viral infection, as NAs are the critical viral microbe‐associated molecular patterns. However, the basic structure of DNA and RNA is basically universal among all organisms. Hence NA‐sensing PRRs appear to display limited ability to discriminate foreign NAs from self‐NAs. 2 Nucleic acid‐sensing PRRs might be activated by accumulation of endogenous DNA or RNA under certain conditions. Deficiency in genes involved in NA metabolism, especially nucleases, leads to inappropriate activation of NA sensors and autoimmune phenotypes, such as Aicardi‐Goutières syndrome. 3 , 4 Aicardi‐Goutières syndrome is a lupus‐like disease characterized by chronic activation of type I IFN‐mediated immune response. 5
Recently, researchers have been investigating the role of NA recognition in development and sustenance of cancer. It has been reported that cancer cells release NAs by oxidative stress, altered metabolic rate, genomic instability, and various mutations. These could also be detected by NA sensors and drive the release of type‐I IFNs, pro‐inflammatory cytokines, and chemokines. 6 , 7 , 8 Immune signaling induced by NA recognition has potent antitumor effects and therefore is a novel cancer therapeutic target. 9 , 10 , 11 In some cancer types, NA recognition also changes the tumor microenvironment and promotes tumor growth and metastasis, which could complicate the utility of immunomodulatory therapeutics targeting this pathway. 12 , 13
Given the complexity and importance of NA recognition in cancer, several researchers have tried analyzing the mutation, expression pattern, and prognostic impact of NA recognition. 14 , 15 , 16 , 17 , 18 However, systematic pan‐cancer analysis of NA‐sensing pathways has not yet been reported. We integrated TCGA pan‐cancer multiomics data to comprehensively describe the role of NA recognition in cancer. We discovered common patterns of dysregulated expression of NA‐sensing pathway genes. We found that activation of NA recognition is an unfavorable prognosis marker in most cases. While under HR‐deficient conditions, NA recognition activation is associated with better prognosis. The objective of this comprehensive study is to understand the multiple roles of NA recognition in cancer and provide more information in this era of precision medicine.
2. MATERIALS AND METHODS
2.1. Data collection
The Cancer Genome Atlas pan‐cancer somatic mutation data, methylation (450k) data, protein (RPPA) data, DDR footprint scores, and clinical data were obtained from Genomic Data Commons. The Cancer Genome Atlas pan‐cancer cohort and the GTEx project RNA sequencing data were downloaded from Toil recomputed data 19 (RSEM, batch‐normalized, log2‐transformed, and upper quantile normalized). The cancer types are denoted by TCGA abbreviation.
2.2. Differential expression analyses
For the comparison between tumor tissue and adjacent normal tissue, we undertook a differential expression analysis between tumors and their matched normal samples using the Wilcoxon signed rank test. For the comparison between normal tissue adjacent to the tumor and healthy tissue, we undertook a differential expression analysis between tumor and GTEx samples using the Wilcoxon rank sum test. Fold change was calculated using median expression of a gene.
2.3. Differential methylation analyses
The TSS is the location where transcription starts at the 5′‐end of a gene, and β‐values of probes located within TSS1500 (1500 bp from the TSS) of each gene were averaged for further analyses. Wilcoxon’s rank sum test was used to detect differential methylation between subgroups.
2.4. Consensus cluster and principal component analyses
Gene expression data used for clustering was normalized using z‐scores within each cancer type. Unsupervised K‐mean‐based consensus clustering was undertaken using R package ConsensusClusterPlus. 20
2.5. Biological enrichment analyses and RPPA pathway scores
To determine which biological pathways and signaling processes were significantly enriched in the NA‐sensing activated C2 subgroup, GSEA was undertaken using Broad GSEA version 4.0 with the MSigDB hallmark gene sets. 21 Reverse‐phase protein array based pathway scores were calculated as the sum of the median‐centered and normalized relative protein level of all positive regulatory components minus that of negative regulatory components in a particular pathway. 22
2.6. Survival analyses
R packages “survival” and “survminer” were used for Kaplan‐Meier analyses and log‐rank tests. Survival distributions for different subgroups were visualized using Kaplan‐Meier plots, and differences between the survival distributions were calculated using the log‐rank test.
3. RESULTS
3.1. Dysregulated expression in NA‐sensing pathway genes across multiple cancer types
Molecules in NA‐sensing pathways are classified into: sensors, adaptors, downstream kinases, and effectors. 23 , 24 As downstream kinases and effectors also participate in multiple other biological pathways, we identified 15 genes that can function as sensors or adaptors in the NA‐sensing pathways (Figure 1A) from published reports, 25 , 26 , 27 , 28 , 29 , 30 and undertook the subsequent analyses.
FIGURE 1.

Dysregulated expression of genes in nucleic acid (NA)‐sensing pathways across multiple cancer types. A, Overview of genes associated with NA sensing. It includes the cytosolic DNA‐sensing pathway, cytosolic RNA‐sensing pathway, and Toll‐like receptor (TLR) pathway responding to NA. Sensors and adaptors of these pathways were used for subsequent analyses. B, Summary of mutation rates of specific genes in NA‐sensing pathways across all cancer types. C, Left panel, heatmap of differential expression profiles of NA‐sensing pathway genes between tumor tissue and adjacent normal tissue. Fold change and p‐value calculated between tumor tissue and adjacent normal tissue. The heatmap cell color indicates the log2‐transformed fold change (Log2(FC)) and gray cells represent the insignificant group (Wilcoxon signed rank test, P‐value < .05). Right panel, summary of genes significantly upregulated and downregulated (P < .05) across different cancer types. Red, upregulated expression; blue, downregulated expression. D, Left panel, heatmap of differential expression profiles of NA‐sensing pathway genes between normal tissue adjacent to tumor and Genotype‐Tissue Expression project normal tissue. Right panel, summary of genes significantly upregulated and downregulated (P < .05) across different cancer types. BLCA, bladder urothelial carcinoma; BRCA, breast invasive carcinoma; COAD, colon adenocarcinoma; ESCA, esophageal carcinoma; KICH, kidney chromophobe; HNSC, head and neck squamous cell carcinoma; KICH, kidney chromophobe; KIRC, kidney renal clear cell carcinoma; KIRP, kidney renal papillary cell carcinoma; LIHC, liver hepatocellular carcinoma; LUAD, lung adenocarcinoma; LUSC, lung squamous cell carcinoma; PAAD, pancreatic adenocarcinoma; STAD, stomach adenocarcinoma; THCA, thyroid carcinoma
The overall mutation frequencies of these identified genes were studied in different cancers and the level was found to be low, at less than 3% (Figure 1B). Across all cancer samples, TLR7 was the most highly mutated, and its mutation frequency was a little more than 2%. The mutation frequency of these 15 genes was also calculated for individual cancer type. These alterations were frequent in some cancer types, like uterine corpus endometrial carcinoma, when compared to the others. Overall, these gene mutations were uncommonly detected across various cancers.
To unravel the expression pattern of NA‐sensing pathway genes, we undertook an analysis of mRNA expression in 14 cancer types with sufficient numbers of matched tumor and adjacent normal samples (n > 10). The aberrant expression pattern of individual genes varied between cancer types (Figure 1C). The cytosolic DNA‐sensing pathway was found to be the most commonly upregulated, with DNA sensor AIM2 expression being the most consistently upregulated. The downregulation of these genes was relatively uncommon, with TLR3 being the most commonly downregulated gene. Across all cancers, kidney renal clear cell carcinoma showed universal upregulation of these genes.
Normal tissue adjacent to tumor was used as control for tumor tissue in the above analysis. However, tumor‐adjacent normal tissue transcriptomic profiles could be affected by the tumor microenvironment. Hence, we integrated normal tissue transcription data from GTEx and tumor‐adjacent normal tissue data from TCGA to validate the dysregulation of NA‐sensing pathway genes in the tumor microenvironment as well (Figure 1D). The top 4 upregulated genes all belong to the RNA‐sensing pathway: TLR3, TLR7, and TLR8 are transmembrane proteins that recognize RNA in the endosome, and MDA5 is an RNA helicase with caspase recruitment domains that responds to cytosolic RNA. Combining the above results, we observed that TLR3 is specifically upregulated in tumor‐adjacent normal tissue when compared to its expression levels in tumor tissue and normal tissue. Altogether, NA‐sensing pathway genes show universal aberrant expression patterns in tumor tissue and normal tissue adjacent to tumor.
3.2. Nucleic acid‐sensing pathway gene expression subgroups
To gain a more comprehensive view of expression heterogeneity in NA‐sensing pathway genes, we clustered tumor samples into subgroups based on expression using the consensus k‐means clustering method. 20 The mRNA expression data was first normalized using z‐score normalization within each cancer type. Based on expression data of 15 genes, samples were robustly separated into 2 subgroups. Similarly, most cancer types were separated into 2 subgroups (Figure 2A,B).
FIGURE 2.

Messenger RNA expression‐based clusters. A, Consensus matrix of expression clustering showing 2 robust subgroups. B, Heatmaps of gene expression of 2 subgroups. Subgroups and cancer types are indicated by the annotation bars above the heatmap. C, Top panel, expression of nucleic acid (NA)‐sensing pathway genes in subgroups C1 (red) and C2 (blue). Bottom panel, promoter region methylation of NA‐sensing pathway genes in these 2 subgroups. Mann‐Whitney U test P values are displayed. The dot in the middle represents the median in each subgroup. ACC, adrenocortical carcinoma; BLCA, bladder urothelial carcinoma; BRCA, breast invasive carcinoma; CESC, cervical squamous cell carcinoma and endocervical adenocarcinoma; CHOL, cholangiocarcinoma; COAD, colon adenocarcinoma; DLBC, lymphoid neoplasm diffuse large B‐cell lymphoma; ESCA, esophageal carcinoma; GBM, glioblastoma multiforme; HNSC, head and neck squamous cell carcinoma; KICH, kidney chromophobe; KIRC, kidney renal clear cell carcinoma; KIRP, kidney renal papillary cell carcinoma; LGG, brain lower grade glioma; LIHC, liver hepatocellular carcinoma; LUAD, lung adenocarcinoma; LUSC, lung squamous cell carcinoma; MESO, mesothelioma; OV, ovarian serous cystadenocarcinoma; PAAD, pancreatic adenocarcinoma; PCPG, pheochromocytoma and paraganglioma; PRAD, prostate adenocarcinoma; READ, rectum adenocarcinoma; SARC, sarcoma; SKCM, skin cutaneous melanoma; STAD, stomach adenocarcinoma; TGCT, testicular germ cell tumor; THCA, thyroid carcinoma; THYM, thymoma; UCEC, uterine corpus endometrial carcinoma; UCS, uterine carcinosarcoma; UVM, uveal melanoma
A heatmap of 2 subgroups by gene expression showed that the expressions of NA‐sensing pathway genes seemed to be upregulated in subgroup C2. We further compared the expression of 15 genes and promoter region methylation between subgroups C1 and C2 (Figure 2C). Promoter region methylation was calculated as the average β‐values of probes located within the corresponding gene TSS1500 region. As expected, expression of most genes was significantly upregulated in C2, except MAVS, which showed mild but significant downregulation. With higher expression levels of NA‐sensing pathway genes, C2 seems to have more activated NA‐sensing activity. Corresponding promoter methylation of most genes was downregulated in subgroup C2. Altered methylation state could be the underlying cause of differential gene expression and distinguished subgroups C1 and C2. Moreover, we calculated the correlation between gene expression and β‐values of probes located within TSS1500. Strong negative correlations (Pearson correlation, r < −0.5) were noticed between expression and methylation of AIM2, ASC, CGAS, and STING (Figure S1).
3.3. Nucleic acid‐sensing activated subgroup C2 was associated with poor prognosis
The subgroup C2 is characterized by upregulated NA‐sensing gene expression, indicating higher NA‐sensing activity and subsequent inflammatory signaling. Nucleic acid‐sensing‐mediated inflammatory signaling is considered to be a promising therapeutic target to improve therapy responses. We then compared OS between C1 and C2 by log‐rank test within each cancer type. These 2 subgroups showed significant differences in OS in 7 cancer types (Figure 3). Except in sarcoma and ovarian cancer, C2 was associated with poor prognosis. This in a sense was contrary to the known protective effect of NA‐sensing pathways. Additional evidence was needed to determine whether upregulated gene expression of sensors and effectors in NA‐sensing pathways were synonymous with increased induction of inflammatory signaling, and whether sustained NA‐sensing activation could lead to immune evasion.
FIGURE 3.
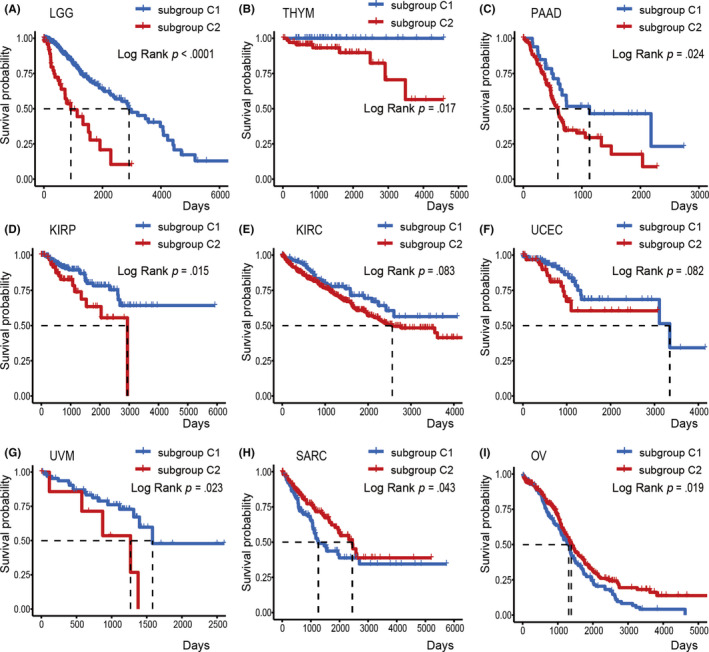
Subgroups correlate with patient overall survival. A‐I, Kaplan‐Meier plots of patients classified by different subgroups. Log‐rank tests are used to compare overall survival between subgroup C1 and C2; P values are displayed in the top right‐hand corner of each plot. KIRC, kidney renal clear cell carcinoma; KIRP, kidney renal papillary cell carcinoma; LGG, brain lower grade glioma; OV, ovarian serous cystadenocarcinoma; PAAD, pancreatic adenocarcinoma; SARC, sarcoma; THYM, thymoma; UCEC, uterine corpus endometrial carcinoma; UVM, uveal melanoma
3.4. Biological pathways enriched in subgroup C2
We undertook GSEA 21 to further assess the enriched gene sets in subgroup C2 (Figure 4A). All cancer types showed very similar patterns of enriched pathways. Biological pathways associated with immunity were the most significantly enriched. Multiple cytokines signaling are increased in C2, including IL2, IL6, IFNα, IFNβ, and TNFα. The apoptosis pathway is also upregulated. These observations reaffirm the enhanced NA‐sensing, accompanied by release of cytokines and triggered apoptosis. In addition to immunity‐related pathways, pathways associated with proliferation, DNA damage, hypoxia, EMT, and angiogenesis are among some of the most enriched processes. We further validated this result using the RPPA‐based pathway scores. 22 We examined the major signaling pathway scores defined by RPPA data in cancer types with enough samples (n > 10; Figure 4B). Apoptosis and EMT pathway scores are consistently upregulated in C2, and DDR score is upregulated in C1. On the whole, pathways enriched in C2 could both promote tumor progression and attenuate it. This might explain different prognosis predictions of C2 in different cancer types. C2 was more associated with poorer prognosis, indicating that deficient DNA damage repair and increased EMT might play a more predominant role in tumors.
FIGURE 4.

Biological pathways associated with the poor prognostic subgroup C2. A, Heatmap of normalized Gene Set Enrichment Analysis enrichment scores (NES) for gene sets enriched in subgroup C2, with false discovery rate q‐value < 0.1. Gray, not significant. DN, down; IL, interleukin; NFKB, nuclear factor‐κB; TNFA, tumor necrosis factor‐α; B, Boxplots of DNA damage response (top), apoptosis (middle), and epithelial‐mesenchymal transition (EMT) (bottom) pathway activity scores calculated from reverse‐phase protein array data between subgroup C1 (red) and C2 (blue). Mann‐Whitney U test P values are displayed for each cancer type. Proteins involved in pathway score calculation are annotated on the right. +, protein positively correlated with corresponding pathway activity; −, protein negatively correlated with corresponding pathway activity. BLCA, bladder urothelial carcinoma; BRCA, breast invasive carcinoma; CESC, cervical squamous cell carcinoma and endocervical adenocarcinoma; CHOL, cholangiocarcinoma; COAD, colon adenocarcinoma; ESCA, esophageal carcinoma; GBM, glioblastoma multiforme; HNSC, head and neck squamous cell carcinoma; KIRC, kidney renal clear cell carcinoma; KIRP, kidney renal papillary cell carcinoma; LGG, brain lower grade glioma; LIHC, liver hepatocellular carcinoma; LUAD, lung adenocarcinoma; MESO, mesothelioma; OV, ovarian serous cystadenocarcinoma; PAAD, pancreatic adenocarcinoma; READ, rectum adenocarcinoma; SARC, sarcoma; SKCM, skin cutaneous melanoma; STAD, stomach adenocarcinoma; TGCT, testicular germ cell tumor; THCA, thyroid carcinoma; THYM, thymoma; UCEC, uterine corpus endometrial carcinoma; UCS, uterine carcinosarcoma
3.5. C2 as a favorable prognostic marker for HR‐deficient tumors
We found that activated NA‐sensing in C2 was accompanied with attenuated DNA damage response. As aberrant DNA damage responses are sources of genomic instability, we compared scores characterizing the extent of mutation burden, copy number burden, aneuploidy, LOH, and HRD between subtypes (Figure 5A). 31 Nonsilent and silent mutation load measured nonsilent and silent mutations per Mb. Aneuploidy scores quantified the sum total of amplified or deleted arms. Altered CNA fractions were the fraction of bases deviating from baseline ploidy. Altered LOH fractions represented the fraction of bases with LOH events. The HRD score was the sum of 3 component scores of genomic scarring: large allelic imbalances extending into a telomere, 32 large‐scale state transitions, 33 and large non‐arm‐level regions with LOH. 34 All of these scores were significantly higher in C2 than C1. Mutation load increased mildly, while scores measuring large scale genome scar, like CNA, aneuploidy, LOH, and HRD were apparently higher in C2. These results suggest that correlation between genome instability and NA‐sensing pathways depends on genome alteration scale. Large‐scale alterations might be more effective in activating the cytosolic DNA‐sensing pathway, and could further modify the state of other pathways.
FIGURE 5.

Subgroup C2 found to be a favorable prognostic marker for homologous recombination (HR) deficient tumors. A, Somatic copy‐number alteration (CNA) scores and mutation load of 2 clusters. P values calculated using Mann‐Whitney U test. HRD, HR deficiency. B, Survival analyses of HR‐deficient patients in subgroup C1 and C2. The cancer types with adequate number of HR‐deficient patients and P value < .1 were plotted to show association between subgroups and survival. P values computed using the log‐rank test. BRCA, breast invasive carcinoma; HNSC, head and neck squamous cell carcinoma; LUSC, lung squamous cell carcinoma; OV, ovarian serous cystadenocarcinoma
Homologous recombination defect is a prevalent source of large‐scale genomic alteration, and common in some cancer types, such as breast cancer and ovarian cancer. 35 We undertook survival analysis in cancer types with enough HR gene altered samples (n > 50). Homologous recombination gene alteration includes 3 main parts: deleterious mutation, deep copy number deletion, and epigenetic silencing. We obtained gene alteration data according to a previous study. 31 Deleterious mutation includes truncating and missense mutations that have high probability of leading to loss of protein function. Deep copy‐number deletions were defined by GISTIC, and epigenetic silencing was identified through methylation vs expression analysis. Deletions and epigenetic silencing are the main causes affecting gene expression. A sample with 1 of these 3 conditions was considered as an HR gene altered sample. In contrast to previous results, the C2 subgroup was a favorable prognostic marker in HR‐deficient patients with breast carcinoma, ovarian cancer, lung squamous cell carcinoma, and head and neck squamous cell carcinoma (Figure 5B).
4. DISCUSSION
Nucleic acid sensing is an essential component of innate immunity in defending against pathogenic invasion. 1 Commonly known pathways of NA recognition are cytosolic DNA sensing converging on STING, cytosolic RNA sensing converging on MAVS, and NA‐sensing endosomal TLRs. 36 The specificity of NA sensing is limited; 2 various families of NA recognition receptors could respond to both nonself and self NAs. Nucleic acid sensing induces type I IFN response in both cancer cells and neighboring cells, amplifies the effects of multiple anticancer therapies and provides potent antitumor effects. 37
Aberrant expression patterns and prognostic implications of genes in NA recognition have been reported in cancer, 14 , 15 , 16 , 17 , 18 but usually focused on some particular gene or pathway and lacked consistent conclusions. Cross‐talk between different pathways in NA recognition exists. Stimulator of IFN genes‐induced IFN signaling promotes the transcription of endogenous retroviruses coding sequences in human genome and reverse transcription of cytosolic dsDNA, further activated RNA sensing. 13 , 38 , 39 Stimulator of IFN genes‐dependent IFN production increases RNA sensor levels and sensitizes cells to unusual accumulation of RNA. 40 , 41 We integrated gene mutation, mRNA expression, promoter methylation, proteomic status, and clinical data from TCGA pan‐cancer cohort to explore the dysregulation of NA recognition genes in cancer. The mutation frequencies of these genes appear to be quite low, but dysregulation of expression is common (Figure 1B). Nucleic acid recognition and the downstream type I IFN response might not only alter tumor behavior but also modify the tumor microenvironment. 42 , 43 , 44 So, we compared expression between tumor tissues and adjacent normal tissues, and between tumor‐adjacent normal tissues and matched GTEx normal tissues (Figure 1C,D). 45 Interestingly, the top upregulated genes in tumor tissues belong to cytosolic DNA sensing pathway, whereas the top upregulated genes in normal tissues adjacent to tumor are mostly genes involved in RNA sensing pathways. There could be complex and unclear underlying regulatory mechanisms. As there are close interactions between these pathways, 38 , 39 , 40 , 41 all these genes were used to cluster patients into subgroups. Using k‐means‐based consensus clustering, we gained 2 robust subgroups (Figure 2A), 1 with universal high NA recognition gene expression, indicating potent more activated NA sensing (Figure 2B,C).
Further study showed this C2 subgroup, with high NA recognition gene expression, was associated with poorer prognosis (Figure 3). Although NA recognition functions as a tumor suppressor by inducing cell apoptosis, 6 , 10 , 46 sustained NA recognition signaling was also reported to contribute to treatment resistance and metastasis. 13 , 47 What changes would accompany the upregulation of NA‐recognition gene expression in cancer? To answer this question, we determined which biological functions and pathways were enriched in C2 by GSEA software (Figure 4A), and further verified the result using RPPA protein data (Figure 4B). We found pro‐inflammatory cytokine signaling, like IL2, IL6, IFNα, IFNβ, and TNFα, were enriched in C2 (Figure 4A). Both antitumor processes, like apoptosis, and protumor processes, like EMT and deficient DDR, were enriched in C2 (Figure 4). The causal relationship between cytokine signaling and other processes like apoptosis and EMT is not definite. However, deficient DDR seemed to be one of the causes of NA recognition activation, 48 , 49 and is associated with more aggressive behavior of malignant tumors. What if we remove this possible upstream factor? We first verified the relatively deficient DNA damage response in C2, using genomic instability scores. 31 Scores representing large‐scale genome scars and HRD score were significantly upregulated in C2 compared to C1 (Figure 5A). This indicated that large‐scale genomic alterations, which are mainly caused by defects in HR, cause more intense activation of NA‐sensing. And the HR defect itself has a great impact on tumor prognosis. So, we undertook survival analyses in HR‐deficient patients (Figure 5B). The positive prognostic effect of C2 in HR‐deficient patients (Figure 5B) proved that, although NA recognition was associated with both antitumor and protumor processes, enhanced NA recognition and subsequent signaling was protective in HR‐deficient patients. Large‐scale gene alterations have a great impact on many aspects of cell life and activate the NA pathway more effectively than point mutations. Acute and chronic IFN responses can lead to different downstream effects. Early type I IFN response can promote the clearance of tumor cells, 7 whereas persistent inflammation with the production of pro‐inflammatory cytokines can promote tumor growth and metastasis. 50 , 51 So, from this result, NA‐sensing activation caused by HR deficiency might tend to induce relatively acute IFN responses and have an antitumor effect, which is more conducive to prognosis.
These results contribute to a better understanding of the functions and mechanisms of NA recognition and clarify the therapeutic effect of NA recognition in cancer, especially in HR‐deficient patients. As NA recognition is becoming a research hotspot in targeted therapy and its total impact on cancer remains controversial, this study lays the foundation for new molecular targeted therapy and enlarges the scope of development of new drugs.
DISCLOSURE STATEMENT
The authors declare that there are no conflicts of interest to report.
ETHICAL APPROVAL
The data extracted from TCGA database was used strictly following the publication guidelines approved by TCGA.
Supporting information
FigS1
LegendS1
ACKNOWLEDGEMENTS
This work was supported by grants to Xin‐Xia Tian and Wei‐Gang Fang from the National Natural Science Foundation of China (Nos. 81872382 and 81621063).
Yan‐Fei H, Han Y, Yan‐Ting Z, et al. Dysregulation in nucleic acid‐sensing pathway genes is associated with cancer patients’ prognosis. Cancer Sci. 2020;111:2212–2222. 10.1111/cas.14450
REFERENCES
- 1. Roers A, Hiller B, Hornung V. Recognition of endogenous nucleic acids by the innate immune system. Immunity. 2016;44(4):739‐754. [DOI] [PubMed] [Google Scholar]
- 2. Schlee M, Hartmann G. Discriminating self from non‐self in nucleic acid sensing. Nat Rev Immunol. 2016;16(9):566‐580. [DOI] [PMC free article] [PubMed] [Google Scholar]
- 3. Crow YJ, Chase DS, Lowenstein Schmidt J, et al. Characterization of human disease phenotypes associated with mutations in TREX1, RNASEH2A, RNASEH2B, RNASEH2C, SAMHD1, ADAR, and IFIH1. Am J Med Genet A. 2015;167A(2):296‐312. [DOI] [PMC free article] [PubMed] [Google Scholar]
- 4. Livingston JH, Crow YJ. Neurologic phenotypes associated with mutations in TREX1, RNASEH2A, RNASEH2B, RNASEH2C, SAMHD1, ADAR1, and IFIH1: Aicardi‐Goutieres Syndrome and beyond. Neuropediatrics. 2016;47(6):355‐360. [DOI] [PubMed] [Google Scholar]
- 5. Crow YJ, Manel N. Aicardi‐Goutieres syndrome and the type I interferonopathies. Nat Rev Immunol. 2015;15(7):429‐440. [DOI] [PubMed] [Google Scholar]
- 6. Takemura N, Kawasaki T, Kunisawa J, et al. Blockade of TLR3 protects mice from lethal radiation‐induced gastrointestinal syndrome. Nat Commun. 2014;5:3492. [DOI] [PMC free article] [PubMed] [Google Scholar]
- 7. Woo SR, Fuertes MB, Corrales L, et al. STING‐dependent cytosolic DNA sensing mediates innate immune recognition of immunogenic tumors. Immunity. 2014;41(5):830‐842. [DOI] [PMC free article] [PubMed] [Google Scholar]
- 8. Konno H, Yamauchi S, Berglund A, Putney RM, Mule JJ, Barber GN. Suppression of STING signaling through epigenetic silencing and missense mutation impedes DNA damage mediated cytokine production. Oncogene. 2018;37(15):2037‐2051. [DOI] [PMC free article] [PubMed] [Google Scholar]
- 9. Roulois D, Loo Yau H, Singhania R, et al. DNA‐demethylating agents target colorectal cancer cells by inducing viral mimicry by endogenous transcripts. Cell. 2015;162(5):961‐973. [DOI] [PMC free article] [PubMed] [Google Scholar]
- 10. Salaun B, Coste I, Rissoan MC, Lebecque SJ, Renno T. TLR3 can directly trigger apoptosis in human cancer cells. J Immunol. 2006;176(8):4894‐4901. [DOI] [PubMed] [Google Scholar]
- 11. Duewell P, Steger A, Lohr H, et al. RIG‐I‐like helicases induce immunogenic cell death of pancreatic cancer cells and sensitize tumors toward killing by CD8(+) T cells. Cell Death Differ. 2014;21(12):1825‐1837. [DOI] [PMC free article] [PubMed] [Google Scholar]
- 12. Bakhoum SF, Ngo B, Laughney AM, et al. Chromosomal instability drives metastasis through a cytosolic DNA response. Nature. 2018;553(7689):467‐472. [DOI] [PMC free article] [PubMed] [Google Scholar]
- 13. Liu Y, Gu Y, Han Y, et al. Tumor exosomal RNAs promote lung pre‐metastatic niche formation by activating alveolar epithelial TLR3 to recruit neutrophils. Cancer Cell. 2016;30(2):243‐256. [DOI] [PubMed] [Google Scholar]
- 14. He L, Wang F, Tian H, Xie Y, Xie L, Liu Z. The expression profile of RNA sensors in colorectal cancer and its correlation with cancer stages. Translational Cancer Research. 2019;8(4):1351‐1363. [DOI] [PMC free article] [PubMed] [Google Scholar]
- 15. Song S, Peng P, Tang Z, et al. Decreased expression of STING predicts poor prognosis in patients with gastric cancer. Sci Rep. 2017;7:39858. [DOI] [PMC free article] [PubMed] [Google Scholar]
- 16. Fels Elliott DR, Perner J, Li X, et al. Impact of mutations in Toll‐like receptor pathway genes on esophageal carcinogenesis. PLoS Genet. 2017;13(5):e1006808. [DOI] [PMC free article] [PubMed] [Google Scholar]
- 17. Yang CA, Huang HY, Chang YS, Lin CL, Lai IL, Chang JG. DNA‐sensing and nuclease gene expressions as markers for colorectal cancer progression. Oncology. 2017;92(2):115‐124. [DOI] [PubMed] [Google Scholar]
- 18. Zhang M, Yan Z, Wang J, Yao X. Toll‐like receptors 7 and 8 expression correlates with the expression of immune biomarkers and positively predicts the clinical outcome of patients with melanoma. Onco Targets Ther. 2017;10:4339‐4346. [DOI] [PMC free article] [PubMed] [Google Scholar]
- 19. Vivian J, Rao AA, Nothaft FA, et al. Toil enables reproducible, open source, big biomedical data analyses. Nat Biotechnol. 2017;35(4):314‐316. [DOI] [PMC free article] [PubMed] [Google Scholar]
- 20. Wilkerson MD, Hayes DN. ConsensusClusterPlus: a class discovery tool with confidence assessments and item tracking. Bioinformatics. 2010;26(12):1572‐1573. [DOI] [PMC free article] [PubMed] [Google Scholar]
- 21. Subramanian A, Tamayo P, Mootha VK, et al. Gene set enrichment analysis: a knowledge‐based approach for interpreting genome‐wide expression profiles. Proc Natl Acad Sci U S A. 2005;102(43):15545‐15550. [DOI] [PMC free article] [PubMed] [Google Scholar]
- 22. Akbani R, Ng PK, Werner HM, et al. A pan‐cancer proteomic perspective on The Cancer Genome Atlas. Nat Commun. 2014;5:3887. [DOI] [PMC free article] [PubMed] [Google Scholar]
- 23. Temizoz B, Kuroda E, Ishii KJ. Combination and inducible adjuvants targeting nucleic acid sensors. Curr Opin Pharmacol. 2018;41:104‐113. [DOI] [PubMed] [Google Scholar]
- 24. Vanpouille‐Box C, Hoffmann JA, Galluzzi L. Pharmacological modulation of nucleic acid sensors ‐ therapeutic potential and persisting obstacles. Nat Rev Drug Discov. 2019;18(11):845‐867. [DOI] [PubMed] [Google Scholar]
- 25. Hornung V, Ablasser A, Charrel‐Dennis M, et al. AIM2 recognizes cytosolic dsDNA and forms a caspase‐1‐activating inflammasome with ASC. Nature. 2009;458(7237):514‐518. [DOI] [PMC free article] [PubMed] [Google Scholar]
- 26. Kawai T, Akira S. The role of pattern‐recognition receptors in innate immunity: update on Toll‐like receptors. Nat Immunol. 2010;11(5):373‐384. [DOI] [PubMed] [Google Scholar]
- 27. Sun L, Wu J, Du F, Chen X, Chen ZJ. Cyclic GMP‐AMP synthase is a cytosolic DNA sensor that activates the type I interferon pathway. Science. 2013;339(6121):786‐791. [DOI] [PMC free article] [PubMed] [Google Scholar]
- 28. Takaoka A, Wang Z, Choi MK, et al. DAI (DLM‐1/ZBP1) is a cytosolic DNA sensor and an activator of innate immune response. Nature. 2007;448(7152):501‐505. [DOI] [PubMed] [Google Scholar]
- 29. Yoneyama M, Kikuchi M, Matsumoto K, et al. Shared and unique functions of the DExD/H‐box helicases RIG‐I, MDA5, and LGP2 in antiviral innate immunity. J Immunol. 2005;175(5):2851‐2858. [DOI] [PubMed] [Google Scholar]
- 30. Yoneyama M, Kikuchi M, Natsukawa T, et al. The RNA helicase RIG‐I has an essential function in double‐stranded RNA‐induced innate antiviral responses. Nat Immunol. 2004;5(7):730‐737. [DOI] [PubMed] [Google Scholar]
- 31. Knijnenburg TA, Wang L, Zimmermann MT, et al. Genomic and molecular landscape of DNA Damage repair deficiency across The Cancer Genome Atlas. Cell Rep. 2018;23(1):pp. 239–54 e6. [DOI] [PMC free article] [PubMed] [Google Scholar]
- 32. Birkbak NJ, Wang ZC, Kim JY, et al. Telomeric allelic imbalance indicates defective DNA repair and sensitivity to DNA‐damaging agents. Cancer Discov. 2012;2(4):366‐375. [DOI] [PMC free article] [PubMed] [Google Scholar]
- 33. Popova T, Manie E, Rieunier G, et al. Ploidy and large‐scale genomic instability consistently identify basal‐like breast carcinomas with BRCA1/2 inactivation. Cancer Res. 2012;72(21):5454‐5462. [DOI] [PubMed] [Google Scholar]
- 34. Abkevich V, Timms KM, Hennessy BT, et al. Patterns of genomic loss of heterozygosity predict homologous recombination repair defects in epithelial ovarian cancer. Br J Cancer. 2012;107(10):1776‐1782. [DOI] [PMC free article] [PubMed] [Google Scholar]
- 35. Prakash R, Zhang Y, Feng W, Jasin M. Homologous recombination and human health: the roles of BRCA1, BRCA2, and associated proteins. Cold Spring Harb Perspect Biol. 2015;7(4):a016600. [DOI] [PMC free article] [PubMed] [Google Scholar]
- 36. Tan XJ, Sun LJ, Chen JQ, Chen ZJJ. Detection of microbial infections through innate immune sensing of nucleic acids. Annu Rev Microbiol. 2018;72:447‐478. [DOI] [PubMed] [Google Scholar]
- 37. Sharma S, Fitzgerald KA, Cancro MP, Marshak‐Rothstein A. Nucleic acid‐sensing receptors: rheostats of autoimmunity and autoinflammation. J Immunol. 2015;195(8):3507‐3512. [DOI] [PMC free article] [PubMed] [Google Scholar]
- 38. Chiu YH, Macmillan JB, Chen ZJ. RNA polymerase III detects cytosolic DNA and induces type I interferons through the RIG‐I pathway. Cell. 2009;138(3):576‐591. [DOI] [PMC free article] [PubMed] [Google Scholar]
- 39. Cañadas I, Thummalapalli R, Kim JW, et al. Tumor innate immunity primed by specific interferon‐stimulated endogenous retroviruses. Nat Med. 2018;24(8):1143‐1150. [DOI] [PMC free article] [PubMed] [Google Scholar]
- 40. Liu H, Golji J, Brodeur LK, et al. Tumor‐derived IFN triggers chronic pathway agonism and sensitivity to ADAR loss. Nat Med. 2019;25(1):95‐102. [DOI] [PubMed] [Google Scholar]
- 41. Zevini A, Olagnier D, Hiscott J. Crosstalk between cytoplasmic RIG‐I and STING sensing pathways. Trends Immunol. 2017;38(3):194‐205. [DOI] [PMC free article] [PubMed] [Google Scholar]
- 42. Huang L, Xu H, Peng G. TLR‐mediated metabolic reprogramming in the tumor microenvironment: potential novel strategies for cancer immunotherapy. Cell Mol Immunol. 2018;15(5):428‐437. [DOI] [PMC free article] [PubMed] [Google Scholar]
- 43. Ridnour LA, Cheng RY, Switzer CH, et al. Molecular pathways: toll‐like receptors in the tumor microenvironment–poor prognosis or new therapeutic opportunity. Clin Cancer Res. 2013;19(6):1340‐1346. [DOI] [PMC free article] [PubMed] [Google Scholar]
- 44. Zhang CX, Ye SB, Ni JJ, et al. STING signaling remodels the tumor microenvironment by antagonizing myeloid‐derived suppressor cell expansion. Cell Death Differ. 2019;26(11):2314‐2328. [DOI] [PMC free article] [PubMed] [Google Scholar]
- 45. Aran D, Camarda R, Odegaard J, et al. Comprehensive analysis of normal adjacent to tumor transcriptomes. Nat Commun. 2017;8(1):1077. [DOI] [PMC free article] [PubMed] [Google Scholar]
- 46. Wilkins AC, Patin EC, Harrington KJ, Melcher AA. The immunological consequences of radiation‐induced DNA damage. J Pathol. 2019;247(5):606‐614. [DOI] [PubMed] [Google Scholar]
- 47. Liang H, Deng L, Hou Y, et al. Host STING‐dependent MDSC mobilization drives extrinsic radiation resistance. Nat Commun. 2017;8(1):1736. [DOI] [PMC free article] [PubMed] [Google Scholar]
- 48. Sen T, Rodriguez BL, Chen L, et al. Targeting DNA damage response promotes antitumor immunity through STING‐mediated T‐cell activation in small cell lung cancer. Cancer Discov. 2019;9(5):646‐661. [DOI] [PMC free article] [PubMed] [Google Scholar]
- 49. Ding L, Kim HJ, Wang Q, et al. Inhibition elicits STING‐dependent antitumor immunity in Brca1‐deficient ovarian cancer. Cell Rep. 2018;25(11):pp. 2972–80 e5. [DOI] [PMC free article] [PubMed] [Google Scholar]
- 50. Coussens LM, Werb Z. Inflammation and cancer. Nature. 2002;420(6917):860‐867. [DOI] [PMC free article] [PubMed] [Google Scholar]
- 51. Bakhoum SF, Cantley LC. The multifaceted role of chromosomal instability in cancer and its microenvironment. Cell. 2018;174(6):1347‐1360. [DOI] [PMC free article] [PubMed] [Google Scholar]
Associated Data
This section collects any data citations, data availability statements, or supplementary materials included in this article.
Supplementary Materials
FigS1
LegendS1