Abstract
We have previously shown that gelsolin (GSN) levels are significantly lower in the blood of patients with glioblastoma (GBM) than in healthy controls. Here, we analyzed the function of GSN in GBM and examined its clinical significance. Furthermore, microRNAs involved in GSN expression were also identified. The expression of GSN was determined using western blot analysis and found to be significantly lower in GBM samples than normal ones. Gelsolin was mainly localized in normal astrocytes, shown using immunohistochemistry and immunofluorescence. Higher expression of GSN was correlated with more prolonged progression‐free survival and overall survival. Gelsolin knockdown using siRNA and shRNA markedly accelerated cell proliferation and invasion in GBM in vitro and in vivo. The inactive form of glycogen synthase kinase‐3β was dephosphorylated by GSN knockdown. In GBM tissues, the expression of GSN and microRNA (miR)‐654‐5p and miR‐450b‐5p showed an inverse correlation. The miR‐654‐5p and miR‐450b‐5p inhibitors enhanced GSN expression, resulting in reduced proliferation and invasion. In conclusion, GSN, which inhibits cell proliferation and invasion, is suppressed by miR‐654‐5p and miR‐450b‐5p in GBM, suggesting that these miRNAs can be targets for treating GBM.
Keywords: gelsolin, glioblastoma, GSK3β, miR‐450b‐5p, miR‐654‐5p
Downregulation of gelsolin (GSN) contributed to the short survival of glioblastoma. GSN suppressed proliferation and invasion in glioma cells, possibly through the phosphorylation of glycogen synthase kinase (GSK)‐3βSer9 ,which is the inactive form of GSK3β. GSN was downregulated by microRNA (miR)‐654‐5p and miR‐450b‐5p in glioblastoma, suggesting that these miRs might be good targets for glioblastoma treatment.

Abbreviations
- EMT
epithelial‐mesenchymal transition
- GBM
glioblastoma
- GFAP
glial fibrillary acidic protein
- GSK3β
glycogen synthase kinase‐3β
- GSN
gelsolin
- miRNA
microRNA
- NC
negative control
- OS
overall survival
- PFS
progression‐free survival
- qRT‐PCR
quantitative real‐time PCR
1. INTRODUCTION
Gliomas are the most common brain tumors in the central nervous system, representing approximately 80% of primary brain tumors. 1 Among gliomas, GBM, a grade IV glioma according to the WHO, is the most malignant and aggressive. 1 It comprises 57.3% of the gliomas, and the overall survival rate 5 years postdiagnosis was reported to be only 6.8% in the United States from 2012 to 2016, even after treatment, including surgery, radiotherapy, and chemotherapy. 2
Previously, we explored the potential serum proteome for GBM using sequential window acquisition of all theoretical fragment ion mass spectrometry and quantitative targeted absolute proteomics analysis. Given the finding that the levels of GSN, the candidate biomarker, are low in patients with GBM compared to that in the control group, 3 we focused on GSN function.
Gelsolin is a calcium‐adjusted actin filament protein that can disassemble actin filaments and cap at the side of actin filaments. 4 , 5 In tumors such as colorectal cancer, gastric cancer, prostate cancer, bladder cancer, breast cancer, kidney cancer, ovarian cancer, and pancreatic cancer, GSN levels are reduced, and it acts as a cancer inhibitor. 5 Inhibition of GSN expression promotes cancer cell motility and invasion. 6 However, it was revealed that the function of GSN is complex and is sometimes contradictory in tumors, not only among different types but also within the same tumor. 7 Its biological characteristics and related mechanisms in GBM remain unknown. Few mutations on the GSN gene have been verified; therefore, most of the focus has been on the epigenetic regulation mechanisms, such as histone deacetylation, DNA methylation, and miRNA regulation. MicroRNAs are small noncoding, single‐stranded RNAs composed of 21‐25 nucleotides that can bind to the 3ʹ‐UTR of the target mRNA and silence the translation progress. 8 Until now, many miRNAs, named oncomiRs, have been proven to be essential in tumorigenesis. Among these, some are overexpressed and function as oncogenes. 9
Here, we report that GSN is downregulated in GBM. We also reveal the functional relevance of GSN and miRNA interference by showing that GSN expression is blocked by miR‐654‐5p and miR‐450b‐5p and that it is negatively correlated with the expression of these miRNAs.
2. MATERIAL AND METHODS
2.1. Cell culture
Human GBM cell lines U251, SNB19, T98G, A172, and U87, were obtained from the European Collection of Cell Cultures and were cultured as previously described. 10
2.2. Patient samples
Glioblastoma IDH WT tissues were obtained from patients under neurosurgical resection, who did not receive radiotherapy or chemotherapy. Nonneoplastic healthy brain tissues adjacent to tumors were acquired. The tissues were frozen at −80°C before use or immersed in 4% paraformaldehyde to obtain paraffin‐embedded sections. All tissues were categorized according to the WHO classification. 1 The procedure was implemented according to the institutional research review board‐approved protocol and was approved by the medical ethics committee at Kanazawa University (No. 2784).
2.3. Quantitative RT‐PCR
An RNeasy Mini Kit (Qiagen) was used for total RNA extraction from cells and tissues. cDNA was synthesized using Transcriptor Universal cDNA Master (Roche Diagnostics) with 1 μg total RNA, and mRNA levels were quantified using qTOWER3G and MasterPLUS SYBR Green (Roche Diagnostics) with the Analytik Jena qPCR soft 3.4 system. The primers used in this reaction (Sigma) were as follows: GSN sense, 5′‐AGGTGTGGCATCAGGATTCA‐3′; GSN antisense, 5′‐ ATTGCTGTTGGAACCACACC‐3′; β‐actin sense, 5′‐CTACAATGAGCTGCGTGTGGC‐3′; β‐actin antisense, 5′‐CAGGTCCAGACGCAGGATGGC‐3′; SNAIL1 sense, 5′‐CCTCCCTGTCAGATGAGGAC‐3′; SNAIL1 antisense, 5′‐ ATTGCTGTTGGAACCACACC‐3′; SNAIL2 sense, 5′‐CCTCCCTGTCAGATGAGGAC‐3′; SNAIL2 antisense, 5′‐CCAGGCTGAGGTATTCCTTG‐3′; ZEB1 sense, 5′‐TAAGAGCGCTAGCTGCCAAT‐3′; ZEB1 antisense, 5′‐TTTCTTTTTGGGCGGTGTAG‐3′; ZEB2 sense, 5′‐AGAAAATGACCTGCCACCTG‐3′; ZEB2 antisense, 5′‐GATCTGTCCCTGGCTTGTGT‐3′; GSK3β sense, 5′‐ GCTTTTGGCAGCATGAAAGTTAGC‐3′; and GSK3β antisense, 5′‐ TTCTCCTGAATCACAAAGTTTGGC‐3′.
Total RNA was extracted and purified using a mirVana miRNA isolation kit and phenol (AM1560) (Thermo Fisher Scientific) was used for miRNA assay. Reverse transcription of miRNA was carried out using a TaqMan Reverse Transcription Kit (Thermo Fisher Scientific). MicroRNA (miR‐324‐3p, miR‐450b‐5p, miR‐541‐3p, miR‐654‐5p, miR‐760, and RNU6B) expression levels were determined using TaqMan MicroRNA assays (Thermo Fisher Scientific) and ViiA7 software version 1.2 (Thermo Fisher Scientific). Both mRNA and miRNA expression was normalized to that of β‐actin and RNU6B, respectively.
2.4. Western blot analysis
Western blot analysis was undertaken as previously described. 11 The PVDF membranes were incubated with a primary rabbit monoclonal anti‐GSN Ab (1:25 000, EPR1942, ab109014; Abcam), rabbit anti‐p‐GSK3βSer9 Ab (9336s, 1:1000; Cell Signaling Technology), mouse anti‐p‐GSK3βTyr216 Ab (612 313, 1:1000; BD Biosciences), and mouse anti‐GSK3β Ab (610 202, 1:1000, BD Biosciences).
2.5. Immunohistochemistry
Immunohistochemistry was carried out as described previously. 12 Paraffin‐embedded tissue sections (4 μm thick) were stained using a rabbit monoclonal anti‐GSN Ab (1:5000 dilution; EPR1942, ab109014; Abcam).
2.6. Immunofluorescence assay
Immunofluorescence assay was carried out following a previously published protocol. 10 Anti‐GFAP Ab (1:2000, M0761; Dako), rabbit monoclonal anti‐GSN Ab (1:3000 dilution; EPR1942, ab109014; Abcam), and Alexa Fluor 568 phalloidin (1:1000 dilution; Thermo Fisher Scientific) were used.
2.7. Targets silencing using siRNA, shRNA, or miRNA inhibitor
Two kinds of siRNA, for GSN and negative control, were purchased from Qiagen. The target sequence‐1 of human siGSN (Sl02664046) was 5′‐AACGATGCCTTTGTTCTGAAA‐3′; the target sequence‐2 of siGSN (Sl02664039) was 5′‐CAGCTACATCATTCTGTACAA‐3′. The target sequence‐1 of siGSK3β (SI00605472) was 5′‐AACACTGGTCACGTTTGGAAA‐3′; the target sequence‐2 of siGSK3β (SI00605479) was 5′‐CTGCATTTATCGTTAACCTAA‐3′. MicroRNA‐654‐5p inhibitor (Dharmacon), miR‐450b‐5p inhibitor (Dharmacon), and miRNA hairpin inhibitor negative control (Dharmacon) were purchased for miRNA inhibition. The siRNA (20 nmol/L) or miRNA inhibitor (20 nmol/L) was added to each well of a 6‐well plate (2 × 10⁵ cells), using Avalanche‐Omni Transfection Reagent (Apro Science). Cells were tested after 48 hours of culture. Gelsolin shRNA (h) Lentiviral Particles (sc‐37330‐V; Santa Cruz Biotechnology) and Control shRNA Lentiviral Particles‐A (sc‐108080; Santa Cruz Biotechnology) were transduced using Polybrene (sc‐134220; Santa Cruz Biotechnology). Cells stably transduced with shRNA were filtered using puromycin dihydrochloride (sc‐108071; Santa Cruz Biotechnology). All steps were implemented according to the manufacturer’s protocol.
2.8. Proliferation assay
A proliferation assay was undertaken using CCK‐8 (Dojindo) as per the manufacturer’s instructions. The cells were seeded into 96‐well plates (Corning) at a density of 1 × 10³ cells/100 μL. After 0, 24, 48, and 72 hours of incubation in culture medium supplemented with 10% FBS at 37°C, 10 μL CCK‐8 reagent was added to each well, and the plate was incubated for 2 hours. The relative proliferation of the cells was determined by measuring the absorbance at 450 nm using a microplate reader (Bio‐Rad). The average optical density value from 5 wells in each group was calculated and plotted.
2.9. Invasion assay
The invasion activity was assessed using a Matrigel precoated invasion Transwell chamber (6.5‐mm diameter, 8‐μm pore size; Corning). After 2 hours of preincubation in DMEM at 37°C, 1 × 10⁵ GBM cells were resuspended in DMEM without FBS, and penicillin‐streptomycin was added into each Transwell. The Transwell chamber was placed into a 24‐well plate (Corning), then DMEM containing 10% FBS was added. After 6 hours of incubation, noninvasive cells on the upper surface of the filter were removed, and the invasive cells on the lower surface were fixed with methanol and stained using a Diff‐Quik kit (Sysmex). The number of invading cells in 5 microscopic fields was randomly selected and counted.
2.10. In vivo studies
Female nude mice (BALB/cSlc‐nu/nu) at 5 weeks of age were obtained from Charles River Laboratories, and were divided into 2 groups (5 mice in each group). U87‐shNC or U87‐shGSN (1 × 10⁵) was implanted stereotactically into the right hemisphere, at a 5‐mm depth from the skull surface, 2 mm to the midline, and 2 mm posterior to the bregma. The weight of each mouse was monitored every 5 days. After 26 days, the brain of each mouse was obtained and submerged in 4% paraformaldehyde for paraffin preparation.
2.11. Statistical analysis
Student’s t test was used to calculate the significance between 2 groups and a log‐rank (Mantel‐Cox) analysis was used to determine the statistical significance of the Kaplan‐Meier survival curve. P < .05 was defined as statistically significant. Statistical analysis was undertaken using GraphPad Prism 5 software.
3. RESULTS
3.1. Gelsolin is downregulated in GBM and is positively correlated with survival
Previously, we had shown that GSN expression levels are lower in the blood samples of patients with GBM compared with healthy controls. 3 In order to determine the expression pattern of GSN in GBM, we compared 5 GBM tissues and the adjacent healthy brain tissues using western blot analysis. The results showed that GSN expression was lower in GBM tissues, whereas it was higher in the healthy brain tissues (Figure 1A). Furthermore, we also undertook western blot analysis with proteins extracted from 8 healthy brain tissues and 39 GBM tissues to measure their band density. All the band densities were primitively standardized against β‐actin (Figure 1B). Localization of GSN was determined by immunohistochemistry in healthy brain (n = 2) and GBM (n = 13) paraffin samples (Figure 1C). The results indicated that GSN was downregulated in GBM. A dual immunofluorescence assay was carried out using GSN and GFAP (the marker for astrocytes) Abs to elucidate whether astrocytes express GSN. Our results showed that astrocytes expressed GSN (Figure 1D), thus explaining why GSN was expressed at high levels in healthy brain cells and at low levels in GBM cells. Low expression of GSN in GBM has been proven; thus, we hypothesized that the higher expression of GSN indicates more prolonged PFS and OS in patients with GBM. According to the band intensities (Figure 1B), we distributed 39 patients into two groups; higher GSN (n = 19) and lower GSN (n = 20). We compared OS and PFS between these 2 groups using a Kaplan‐Meier survival curve, which showed that individuals who expressed higher levels of GSN had prolonged PFS and OS (Figure 1E).
FIGURE 1.
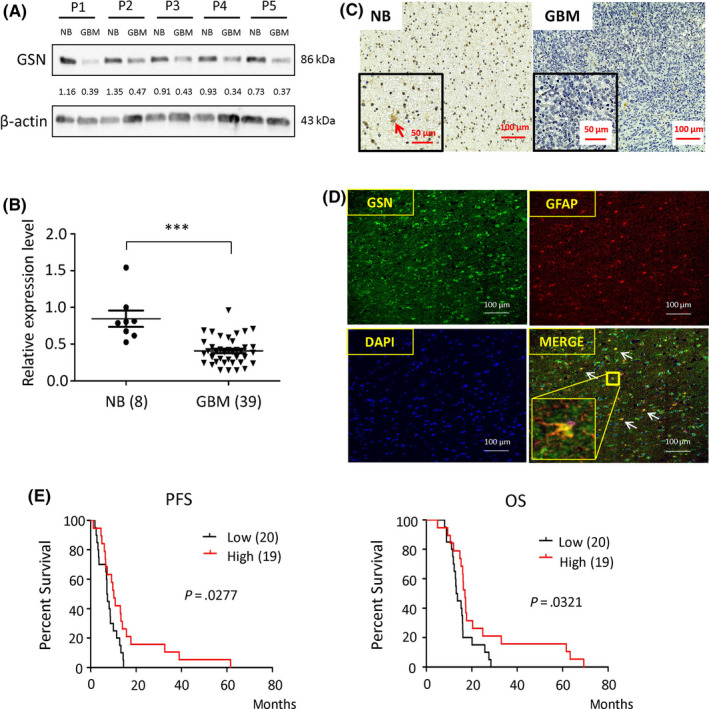
Gelsolin (GSN) levels are decreased in glioblastoma (GBM) and are positively related to progression‐free survival (PFS)/overall survival (OS) in patients with GBM. A, GSN expression was tested in 5 pairs of normal brain (NB) tissue and GBM tissue by western blotting. P, patient. B, Expression of NB (n = 8) and GBM (n = 39) is evaluated by western blotting based on band intensity. ***P < .001. A significant difference between the 2 groups is shown. Significance was evaluated by Student’s t test. C, Immunohistochemistry was carried out on NB (n = 2) and GBM (n = 13) sections. Red arrow indicates the cell expressing GSN. Magnification, 200×. D, Dual stain immunofluorescence was carried out on NB sections with GSN (green), glial fibrillary acidic protein (GFAP; red), and DAPI (blue). White arrows indicate the cell expressing GSN and GFAP. Magnification, 200×. E, Kaplan‐Meier survival curves indicate that higher expression of GSN results in longer PFS (P = .0277) and OS (P = .0321). Log‐rank (Mantel‐Cox) analysis
3.2. Gelsolin knockdown changes the phenotype of GBM cells
Because of the unequivocally low expression of GSN in GBM samples, we thought that low expression levels of GSN are vital for malignant GBM phenotype maintenance. We used 2 sequences of siGSN to knockdown GSN in vitro. First, we analyzed the expression of GSN in 5 different GBM cell lines (U87, U251, SNB19, T98G, and A172) using western blotting (Figure 2A). Comparison of these cell lines showed that U251, A172, and U87 displayed higher expression of GSN than others; therefore, we used these 3 cell lines for further experiments. After transfecting U251, A172, and U87 with siGSN‐1 and siGSN‐2 at a final concentration of 20 nmol/L for 48 hours, we measured the depletion levels, and the expression of GSN was successfully reduced at the protein and mRNA levels (Figures 2B and S1A). Tanaka et al previously reported that GSN knockdown elongates the shape of epithelial cells, which is a characteristic of EMT that might be related to cell motility. 6 On account of the researchers’ conclusion and GSN acting as a cell motion adjustment protein, we undertook immunofluorescence staining with phalloidin and observed the change in cell appearance. Consistently, the expression levels of EMT markers (SNAIL1, SNAIL2, ZEB1, and ZEB2) were enhanced, as observed with qRT‐PCR. This suggested that GSN played a role in cell motility and EMT in GBM cells (Figures 2C and S1B‐D).
FIGURE 2.
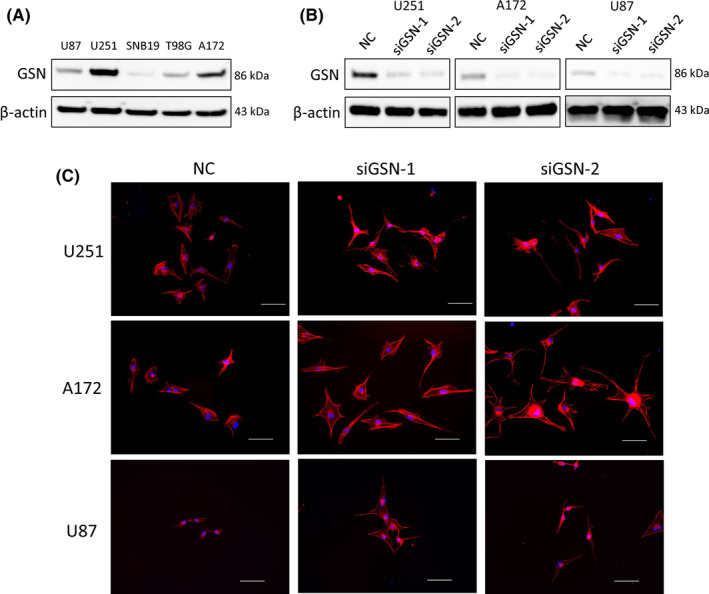
Gelsolin (GSN) knockdown by siGSN changes the phenotype of glioblastoma (GBM) cells. A, Expression of GSN in GBM cell lines was tested by western blotting. B, Effect of siGSN (20 nmol/L) on GSN expression was investigated by western blot analysis in GBM cell lines. C, Immunofluorescence with phalloidin (red) was carried out on U251, A172, and U87 cells. Blue, DAPI. Magnification, 200×. NC, negative control
3.3. Gelsolin knockdown promotes proliferation and invasion in vitro through suppression of inactive GSK3β
Cell viability and invasion were assessed using WST‐8 after 24, 48, and 72 hours, and Boyden chambers (Corning) after 6 hours. Downregulation of GSN resulted in a phenotype in which cell viability and invasion ability were notably enhanced (Figure 3A, B). In addition, alteration of the signaling induced by depletion of GSN was investigated, while no positive results were observed in AKT, ERK, STAT3, or p38 signaling pathways. Our previous data indicated that GSK3β is upregulated in GBM, and the inhibition of GSK3β suppresses the viability of GBM cell lines. 13 Western blot data showed that phosphorylated GSK3βSer9, which is the inactive form, was reduced when the cells were transfected with siGSN (Figure 3C). To further determine the role of GSK3β, we used siRNAs against GSK3β and assessed the effects on cell proliferation and invasion after cotransfection with siGSN‐1. As expected, cotransfection with siGSK3β abrogated the increase in proliferation and invasion by siGSN transfection in all cell lines (Figure S2). Thus, decreased GSN maintained cell viability through inhibiting GSK3β inactivation.
FIGURE 3.
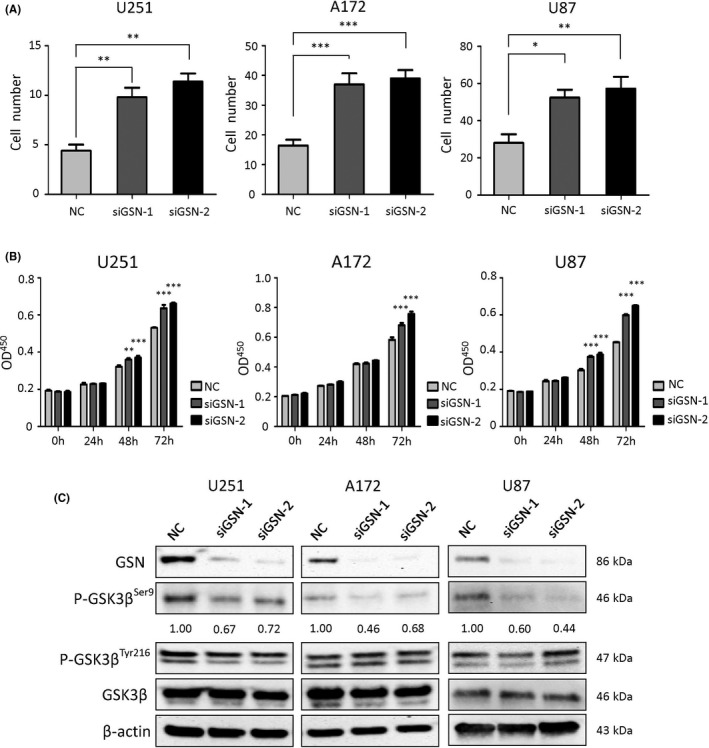
Gelsolin (GSN) knockdown results in enhanced proliferation and invasion ability through glycogen synthase kinase‐3β (GSK3β). A, Transfected cells were stained and counted to determine the invasion ability. *P < .05; **P < .01; ***P < .001 vs negative control (NC), 1‐way ANOVA. B, Proliferation was determined by CCK‐8 analysis and measured by optical density (OD450) value at 0, 24, 48, and 72 h. **P < .01; ***P < .001 vs NC, 2‐way ANOVA. C, After transfection with siGSN (20 nmol/L), the expression of GSN, GSK3β, phosphorylated GSK3β serine9 (p‐GSK3βSer9), and phosphorylated GSK3β tyrosine 216p‐(GSK3βTyr216) was determined. Band intensity was measured
3.4. Gelsolin knockdown enhanced viability of GBM cells in vivo
We introduced lentivirus shRNA for GSN and achieved stable transfection with lower GSN expression to test the role of GSN in GBM. We chose U87 for shRNA transfection and stable lower GSN expression (Figure 4A). After injecting U87‐shNC or U87‐shGSN (1 × 10⁵ cells) into mice brains, we monitored the weight change every 5 days. Twenty‐five days later, the weight of the shGSN group was notably decreased. The final weight data were collected on day 26 before mice were killed, and their brains were extracted. Weight change curves showed a discrepancy between shNC and shGSN groups (Figure 4B). Slide sections were stained with H&E, and the size of the tumors was determined using ImageJ software (Wayne Rasband, NIH, USA). The tumor size in the shGSN group was larger than that in the shNC group (Figure 4C, D).
FIGURE 4.
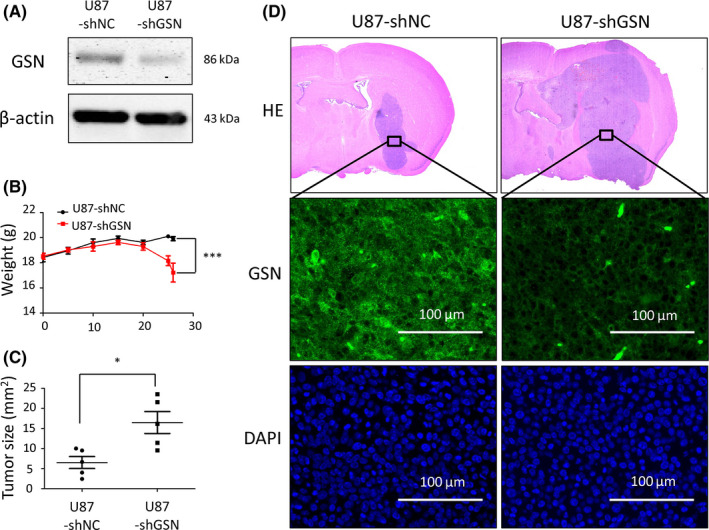
Gelsolin (GSN) knockdown resulted in enhanced viability of glioblastoma (GBM) cells in vivo. A, U87 cells transfected with shGSN showed downregulated GSN expression by western blot analysis. B, Weight of mice (n = 10) was measured for 26 d to make weight curve lines. ***P < .001, 2‐way ANOVA. C, D, Slide sections of mouse brain were stained with H&E, and the size of tumor on the slide section was tested individually by ImageJ software. Magnification, 20×. *P < .05, Student’s t test. Expression was investigated by immunofluorescence: GSN, green; DAPI, blue. Magnification, 400×. NC, negative control
3.5. Gelsolin levels are negatively related to miR‐654‐5p and miR‐450b‐5p levels
We focused on epigenetic factors, such as miRNA, which might play an important role in the decreased expression of GSN in GBM, to investigate the mechanism of GSN expression regulation. We used the miRSystem database, which contains multiple miRNA databases, including Validation, DIANA, miRanda, miRBridge, PicTar, PITA, rna22, and TargetScan, to search for candidate miRNAs that might affect GSN expression. After retrieval, miRNAs (miR‐124‐3p, miR‐141‐3p, miR‐200a‐3p, miR‐506‐3p, miR‐654‐5p, miR‐450b‐5p, miR‐541‐3p, miR‐324‐3p, and miR‐760) that were suggested by more than 2 databases were selected at the first step. The role of miR‐124‐3p, miR‐141‐3p, miR‐200a‐3p, and miR‐506‐3p acting as suppressors of the glioma metabolism has been confirmed by other research groups 14 , 15 , 16 , 17 ; thus, we investigated the expression levels of the remaining 5 miRNAs (miR‐654‐5p, miR‐450b‐5p, miR‐541‐3p, miR‐324‐3p, and miR‐760) in GBM and healthy brain tissues (Figure 5A). Results showed that miR‐654‐5p and miR‐450b‐5p were highly expressed in GBM. However, the other 3 miRNAs showed inconsistent results in different patients. We also evaluated the relationship between GSN and these 5 candidate miRNAs using qRT‐PCR and Spearman’s r evaluation in 30 patients with GBM (Figure 5B). MicroRNA‐654‐5p (Spearman’s r = −0.5165, P = .0035) and miR‐450b‐5p (Spearman’s r = −0.4553, P = .0115) showed a negative correlation with GSN expression. Therefore, the downregulation of GSN in GBM might be triggered by miR‐654‐5p and miR‐450b‐5p.
FIGURE 5.
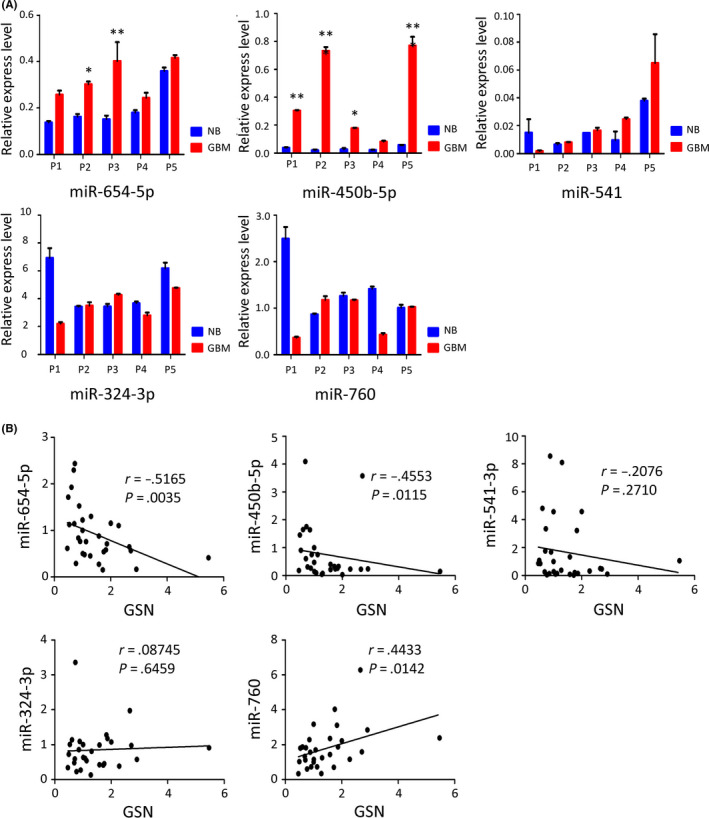
MicroRNA (miR)‐654‐5p and miR‐450b‐5p are negatively related to gelsolin (GSN) expression levels. A, Expression levels of miR‐654‐5p, miR‐450b‐5p, miR‐541‐3p, miR‐324‐3p, and miR‐760 were investigated using quantitative real‐time (qRT)‐PCR, and was higher in glioblastoma (GBM) compared with normal brain. *P < .05; ***P < .001, 1‐way ANOVA. B, Correlation between miRNAs and GSN was evaluated in GBM tissues (n = 30) by qRT‐PCR: miR‐654‐5p, r = −0.5165, P = .0035; miR‐450b‐5p, r = −0.4553, P = .0115, calculated using Spearman’s correlation test
3.6. Inhibition of miR‐654‐5p and miR‐450b‐5p enhances GSN expression and inhibits the viability of GBM cell lines
After observing the negative relationship between the expression of miRNAs (miR‐654‐5p and miR‐450b‐5p) and GSN mRNA, we investigated their expression levels in GBM cell lines (Figure 6A) and the effect of miRNA inhibitors on GSN mRNA expression levels and cell ability. SNB19, which expressed high levels of these miRNAs and low levels of GSN, was transfected with a miRNA inhibitor (20 nmol/L) for 48 hours. The results showed that the mRNA expression levels of GSN were enhanced after the addition of miR‐654‐5p (P = .0213) and miR‐450b‐5p inhibitors (P = .0288) (Figure 6B). In addition to the influence on GSN expression levels, we transfected the GBM cells with the same miRNA inhibitors at different incubation times to evaluate the cell viability, using CCK‐8 and invasion assays with the Transwell chamber. The result indicated that the cell invasion was attenuated (Figure 6C); the proliferation ability was cut down prominently as the incubation time increased (Figure 6D). Consistent with the results for SNB19, miR‐654‐5p or miR‐450b‐5p inhibition led to the rise in GSN expression levels and reduced cell viability in a time‐dependent manner. Inhibition of miR‐654‐5p and miR‐450b‐5p caused stress in the proliferation and invasion ability in vitro. Our data proved that miR‐654‐5p and miR‐450b‐5p inhibited GSN expression in GBM, and reduced the proliferation and invasion of GBM, possibly through phosphorylating GSK3βSer9, which is the inactive form of GSK3β (Figure 6E).
FIGURE 6.
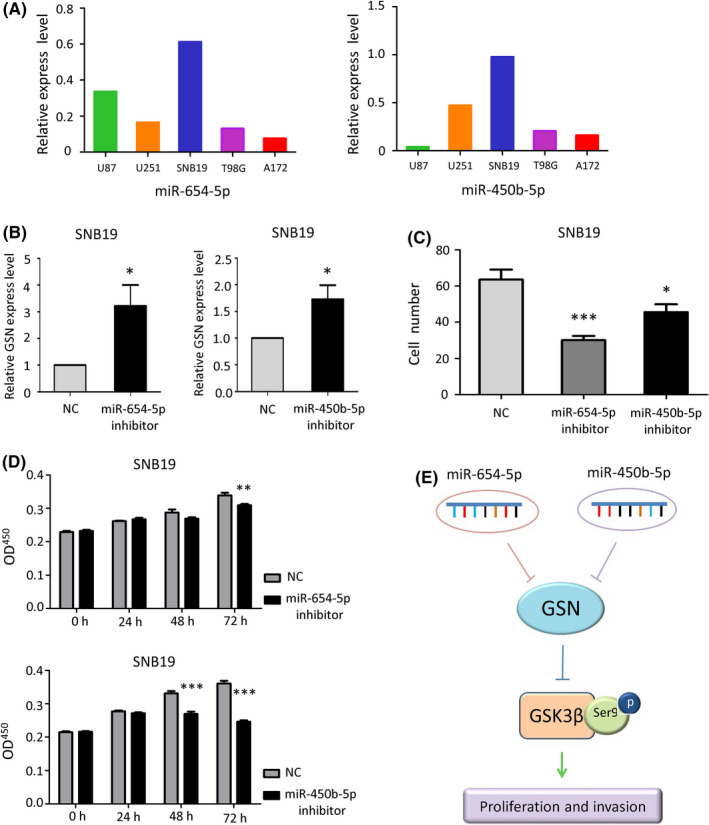
MicroRNA (miR)‐654‐5p and miR‐450b‐5p inhibitors reduced cell viability through gelsolin (GSN) in glioblastoma (GBM) cell lines. A, Expression of miR‐654‐5p and miR‐450b‐5p in GBM cell lines was detected by quantitative real‐time (qRT)‐PCR. B, After treatment with miR‐654‐5p and miR‐450b‐5p inhibitors, GSN expression was enhanced, as determined using qRT‐PCR. *P < .05, Student’s t test. C, Cell invasion ability influenced by miR inhibitors were measured using invasion chambers, and cell numbers were calculated. *P < .05; ***P < .001, 1‐way ANOVA. D, Proliferation was measured in cells treated with 20 nmol/L miRNA inhibitors. **P < .01; ***P < .001, 2‐way ANOVA. OD, optical density. E, Function of GSN and its related molecules in GBM. GSK, glycogen synthase kinase; NC, negative control
4. DISCUSSION
Gelsolin is an essential protein, and its abnormal expression is observed in multiple tumor types. In our previous study, we found that GSN is expressed at low levels in patients with GBM, and determined that it can act as an indicator for poor prognosis. 3 The results of this study confirmed that GSN is expressed at low levels in GBM tissues compared to healthy brain tissues, perhaps because of the ability of astrocytes to express GSN.
The combination of band intensities in western blot analysis and the patient clinical data indicated a positive correlation between GSN expression levels and survival time, consistent with our previous data. 3 Our results are also in agreement with those of Ohnishi et al, 18 which showed low expression levels of GSN in cerebrospinal fluid and paraffin‐embedded tissues in high‐grade astrocytomas compared to that in healthy brain samples, and that this phenomenon is associated with poor prognosis. There is evidence that GSN is involved in the development of human bladder cancer and gastric cancer, in addition to glioma. 19 , 20 Deng et al proved that GSN expression levels are upregulated in hepatocellular carcinomas. 21 In stage I and II non‐small lung cancer, higher GSN expression levels indicate poor prognosis and radioresistance behavior. 22 , 23 This diversity in the association of GSN expression levels with different cancer types indicates the tumor specificity of GSN. Our data revealed that GSN knockdown could enhance the proliferation and invasion ability in GBM cell lines. Concordantly, overexpression of GSN was associated with cyto‐inhibition of carcinoma cells in colon cancer and gastric cancer 24 , 25 ; thus, GSN displays an inhibitory function in a variety of tumors. To our knowledge, this is the first functional study on the mechanism of GSN regulation in GBM cell lines.
Tanaka et al 6 described a morphological change due to GSN knockdown, which was similar to that observed during EMT. Although EMT in GBM was controversially discussed, GBM showing an EMT‐like change has been widely studied. 26 Our results showed the enhancement of EMT by GSN knockdown, which could help explain the migration‐inhibiting effect of GSN on GBM cell shape. We also found that GSN knockdown accelerated cell activity by resulting in the inhibition of GSK3β phosphorylation at Ser9, leading to the activation of GSK3β. Our previous study 13 found that GSK3β is upregulated and plays an essential role as an oncogenic gene. A GSK3β inhibitor could suppress viability in GBM cell lines and shows an additive effect with temozolomide. Glycogen synthase kinase‐3β is also required for the maintenance of glioma stem cells and simultaneously promoting oncogenesis, 27 which indicates that GSN is a glioma inhibitor, thus aligning with our results.
Few mutations or gene alterations have been identified on GSN. Most studies have focused on the molecules upstream of GSN or changes at the promoter level. We found that miR‐654‐5p and miR‐450b‐5p were upregulated in GBM tissues compared with healthy brain tissues, and both of these miRNAs had a negative correlation with GSN expression. Inhibition of miR‐654‐5p and miR‐450b‐5p increased the mRNA levels of GSN and inhibited the viability of GBM cell lines. To our best knowledge, this is the first time that these 2 miRNAs are being reported to regulate GSN expression levels. They also show a paradoxical influence on other types of tumors. MicroRNA‐654‐5p was found in high levels in late‐stage oral squamous cell carcinoma, leading to poor prognosis, and accelerating proliferation in vitro. 28 It also significantly decreases cell viability in breast cancer and is associated with advanced stage and poor prognosis. 29 In colorectal cancer, miR‐450b‐5p is upregulated and acts as an oncogenic miRNA that increases proliferation and decreases apoptosis. 30 Based on the above results, we can conclude that miR‐654‐5p and miR‐450b‐5p might have different functions in various tumors. As the expression levels of the 2 miRNAs were not accurately correlated with GSN expression levels, especially in U251 cells, other factors might also have been related to controlling GSN expression. In addition to miRNAs, other types of epigenetic modifications, such as histone acetylation and methylation, have been reported to regulate the expression levels of GSN in cancers. Genes like ATF‐1 and Egr‐1 were also reported to affect GSN expression levels by acting upstream of GSN. 31 , 32 Thus, GSN is an indispensable middle molecule in tumor progression.
In conclusion, our results indicate that GSN inhibits GBM; downregulation of GSN results in the promotion of the proliferation and invasion ability of GBM cell lines and the miR‐654‐5p + miR‐450b‐5p/GSN/GSK3β signaling pathway could play a critical role in GBM cell lines. In future, GSN could be considered a diagnostic biomarker for GBM and miR‐654‐5p/miR‐450b‐5p could be therapeutic targets in the treatment of GBM.
CONFLICT OF INTEREST
No conflicts of interest are declared by the authors.
Supporting information
Fig S1‐S2
ACKNOWLEDGMENTS
We thank E. Komura and Anri Machi for preparing delicate histopathological sections. This work was supported by JSPS KAKENHI (16K15645 and 18H02910 to MN), grants from AMED under Grant Number JP20cm0106463 (to MN), Kobayashi International Scholarship Foundation (to MN), and the intramural clinical research grant from Kanazawa University Hospital (to MN).
Zhang J, Furuta T, Sabit H, et al. Gelsolin inhibits malignant phenotype of glioblastoma and is regulated by miR‐654‐5p and miR‐450b‐5p. Cancer Sci. 2020;111:2413–2422. 10.1111/cas.14429
Contributor Information
Shiguang Zhao, Email: guangsz@hotmail.com.
Mitsutoshi Nakada, Email: mnakada@med.kanazawa-u.ac.jp.
REFERENCES
- 1. Schwartzbaum JA, Fisher JL, Aldape KD, Wrensch M. Epidemiology and molecular pathology of glioma. Nat Clin Pract Neurol. 2006;2(9):494‐503. [DOI] [PubMed] [Google Scholar]
- 2. Ostrom QT, Cioffi G, Gittleman H, et al. Statistical Report: Primary Brain and Other Central Nervous System Tumors Diagnosed in the United States in 2012–2016. Neuro Oncol. 2019;21(Supplement_5):v1‐v100. [DOI] [PMC free article] [PubMed] [Google Scholar]
- 3. Miyauchi E, Furuta T, Ohtsuki S, et al. Identification of blood biomarkers in glioblastoma by SWATH mass spectrometry and quantitative targeted absolute proteomics. PLoS ONE. 2018;13(3):e0193799. [DOI] [PMC free article] [PubMed] [Google Scholar]
- 4. Sun HQ, Yamamoto M, Mejillano M, Yin HL. Gelsolin, a multifunctional actin regulatory protein. J Biol Chem. 1999;274(47):33179‐33182. [DOI] [PubMed] [Google Scholar]
- 5. Li GH, Arora PD, Chen YU, McCulloch CA, Liu P. Multifunctional roles of gelsolin in health and diseases. Med Res Rev. 2012;32(5):999‐1025. [DOI] [PubMed] [Google Scholar]
- 6. Tanaka H, Shirkoohi R, Nakagawa K, et al. siRNA gelsolin knockdown induces epithelial‐mesenchymal transition with a cadherin switch in human mammary epithelial cells. Int J Cancer. 2006;118(7):1680‐1691. [DOI] [PubMed] [Google Scholar]
- 7. Feldt J, Schicht M, Garreis F, Welss J, Schneider UW, Paulsen F. Structure, regulation and related diseases of the actin‐binding protein gelsolin. Expert Rev Mol Med. 2019;20:e7. [DOI] [PubMed] [Google Scholar]
- 8. He L, Hannon GJ. MicroRNAs: small RNAs with a big role in gene regulation. Nat Rev Genet. 2004;5(7):522‐531. [DOI] [PubMed] [Google Scholar]
- 9. Esquela‐Kerscher A, Slack FJ. Oncomirs ‐ microRNAs with a role in cancer. Nat Rev Cancer. 2006;6(4):259‐269. [DOI] [PubMed] [Google Scholar]
- 10. Kawahara Y, Furuta T, Sabit H, et al. Ligand‐dependent EphB4 activation serves as an anchoring signal in glioma cells. Cancer Lett. 2019;449:56‐65. [DOI] [PubMed] [Google Scholar]
- 11. Nakada M, Anderson EM, Demuth T, et al. The phosphorylation of ephrin‐B2 ligand promotes glioma cell migration and invasion. Int J Cancer. 2010;126(5):1155‐1165. [DOI] [PMC free article] [PubMed] [Google Scholar]
- 12. Nakada M, Niska JA, Miyamori H, et al. The phosphorylation of EphB2 receptor regulates migration and invasion of human glioma cells. Cancer Res. 2004;64(9):3179‐3185. [DOI] [PubMed] [Google Scholar]
- 13. Miyashita K, Kawakami K, Nakada M, et al. Potential therapeutic effect of glycogen synthase kinase 3beta inhibition against human glioblastoma. Clin Cancer Res. 2009;15(3):887‐897. [DOI] [PubMed] [Google Scholar]
- 14. Zhang G, Chen L, Khan AA, et al. miRNA‐124‐3p/neuropilin‐1(NRP‐1) axis plays an important role in mediating glioblastoma growth and angiogenesis. Int J Cancer. 2018;143(3):635‐644. [DOI] [PubMed] [Google Scholar]
- 15. Wang M, Hu M, Li Z, Qian D, Wang B, Liu DX. miR‐141‐3p functions as a tumor suppressor modulating activating transcription factor 5 in glioma. Biochem Biophys Res Commun. 2017;490(4):1260‐1267. [DOI] [PMC free article] [PubMed] [Google Scholar]
- 16. Liu YY, Chen MB, Cheng L, et al. microRNA‐200a downregulation in human glioma leads to Galphai1 over‐expression, Akt activation, and cell proliferation. Oncogene. 2018;37(21):2890‐2902. [DOI] [PubMed] [Google Scholar]
- 17. Peng T, Zhou L, Zuo L, Luan Y. MiR‐506 functions as a tumor suppressor in glioma by targeting STAT3. Oncol Rep. 2016;35(2):1057‐1064. [DOI] [PubMed] [Google Scholar]
- 18. Ohnishi M, Matsumoto T, Nagashio R, et al. Proteomics of tumor‐specific proteins in cerebrospinal fluid of patients with astrocytoma: usefulness of gelsolin protein. Pathol Int. 2009;59(11):797‐803. [DOI] [PubMed] [Google Scholar]
- 19. Tanaka M, Mullauer L, Ogiso Y, et al. Gelsolin: a candidate for suppressor of human bladder cancer. Cancer Res. 1995;55(15):3228‐3232. [PubMed] [Google Scholar]
- 20. Yuan X, Wang W, Li J, et al. Gelsolin suppresses gastric cancer metastasis through inhibition of PKR‐p38 signaling. Oncotarget. 2016;7(33):53459‐53470. [DOI] [PMC free article] [PubMed] [Google Scholar]
- 21. Deng B, Fang J, Zhang X, Qu L, Cao Z, Wang B. Role of gelsolin in cell proliferation and invasion of human hepatocellular carcinoma cells. Gene. 2015;571(2):292‐297. [DOI] [PubMed] [Google Scholar]
- 22. Shieh DB, Godleski J, Herndon JE, et al. Cell motility as a prognostic factor in Stage I nonsmall cell lung carcinoma: the role of gelsolin expression. Cancer. 1999;85(1):47‐57. [DOI] [PubMed] [Google Scholar]
- 23. Yang J, Tan D, Asch HL, et al. Prognostic significance of gelsolin expression level and variability in non‐small cell lung cancer. Lung Cancer. 2004;46(1):29‐42. [DOI] [PubMed] [Google Scholar]
- 24. Li WX, Yang MX, Hong XQ, et al. Overexpression of gelsolin reduces the proliferation and invasion of colon carcinoma cells. Mol Med Rep. 2016;14(4):3059‐3065. [DOI] [PMC free article] [PubMed] [Google Scholar]
- 25. Wang HC, Chen CW, Yang CL, et al. Tumor‐associated macrophages promote epigenetic silencing of gelsolin through DNA methyltransferase 1 in gastric cancer cells. Cancer Immunol Res. 2017;5(10):885‐897. [DOI] [PubMed] [Google Scholar]
- 26. Kahlert UD, Nikkhah G, Maciaczyk J. Epithelial‐to‐mesenchymal(‐like) transition as a relevant molecular event in malignant gliomas. Cancer Lett. 2013;331(2):131‐138. [DOI] [PubMed] [Google Scholar]
- 27. Zhou A, Lin K, Zhang S, et al. Nuclear GSK3beta promotes tumorigenesis by phosphorylating KDM1A and inducing its deubiquitylation by USP22. Nat Cell Biol. 2016;18(9):954‐966. [DOI] [PMC free article] [PubMed] [Google Scholar]
- 28. Lu M, Wang C, Chen W, Mao C, Wang J. miR‐654‐5p Targets GRAP to Promote Proliferation, Metastasis, and Chemoresistance of Oral Squamous Cell Carcinoma Through Ras/MAPK Signaling. DNA Cell Biol. 2018;37(4):381‐388. [DOI] [PubMed] [Google Scholar]
- 29. Tan YY, Xu XY, Wang JF, Zhang CW, Zhang SC. MiR‐654‐5p attenuates breast cancer progression by targeting EPSTI1. Am J Cancer Res. 2016;6(2):522‐532. [PMC free article] [PubMed] [Google Scholar]
- 30. Ye YP, Wu P, Gu CC, et al. miR‐450b‐5p induced by oncogenic KRAS is required for colorectal cancer progression. Oncotarget. 2016;7(38):61312‐61324. [DOI] [PMC free article] [PubMed] [Google Scholar]
- 31. Dong Y, Asch HL, Ying A, Asch BB. Molecular mechanism of transcriptional repression of gelsolin in human breast cancer cells. Exp Cell Res. 2002;276(2):328‐336. [DOI] [PubMed] [Google Scholar]
- 32. Liu J, Liu YG, Huang R, et al. Concurrent down‐regulation of Egr‐1 and gelsolin in the majority of human breast cancer cells. Cancer Genomics Proteomics. 2007;4(6):377‐385. [PubMed] [Google Scholar]
Associated Data
This section collects any data citations, data availability statements, or supplementary materials included in this article.
Supplementary Materials
Fig S1‐S2


