

Abstract
Human epidermal growth factor receptor 4 (HER4) isoforms have oncogenic or tumor suppressor functions depending on their susceptibility to proteolytic cleavage and HER4 intracellular domain (4ICD) translocation. Here, we report that the neuregulin 1 (NRG1) tumor suppressor mechanism through the HER4 JMa/CYT1 isoform can be mimicked by the agonist anti‐HER4 Ab C6. Neuregulin 1 induced cleavage of poly(ADP‐ribose) polymerase (PARP) and sub‐G1 DNA fragmentation, and also reduced the metabolic activity of HER3−/HER4+ cervical (C‐33A) and ovarian (COV318) cancer cells. This effect was confirmed in HER4 JMa/CYT1‐, but not JMa/CYT2‐transfected BT549 triple‐negative breast cancer cells. Neuregulin 1 favored 4ICD cleavage and retention in mitochondria in JMa/CYT1‐transfected BT549 cells, leading to reactive oxygen species (ROS) production through mitochondrial depolarization. Similarly, the anti‐HER4 Ab C6, which binds to a conformational epitope located on a.a. 575‐592 and 605‐620 of HER4 domain IV, induced 4ICD cleavage and retention in mitochondria, and mimicked NRG1‐mediated effects on PARP cleavage, ROS production, and mitochondrial membrane depolarization in cancer cells. In vivo, C6 reduced growth of COV434 and HCC1187 tumor cell xenografts in nude mice. Biasing 4ICD trafficking to mitochondria with anti‐HER4 Abs to mimic NRG1 suppressor functions could be an alternative anticancer strategy.
Keywords: 4ICD, antibody, cancer, HER4, neuregulin
Neuregulin 1 (NRG1) induced cleavage of poly(ADP‐ribose) polymerase (PARP) in human epidermal growth factor receptor 4 (HER4) JMa/CYT1‐expressing cancer cells. NRG1 favored HER4 intracellular domain (4ICD) cleavage and retention into mitochondria leading to reactive oxygen species (ROS) production through mitochondrial depolarization in HER4 JMa/CYT1‐expressing cancer cells. Phage‐displayed selected anti‐HER4 Ab C6 induced 4ICD cleavage and retention into mitochondria, mimicking NRG1‐mediated effects on PARP cleavage, ROS production, and mitochondrial membrane depolarization. C6 Ab reduced in vivo growth of ovarian COV434 and breast HCC1187 tumor cell xenografts in nude mice.

Abbreviations
- 4ICD
HER4 intracellular domain
- CCCP
carbonyl cyanide m‐chlorophenyl hydrazone
- ECD
extracellular domain
- EGFR
epidermal growth factor receptor
- GPCR
G‐protein coupled receptor
- HER
human epidermal growth factor receptor
- ICD
intracellular domain
- ICM
Institut régional du Cancer de Montpellier
- NRG1
neuregulin 1
- PARP
poly(ADP‐ribose) polymerase
- PE
phycoerythrin
- ROS
reactive oxygen species
- RTK
receptor tyrosine kinase
- TBHP
tert‐butyl hydroperoxide
- TNBC
triple‐negative breast cancer
1. INTRODUCTION
The human epidermal growth factor receptor family (HER or ErbB) includes 4 RTKs (EGFR/HER1, HER2, HER3, and HER4) that play roles in development and cancer. The roles of EGFR and HER2 in cancer progression led to the development of mAbs against these receptors, such as cetuximab and trastuzumab. 1 More recently, HER3 has been considered a key player in tumor signaling and resistance to cancer drugs, leading to the development of anti‐HER3 mAbs. 2 Conversely, results with antagonist mAbs against HER4 have been disappointing, and currently no anti‐HER4 mAb is used in the clinic.
Among HER members, HER4 is unusual. Its biology is more complex and its role in cancer is still controversial. It is expressed in various cancers, such as blastoma, breast, lung, melanoma, pancreas, gastric, colorectal, ovarian, and bladder cancer. 3 However, the prognostic significance of HER4 expression in cancer remains unclear, particularly in breast cancer where HER4 has been alternatively described as an oncogene 4 and a tumor suppressor. 5 These opposite effects are explained by the existence of 4 HER4 isoforms at the cell surface, each with its own downstream signaling pathway. 6 These isoforms (JMa/CYT1, JMa/CYT2, JMb/CYT1, and JMb/CYT2) differ in their ECD and ICD. Following activation, JMa isoforms are cleaved by a 2‐step process, catalyzed by tumor necrosis factor‐α converting enzyme and then γ‐secretase and called regulated intramembrane proteolysis, to release the HER4 ECD and ICD (4ICD). 7 The HER4 intracellular domain translocates to the nucleus where it acts on gene transcription to control multiple cellular pathways (differentiation, migration, and proliferation). 8 Conversely, JMb isoforms are not cleaved and act as classical RTKs. The HER4 isoforms acquire the cytoplasmic domain CYT1 or CYT2 by alternative splicing. 9 CYT2 isoforms can only induce phosphorylation of MAPK pathway components, whereas the 16‐a.a. extension present only in CYT1 isoforms allows the activation of the MAPK and PI3K pathways. 10
Most studies describe HER4 isoforms and their main ligand NRG1 as oncogenes. JMa/CYT1 and JMa/CYT2 are widely coexpressed. Conversely, expression of JMb variants seems to be restricted to some tissues. 6 In cancer, JMa/CYT1 and JMa/CYT2 have been associated with poor prognosis, due to 4ICD translocation to the nucleus. 11 JMa/CYT1 has been implicated in tumor progression, 12 and JMa/CYT2 is considered the most oncogenic isoform. Indeed, CYT2 is more stable than CYT1 in the cytosol, 13 and its nuclear location is more robust, with better transcriptional activity. 14 Moreover, CYT2 can activate hyperplasia‐related pathways, such as Wnt, β‐catenin, and KITENIN, 15 and JMa/CYT2 homodimers are constitutively phosphorylated to promote ligand‐independent growth. 16 Both isoforms support cancer cell proliferation by modulating numerous signaling pathways. 17
However, in breast cancer, CYT1 isoforms have also been associated with inhibition of cancer cell proliferation. 18 In the cytosol of breast cancer cells, 4ICD directly induces apoptosis from mitochondria through its BH3‐only domain, 19 explaining the better survival of patients with high cytosolic 4ICD expression. 20 As HER4 plays a role in tissue homeostasis, 21 which requires regulation of proliferation and cell death, 22 HER4 and 4ICD might also play a tumor suppressor function that could be modulated by NRG1. Indeed, the ERBB4 promoter is hypermethylated in cancer, and HER4 reexpression using demethylating agents induces apoptosis of breast cancer cells after NRG1 stimulation. 23 In breast cancer, NRG1 and HER4 induce cell cycle arrest by activating JNK through BRCA1, 24 and 4ICD might be a mitotic checkpoint, 25 regulating cell cycle progression.
As NRG1 is considered a potential tumor suppressor gene 26 and the Y1056 residue in HER4‐CYT1 variants is essential for tumor suppression, 27 we hypothesized that the HER4 JMa/CYT1‐NRG1 axis has a tumor suppressor function by localizing 4ICD in mitochondria where it can induce apoptosis through its BH3‐only domain. 19 We also hypothesized that this NRG1‐4ICD pathway could be activated by biased agonist or positive allosteric modulator mAbs, as described for GPCR targeting. 28 By inducing specific conformational changes in the targeted receptor, these mAbs can selectively modulate specific signaling pathways. 29 Here, we showed that NRG1 induces HER4 JMa/CYT1‐expressing cancer cell death through 4ICD retention in mitochondria, and that the anti‐HER4 Ab C6 mimics these NRG1‐induced effects, leading to growth inhibition of ovarian and breast cancer xenografts.
2. MATERIALS AND METHODS
2.1. Cell cultures
C‐33A cervical cancer, COV318 and COV434 ovarian cancer, BT549 and HCC1187 TNBC cells, and HEK293T and NIH3T3 cells were obtained from ATCC, and cultured as described in Appendix S1.
2.2. Recombinant proteins and constructs
All recombinant proteins and constructs are described in Appendix S1 and Table S1.
2.3. Phage display selection and production of full‐length IgGs
Two phage display selection experiments were carried out in parallel: the first using NRG1‐stimulated JMa/CYT1‐transfected cells (whole cell panning by phage display) and the second using recombinant human HER4 ECD as targets. For the first experiment, JMa/CYT1‐transfected NIH3T3 cells were stimulated with 50 ng/mL NRG1 at 37°C for 15 minutes (to activate HER4) and then incubated with the HUSCI proprietary scFv library. 30 After incubation, cells were washed 20 times with PBS and phages were eluted with TPCK trypsin (Thermo Fisher Scientific) at room temperature for 10 minutes. Eluted phages were amplified in TG1 bacteria (Agilent), rescued with the KM13 helper phage (New England Biolabs), and used for 2 other rounds of selection. Screening of eluted phages from the third round were both undertaken by ELISA and flow cytometry, and selected anti‐HER4 scFv were then produced in IgG format, as indicated in Appendix S1.
2.4. Human epidermal growth factor receptor 4 JMa/CYT1‐ and JMa/CYT2‐encoding plasmid transfection in BT549 and C‐33A cells
To ensure uniformity of transfection among experimental conditions and experiments, BT549 and C‐33A cells were seeded in 150‐mm Petri dishes and grown for 24 hours. Cells were transfected at 70% confluence with 15 μg JMa/CYT1 or JMa/CYT2 plasmid and 240 μg polyethylenimine diluted in 150 mmol/L NaCl solution for 5 hours. Medium (10% FBS) was then replaced by 1% FBS‐medium. The next day, transfected cells were seeded in 6‐ or 12‐well plates (10% FBS‐medium) and grown for 10 hours. Cells were then starved in 1% FBS‐medium for 12 hours before NRG1 stimulation or Ab treatment.
2.5. Flow cytometry analysis
Cell surface receptor expression was analyzed in all cell lines with the following Abs: cetuximab (EGFR) (Merck), trastuzumab (HER2) (Roche), SGP1 (HER3) (Santa Cruz Biotechnology), and H4.77.16 (HER4) (Thermo Fisher Scientific). Cetuximab and trastuzumab were purchased from the pharmacy of the ICM hospital. Exponentially growing cells were harvested and resuspended in FACS buffer (PBS/1% FBS). Cells (3 × 10⁵) were incubated with 10 μg/mL primary Ab on ice for 1 hour 30 minutes. For competition experiments, cells were incubated with 15 μg/mL of the selected anti‐HER4 mAbs and NRG1 at various concentrations (0.1‐100 nmol/L; 3‐3000 ng/mL) on ice for 1 hour 30 minutes. After washes, cells were incubated with FITC‐conjugated goat anti‐human IgG (Fc specific) (Sigma) or goat anti‐mouse IgG (H + L) (Millipore). The cell median fluorescence intensity was measured by flow cytometry (Gallios apparatus; Beckman Coulter).
2.6. Human epidermal growth factor receptor 4 binding by ELISA
Nunc MaxiSorp plates (Thermo Fisher Scientific) were coated with 250 ng/mL human or mouse recombinant HER4 overnight. After saturation at 37°C with PBS/2% BSA for 2 hours, Abs were diluted in PBS/0.1% Tween and added for 2 hours at 37°C. After washes, Ab binding was detected by incubation with peroxidase‐conjugated goat anti‐human IgG (F(ab’)2 fragment specific) (Jackson ImmunoResearch) and TMB solution. The reaction was stopped by adding 1 mol/L sulfuric acid, and absorbance was measured at 450 nm.
2.7. Reverse transcription‐PCR analysis of HER4 isoform expression
Reverse transcription‐PCR analysis of HER4 isoform expression was carried out using appropriate primers, as described in Appendix S1.
2.8. Mitochondrial activity measurement
Mitochondrial activity of C‐33A cells was measured with the CellTiter 96 Aqueous One Solution Cell Proliferation Assay (MTS) (Promega), as described in Appendix S1.
2.9. Clonogenic survival
After trypsinization, 600 C‐33A cells were seeded in duplicate in 6‐well plates in complete medium, 24 hours before Ab treatment (5 µg/mL) or irradiation (1, 2, or 4 Gy). At 15 days posttreatment, cells were fixed with 1:3 acetic acid / methanol solution and stained with Giemsa in water (3.5:10) (Sigma‐Aldrich). Colonies containing at least 50 cells were counted, and the clonogenic survival was calculated as the number (100×) of colonies of surviving cells relative to untreated cells. As positive control, cells were irradiated with a linear particle accelerator (Varian Medical Systems) at the Radiotherapy Department of the ICM Val d’Aurelle hospital. Radiation was delivered as a single dose of 6 MV‐photons in a 40 cm × 40 cm field size at a dose rate of 200 UM/minute.
2.10. Adenylate kinase releasing assay
Adenylate kinase release from damaged cells was measured in HCC1187 cells using the ToxiLight Bioassay Kit (Lonza), as described in Appendix S1.
2.11. Reactive oxygen species production
The ROS level was measured in JMa/CYT1‐, JMa/CYT2‐, and Mock‐transfected BT549 cells using the DCFDA/H2DCFDA Cellular Reactive Oxygen Species Detection Assay Kit (Abcam), as described in Appendix S1.
2.12. Mitochondrial membrane potential
Mitochondrial membrane potential changes in JMa/CYT1‐, JMa/CYT2‐, and Mock‐transfected BT549 cells were evaluated using the DIOC6 intracellular probe (Abcam), as described in Appendix S1.
2.13. Subcellular fractionation of BT549 transfected cells
BT549 transfected cells were stimulated or not with 30 ng/mL NRG1 at 37°C for 24 hours, or incubated with 20 μg/mL anti‐HER4 Abs in 1% FBS‐medium, with or without 30 ng/mL NRG1 at 37°C for 6 hours. Subcellular fractionation of treated cells was undertaken as described in Appendix S1.
2.14. Western blot analysis
Adherent cells were washed twice in cold PBS, dissociated by cell scraping, and lysed on ice in lysis buffer (60 mmol/L Tris, pH 6.8, 10% glycerol [v/v], 1% SDS [v/v]). After boiling for 10 minutes at 95°C, proteins were quantified and bromophenol blue added. Protein lysates (20‐50 μg) were separated by SDS‐PAGE and then transferred onto PVDF membranes (GE Healthcare). Membranes were saturated in TBS/0.1% Tween (TBS‐T) and 5% nonfat dry milk with gentle shaking at room temperature for 2 hours. Membranes were incubated with rabbit or mouse primary Abs at 4°C with gentle shaking overnight. After washes in TBS‐T, membranes were incubated with the appropriate peroxidase‐conjugated anti‐mouse (Jackson ImmunoResearch) or anti‐rabbit (Sigma) Abs at room temperature for 1 hour. After washes in TBS‐T, protein expression levels were detected with Western Lightening Ultra (Perkin Elmer) or SuperSignal West Femto Maximum Sensitivity Substrate (Thermo Fisher Scientific).
2.15. Epitope mapping
The epitope mapping of C6 and D5 Abs was predicted using MabTope software, 31 as described in Appendix S1. The amino acids that were identified as highly probable epitope residues were mutated to alanine to create one mutated HER4 construct for each initially identified region. The WT (HER4_WT) and mutated constructs (HER4_P1m, HER4_P2m, HER4_P3m, and HER4_P4m) were N‐terminally Flag‐tagged to monitor antigen expression in HEK293 cells. The binding of C6 and D5 Abs on WT and mutated HER4‐transfected HEK293 cells was carried out by flow cytometry as described in Appendix S1.
2.16. Tumor xenograft studies
All procedures were undertaken in compliance with the French regulations and ethical guidelines for experimental animal studies in an accredited establishment (Agreement No. C34‐172‐27). All experiments followed the relevant regulatory standards. Female Hsd nude mice were obtained from Envigo. At 6 weeks of age, mice were anesthetized and s.c. grafted with 8 × 10⁶ COV434 ovarian, 1 × 10⁷ C‐33A cervical, or 1 × 10⁷ HCC1187 TNBC cells diluted in Matrigel solution in a final volume of 150 μL. Tumors were measured with a caliper twice a week to monitor size before and after treatment start. Once tumor size reached approximately 150 mm3, mice were randomly distributed in groups of 10 mice and treatments started (i.p. injections): irrelevant Ab (20 mg/kg), anti‐HER4 D5 (20 mg/kg), and anti‐HER4 C6 (20 mg/kg) twice per week for 4 weeks, or carboplatin (60 mg/kg) once per week for 4 weeks.
2.17. Immunohistochemistry
Four‐micron formalin‐fixed, paraffin‐embedded tissue sections from tumor xenografts were placed on poly‐l‐lysine coated slides, deparaffinized in xylene, and rehydrated in graded alcohols. The antigen retrieval was carried out by heating tissues at 95°C in 10 mmol/L citrate buffer for 30 minutes. The endogenous peroxidase activity was inhibited by Dual Endogenous Enzyme‐Blocking Reagent for 15 minutes (Dako) and the nonspecific binding was reduced by serum‐free protein blocking (Dako) for 20 minutes. The sections were then incubated with anti‐cleaved caspase‐3 Ab (Cell Signaling Technology) diluted at 1:5000, for 1 hour. Antibody binding was revealed using the StreptaABComplex/HRP Duet kit (Dako). Quantification was done with the Aperio ImageScope software (Leica Biosystems).
2.18. Statistical analysis
All statistical tests were undertaken using Prism software version 6.1 (GraphPad). Comparisons between groups were carried out using the 2‐tailed unpaired Student’s t test. ANOVA was used to determine statistical significance when 3 or more groups were compared. For all experiments, *P < .05, **P < .01 and ***P < .001.
3. RESULTS
3.1. Neuregulin 1 induces cell death in HER4‐expressing C‐33A and COV318 cancer cells
We first studied the involvement of the NRG1/HER4 axis in tumor suppression in C‐33A (cervical) and COV318 (ovary) cancer cell lines that strongly express HER4, but not HER3. These 2 cell lines also express EGFR and HER2 at different levels, as shown by flow cytometry (Figure S1). Stimulation of C‐33A cells with NRG1 induced stronger PARP cleavage over time, with regard to unstimulated cells, suggesting that cell death is triggered after HER4 activation by NRG1 (Figure 1A). Neuregulin 1 also increased DNA fragmentation, as indicated by the finding that approximately 60% of NRG1‐stimulated C‐33A cells were in the sub‐G1 phase at 48‐72 hours after addition of NRG1 (Figure 1B). Neuregulin 1 also significantly decreased the metabolic activity (MTS assay) of C‐33A cells (Figure 1C), suggesting that NRG1‐induced cell death occurs through mitochondria. Similarly, NRG1 stimulation of COV318 cells induced PARP cleavage (Figure 1D) already at 24 hours after NRG1 stimulation, and cell membrane disruption (Figure 1E). We observed this “broken” phenotype also in HCC1187 TNBC cells that express HER4 (Figure S2A), as confirmed by adenylate kinase release increase in the extracellular medium in NRG1‐stimulated HCC1187 cells compared with untreated cells (Figure S2B). These experiments indicated that the NRG1‐HER4 axis induces cell death in C‐33A, COV318, and HCC1187 cancer cells.
FIGURE 1.

Neuregulin 1 (NRG1) induces cell death in human epidermal growth factor receptor 4 (HER4)‐expressing C‐33A and COV318 cancer cells. A, C‐33A cervical cancer cells were serum‐starved for 12 h, stimulated with NRG1 (30 ng/mL) for the indicated times and analyzed by western blotting using the appropriate Abs. Western blots were repeated twice independently. Pixel intensity (PI) of each band was quantified using ImageJ software. B, C‐33A cells were treated in triplicate as described in (A), stained with propidium iodide and analyzed by flow cytometry. Experiments were carried out twice. *P < .05, ***P < .001 (unpaired t test). C, Triplicate wells of C‐33A cells were serum‐starved for 12 h and stimulated with NRG1 (30 ng/mL) for 5 d. Metabolic activity was analyzed with the MTS assay. Data are representative of 2 independent experiments and are presented as mean ± SEM. **P < .01, (unpaired t test). D, COV318 ovary cancer cells were serum‐starved for 12 h, stimulated with NRG1 (30 ng/mL) for 24 h and analyzed by western blotting in 1 experiment using the appropriate Abs. PI of each band was quantified using ImageJ software. E, Photographs (microscopy magnification, 10×) showing the phenotype of unstimulated cells (top) and NRG1‐stimulated COV318 cells (bottom). Representative microphotographs are shown (n = 3). cPARP, cleaved poly(ADP‐ribose) polymerase
3.2. Neuregulin 1 induces cell death through the HER4 JMa/CYT1 isoform
It was previously reported that 4ICD, after cleavage of the JMa/CYT1 or JMa/CYT2 isoform, favors apoptosis. 19 To determine which isoform is responsible for cell death after NRG1 stimulation, we transiently transfected HER3−/HER4− BT549 TNBC cells with plasmids that encode full‐length HER4 JMa/CYT1 or JMa/CYT2. Flow cytometry analysis confirmed HER4 expression and showed that EGFR and HER2 expression were not affected by transfection (Figure S3A). We also checked the expression of both full‐length HER4 isoforms by western blotting (Figure S3B), and the absence of expression in mock‐transfected BT549 cells. Expression of HER4 JMa/CYT1 was lower than that of JMa/CYT2 (Figure S3B), in accordance with previously reported data. 14 , 16 The RT‐PCR analysis confirmed that nontransfected BT549 cells did not express any HER4 isoform (Figure S3C).
In basal conditions (medium alone), the expression of each HER4 isoform in BT549 cells was sufficient to induce PARP cleavage at 48 hours posttransfection. Stimulation with NRG1 sustained PARP cleavage up to 72 hours in JMa/CYT1‐transfected BT549 cells, but not in mock‐ and JMa/CYT2‐transfected cells where PARP cleavage decreased (Figure 2A). To confirm the opposite roles of HER4 JMa/CYT1 and JMa/CYT2, we overexpressed each isoform in C‐33A cells. These cells naturally express the 2 isoforms at similar levels, but not the JMb isoforms (Figure S3C). Neuregulin 1‐induced PARP cleavage was comparable in parental and mock‐transfected C‐33A cells (compare Figures 2B and 1A). Overexpression of HER4 JMa/CYT1, but not JMa/CYT2, strongly induced PARP cleavage in unstimulated cells, particularly at 72 hours (Figure 2B). Following NRG1 stimulation, PARP cleavage was amplified from 48 hours onwards in HER4 JMa/CYT1‐overexpressing C‐33A cells, whereas it was decreased in JMa/CYT2‐overexpressing cells, compared with NRG1‐stimulated mock cells (Figure 2B).
FIGURE 2.

Neuregulin 1 (NRG1) induces cell death through the human epidermal growth factor receptor 4 (HER4) JMa/CYT1 isoform and JNK/γH2AX signaling. A, BT549 triple negative breast cancer cells were transfected with plasmids encoding full‐length HER4 JMa/CYT1 or JMa/CYT2, or mock‐transfected. At 24 h posttransfection, cells were serum‐starved for 12 h, stimulated or not with NRG1 (30 ng/mL) for the indicated times, and analyzed by western blotting using the appropriate Abs. Pixel intensity (PI) of each band was quantified using ImageJ software. B, C‐33A cells that naturally express both HER4 JMa isoforms were transfected with plasmids encoding full‐length HER4 JMa/CYT1 or JMa/CYT2, or mock‐transfected. At 24 h posttransfection, cells were serum‐starved for 12 h, stimulated or not with NRG1 (30 ng/mL) for the indicated times, and analyzed by western blotting using the appropriate Abs. All experiments were carried out twice and representative blots are shown. cPARP, cleaved poly(ADP‐ribose) polymerase
3.3. Neuregulin 1‐induced cell death through HER4 JMa/CYT1 occurs by way of JNK/γH2AX signaling
In HER3−/HER4+ C‐33A cells, NRG1 stimulation decreased the cell metabolic activity (Figure 1C) and promoted DNA fragmentation (Figure 1B). Therefore, we wanted to identify the NRG1/HER4‐related intermediates between mitochondria and PARP. It has been shown that sustained JNK activation induces apoptosis by interacting with mitochondrial proteins, 32 and that NRG1 activates JNK through HER4. 33 Moreover, HER4 is connected with DNA damage. 34 In agreement, NRG1 stimulation of mock‐transfected C‐33A cells increased JNK phosphorylation and the level of γH2AX (a marker of dsDNA breaks) over time (Figure 2B), compared with unstimulated mock cells. In HER4 JMa/CYT1‐overexpressing C‐33A cells, JNK phosphorylation and γH2AX expression were induced earlier (24 hours vs 48 hours) and persisted until the experiment end (72 hours) in NRG1‐stimulated compared with unstimulated cells (Figure 2B). Moreover, JNK phosphorylation level was lower in the absence of NRG1. Conversely, in HER4 JMa/CYT2‐overexpressing C‐33A cells, JNK phosphorylation was not induced in any condition (Figure 2B), and basal γH2AX expression at 72 hours was reduced by NRG1 stimulation. These experiments confirmed that HER4 JMa/CYT1 acts as a tumor suppressor following NRG1 stimulation, whereas JMa/CYT2 acts as a tumor protector.
3.4. Neuregulin 1 induces 4ICD retention in mitochondria of HER4 JMa/CYT1‐transfected cells
As it has been shown that cleaved 4ICD closely interacts with mitochondria, 19 , 21 we asked whether NRG1‐induced cell death could be linked to 4ICD‐CYT1 localization in mitochondria. To this aim, we investigated 4ICD localization in mitochondria and cytosol, after subcellular fractionation of JMa/CYT1 and JMa/CYT2‐transfected BT549 cells. In nonstimulated cells (medium alone), we detected 4ICD in the mitochondrial fraction of HER4 JMa/CYT1‐ and JMa/CYT2‐transfected BT549 cells (Figure 3A). We also observed a pool of 4ICD‐CYT1, but not of 4ICD‐CYT2, in the cytosolic fraction of unstimulated cells. After NRG1 stimulation, full‐length HER4 mostly disappeared in both the mitochondrial and cytosol fractions, suggesting increased HER4 degradation or shedding. Similarly, the mitochondrial fraction of 4ICD‐CYT2, but not of 4ICD‐CYT1, decreased (Figure 3A). These results suggest that NRG1‐induced cell death in HER4 JMa/CYT1‐overexpressing cells occurs through 4ICD‐CYT1 retention in mitochondria.
FIGURE 3.
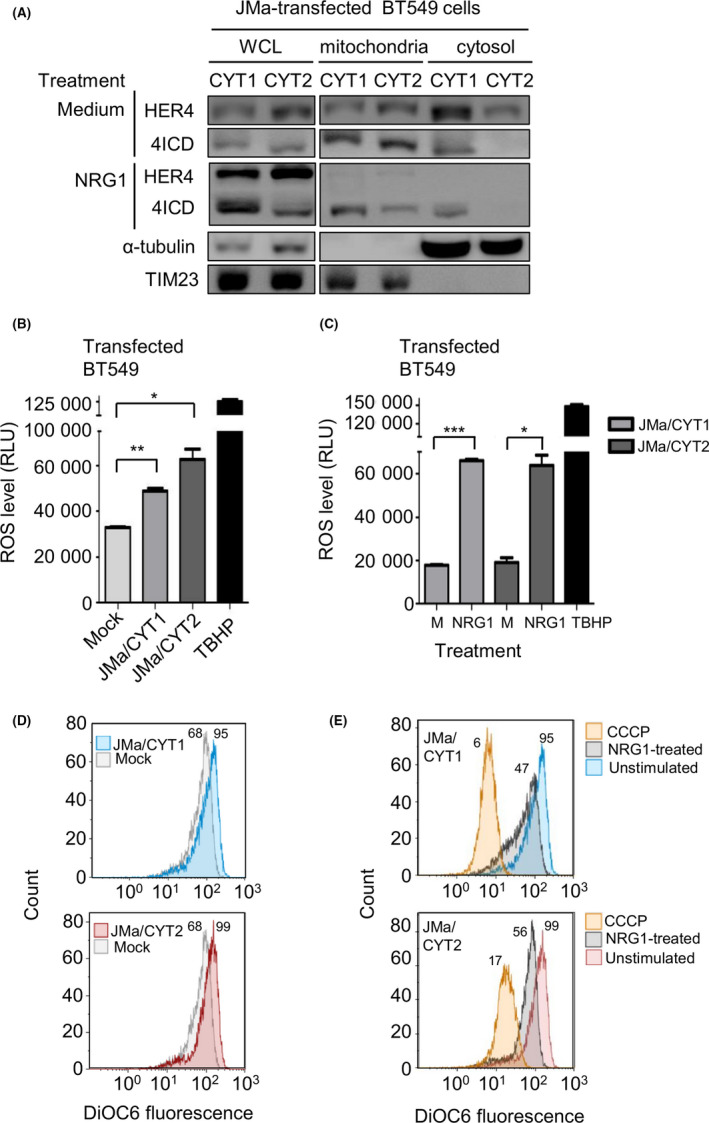
In human epidermal growth factor receptor 4 (HER4) JMa/CYT1‐transfected cells, neuregulin 1 (NRG1) induces HER4 intracellular domain (4ICD) retention in mitochondria and reactive oxygen species (ROS) production through mitochondrial depolarization. A, Subcellular fractionation of BT549 cells transfected with HER4 JMa/CYT1‐ or JMa/CYT2‐encoding plasmids for 5 h, serum‐starved for 19 h, and stimulated or not (Medium) with NRG1 (30 ng/mL) for 24 h. Cytosol and mitochondrial fractions were identified with Abs against α‐tubulin and TIM23, respectively. Localization of full‐length HER4 and 4ICD was assessed using the anti‐HER4 Ab E200 (Abcam) that recognizes full‐length HER4 (180 kDa) and 4ICD (80 kDa). Western blots were repeated twice independently. WCL, whole cell lysate. B, ROS quantification in HER4 JMa/CYT1‐ and JMa/CYT2‐transfected BT549 cells vs mock‐transfected cells. At 24 h posttransfection in duplicate, cells were serum‐starved for 18 h, and ROS levels were quantified with the Cellular Reactive Oxygen Species Detection Assay Kit (Abcam). The ROS‐inducer tert‐butyl hydroperoxide (TBHP) was used as positive control. Data are expressed as mean ± SEM and are representative of 2 experiments. *P < .05, **P < .01 (unpaired t test). RLU, relative luminescence unit. C, ROS measurement after NRG1 stimulation of HER4 JMa/CYT1‐ and JMa/CYT2‐transfected BT549 cells. At 24 h posttransfection in duplicate, cells were serum‐starved for 12 h and then stimulated or not (M) with NRG1 (30 ng/mL) for 24 h. ROS levels were quantified as in (B). Data are expressed as mean ± SEM and are representative of 2 independent experiments. *P < .05, ***P < .001 (unpaired t test). D, Mitochondrial membrane potential (MMP) measurement of HER4 JMa/CYT1‐ and JMa/CYT2‐transfected BT549 cells vs mock‐transfected cells. At 24 h posttransfection, cells were serum‐starved for 12 h and MMP was analyzed by flow cytometry using the DIOC6 probe. The assay was repeated twice independently. E, MMP measurement after NRG1 stimulation of HER4 JMa/CYT1‐ and JMa/CYT2‐transfected BT549 cells. At 24 h posttransfection, cells were serum‐starved for 12 h and then stimulated or not with NRG1 (30 ng/mL) for 24 h. Two independent experiments were carried out and MMP was measured as in (D). The mitochondrial oxidative phosphorylation uncoupler carbonyl cyanide m‐chlorophenyl hydrazone (CCCP) was used as positive control for mitochondrial membrane depolarization
3.5. Neuregulin 1 induces ROS production following mitochondrial depolarization
Reactive oxygen species, the main cause of oxidative stress, is mainly produced in mitochondria, particularly following sustained JNK activation. 35 Oxidative stress caused by ROS overproduction leads to DNA damage and cell death; however, a “sustained and controlled” ROS production could also favor tumor progression. 36 To investigate the role of ROS in HER4 JMa/CYT1‐mediated cell death, we analyzed ROS production in transfected BT549 cells. Without NRG1 stimulation (Figure 3B), ROS levels were significantly higher in HER4 JMa/CYT1‐ and JMa/CYT2‐transfected BT549 cells than in mock‐transfected cells. As positive control, TBHP strongly induced ROS production. Neuregulin 1 stimulation significantly increased ROS production in HER4 JMa/CYT1‐ and JMa/CYT2‐transfected BT549 cells, compared with unstimulated cells (medium only) (Figure 3C).
As ROS are mainly produced in mitochondria following reduction of the mitochondrial membrane potential, we used the DIOC6 probe to monitor the mitochondrial membrane potential. Flow cytometry analysis of DIOC6 labeled unstimulated HER4 JMa/CYT1‐ and JMa/CYT2‐transfected BT549 cells showed an increase of DIOC6 fluorescence signal, indicating mitochondrial membrane hyperpolarization, compared with mock‐transfected cells (Figure 3D). Conversely, NRG1 stimulation reduced DIOC6 labeling, indicating mitochondrial membrane depolarization (Figure 3E). As the positive control of depolarization, CCCP strongly reduced DIOC6 signal intensity. These results suggest that NRG1 induces ROS production following mitochondrial membrane depolarization of HER4 JMa/CYT1‐expressing cells and participates in NRG1‐induced cell death.
3.6. Selection and characterization of 4 anti‐HER4 Abs from HUSCI phage‐display library
To select anti‐HER4 Abs that could mimic HER4 JMa/CYT1 tumor suppression by NRG1, we developed a whole cell panning approach in which we used HER4 JMa/CYT1‐transfected NIH3T3 cells as targets (after stimulation with NRG1 to preactivate HER4) and the proprietary phage display scFv library HUSCI (see “Materials and Methods”). We also undertook a second phage display screening of the HUSCI library using soluble recombinant HER4 as the target. Among the 400 clones screened by flow cytometry and ELISA, we selected and IgG1‐reformatted 4 antibodies: D5, F4, and C6 (selected using the recombinant protein approach), and H2 (selected by whole cell panning). Enzyme‐linked immunosorbent assay showed that the 4 Abs bound to human HER4 in a dose‐dependent manner (Figure 4A). This binding was confirmed by flow cytometry in C‐33A cells (Figure S4A). D5 and C6, but not F4 and H2, cross‐reacted with mouse HER4, as shown by ELISA (Figure S4B). To assess HER4 specificity, we showed that the selected Abs D5, F4, C6, and H2 bound to EGFR/HER4 cotransfected 3T3 cells, but not to EGFR‐only transfected 3T3 cells (Figure S4C), and they did not cross‐react with other ErbB family members, ie EGFR, HER2, or HER3 (Figure S4D). The human HER4‐specific D5 (10 ng/mL) and C6 (100 ng/mL) Abs displayed 50% absorbance (EC50) on human HER4, and bound more efficiently than F4 and H2 (EC50 approximately 1‐5 µg/mL) (Figure 4A). Competition experiments using NRG1 and flow cytometry indicated that addition of low NRG1 concentrations (0.1‐1 nmol/L; 3‐30 ng/mL) did not hinder Ab binding to HER4. D5 and F4 binding to HER4 was partially inhibited by 10 nmol/L NRG1 (60% and 40% inhibition, respectively), but not C6 and H2 binding (Figure 4B). F4 and H2, but not C6 and D5, still maintained approximately 40% of residual binding at high NRG1 concentration (100 nmol/L).
FIGURE 4.

Selection and characterization of 4 anti‐human epidermal growth factor receptor 4 (HER4) Abs from the HUSCI phage‐display library. A, ELISA binding of the selected mAbs to human HER4. Wells were coated with 250 ng/mL of recombinant HER4, and 20 μg/mL mAbs was used in triplicate as starting concentration (1:10 dilution). Ipilimumab was used as negative control Ab. The assay was repeated twice. B, Effect of neuregulin 1 (NRG1) on Ab binding to HER4+ C‐33A cells assessed by flow cytometry. Cells were coincubated with D5, F4, C6, or H2 (15 μg/mL) and various NRG1 concentrations. Results are presented as percentage of binding relative to the binding without NRG1 (M; 100%) for one experiment. C, HER4 variants with mutations within the 4 predicted areas (HER4_P1 to P4). Only amino acids from the HER4 protein surface were mutated to alanine, to ensure that HER4 structure was not altered. All WT and mutants were N‐terminally Flag‐tagged and transfected in HEK293 cells. D, Binding of the anti‐HER4 Abs C6 and D5 in Mock, WT HER4, and HER4 mutant‐transfected HEK293 cells. The number of allophycocyanin (APC)+/phycoerythrin (PE)+ cells was quantified by flow cytometry and normalized to the total number of PE+ cells within the sample. Duplicate wells were done for each condition. Data are representative of 3 independent experiments. ***P < .001 (ANOVA test). n.s, non‐significant. E, Effect of the 4 anti‐HER4 mAbs on the metabolic activity of C‐33A cells. At 24 h postseeding, cells were incubated in triplicate with D5, F4, C6, H2, or Ab77 (100 μg/mL) for 5 d. Metabolic activity was analyzed using the MTS assay and presented as percentage of the activity in untreated cells (100%). Ctrl, control Ab. F, Effect of the 4 anti‐HER4 mAbs on the metabolic activity of NRG1‐stimulated C‐33A cells. At 24 h postseeding, cells were serum‐starved for 12 h and then coincubated in triplicate with D5, F4, C6, H2, or Ab77 (100 μg/mL) and NRG1 (10 ng/mL) for 5 d. Metabolic activity was analyzed as in (E). Data in (E) and (F) are representative of 2 independent experiments and are the mean ± SEM. G, Percent clonogenic survival (Giemsa staining) of C‐33A cells at day 15 after exposure to 5 µg/mL anti‐HER4 mAbs, trastuzumab (Tz) or dose‐dependent (1‐4 Gy) irradiation. Colonies containing at least 50 cells were counted in the whole P6 wells done in duplicate for 1 experiment, and the clonogenic survival was calculated as the number (100×) of colonies of surviving cells relative to untreated cells. *P < .05, **P < .01, ***P < .001 (unpaired t test). n.s, non‐significant
We predicted the HER4 epitopes of the D5 and C6 Abs using MabTope software 31 (Figure S5A,B). We identified 4 predicted areas that belong to the D5 and C6 putative epitopes: P1 606‐623, P2 573‐593, P3 260‐279, and P4 622‐642 (Figure S5B), according to the numbering of the UniProtKB‐Q15303 HER4 sequence. We designed HER4 mutants within the 4 predicted areas (HER4_P1m to P4m) (Figure 4C) and transfected them in HEK293 cells. We mutated into alanine only surface residues, ensuring that HER4 structure was not altered. Flow cytometry analysis (Figure S5C, and normalized data in Figure 4D for C6 and D5) showed that the percentage of PE+/allophycocyanin+ cells, which indicated HER4 expression at the cell surface and Ab binding, was increased in cells transfected with WT HER4 compared with mock‐transfected cells. Compared with WT HER4‐transfected cells, the percentage of double‐positive cells was lower in HER4_P1m‐ and _P2m‐transfected cells, whereas it was not significantly different in HER4_P3m‐ or _P4m‐HER4‐transfected cells (Figures 4D and S5C). These results experimentally demonstrated that the anti‐HER4 Abs D5 and C6 share a common conformational epitope that is located in domain IV, close to the transmembrane region, and restricted to regions 605‐620 (part of P1) and 575‐592 (part of P2) (Figure S5D).
3.7. Effect of the 4 selected Abs on the metabolic activity and colony formation of C‐33A cancer cells
To test the efficacy of the 4 anti‐HER4 Abs, we used an MTS assay to assess the metabolic activity of C‐33A cells. Compared with irrelevant control Ab (Ctrl), the metabolic activity of C‐33A cells was reduced by 50% when incubated with D5 and by 15%‐30% in the presence of C6, F4, and H2 (Figure 4E). Coincubation with 10 ng/mL NRG1 increased the C6‐, F4‐ and H2‐mediated metabolic activity inhibition to 50% (Figure 4F), suggesting that NRG1 potentiates the effect of these Abs. Conversely, NRG1 did not improve D5 inhibitory effect. The anti‐HER4 agonist Ab Ab77 increased the metabolic activity of unstimulated and NRG1‐stimulated C‐33A cells up to 120%, as previously suggested. 37 To confirm, we analyzed the clonogenic survival of C‐33A cells after treatment with anti‐HER4 Abs, to investigate whether selected Abs could affect colony formation (Figure 4G). At day 15 posttreatment, the clonogenic survival was notably reduced in cells incubated with 5 µg/mL Abs D5 and C6 than in cultures incubated with control IgG (Figure 4G, left panel). As positive controls, trastuzumab (Figure 4G, left panel) as well as dose‐dependent irradiation (Figure 4G, right panel), also affected clonogenic survival of C‐33A cells.
3.8. D5, C6, and H2, but not F4, induce 4ICD cleavage in HER4 JMa/CYT1‐transfected cells
To test whether the 4 anti‐HER4 Abs could potentiate HER4 tumor suppressor activity, we first evaluated their ability to induce 4ICD cleavage in HER4 JMa/CYT1 and JMa/CYT2‐transfected BT549 cells. We detected 4ICD by western blotting after incubation of JMa/CYT1‐transfected cells with D5, C6, or H2 (Figure 5A, left panel), suggesting that these Abs promote JMa/CYT1 4ICD release. We did not observe 4ICD cleavage after incubation of JMa/CYT1‐transfected BT549 cells with F4, nor after incubation of JMa/CYT2‐transfected cells with the 4 Abs (Figure 5A, right panel). We then asked whether the Abs activated HER4 through phosphorylation. D5 and C6, but not the anti‐HER4 agonist Ab77, strongly induced HER4 phosphorylation on Y1056 in HER4 JMa/CYT1‐transfected BT549 cells, a phosphorylation site described as essential for HER4 tumor suppressor function 27 (Figure 5B). Conversely, Ab77, but not D5 or C6, induced HER4 phosphorylation on Y984 in JMa/CYT1‐transfected cells, a site responsible for 4ICD association with STAT5A. 38 No Ab‐induced HER4 phosphorylation was observed in HER4 JMa/CYT2‐transfected BT549 cells (Figure 5B). These results suggest that the D5 and C6 mAbs induce HER4 ICD cleavage and HER4 phosphorylation through HER4 JMa/CYT1 activation.
FIGURE 5.
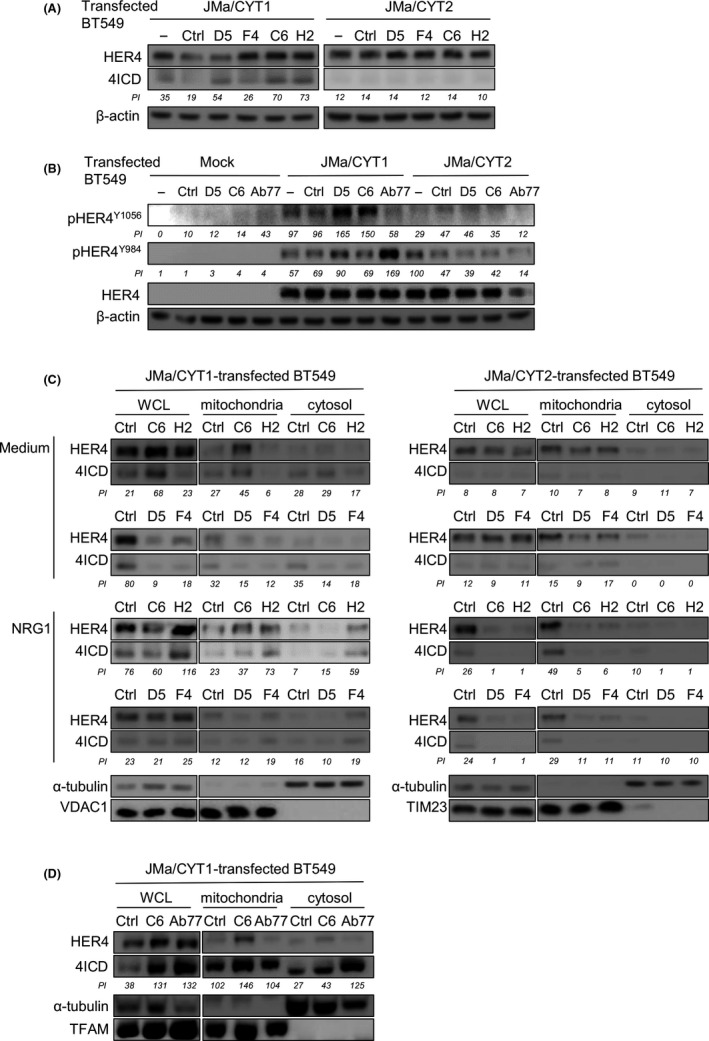
Anti‐human epidermal growth factor receptor 4 (HER4) Abs favor HER4 intracellular domain (4ICD) release and HER4 phosphorylation, leading to 4ICD retention into mitochondria. A, D5, C6, and H2, but not F4, induce 4ICD cleavage from HER4 JMa/CYT1‐transfected BT549 cells. At 24 h posttransfection with the HER4 JMa/CYT1 or JMa/CYT2 plasmid, cells were incubated with the indicated Abs (20 µg/mL) for 24 h. Full‐length HER4 and 4ICD levels were analyzed by western blotting using the anti‐HER4 Ab E200 (Abcam) that recognizes full‐length HER4 (180 kDa) and 4ICD (80 kDa). B, D5 and C6, but not Ab77, induce HER4 phosphorylation at Y1056 in HER4 JMa/CYT1‐transfected BT549 cells. At 24 h posttransfection, cells were serum‐starved for 12 h and incubated with the indicated mAbs (20 μg/mL) for 1 h 30 min. HER4 phosphorylation on Y984 and Y1056, and full‐length HER4 were analyzed by western blotting using appropriate Abs. C, C6 and H2, but not D5 or F4, favor 4ICD retention in mitochondria of HER4 JMa/CYT1‐transfected BT549 cells. Cells were transfected with HER4 JMa/CYT1 (left panel) or JMa/CYT2 (right panel) plasmids for 5 h, serum‐starved for 19 h, and then stimulated or not with NRG1 and incubated with 20 µg/mL anti‐HER4 Abs for another 6 h. After subcellular fractionation, the cytosolic and mitochondrial fractions were confirmed with Abs against α‐tubulin, and VDAC1 or TIM23, respectively. HER4 and 4ICD localizations were detected using the anti‐HER4 Ab E200 (Abcam). WCL, whole cell lysate. D, Subcellular fractionation of HER4 JMa/CYT1‐transfected BT549 cells incubated with C6 or Ab77 (20 µg/mL) for 6 h. Cells were analyzed as in (B) and (C), with TFAM as mitochondrial fractionation control. All experiments were repeated at least twice independently and representative blots are shown. Pixel intensity (PI) of each band was quantified using ImageJ software. Ctrl, control Ab; TFAM, mitochondrial transcription factor A
3.9. Antibodies C6 and H2, but not D5 and F4, favor 4ICD retention in mitochondria in HER4 JMa/CYT1‐transfected cells
We then asked whether the 4 anti‐HER4 Abs could induce 4ICD retention in mitochondria, as observed following NRG1 stimulation (Figure 3A). C6 promoted 4ICD retention in mitochondria, as shown by western blotting after subcellular fractionation of HER4 JMa/CYT1‐transfected BT549 cells (Figure 5C, left panels), with and also without costimulation by NRG1. H2 promoted 4ICD retention in mitochondria, but only when NRG1 was added (Figure 5C, left panels). Conversely, C6 and H2 did not have any effect on 4ICD retention in HER4 JMa/CYT2‐transfected BT549 cells (Figure 5C, right panels). This suggests that 4ICD routing to mitochondria is specific to cells that express the HER4 JMa/CYT1 isoform. D5 and F4 did not induce 4ICD retention in mitochondria in HER4 JMa/CYT1‐ or JMa/CYT2‐transfected BT549 cells (Figure 5C). We then compared 4ICD localization induced by C6, which inhibited the metabolic activity of C‐33A cells, and by the agonist Ab77 Ab, which increased metabolic activity (Figure 4F). In HER4 JMa/CYT1‐transfected BT549 cells, 4ICD‐CYT1 retention in mitochondria was higher after incubation with C6 than with Ab77, as expected. Conversely, Ab77 favored 4ICD‐CYT1 retention in the cytosol (Figure 5D). This result shows that these 2 anti‐HER4 mAbs can induce different signaling.
3.10. Agonist Ab C6 mimics NRG1‐mediated effects on cell death, ROS production, and mitochondrial membrane depolarization
We then asked whether the 4 HER4‐specific Abs shared properties mediated by NRG1. In C‐33A cells, C6 and D5 induced PARP cleavage after 72 hours of incubation (Figure 6A) and γH2AX expression, indicating that they favored cell death by promoting dsDNA breaks. We confirmed these effects in COV318 cells (Figure S6). C6, but not D5, induced mitochondrial membrane depolarization in HER4 JMa/CYT1‐transfected BT549 cells (Figure 6B), as observed with NRG1 (Figure 3E). Conversely, incubation of mock‐ or HER4 JMa/CYT2‐transfected BT549 cells with the 2 anti‐HER4 Abs did not induce any change in mitochondrial membrane potential (Figure 6B), confirming that depolarization following 4ICD translocation into mitochondria is a specific mechanism to the HER4 JMa/CYT1 isoform. The positive control (CCCP) induced mitochondrial membrane depolarization in mock‐, JMa/CYT1‐, and JMa/CYT2‐transfected BT549 cells. In addition, compared with mock‐transfected cells, ROS production was slightly induced by C6 in HER4 JMa/CYT1‐transfected BT549 cells (Figure 6C, left and middle panels), and by D5 and C6 in JMa/CYT2 cells (Figure 6C, right panel), suggesting that cancer cell death could also be induced through alternative mechanisms. Incubation with TBHP (positive control) induced ROS production in mock‐, JMa/CYT1‐, and JMa/CYT2‐transfected BT549 cells. These results indicate that the anti‐HER4 Ab C6 is a cell death inducer that mimics NRG1‐mediated effects in cancer cells.
FIGURE 6.

Agonist Ab C6 mimics neuregulin 1 (NRG1)‐mediated effects on cell death, reactive oxygen species (ROS) production, and mitochondrial membrane depolarization. A, C‐33A cells were incubated with D5 and C6 (20 μg/mL) for the indicated times and then analyzed by western blotting. The assay was repeated twice. B, Mitochondrial membrane potential (MMP) measurement after incubation with D5 and C6 of mock‐, HER4 JMa/CYT1‐, and JMa/CYT2‐transfected BT549 cells. At 24 h posttransfection, cells were serum‐starved for 12 h and then incubated with Abs (20 μg/mL) for 24 h. MMP was measured using the DIOC6 probe. The experiment was repeated twice independently and representative cytometry profiles are shown. Carbonyl cyanide m‐chlorophenyl hydrazone (CCCP) was used as positive control. Ctrl, control antibody. C, ROS quantification after incubation with D5 and C6 of Mock‐, HER4 JMa/CYT1‐, and JMa/CYT2‐transfected BT549 cells. At 24 h posttransfection, cells were serum‐starved for 12 h and then incubated in duplicate with Abs (20 μg/mL) for 24 h. Tert‐butyl hydroperoxide (TBHP) was used as positive control. The assay was carried twice independently and representative histograms are shown. M, medium. *P < .05 (unpaired t test)
3.11. Agonist C6 Ab in vivo reduces HER4+ ovarian cancer and TNBC cell xenograft growth
Finally, we compared the antitumor efficacy in vivo of C6 (NRG1 agonist), D5, and carboplatin (positive control treatment). We xenografted athymic mice with COV434 ovarian cancer cells, C‐33A cervical cancer cells, and HCC1187 TNBC cells. At day 38 postxenograft (3 days after the end of Ab treatment; day 35), COV434 cell tumor volume was significantly reduced by 33% in D5‐ and C6‐treated mice (P = .04 and P = .03, respectively, compared with control IgG), and by 37% in carboplatin‐treated animals (P = .01) (Figure 7A, top panels). In correlation, analysis of COV434 tumor samples at day 38 postxenograft (exemplified in Figure 7A, bottom left panel) showed that the number of cancer cells positive for cleaved caspase‐3 (a marker of apoptosis) tend to increase in mice treated with the anti‐HER4 Abs D5 and C6 compared with control‐treated mice (Figure 7A, bottom right panel).
FIGURE 7.

Agonist Ab C6 reduces in vivo tumor growth of human epidermal growth factor receptor 4 (HER4)+ ovarian cancer and triple negative breast cancer (TNBC) cells. Nude mice (n = 10/condition) were xenografted with COV434 ovarian cancer cells (A, upper panels), C‐33A cervical cancer cells (B), or HCC1187 TNBC cells (C). When tumors reached a volume of 150 mm3, mice were treated by i.p. injection of 20 mg/kg D5 (open white circles) and C6 (open white triangles) (anti‐HER4 Abs), or irrelevant control Ab (Ctrl, solid black squares), twice per week for 4 wk. Carboplatin (CarboP, solid black triangles; positive control) was used at 60 mg/kg, once per week for 4 wk. Tumor growth data are presented as the mean tumor volume ± SEM for each group (left panels). The tumor size of each individual mouse is indicated at the end of treatment (right panel). n.s., non‐significant. A, bottom left panel, Immunohistochemistry staining (20× magnification) of cleaved caspase‐3 expression in COV434 sections from xenografted mice at day 38 of treatment. For each condition, formalin‐fixed, paraffin‐embedded (FFPE) tissue sections prepared from 5 extracted xenografts were stained independently and representative staining are shown. A, bottom right panel, For each treatment, cleaved caspase 3 intensity was quantified with Image Scope in the whole stained FFPE tissue section (n = 5/condition)
At day 41 postxenograft, the mean tumor volume was reduced by 18% in mice xenografted with C‐33A cells and treated with C6 compared with control (IgG), but this difference was not significant (P = .617) (Figure 7B). D5 did not affect tumor growth. Conversely, tumor volume was reduced by 59% (at day 38 postgraft) in mice treated with carboplatin (P = .007). In mice xenografted with HCC1187 cells, tumor volume was reduced by 21.5% (at day 55 postxenograft, 4 days after the treatment end; day 51) after treatment with C6 compared with control (IgG) (P = .07) (Figure 7C). D5 did not have any effect. At day 55 postgraft, tumor size was reduced by 54% in carboplatin‐treated mice (P = .001). These results indicate that the agonist anti‐HER4 Ab C6 can delay tumor growth in mice xenografted with ovarian cancer or TNBC cells.
4. DISCUSSION
The development of antagonist mAbs is a classical and effective way to inhibit cancer progression (eg anti‐EGFR and ‐HER2 Abs). The characterization of anti‐HER4 mAbs was initially based on the same concept: blocking HER4 activity to kill cancer cells. 39 However, HER4 is unique among the HER family members, with conflicting results concerning the relationship between patient survival and HER4 expression level. 40 Indeed, HER4 displays oncogenic or tumor suppressor activities, depending on the expression levels of its 4 isoforms. 41 In this context, the previously described anti‐HER4 mAbs showed disappointing results because HER4 was targeted as a whole, thus blocking its oncogene and also tumor suppressor activities. 42 , 43
In this study, we characterized the pharmacological activity of 4 new anti‐HER4 Abs by focusing specifically on their effect on each HER4 isoform. The best Ab, C6, is a full agonist molecule that mimics NRG1 effects and promotes cleavage and retention of 4ICD in mitochondria, leading to Ab‐induced cell death in HER4 JMa/CYT1‐expressing cancer cells. Cell death occurred after ROS production through mitochondrial membrane depolarization, γH2AX expression due to DNA damage, and HER4 phosphorylation at Y1056. In vivo, C6 reduced tumor growth in mice xenografted with ovarian cancer or TNBC cells.
In HER3−/HER4+ C‐33A cells, NRG1 induces PARP cleavage over time with DNA fragmentation by an unknown mechanism. Poly(ADP‐ribose) polymerase cleavage after NRG1 stimulation has been described in neurodegenerative diseases, and various cell death mechanisms can potentially be activated through HER4. 44 We suspect an unconventional cell death mechanism (eg necroptosis or parthanatos) that involves endoplasmic reticulum stress. Indeed, protein level was increased after NRG1‐induced cell death of HCC1187 cells, suggesting protein synthesis increase, as previously described. 45 Moreover, protein synthesis has been associated with ROS production and JNK activation, 46 2 events we detected in NGR1‐stimulated HER4 JMa/CYT1‐expressing cells. Protein synthesis could also be associated with parthanatos, a mitochondrial cell death that implicates ROS, apoptosis‐inducing factor release, and PARP as central mediator. 47
The anti‐tumor effect of the C6 Ab is related to HER4 JMa/CYT1 cleavage and formation of a stable active 4ICD fragment located in mitochondria. There is plentiful evidence regarding HER4 tumor suppressor function through 4ICD, but the exact role of each isoform was never defined. We excluded JMb isoforms because they are not expressed in cancer and they are detected only in some tissues. 6 Using plasmids encoding the 2 full‐length JMa isoforms, we found that NRG1‐induced cell death occurred through HER4 JMa/CYT1. Conversely, HER4 JMa/CYT2 induced cell survival in BT549 cells, a TNBC model that initially does not express HER3 and HER4. In particular, stimulation by NRG1 increased PARP cleavage in HER4 JMa/CYT1‐ but not in JMa/CYT2‐transfected cells, highlighting the dichotomy between the tumor suppressor JMa/CYT1 isoform and the prosurvival JMa/CYT2 isoform. Human epidermal growth factor receptor 4 JMa/CYT1 acts by activating JNK, relocating 4ICD to the mitochondria, and increasing ROS production. Altogether, these events lead to cell death, but we still have to precisely decipher the pathway. We hypothesized that ROS‐induced DNA damage could be due to transient mitochondrial membrane potential changes, leading to a cell death mechanism called ROS‐induced ROS release, whereby ROS production is amplified in neighboring mitochondria. 48 Finally, in vivo, C6 inhibited growth of HCC1187 tumor cell xenografts (TNBC), possibly through is proapoptotic activity. As HER4 is expressed in approximately 20% of TNBC, 41 a pathology still with unmet medical needs, targeting HER4 with agonist Abs might represent an alternative strategy to treat TNBC.
We used this model as a template for HER4 Ab discovery. As NRG1 induces cell death by activating HER4 JMa/CYT1, we tried to potentiate this function without hampering NRG1 action on HER4. To this end, we undertook whole cell panning by phage display using NRG1‐stimulated HER4 JMa/CYT1‐transfected cells to select anti‐HER4 mAbs with unique NRG1 agonist/modulator activity. First, NRG1 binding to HER4 differently affects mAb binding to the receptor. Using C‐33A cells, we showed that all selected mAbs can bind to HER4 in the presence of 30 ng/mL NRG1, a concentration that induces cancer cell death. Second, the selected mAbs act synergistically with NRG1 to decrease the cell metabolic activity. Finally, the epitopes of C6 and D5 are far from the NRG1 binding site 49 on HER4, suggesting that cooperation between HER4‐specific mAbs and NRG1 could occur at the cell surface.
Similarly to NRG1, C6 promotes HER4/4ICD localization in mitochondria, mitochondrial depolarization, and ROS production, leading to cell death. These HER4 JMa/CYT1‐triggered pathways suggest that the 16 a.a. stretch in CYT1 is crucial for cell death. Interestingly, the previously described anti‐HER4 Ab MAb‐3 39 enhances apoptosis in HER4+ non‐small‐cell lung carcinoma cells, with an increase of subdiploid cells (a sign of DNA damage). Using the same MAb‐3 Ab, Ben‐Yosef et al observed multiple apoptotic cells with pyknotic and fragmented nuclei, karyorrhexis, and loss of cytoplasm in prostate tumor xenograft sections from MAb‐3‐treated nude mice. 50 Breast cancer frequency is increased in HER4 JMa/CYT1 transgenic mice compared with HER4 JMa/CYT2 transgenic mice, with no apoptosis observed. 9 Thus, cell death induction seems to be a critical point for inhibiting tumorigenesis through HER4. 17 We showed that the C6 mAb efficiently kills ovarian cancer and TNBC cells in vitro by inducing PARP cleavage and DNA damage, and in vivo by reducing tumor growth. The antitumor effect of this new first‐in‐class anti‐HER4 mAb must be confirmed in additional preclinical studies, especially in TNBC.
Finally, as the C6 mAb has a different binding site than NRG1 on HER4, our results suggest that similar pathways can be triggered from different receptor conformations, and indicate that C6 could be an allosteric modulator of HER4. Allosteric modulation is an important mechanism that has been recently adapted from small to large molecules. 28 , 51 By acting on the receptor, allosteric molecules can modulate endogenic ligand binding and/or signaling. The effect of C6, combined with NRG1 binding on HER4, could exemplify allosteric modulation, with cooperation to initialize new signaling pathways through HER4 that cannot be activated by each molecule on its own. This phenomenon might implicate receptor rearrangement. The finding that C6, D5, Ab77, 37 and mAb1479 52 have closely related epitopes but very different mechanisms of action suggests that minor differences in conformational changes can induce major differences in signaling and cell fate. This study is the proof‐of‐concept that biased signaling can be induced with RTK‐specific Abs, as observed with GPCR‐targeting molecules. Indeed, the C6 mAb localizes 4ICD in mitochondria, whereas the Ab77 mAb localizes 4ICD in the cytosol of HER4 JMa/CYT1‐expressing cells, resulting in different cell fate. Altogether, our observations pave the way to novel mAbs with “biasing properties” for cancer treatment.
CONFLICT OF INTEREST
R. Lanotte, P. Martineau, A. Pèlegrin, and T. Chardès are inventors of the pending patent “Antibodies having specificity to HER4 and uses thereof.” The other authors declare no conflict of interest.
Supporting information
Fig S1
Fig S2
Fig S3
Fig S4
Fig S5
Fig S6
Table S1
Appendix S1
ACKNOWLEDGMENTS
We thank S. Bousquié (IRCM) for cell culture and T. David (IRCM) for antibody production. The staff members at the IRCM animal facility, the GenAc and MRI platforms, and the RHEM histology facility are greatly acknowledged. Y. Yarden (Weizmann Institute) is also greatly acknowledged for providing the anti‐HER4 antibody Ab77. This work was supported by the program “Investissement d’Avenir” (grant agreement: Labex MAbImprove, ANR‐10‐LABX‐53‐01; A. Pèlegrin), by INSERM Transfert (CoPoC grant HER4Valid; T. Chardès). R. Lanotte was a recipient of a PhD studentship from the LabEx MAbImprove, and from the Ligue Nationale contre le Cancer. N. Gaborit was a recipient of a postdoctoral fellowship from the LabEx MAbImprove.
Lanotte R, Garambois V, Gaborit N, et al. Biasing human epidermal growth factor receptor 4 (HER4) tyrosine kinase signaling with antibodies: Induction of cell death by antibody‐dependent HER4 intracellular domain trafficking. Cancer Sci. 2020;111:2508–2525. 10.1111/cas.14458
REFERENCES
- 1. Roskoski R. The ErbB/HER family of protein‐tyrosine kinases and cancer. Pharmacol Res. 2014;79:34‐74. [DOI] [PubMed] [Google Scholar]
- 2. Lazrek Y, Dubreuil O, Garambois V, et al. Anti‐HER3 domain 1 and 3 antibodies reduce tumor growth by hindering HER2/HER3 dimerization and AKT‐induced MDM2, XIAP, and FoxO1 phosphorylation. Neoplasia. 2013;15:335‐347. [DOI] [PMC free article] [PubMed] [Google Scholar]
- 3. Hollmén M, Elenius K. Potential of ErbB4 antibodies for cancer therapy. Future Oncol. 2010;6:37‐53. [DOI] [PubMed] [Google Scholar]
- 4. Kim J‐Y, Jung HH, Do I‐G, et al. Prognostic value of ERBB4 expression in patients with triple negative breast cancer. BMC Cancer. 2016;16:138. [DOI] [PMC free article] [PubMed] [Google Scholar]
- 5. Wang J, Yin J, Yang Q, et al. Human epidermal growth factor receptor 4 (HER4) is a favorable prognostic marker of breast cancer: a systematic review and meta‐analysis. Oncotarget. 2016;7:76693‐76703. [DOI] [PMC free article] [PubMed] [Google Scholar]
- 6. Veikkolainen V, Vaparanta K, Halkilahti K, Iljin K, Sundvall M, Elenius K. Function of ERBB4 is determined by alternative splicing. Cell Cycle Georget Tex. 2011;10:2647‐2657. [DOI] [PubMed] [Google Scholar]
- 7. Ni CY, Murphy MP, Golde TE, Carpenter G. gamma ‐Secretase cleavage and nuclear localization of ErbB‐4 receptor tyrosine kinase. Science. 2001;294:2179‐2181. [DOI] [PubMed] [Google Scholar]
- 8. Haskins JW, Nguyen DX, Stern DF. Neuregulin 1‐activated ERBB4 interacts with YAP to induce Hippo pathway target genes and promote cell migration. Sci Signal. 2014;7:ra116. [DOI] [PMC free article] [PubMed] [Google Scholar]
- 9. Wali VB, Gilmore‐Hebert M, Mamillapalli R, et al. Overexpression of ERBB4 JM‐a CYT‐1 and CYT‐2 isoforms in transgenic mice reveals isoform‐specific roles in mammary gland development and carcinogenesis. Breast Cancer Res. 2014;16:501. [DOI] [PMC free article] [PubMed] [Google Scholar]
- 10. Kainulainen V, Sundvall M, Määttä JA, Santiestevan E, Klagsbrun M, Elenius K. A natural ErbB4 isoform that does not activate phosphoinositide 3‐kinase mediates proliferation but not survival or chemotaxis. J Biol Chem. 2000;275:8641‐8649. [DOI] [PubMed] [Google Scholar]
- 11. Xu S, Kitayama J, Yamashita H, Souma D, Nagawa H. Nuclear translocation of HER‐4/c‐erbB‐4 is significantly correlated with prognosis of esophageal squamous cell carcinoma. J Surg Oncol. 2008;97:44‐50. [DOI] [PubMed] [Google Scholar]
- 12. Paatero I, Lassus H, Junttila TT, Kaskinen M, Bützow R, Elenius K. CYT‐1 isoform of ErbB4 is an independent prognostic factor in serous ovarian cancer and selectively promotes ovarian cancer cell growth in vitro. Gynecol Oncol. 2013;129:179‐187. [DOI] [PubMed] [Google Scholar]
- 13. Sundvall M, Korhonen A, Paatero I, et al. Isoform‐specific monoubiquitination, endocytosis, and degradation of alternatively spliced ErbB4 isoforms. Proc Natl Acad Sci USA. 2008;105:4162‐4167. [DOI] [PMC free article] [PubMed] [Google Scholar]
- 14. Sundvall M, Peri L, Määttä JA, et al. Differential nuclear localization and kinase activity of alternative ErbB4 intracellular domains. Oncogene. 2007;26:6905‐6914. [DOI] [PubMed] [Google Scholar]
- 15. Bae JA, Kho DH, Sun EG, et al. Elevated coexpression of KITENIN and the ErbB4 CYT‐2 isoform promotes the transition from colon adenoma to carcinoma following APC loss. Clin Cancer Res. 2016;22:1284‐1294. [DOI] [PubMed] [Google Scholar]
- 16. Määttä JA, Sundvall M, Junttila TT, et al. Proteolytic cleavage and phosphorylation of a tumor‐associated ErbB4 isoform promote ligand‐independent survival and cancer cell growth. Mol Biol Cell. 2006;17:67‐79. [DOI] [PMC free article] [PubMed] [Google Scholar]
- 17. Wali VB, Haskins JW, Gilmore‐Hebert M, Platt JT, Liu Z, Stern DF. Convergent and divergent cellular responses by ErbB4 isoforms in mammary epithelial cells. Mol Cancer Res. 2014;12:1140‐1155. [DOI] [PMC free article] [PubMed] [Google Scholar]
- 18. Muraoka‐Cook RS, Sandahl MA, Strunk KE, et al. ErbB4 splice variants Cyt1 and Cyt2 differ by 16 amino acids and exert opposing effects on the mammary epithelium in vivo. Mol Cell Biol. 2009;29:4935‐4948. [DOI] [PMC free article] [PubMed] [Google Scholar]
- 19. Naresh A, Long W, Vidal GA, et al. The ERBB4/HER4 intracellular domain 4ICD is a BH3‐only protein promoting apoptosis of breast cancer cells. Cancer Res. 2006;66:6412‐6420. [DOI] [PubMed] [Google Scholar]
- 20. Thor AD, Edgerton SM, Jones FE. Subcellular localization of the HER4 intracellular domain, 4ICD, identifies distinct prognostic outcomes for breast cancer patients. Am J Pathol. 2009;175:1802‐1809. [DOI] [PMC free article] [PubMed] [Google Scholar]
- 21. Schumacher MA, Hedl M, Abraham C, et al. ErbB4 signaling stimulates pro‐inflammatory macrophage apoptosis and limits colonic inflammation. Cell Death Dis. 2017;8:e2622. [DOI] [PMC free article] [PubMed] [Google Scholar]
- 22. Jones FE. HER4 intracellular domain (4ICD) activity in the developing mammary gland and breast cancer. J Mammary Gland Biol Neoplasia. 2008;13:247‐258. [DOI] [PMC free article] [PubMed] [Google Scholar]
- 23. Das PM, Thor AD, Edgerton SM, Barry SK, Chen DF, Jones FE. Reactivation of epigenetically silenced HER4/ERBB4 results in apoptosis of breast tumor cells. Oncogene. 2010;29:5214‐5219. [DOI] [PMC free article] [PubMed] [Google Scholar]
- 24. Muraoka‐Cook RS, Sandahl M, Husted C, et al. The intracellular domain of ErbB4 induces differentiation of mammary epithelial cells. Mol Biol Cell. 2006;17:4118‐4129. [DOI] [PMC free article] [PubMed] [Google Scholar]
- 25. Strunk KE, Husted C, Miraglia LC, et al. HER4 D‐box sequences regulate mitotic progression and degradation of the nuclear HER4 cleavage product s80HER4. Cancer Res. 2007;67:6582‐6590. [DOI] [PMC free article] [PubMed] [Google Scholar]
- 26. Chua YL, Ito Y, Pole JCM, et al. The NRG1 gene is frequently silenced by methylation in breast cancers and is a strong candidate for the 8p tumour suppressor gene. Oncogene. 2009;28:4041‐4052. [DOI] [PMC free article] [PubMed] [Google Scholar]
- 27. Gallo RM, Bryant I, Fry R, Williams EE, Riese DJ. Phosphorylation of ErbB4 on Tyr1056 is critical for inhibition of colony formation by prostate tumor cell lines. Biochem Biophys Res Commun. 2006;349:372‐382. [DOI] [PMC free article] [PubMed] [Google Scholar]
- 28. Webb DR, Handel TM, Kretz‐Rommel A, Stevens RC. Opportunities for functional selectivity in GPCR antibodies. Biochem Pharmacol. 2013;85:147‐152. [DOI] [PMC free article] [PubMed] [Google Scholar]
- 29. Yea K, Zhang H, Xie J, et al. Converting stem cells to dendritic cells by agonist antibodies from unbiased morphogenic selections. Proc Natl Acad Sci USA. 2013;110:14966‐14971. [DOI] [PMC free article] [PubMed] [Google Scholar]
- 30. Robin G, Sato Y, Desplancq D, Rochel N, Weiss E, Martineau P. Restricted diversity of antigen binding residues of antibodies revealed by computational alanine scanning of 227 antibody‐antigen complexes. J Mol Biol. 2014;426:3729‐3743. [DOI] [PubMed] [Google Scholar]
- 31. Bourquard T, Musnier A, Puard V, et al. MAbTope: a method for improved epitope mapping. J Immunol. 1950;2018(201):3096‐3105. [DOI] [PubMed] [Google Scholar]
- 32. Wagner EF, Nebreda AR. Signal integration by JNK and p38 MAPK pathways in cancer development. Nat Rev Cancer. 2009;9:537‐549. [DOI] [PubMed] [Google Scholar]
- 33. Muraoka‐Cook RS, Caskey LS, Sandahl MA, et al. Heregulin‐dependent delay in mitotic progression requires HER4 and BRCA1. Mol Cell Biol. 2006;26:6412‐6424. [DOI] [PMC free article] [PubMed] [Google Scholar]
- 34. Gilmore‐Hebert M, Ramabhadran R, Stern DF. Interactions of ErbB4 and Kap1 connect the growth factor and DNA damage response pathways. Mol Cancer Res. 2010;8:1388‐1398. [DOI] [PMC free article] [PubMed] [Google Scholar]
- 35. Festjens N, Vanden Berghe T, Vandenabeele P. Necrosis, a well‐orchestrated form of cell demise: signalling cascades, important mediators and concomitant immune response. Biochim Biophys Acta. 2006;1757:1371‐1387. [DOI] [PubMed] [Google Scholar]
- 36. Chio IIC, Tuveson DA. ROS in cancer: the burning question. Trends Mol Med. 2017;23:411‐429. [DOI] [PMC free article] [PubMed] [Google Scholar]
- 37. Chen X, Levkowitz G, Tzahar E, et al. An immunological approach reveals biological differences between the two NDF/heregulin receptors, ErbB‐3 and ErbB‐4. J Biol Chem. 1996;271:7620‐7629. [PubMed] [Google Scholar]
- 38. Han W, Sfondouris ME, Jones FE. Direct coupling of the HER4 intracellular domain (4ICD) and STAT5A signaling is required to induce mammary epithelial cell differentiation. Biochem Biophys Rep. 2016;7:323‐327. [DOI] [PMC free article] [PubMed] [Google Scholar]
- 39. Starr A, Greif J, Vexler A, et al. ErbB4 increases the proliferation potential of human lung cancer cells and its blockage can be used as a target for anti‐cancer therapy. Int J Cancer. 2006;119:269‐274. [DOI] [PubMed] [Google Scholar]
- 40. Bièche I, Onody P, Tozlu S, Driouch K, Vidaud M, Lidereau R. Prognostic value of ERBB family mRNA expression in breast carcinomas. Int J Cancer. 2003;106:758‐765. [DOI] [PubMed] [Google Scholar]
- 41. Machleidt A, Buchholz S, Diermeier‐Daucher S, Zeman F, Ortmann O, Brockhoff G. The prognostic value of Her4 receptor isoform expression in triple‐negative and Her2 positive breast cancer patients. BMC Cancer. 2013;13:437. [DOI] [PMC free article] [PubMed] [Google Scholar]
- 42. Hollmén M, Määttä JA, Bald L, Sliwkowski MX, Elenius K. Suppression of breast cancer cell growth by a monoclonal antibody targeting cleavable ErbB4 isoforms. Oncogene. 2009;28:1309‐1319. [DOI] [PubMed] [Google Scholar]
- 43. Okazaki S, Nakatani F, Masuko K, et al. Development of an ErbB4 monoclonal antibody that blocks neuregulin‐1‐induced ErbB4 activation in cancer cells. Biochem Biophys Res Commun. 2016;470:239‐244. [DOI] [PubMed] [Google Scholar]
- 44. Fricker M, Tolkovsky AM, Borutaite V, Coleman M, Brown GC. Neuronal cell death. Physiol Rev. 2018;98:813‐880. [DOI] [PMC free article] [PubMed] [Google Scholar]
- 45. Han J, Back SH, Hur J, et al. ER‐stress‐induced transcriptional regulation increases protein synthesis leading to cell death. Nat Cell Biol. 2013;15:481‐490. [DOI] [PMC free article] [PubMed] [Google Scholar]
- 46. Urano F, Wang X, Bertolotti A, et al. Coupling of stress in the ER to activation of JNK protein kinases by transmembrane protein kinase IRE1. Science. 2000;287:664‐666. [DOI] [PubMed] [Google Scholar]
- 47. Fatokun AA, Dawson VL, Dawson TM. Parthanatos: mitochondrial‐linked mechanisms and therapeutic opportunities. Br J Pharmacol. 2014;171:2000‐2016. [DOI] [PMC free article] [PubMed] [Google Scholar]
- 48. Zorov DB, Juhaszova M, Sollott SJ. Mitochondrial ROS‐induced ROS release: an update and review. Biochim Biophys Acta. 2006;1757:509‐517. [DOI] [PubMed] [Google Scholar]
- 49. Liu P, Cleveland TE, Bouyain S, Byrne PO, Longo PA, Leahy DJ. A single ligand is sufficient to activate EGFR dimers. Proc Natl Acad Sci USA. 2012;109:10861‐10866. [DOI] [PMC free article] [PubMed] [Google Scholar]
- 50. Ben‐Yosef R, Starr A, Karaush V, et al. ErbB‐4 may control behavior of prostate cancer cells and serve as a target for molecular therapy. Prostate. 2007;67:871‐880. [DOI] [PubMed] [Google Scholar]
- 51. Wootten D, Christopoulos A, Sexton PM. Emerging paradigms in GPCR allostery: implications for drug discovery. Nat Rev Drug Discov. 2013;12:630‐644. [DOI] [PubMed] [Google Scholar]
- 52. Hollmén M, Liu P, Kurppa K, et al. Proteolytic processing of ErbB4 in breast cancer. PLoS One. 2012;7:e39413. [DOI] [PMC free article] [PubMed] [Google Scholar]
Associated Data
This section collects any data citations, data availability statements, or supplementary materials included in this article.
Supplementary Materials
Fig S1
Fig S2
Fig S3
Fig S4
Fig S5
Fig S6
Table S1
Appendix S1