

Abstract
Aims/hypothesis
Midlife obesity is a risk factor for dementia. We investigated the impact of obesity on brain structure, metabolism, and cerebrospinal fluid (CSF) core Alzheimer's disease (AD) biomarkers in healthy elderly.
Methods
We selected controls from ADNI2 with CSF AD biomarkers and/or fluorodeoxyglucose positron emission tomography (FDG‐PET) and 3T‐MRI. We measured cortical thickness, FDG uptake, and CSF amyloid beta (Aβ)1‐42, p‐tau, and t‐tau levels. We performed regression analyses between these biomarkers and body mass index (BMI).
Results
We included 201 individuals (mean age 73.5 years, mean BMI 27.4 kg/m2). Higher BMI was related to less cortical thickness and higher metabolism in brain areas typically not involved in AD (family‐wise error [FWE] <0.05), but not to AD CSF biomarkers. It is notable that the impact of obesity on brain metabolism and structure was also found in amyloid negative individuals.
Conclusions/interpretation
In the cognitively unimpaired elderly, obesity has differential effects on brain metabolism and structure independent of an underlying AD pathophysiology.
Keywords: body mass index, cerebrospinal fluid Alzheimer's disease biomarkers, fluorodeoxyglucose PET, magnetic resonance imaging, obesity, pre‐clinical Alzheimer's disease
1. INTRODUCTION
Obesity has become a global pandemic with multiple adverse clinical consequences. 1 Accumulating evidence demonstrates that cognition is affected by an excess of body adiposity in both adults and children. 2 , 3 , 4 , 5 Epidemiological studies also indicate that midlife obesity increases the risk of progression to mild cognitive impairment (MCI) and Alzheimer's disease (AD). 6 , 7 On the contrary, higher body mass index (BMI) in late‐life might be protective. 8 This obesity paradox might be associated with the confounding effect of weight loss in preclinical AD. 9
The exact mechanisms leading to cognitive impairment and neurodegeneration in persons with an excess of body adiposity remain to be fully elucidated. 7 Animal models suggest a significant contribution of obesity and obesity‐related metabolic disturbances to AD pathophysiology. 7 , 10 , 11 , 12 , 13 In contrast, human studies assessing the impact of obesity on amyloid and tau pathology report conflicting findings both in vivo and in post‐mortem studies. Thus, higher BMI has been related to higher, but also to lower, AD burden. 14 , 15 , 16 , 17 , 18 On the other hand, obesity might contribute to neurodegeneration by mechanisms unrelated to AD. Obesity is a state of peripheral low‐grade chronic inflammation, and it is frequently associated with an abnormal peripheral sensitivity to insulin effects. In experimental models, obesity‐related peripheral inflammation has been linked to blood‐brain barrier dysfunction, neuroinflammation, and neurodegeneration, whereas central insulin resistance has been associated with impaired synaptic plasticity and memory. 19 , 20 , 21 Furthermore, obesity is a strong risk factor for hypertension, type 2 diabetes, and dyslipidemia, and it is a well‐established cerebrovascular risk factor. 1
Brain atrophy and brain hypometabolism are well‐recognized nonspecific biomarkers of neurodegeneration. Several studies have shown an association between high BMI and brain atrophy. 22 Fewer studies have assessed the relationship between obesity and brain metabolism in cognitively healthy subjects. 23 , 24 , 25 , 26 , 27 , 28 In contrast to the consistent brain atrophy reported in magnetic resonance imaging (MRI) studies, these works have reported higher brain metabolism with respect to lean controls. 23 , 24 , 25 , 26 , 28
None of the above‐mentioned works, however, integrated biochemical and neuroimaging data. Multimodal studies might be useful to better understand the pathophysiological pathways involved in the deleterious impact of an excess of body adiposity on brain health and to explore whether obesity contributes to neurodegeneration by amyloid‐dependent or independent mechanisms.
Taking advantage of a large multicenter cohort, the Alzheimer's Disease Neurodegenerative Initiative (ADNI), we aimed to investigate the relationship between BMI and brain structure, brain metabolism, and core AD cerebrospinal fluid (CSF) biomarkers in cognitively unimpaired elderly. To examine whether the effects of obesity on brain structure and metabolism are independent of an AD process, we also investigated the aforementioned relationships in amyloid negative individuals.
2. METHODS
2.1. Study participants
Data used in the preparation of this article were obtained from the ADNI database (adni.loni.usc.edu). The ADNI was launched in 2003 by the National Institute on Aging (NIA), the National Institute of Biomedical Imaging and Bioengineering (NIBIB), the U.S. Food and Drug Administration (FDA), private pharmaceutical companies, and non‐profit organizations, as a $60 million, 5‐year public‐private partnership. The primary goal of ADNI has been to test whether serial MRI, positron emission tomography (PET), other biological markers, and clinical and neuropsychological assessment can be combined to measure the progression of MCI and early AD. The principal investigator of this initiative is Michael W. Weiner, MD, VA Medical Center and University of California, San Francisco. ADNI is the result of efforts of many co‐investigators from a broad range of academic institutions and private corporations, and subjects have been recruited from >50 sites across the United States and Canada. More information can be found in the acknowledgments section (see also http://adni-info.org/).
For the present study, we included all cognitively healthy controls from ADNI2 with biometric and biochemical data and either (a) a 3T MRI and a fluorodeoxyglucose (FDG) PET scan with a time‐lapse interval between both scans of less than 1 year or (b) CSF measurements of amyloid beta (Aβ 1‐42), total tau (t‐tau), and phosphorylated tau (p‐tau). Supplementary Figure 1 shows the study flowchart. All human subjects included in the study followed the inclusion criteria from ADNI that requires an informed consent.
Demographic (age, sex, educational level), clinical (presence of type 2 diabetes [T2D], usual medication), neuropsychological (Alzheimer Disease Assessment Scale‐Cognitive score [ADAS‐Cog], Clinical Dementia Rating Sum of Boxes [CDR‐SB], and Mini‐Mental State Examination [MMSE]), anthropometric (height, weight, and systolic and diastolic blood pressure), and laboratory data (fasting plasma glucose, cholesterol, and triglycerides) were downloaded from the ADNI database. BMI was calculated as weight in kilograms divided by height in meters squared.
2.2. MRI analysis
The details of MRI acquisition and pre‐processing are available elsewhere (http://adni-info.org/). We processed the MRIs using the cortical reconstruction pipeline of Freesurfer v5.1. (http://surfer.nmr.mgh.harvard.edu) as described previously. 32 , 33 Before the statistical analyses, we checked the estimated surfaces in order to detect and correct possible segmentation errors. We applied a smoothing kernel of 15 mm. To assess atrophy in AD vulnerable areas, we extracted the mean cortical thickness values for each subject from a well‐validated region of interest, the Dickerson's fingerprint (ie, medial temporal cortex, inferior temporal gyrus, temporal pole, angular gyrus, superior frontal gyrus, superior parietal lobule, supramarginal gyrus, precuneus, and inferior frontal sulcus of both hemispheres). 34
Research in Context
Systematic review: The authors reviewed the literature using PubMed, meeting abstracts, and presentations. Obesity has been identified as a risk factor for dementia and is related to brain atrophy in several studies. However, few works have explored the relationship between obesity and brain metabolism. These works have reported higher brain metabolism with respect to lean controls. In addition, the association between obesity and cerebrospinal fluid (CSF) Alzheimer's disease (AD) biomarkers is inconclusive. No previous multimodal studies have assessed the relationship between BMI and brain metabolism, structure, and AD biomarkers in cognitively healthy elderly. This relevant bibliography is appropriately cited.
Interpretation: Our findings demonstrate that obesity presents a significant but divergent effect on cortical structure and brain metabolism independent of AD pathology.
Future directions: In this article we propose a framework for conducting additional studies such as: (a) the role of inflammation on the brain metabolic alterations found in obesity, and (b) the AD‐independent mechanisms leading to cognitive impairment and dementia in subjects with obesity.
2.3. 18‐Fluorodeoxyglucose PET scan analysis
The details of positron‐emission tomography (PET) acquisition and pre‐processing are available elsewhere (http://adni-info.org/). Briefly, PET scans were co‐registered and averaged. Subsequently, the image was standardized to 1.5 mm cubic voxels and smoothed with an 8 mm full width at half maximum (FWHM) kernel to produce an image of a uniform resolution. Then, each FDG‐PET image was spatially normalized to each subject's Freesurfer anatomical MRI space using a rigid‐body transformation and intensity‐scaled by the pons‐vermis region as previously described. 35 The resulting images were visually‐inspected in order to check for 35 errors and projected to the middle point of the cortical ribbon. 36 Before performing statistical analyses, the resulting surfaces were smoothed using a kernel of 10 mm FWHM to obtain equivalent relative smoothing kernels for the PET and cortical thickness (CTh) maps. Surface‐based smoothing introduces less bias than volume‐based methods and substantially improves the reliability and the intersubject variability. 37 In order to assess the brain metabolism in AD vulnerable areas, we extracted the mean FDG standardized uptake value ratios (SUVRs) for each subject from a well‐validated region of interest, the Landau signature (ie, left and right angular, temporal, and posterior cingulate regions). 35
2.4. Cerebrospinal fluid (CSF) data
The details of the CSF analysis have been described in http://adni-info.org. Briefly, pristine aliquots were examined by the validated and highly automated Roche Elecsys electrochemiluminescence immunoassays. This methodology minimizes inter‐run variability for Aβ1‐42, t‐tau, and p‐tau levels in CSF. The cutoff used for Aβ1‐42 was 977 pg/mL. 38
2.5. Statistical methods
Demographic, clinical, anthropometric, and cognitive variables were analyzed by R statistical software (version 3.4.4; http://www.r-project.org).
To assess the relationship between BMI and both the neuroimaging and core AD CSF biomarkers, we performed regression analyses. For the neuroimaging metrics, we first executed vertex‐wise correlation analyses between BMI and both CTh and FDG uptake in the whole sample including age, sex, and triglycerides, variables significantly correlated with BMI, as covariates. The figures show only those results that survived the family‐wise error (FWE) correction at P < 0.05 as implemented in Freesurfer. Second, we performed regression analyses between BMI and MRI and FDG‐PET AD signatures, mean CTh and SUVRs and the core AD CSF biomarkers including age, sex, and triglycerides as covariates.
To further assess a potential influence of preclinical AD, we performed regression analyses, with and without including the core AD CSF biomarkers as covariates, and stratified analyses in the amyloid‐positive and amyloid‐negative groups separately.
3. RESULTS
We included 201 subjects (50.3% male) in the study with a mean age of 73.5 years (range: 56.2 to 89.1) and a mean BMI of 27.4 kg/m2 (range: 20.0 to 39.1). There were no differences in these variables between the subset of patients with MRI and FDG (N = 168) and the subset of subjects with CSF (N = 178). Table 1 summarizes the demographic, clinical, neuropsychological, anthropometrical, and biochemical data for the two study subsets. There were no differences in any of the variables between the subsample with CSF biomarkers and the whole sample. Of the whole sample, 29.2% of participants had abnormal levels of Aβ1‐42. BMI was weakly correlated with fasting triglycerides levels (r = 0.18, P = 0.02). There was no correlation between BMI and education, baseline cognitive performance, systolic or diastolic blood pressure, total cholesterol, or fasting glucose levels.
TABLE 1.
Demographic, clinical, neuropsychological, anthropometrical, and biochemical data for the study subsets (CSF and MRI‐PET samples)
| CSF sample | MRI‐PET sample | P | |
|---|---|---|---|
| N | 178 | 168 | |
| Gender = Male (%) | 89 (50.0) | 85 (50.6) | .998 |
| Age, mean (SD) | 73.41 (6.25) | 73.65 (6.30) | .726 |
| BMI, mean (SD) | 27.36 (4.02) | 27.15 (3.92) | .627 |
| SBP, mean (SD) | 133.77 (15.90) | 134.87 (16.04) | .523 |
| DBP, mean (SD) | 73.61 (9.23) | 74.86 (10.08) | .231 |
| Glycemia, mean (SD) | 99.79 (18.19) | 98.20 (17.89) | .413 |
| Total cholesterol, mean (SD) | 189.25 (36.69) | 190.59 (36.34) | .734 |
| Triglycerides, mean (SD) | 133.97 (72.08) | 138.55 (79.70) | .574 |
| Years of Education, mean (SD) | 16.57 (2.46) | 16.52 (2.56) | .856 |
| APOE ε4 = Positive (%) | 48 (27.0) | 49 (29.2) | .737 |
| MMSE, mean (SD) | 29.00 (1.27) | 29.03 (1.27) | .828 |
| ADAS11, mean (SD) | 5.87 (3.13) | 5.70 (2.91) | .617 |
| ADAS13, mean (SD) | 9.10 (4.56) | 9.00 (4.42) | .834 |
| T2D = Positive (%) | 31 (17.4) | 23 (13.7) | .420 |
| CSF Aβ1‐42, mean (SD) | 1386.95 (656.68) | 1397.40 (661.87) | .887 |
| CSF t‐tau, mean (SD) | 235.61 (89.71) | 236.15 (92.48) | .958 |
| CSF p‐tau, mean (SD) | 21.48 (9.10) | 21.54 (9.10) | .955 |
3.1. Higher body mass index (BMI) is associated with increased cerebral metabolism and cortical atrophy in areas not typically involved in Alzheimer's disease (AD)
Figure 1A and 1B show the association between BMI and FDG uptake across the cortical mantle. Higher BMI was associated with higher cerebral FDG uptake in widespread brain areas including the inferior temporal lobe of the left hemisphere, insula of the right hemisphere and anterior cingulate, medial frontal, and orbitofrontal regions of both hemispheres (FWE < 0.05). Figure 1C and D show the association between BMI and CTh in the same individuals. Higher BMI was associated with lower cortical thickness in areas that included superior medial frontal regions of the right hemisphere and inferior temporal zones of the left hemisphere (FWE < 0.05).
FIGURE 1.

Cortical vertex‐wise pattern of the relationship between BMI and both FDG (A) and CTh (C) adjusted by age, gender, and triglycerides. Only clusters that survived family‐wise error corrected P‐value < 0.05 are shown. Red‐yellow scale color is used to display positive correlations in relation to FDG uptake and blue‐green scale is used for negative correlations in relation with CTh. Scatter plots in B and D show the relationship between BMI and mean FDG uptake and mean CTh in the cluster ROIs in A and C
The areas of increased brain metabolism and less cortical thickness showed little overlap. Of note, these regions also had very little overlap with the Landau's and Dickerson's signature, respectively. Moreover, BMI was not significantly associated with CTh or with FDG in the Dickerson's and Landau's signatures (P = 0.41 and P = 0.50, respectively) (supplementary Figure 2).
3.2. Higher BMI is not associated with CSF AD biomarkers
We found no relationship between BMI and CSF Aβ1‐42 (P = 0.15), CSF p‐tau (P = 0.43), or CSF total tau (P = 0.35, respectively) levels (Figure 2). Neither did we find any association between BMI and CSF biomarkers when analyzing the amyloid‐positive and amyloid‐negative groups separately (supplementary Figure 3).
FIGURE 2.
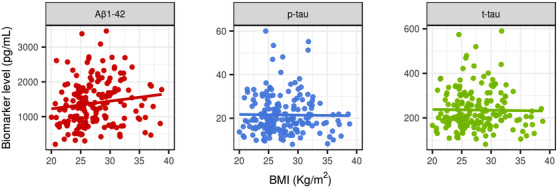
Scatter plots showing the lack of relationship between BMI and AD CSF biomarkers. From left to right: Aβ1‐42, p‐tau, and t‐tau
3.3. The impact of BMI on neuroimaging biomarkers is independent of AD pathophysiology
To test the influence of AD biomarkers on neuroimaging outcomes, we repeated the analyses including Aβ1‐42 and t‐tau as covariates, and we performed stratified analyses in amyloid‐positive and amyloid‐negative individuals. The inclusion of CSF biomarker levels did not affect the results, which remained qualitatively the same (supplementary Figure 4).
The stratified analyses in the amyloid‐positive and amyloid‐negative participants separately, despite the smaller sample size, showed that higher BMI was related to higher FDG uptake in both groups. Brain atrophy in relation to higher BMI was significant only in the amyloid‐negative group (Figure 3).
FIGURE 3.
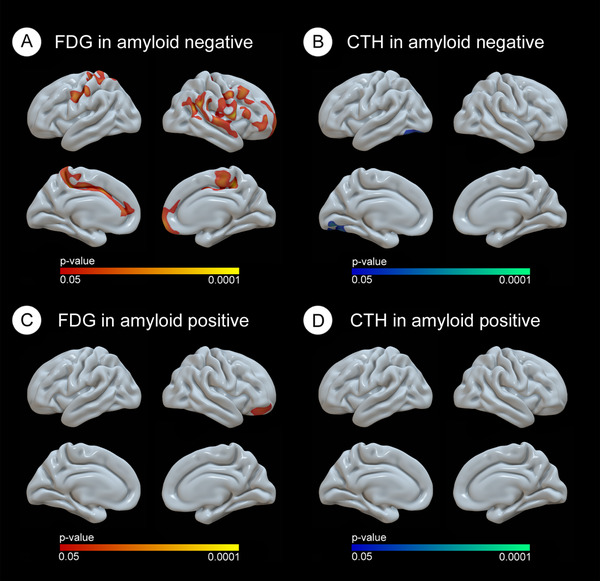
Cortical vertex‐wise pattern of the relationship between BMI and both FDG and CTh depending on their Aβ1‐42 status. Only clusters that survived family‐wise error corrected P‐value < 0.05 are shown. Red‐yellow scale color is used to display positive correlations in relation with FDG uptake and blue‐green scale is used for negative correlations in relation with CTh
4. DISCUSSION
In this study, we found a differential influence of obesity on brain structure and brain metabolism. Higher BMI was associated with increased brain metabolic activity, but at the same time with less cortical thickness. The affected zones did not overlap with the typical AD vulnerable areas. Furthermore, BMI was not associated with core CSF AD biomarkers and the results were also found in amyloid‐negative participants, suggesting that these changes are independent of an underlying AD pathophysiology.
We first analyzed the relationship between brain metabolism and BMI. Only two cross‐sectional and three longitudinal previous studies have assessed the relationship between brain metabolism and obesity in middle‐aged individuals. 23 , 24 , 26 , 27 , 28 The results of the cross‐sectional studies were conflicting. Wang et al. observed higher brain metabolism in the parietal cortices of 20 middle‐aged participants with morbid obesity as compared with 10 lean controls, whereas Volkow et al. found a negative relationship between BMI and FDG uptake in prefrontal areas. 27 , 28 Of note, only 3 of the 21 participants evaluated in the latter study had BMIs in the obesity range. 27 All three longitudinal studies assessed brain metabolism in middle‐aged individuals with morbid obesity before and after bariatric surgery–induced weight loss. 23 , 24 , 26 Marques et al. described brain hypermetabolism in 17 women with severe obesity as compared with 16 lean controls, which normalized after weight loss. 23 Brain metabolism normalization in this study was associated with cognitive improvement. 23 Tuulari et al. and Rebelos et al. did not observe differences in brain metabolism between participants with morbid obesity and controls in fasting conditions, but both found higher insulin‐stimulated FDG uptake. 24 , 26 The low number of controls in these two studies (n = 7 and n = 12, respectively) might have limited the statistical power to detect subtle differences during fasting conditions. Nonetheless, in both studies, brain metabolic abnormalities normalized after bariatric surgery. 24 , 26 Only one previous study assessed the relationship between BMI and brain FDG uptake in healthy elderly. This study, also in the ADNI cohort, included 222 participants and also showed higher brain metabolic activity in relation to higher BMI mostly in women. 25 Altogether, our results and the aforementioned studies suggest that obesity is associated with increased FDG uptake in the brain.
We also evaluated the relationship between obesity and cortical thickness in the same sample. In accordance with previous results from our group and others, we observed cortical thinning associated with increasing BMI. 9 , 22 , 39 , 40 , 41
The regions affected by atrophy and higher metabolism in our study showed little overlap with the typical vulnerable AD regions. It is important to note that we did not find any association between BMI and the CTh and brain metabolism in two of the most commonly used AD signatures. 34 , 35 Furthermore, we did not find any association between BMI and CSF amyloid or tau levels, and the inclusion of CSF biomarkers in the analyses yielded qualitatively the same results. Finally, in the analyses stratified by amyloid status, amyloid‐negative participants showed a pattern of changes similar to that observed in the whole cohort. Altogether, these results suggest that the aforementioned cortical changes are independent of an underlying AD process.
Other cross‐sectional studies in cognitively normal controls showed greater amyloid and tau burden associated with lower late‐life BMI. 17 , 18 , 42 On the contrary, the only two previous longitudinal studies showed greater amyloid deposition late in life in relation with mid‐life obesity. 15 , 16 Discrepancies between mid‐life and late‐life studies might be explained by reverse causation (ie, AD‐related weight loss in preclinical AD), selection and survival biases (ie, higher mortality and dementia risk in persons with obesity might determine that only those specially protected against obesity consequences survived and/or maintained normal cognition late in life), or by the existence of additive and/or competing risk (ie, obesity not only promote neurodegeneration throughout AD pathophysiological mechanisms and therefore only those with lower AD burden remain cognitively normal late in life). 9 , 29 , 30 , 43 Thus, although a contribution of obesity to AD pathophysiological processes cannot be completely ruled out, our results reinforce the notion that obesity affects brain metabolism and structure by mechanisms independent of AD pathophysiology.
The mechanisms mediating the structural and metabolic brain abnormalities in individuals with obesity are beyond the objectives of the present work, and deserve further research. 47 The finding of higher brain metabolism with increased BMI is relatively unexpected. We hypothesize that this finding might reflect obesity‐induced neuroinflammation and astrogliosis. Of interest, in the aforementioned studies with subjects who underwent bariatric surgery, higher FDG cerebral uptake correlated with markers of systemic inflammation. 23 , 24 In this sense, although brain glucose metabolism is considered a marker of neuronal activity, FDG‐PET signal has recently been demonstrated to be also located in astrocytes. 44 In addition, animal studies combining FDG‐PET and PET with tracers for activated microglia confirmed a highly co‐localized signal of increased glucose metabolism and neuroinflammation in both wild‐type aging mice and AD transgenic mice. 45 , 46 It is interesting to note that in wild‐type mice an uncoupling between glucose metabolism and neuroinflammation was observed at older ages, that is, neuroinflammation persisted but glucose metabolism returned to baseline values. This late‐life uncoupling has been attributed to the progression of age‐dependent neurodegeneration. 46 In this same line, a triple‐tracer study performed in AD transgenic mice showed age‐dependent microglial activation, which positively correlates with amyloid load and brain metabolism. Nonetheless, in this study, brain hypermetabolism was observed especially at younger ages, and declined in relation to increasing amyloid burden, thus suggesting that synaptic dysfunction might mask inflammation‐related hypermetabolism. 45 In the same line, in our study, the relationship between obesity and increased brain metabolism was attenuated in participants with preclinical AD. Further studies are required to better understand the contribution of peripheral and central nervous system inflammation or other mechanisms to the brain metabolic changes, which are present in obesity.
This study has limitations. First, as it is cross‐sectional, a causal relationship between BMI and brain neuroimaging abnormalities cannot be assessed. Second, there is a significant bias in the ADNI cohort, which excluded participants with large vascular burden and comprises mainly Caucasian participants. This selection bias might explain the healthier than expected phenotype of cognitively healthy ADNI participants with obesity. Of note, we did not find the expected correlation between BMI and fasting plasmatic glucose and systolic or diastolic blood pressure. This bias precludes the generalization of our results to broader obese populations. Third, there is evidence that both insulin resistance and variability in fasting glucose levels can affect FDG uptake among cognitively normal middle‐aged individuals. 47 , 48 Given that there is sparse data available in ADNI to better characterize the glucometabolic status in our subjects, the degree of increase in FDG uptake reported here needs to be confirmed among individuals with more detailed evaluation of glucose tolerance status and appropriate measures of insulin sensitivity. Nonetheless, it should be underscored that no significant correlation between fasting glucose levels and BMI was found in our cohort, and that the impact of insulin sensitivity on brain metabolism was not consistent among studies. 23 , 24 , 26 , 48 , 49 Fourth, other relevant variables closely related to body weight, including dietary habits and physical activity, which have been previously related to brain health, are not available in ADNI.
In conclusion, obesity presents a significant and divergent effect on cortical structure and brain glucose metabolism in areas not typically involved in AD and independent of the AD pathophysiological process. Further studies are needed to explore the association of these changes with obese‐related neuroinflammation or other mechanisms.
CONFLICTS OF INTEREST
All authors declare no biomedical financial interests or potential conflicts of interest related to this work.
Supporting information
Supplementary materials
Figure S1 Flowchart showing the sample used in this work
Figure S2 Scatter plots showing the lack of correlation between BMI and Dickerson AD signature in CTh (right) and Landau AD signature in FDG (left).
Figure S3 Scatter plots showing the lack of relationship between BMI and AD CSF biomarkers when dividing by amyloid positivity status. Top panel shows the amyloid‐negative subjects, whereas the bottom panel shows the amyloid positive. From left to right: Aß1‐42, p‐tau, and total tau.
Figure S4 Cortical vertex‐wise pattern of the relationship between BMI and both FDG (A) and CTh (B) adjusted by age, gender, triglycerides, and CSF AD biomarkers (Aß1‐42 and total tau). Only clusters that survived family wise error corrected P‐value <0.05 are shown. Red‐yellow scale color is used to display positive correlations in relation to FDG uptake, and blue‐green scale is used for negative correlations in relation with CTh.
ACKNOWLEDGMENTS
This study was supported by the Fondo de Investigaciones Sanitario (FIS), Instituto de Salud Carlos III (PI14/01126 and PI17/01019 to Juan Fortea, PI13/01532 and PI16/01825 to Rafael Blesa, PI18/00335 to María Carmona‐Iragui., PI18/00435 to Daniel Alcolea, PI14/1561 and PI17/01896 to Alberto Lleó, PI17/00279 to Amanda Jiménez, and FI18/00275 to Víctor Montal) and the CIBERNED program (Program 1, Alzheimer Disease to Alberto Lleó and SIGNAL study, www.signalstudy.es); and partly jointly funded by Fondo Europeo de Desarrollo Regional, Unión Europea, Una manera de hacer Europa. This work was also supported by the National Institutes of Health (NIA grants 1R01AG056850 ‐ 01A1; R21AG056974, and R01AG061566 to Juan Fortea), Fundació La Marató de TV3 (20141210 to Juan Fortea, 044412 to Amanda Jiménez and Rafael Blesa). This work was also supported by the “Pla Estratègic de Recerca i Innovació en Salut” (PERIS) (SLT006/17/00119 to Juan Fortea, and SLT006/17/00125 to Daniel Alcolea and SLT008/18/00127 to Amanda Jiménez) and a grant from the Fundació Bancaria La Caixa to Rafael Blesa. The work of Adriana Pané is supported by the “ Ajut a la Recerca Josep Font” (Hospital Clinic de Barcelona). In addition, we would like to also thank Dr. Dickerson for allowing the use of the cortical fingerprint in this work.
Data collection and sharing for this project was funded by the Alzheimer's Disease Neuroimaging Initiative (ADNI) (National Institutes of Health Grant U01 AG024904) and DOD ADNI (Department of Defense award number W81XWH‐12‐2‐0012). ADNI is funded by the National Institute on Aging, the National Institute of Biomedical Imaging and Bioengineering, and through generous contributions from the following: AbbVie, Alzheimer's Association; Alzheimer's Drug Discovery Foundation; Araclon Biotech; BioClinica, Inc.; Biogen; Bristol‐Myers Squibb Company; CereSpir, Inc.; Eisai Inc.; Elan Pharmaceuticals, Inc.; Eli Lilly and Company; EuroImmun; F. Hoffmann‐La Roche Ltd and its affiliated company Genentech, Inc.; Fujirebio; GE Healthcare; IXICO Ltd.; Janssen Alzheimer Immunotherapy Research & Development, LLC.; Johnson & Johnson Pharmaceutical Research & Development LLC.; Lumosity; Lundbeck; Merck & Co., Inc.; Meso Scale Diagnostics, LLC.; NeuroRx Research; Neurotrack Technologies; Novartis Pharmaceuticals Corporation; Pfizer Inc.; Piramal Imaging; Servier; Takeda Pharmaceutical Company; and Transition Therapeutics. The Canadian Institutes of Health Research is providing funds to support ADNI clinical sites in Canada. Private sector contributions are facilitated by the Foundation for the National Institutes of Health (www.fnih.org). The grantee organization is the Northern California Institute for Research and Education, and the study is coordinated by the Alzheimer's Disease Cooperative Study at the University of California, San Diego. ADNI data are disseminated by the Laboratory for Neuro Imaging at the University of Southern California.
Pegueroles J, Pané A, Vilaplana E, et al. Obesity impacts brain metabolism and structure independently of amyloid and tau pathology in healthy elderly. Alzheimer's Dement. 2020;12:1–9. 10.1002/dad2.12052
Jordi Pegueroles and Adriana Pané contributed equally to this work.
Juan Fortea and Amanda Jiménez shared the senior authorship.
Contributor Information
Juan Fortea, Email: jfortea@santpau.cat.
Amanda Jiménez, Email: ajimene1@clinic.cat.
REFERENCES
- 1. Afshin A, Forouzanfar MH, Reitsma MB, et al. Health effects of overweight and obesity in 195 countries over 25 years. N Engl J Med. 2017;377:13‐27 [DOI] [PMC free article] [PubMed] [Google Scholar]
- 2. Cournot M, Marquie JC, Ansiau D, et al. Relation between body mass index and cognitive function in healthy middle‐aged men and women. Neurology. 2006;67:1208‐1214. [DOI] [PubMed] [Google Scholar]
- 3. Liang J, Matheson BE, Kaye WH, Boutelle KN. Neurocognitive correlates of obesity and obesity‐related behaviors in children and adolescents. Int J Obes (Lond). 2014;38:494‐506. [DOI] [PMC free article] [PubMed] [Google Scholar]
- 4. Yau PL, Castro MG, Tagani A, Tsui WH, Convit A. Obesity and metabolic syndrome and functional and structural brain impairments in adolescence. Pediatrics. 2012;130:e856‐e864. [DOI] [PMC free article] [PubMed] [Google Scholar]
- 5. Yau PL, Kang EH, Javier DC, Convit A. Preliminary evidence of cognitive and brain abnormalities in uncomplicated adolescent obesity. Obesity (Silver Spring). 2014;22:1865‐1871. [DOI] [PMC free article] [PubMed] [Google Scholar]
- 6. Anstey KJ, Cherbuin N, Budge M, Young J. Body mass index in midlife and late‐life as a risk factor for dementia: a meta‐analysis of prospective studies. Obes Rev. 2011;12:e426‐e437. [DOI] [PubMed] [Google Scholar]
- 7. O'Brien PD, Hinder LM, Callaghan BC, Feldman EL. Neurological consequences of obesity. Lancet Neurol. 2017;16:465‐477. [DOI] [PMC free article] [PubMed] [Google Scholar]
- 8. Fitzpatrick AL, Kuller LH, Lopez OL, et al. Midlife and late‐life obesity and the risk of dementia. Arch Neurol. 2009;66:336‐342. [DOI] [PMC free article] [PubMed] [Google Scholar]
- 9. Pegueroles J, Jimenez A, Vilaplana E, et al. Obesity and Alzheimer's disease, does the obesity paradox really exist? A magnetic resonance imaging study. Oncotarget. 2018;9:34691‐34698. [DOI] [PMC free article] [PubMed] [Google Scholar]
- 10. Bhat NR, Thirumangalakudi L. Increased tau phosphorylation and impaired brain insulin/IGF signaling in mice fed a high fat/high cholesterol diet. J Alzheimers Dis. 2013;36:781‐789. [DOI] [PMC free article] [PubMed] [Google Scholar]
- 11. Li XH, Lv BL, Xie JZ, Liu J, Zhou XW, Wang JZ. AGEs induce Alzheimer‐like tau pathology and memory deficit via RAGE‐mediated GSK‐3 activation. Neurobiol Aging. 2012;33:1400‐1410. [DOI] [PubMed] [Google Scholar]
- 12. Maphis N, Xu G, Kokiko‐Cochran ON, et al. Reactive microglia drive tau pathology and contribute to the spreading of pathological tau in the brain. Brain. 2015;138:1738‐1755. [DOI] [PMC free article] [PubMed] [Google Scholar]
- 13. Walker JM, Dixit S, Saulsberry AC, May JM, Harrison FE. Reversal of high fat diet‐induced obesity improves glucose tolerance, inflammatory response, β‐amyloid accumulation and cognitive decline in the APP/PSEN1 mouse model of Alzheimer's disease. Neurobiol Dis. 2017;100:87‐98. [DOI] [PMC free article] [PubMed] [Google Scholar]
- 14. Buchman AS, Schneider JA, Wilson RS, Bienias JL, Bennett DA. Body mass index in older persons is associated with Alzheimer disease pathology. Neurology. 2006;67:1949‐1954. [DOI] [PubMed] [Google Scholar]
- 15. Chuang YF, An Y, Bilgel M, et al. Midlife adiposity predicts earlier onset of Alzheimer's dementia, neuropathology and presymptomatic cerebral amyloid accumulation. Mol Psychiatry. 2016;21:910‐915. [DOI] [PMC free article] [PubMed] [Google Scholar]
- 16. Gottesman RF, Schneider AL, Zhou Y, et al. Association between midlife vascular risk factors and estimated brain amyloid deposition. JAMA. 2017;317:1443‐1450. [DOI] [PMC free article] [PubMed] [Google Scholar]
- 17. Hsu DC, Mormino EC, Schultz AP, et al. Lower late‐life body‐mass index is associated with higher cortical amyloid burden in clinically normal elderly. J Alzheimers Dis. 2016. [DOI] [PMC free article] [PubMed] [Google Scholar]
- 18. Vidoni ED, Townley RA, Honea RA, Burns JM. Alzheimer disease biomarkers are associated with body mass index. Neurology. 2011;77:1913‐1920. [DOI] [PMC free article] [PubMed] [Google Scholar]
- 19. Mamo JCL, Lam V, Giles C, et al. Antihypertensive agents do not prevent blood‐brain barrier dysfunction and cognitive deficits in dietary‐induced obese mice. Int J Obes (Lond). 2017;41:926‐934. [DOI] [PubMed] [Google Scholar]
- 20. Nakandakari SCBR, Munoz VR, Kuga GK, et al. Short‐term high‐fat diet modulates several inflammatory, ER stress, and apoptosis markers in the hippocampus of young mice. Brain Behav Immun. 2019;79:284‐293. [DOI] [PubMed] [Google Scholar]
- 21. Spinelli M, Fusco S, Mainardi M, et al. Brain insulin resistance impairs hippocampal synaptic plasticity and memory by increasing GluA1 palmitoylation through FoxO3a. Nat Commun. 2017;8:2009. [DOI] [PMC free article] [PubMed] [Google Scholar]
- 22. Willette AA, Kapogiannis D. Does the brain shrink as the waist expands?. Ageing Res Rev. 2015;20:86‐97. [DOI] [PMC free article] [PubMed] [Google Scholar]
- 23. Marques EL, Halpern A, Correa MM, et al. Changes in neuropsychological tests and brain metabolism after bariatric surgery. J Clin Endocrinol Metab. 2014;99:E2347‐E2352. [DOI] [PubMed] [Google Scholar]
- 24. Rebelos E, Immonen H, Bucci M, et al. Brain glucose uptake is associated with endogenous glucose production in obese patients before and after bariatric surgery and predicts metabolic outcome at follow‐up. Diabetes Obes Metab. 2019;21:218‐226. [DOI] [PMC free article] [PubMed] [Google Scholar]
- 25. Sala A, Malpetti M, Ferrulli A, Gianolli L, Luzi L, Perani D. High body mass index, brain metabolism and connectivity: an unfavorable effect in elderly females. Aging (Albany NY). 2019;11. [DOI] [PMC free article] [PubMed] [Google Scholar]
- 26. Tuulari JJ, Karlsson HK, Hirvonen J, et al. Weight loss after bariatric surgery reverses insulin‐induced increases in brain glucose metabolism of the morbidly obese. Diabetes. 2013;62:2747‐2751. [DOI] [PMC free article] [PubMed] [Google Scholar]
- 27. Volkow ND, Wang GJ, Telang F, et al. Inverse association between BMI and prefrontal metabolic activity in healthy adults. Obesity (Silver Spring). 2009;17:60‐65. [DOI] [PMC free article] [PubMed] [Google Scholar]
- 28. Wang GJ, Volkow ND, Felder C, et al. Enhanced resting activity of the oral somatosensory cortex in obese subjects. Neuroreport. 2002;13:1151‐1155. [DOI] [PubMed] [Google Scholar]
- 29. Alhurani RE, Vassilaki M, Aakre JA, et al. Decline in weight and incident mild cognitive impairment. JAMA Neurol. 2016. [DOI] [PMC free article] [PubMed] [Google Scholar]
- 30. Jimenez A, Pegueroles J, Carmona‐Iragui M, et al. Weight loss in the healthy elderly might be a non‐cognitive sign of preclinical Alzheimer's disease. Oncotarget. 2017;8:104706‐104716. [DOI] [PMC free article] [PubMed] [Google Scholar]
- 31. Muller S, Preische O, Sohrabi HR, et al. Decreased body mass index in the preclinical stage of autosomal dominant Alzheimer's disease. Sci Rep. 2017;7:1225. [DOI] [PMC free article] [PubMed] [Google Scholar]
- 32. Fischl B, Dale AM. Measuring the thickness of the human cerebral cortex from magnetic resonance images. Proc Natl Acad Sci U S A. 2000;97:11050‐11055. [DOI] [PMC free article] [PubMed] [Google Scholar]
- 33. Fortea J, Vilaplana E, Alcolea D, et al. Cerebrospinal fluid β‐amyloid and phospho‐tau biomarker interactions affecting brain structure in preclinical Alzheimer disease. Ann Neurol. 2014;76:223‐230. [DOI] [PubMed] [Google Scholar]
- 34. Dickerson BC, Bakkour A, Salat DH, et al. The cortical signature of Alzheimer's disease: regionally specific cortical thinning relates to symptom severity in very mild to mild AD dementia and is detectable in asymptomatic amyloid‐positive individuals. Cereb Cortex. 2009;19:497‐510. [DOI] [PMC free article] [PubMed] [Google Scholar]
- 35. Landau SM, Harvey D, Madison CM, et al. Associations between cognitive, functional, and FDG‐PET measures of decline in AD and MCI. Neurobiol Aging. 2011;32:1207‐1218. [DOI] [PMC free article] [PubMed] [Google Scholar]
- 36. Greve DN, Svarer C, Fisher PM, et al. Cortical surface‐based analysis reduces bias and variance in kinetic modeling of brain PET data. Neuroimage. 2014;92:225‐236. [DOI] [PMC free article] [PubMed] [Google Scholar]
- 37. Greve DN, Salat DH, Bowen SL, et al. Different partial volume correction methods lead to different conclusions: an 18F‐FDG‐PET study of agingcorrection methods lead to different conclusions: an (18)F‐FDG‐PET study of aging. Neuroimage. 2016;132:334‐343. [DOI] [PMC free article] [PubMed] [Google Scholar]
- 38. Hansson O, Seibyl J, Stomrud E, et al. CSF biomarkers of Alzheimer's disease concord with amyloid‐β PET and predict clinical progression: a study of fully automated immunoassays in BioFINDER and ADNI cohorts. Alzheimers Dement. 2018;14:1470‐1481. [DOI] [PMC free article] [PubMed] [Google Scholar]
- 39. Franz CE, Xian H, Lew D, et al. Body mass trajectories and cortical thickness in middle‐aged men: a 42‐year longitudinal study starting in young adulthood. Neurobiol Aging. 2019;79:11‐21. [DOI] [PMC free article] [PubMed] [Google Scholar]
- 40. Shaw ME, Sachdev PS, Abhayaratna W, Anstey KJ, Cherbuin N. Body mass index is associated with cortical thinning with different patterns in mid‐ and late‐life. Int J Obes (Lond). 2017; 42(3):455‐461. doi: 10.1038/ijo.2017.254. [DOI] [PubMed] [Google Scholar]
- 41. Shaw ME, Abhayaratna WP, Anstey KJ, Cherbuin N. Increasing body mass index at midlife is associated with increased cortical thinning in Alzheimer's disease‐vulnerable regions. J Alzheimers Dis. 2017;59:113‐120. [DOI] [PubMed] [Google Scholar]
- 42. Thirunavu V, McCullough A, Su Y, et al. Higher body mass index is associated with lower cortical amyloid‐β burden in cognitively normal individuals in late‐life. J Alzheimers Dis. 2019;69:817‐827. [DOI] [PMC free article] [PubMed] [Google Scholar]
- 43. Weuve J, Proust‐Lima C, Power MC, et al. Guidelines for reporting methodological challenges and evaluating potential bias in dementia research. Alzheimers Dement. 2015;11:1098‐1109. [DOI] [PMC free article] [PubMed] [Google Scholar]
- 44. Zimmer ER, Parent MJ, Souza DG, et al. [18F]FDG PET signal is driven by astroglial glutamate transport. Nat Neurosci. 2017;20:393‐395. [DOI] [PMC free article] [PubMed] [Google Scholar]
- 45. Brendel M, Probst F, Jaworska A, et al. Glial activation and glucose metabolism in a transgenic amyloid mouse model: a triple‐tracer PET study. J Nucl Med. 2016;57:954‐960. [DOI] [PubMed] [Google Scholar]
- 46. Brendel M, Focke C, Blume T, et al. Time courses of cortical glucose metabolism and microglial activity across the life span of wild‐type mice: a PET study. J Nucl Med. 2017;58:1984‐1990. [DOI] [PubMed] [Google Scholar]
- 47. Baker LD, Cross DJ, Minoshima S, Belongia D, Watson GS, Craft S. Insulin resistance and Alzheimer‐like reductions in regional cerebral glucose metabolism for cognitively normal adults with prediabetes or early type 2 diabetes. Arch Neurol. 2011;68:51‐57. [DOI] [PMC free article] [PubMed] [Google Scholar]
- 48. Willette AA, Bendlin BB, Starks EJ, et al. Association of insulin resistance with cerebral glucose uptake in late middle‐aged adults at risk for Alzheimer disease. JAMA Neurol. 2015;72:1013‐1020. [DOI] [PMC free article] [PubMed] [Google Scholar]
- 49. Willette AA, Modanlo N, Kapogiannis D. Insulin resistance predicts medial temporal hypermetabolism in mild cognitive impairment conversion to Alzheimer disease. Diabetes. 2015;64:1933‐1940. [DOI] [PMC free article] [PubMed] [Google Scholar]
Associated Data
This section collects any data citations, data availability statements, or supplementary materials included in this article.
Supplementary Materials
Supplementary materials
Figure S1 Flowchart showing the sample used in this work
Figure S2 Scatter plots showing the lack of correlation between BMI and Dickerson AD signature in CTh (right) and Landau AD signature in FDG (left).
Figure S3 Scatter plots showing the lack of relationship between BMI and AD CSF biomarkers when dividing by amyloid positivity status. Top panel shows the amyloid‐negative subjects, whereas the bottom panel shows the amyloid positive. From left to right: Aß1‐42, p‐tau, and total tau.
Figure S4 Cortical vertex‐wise pattern of the relationship between BMI and both FDG (A) and CTh (B) adjusted by age, gender, triglycerides, and CSF AD biomarkers (Aß1‐42 and total tau). Only clusters that survived family wise error corrected P‐value <0.05 are shown. Red‐yellow scale color is used to display positive correlations in relation to FDG uptake, and blue‐green scale is used for negative correlations in relation with CTh.