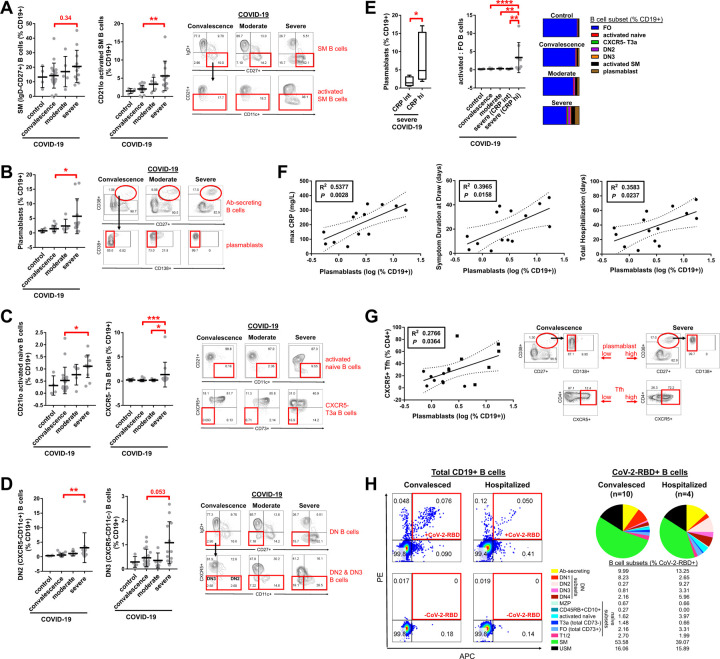
Fig. 7. Increased activated B cell subsets specific for CoV-2-RBD in the peripheral blood of patients with severe COVID-19.
Quantitation of (A) switched memory (SM) B cells, (B) plasmablasts, (C) activated naïve and CXCR5- late transitional (T3a) B cells, (D) double negative (DN) B cells, and (E, right) total (sum) activated to follicular B cell ratios in the peripheral blood of patients with COVID-19 at states of convalescence (n=19), moderate disease (n=5), and severe disease (n=12) as defined by the clinical criteria listed in Table S2 as compared to healthy controls (n=4). Quantitation shown by B cell level for each individual patient with mean, standard deviation, and significance by one-way ANOVA of log % B cell value indicated (*P < 0.05, **P < 0.01, ***P < 0.001, ****P < 0.0001). Representative dot plots shown with full B cell flow cytometry gating strategy outlined in Fig. S6. (E, left) Quantitation of plasmablast frequency in the peripheral blood of patients with severe COVID-19 subdivided by intermediate (int, < 200 mg/L) versus high (hi, > 200 mg/L) maximum C-reactive protein (CRP) level and shown as box and whiskers plot with significance by Student’s t-test of log % B cell value indicated (*p < 0.05). (F) Association of plasmablast frequency in the peripheral blood of hospitalized COVID-19 patients (moderate and severe disease) with maximum CRP level, symptom duration at blood draw, and total length of hospital stay by linear regression with individual patients, 95% confidence bands, R2 and P values shown. (G) Association of plasmablast frequency in the peripheral blood of COVID-19 patients with T follicular helper cell frequency by linear regression with individual patients (squares indicating severe disease), 95% confidence bands, R2 and P values shown. Representative dot plots shown. (H) Summation of all CD19+ B cells binding to CoV-2-RBD shown for n=10 convalesced and n=4 hospitalized COVID-19 patients with % CoV2-RBD reactivity by B cell subset indicated and representative dot plots shown. % CoV-2-RBD reactivity by B cell subset per individual patient further detailed in Fig. S7. DN2 and DN3 Double negative B cells are CXCR5 low, while DN1 and DN4 B cells are CXCR5hi.

