

Abstract
Elemicin, an alkenylbenzene constituent of natural oils of several plant species, is widely distributed in food, dietary supplements, and medicinal plants. 1′-Hydroxylation is known to cause metabolic activation of alkenylbenzenes leading to their potential toxicity. The aim of this study was to explore the relationship between elemicin metabolism and its toxicity through comparing the metabolic maps between elemicin and 1′-hydroxyelemicin. Elemicin was transformed into a reactive metabolite of 1′-hydroxyelemicin, which was subsequently conjugated with cysteine (Cys) and N-acetylcysteine (NAC). Administration of NAC could significantly ameliorate the elemicin- and 1′-hydroxyelemicin-induced cytotoxicity of HepG2 cells, while depletion of Cys with diethyl maleate (DEM) increased cytotoxicity. Recombinant human CYP screening and CYP inhibition experiments revealed that multiple CYPs, notably CYP1A1, CYP1A2, and CYP3A4, were responsible for the metabolic activation of elemicin. This study revealed that metabolic activation plays a critical role in elemicin cytotoxicity.
Keywords: elemicin, 1′-hydroxyelemicin, metabolic activation, cytotoxicity
INTRODUCTION
Elemicin (3,4,5-trimethoxyallylbenzene) is a natural alkenylbenzene found in vegetables, flavoring foods, functional foods, and dietary supplements, including banana puree,1 nutmeg (Myristica fragrans),2 and Syzygium aromaticum, Daucus carota.3 Elemicin is also an active natural product found in many medicinal plants, including Asarum sieboldii, Petroselinum sativum, Canarium commune,4 Cymbopogon khasianus,5 Anemopsis californica,6 Peucedanum pastinacifolium,7 Ferula heuffelii,7 Petroselinum crispum, and Sassafras albidum.8 Moreover, elemicin shows extensive pharmacological effects, including antimicrobial,3,9 antioxidant,10 anti-acetylcholinesterase,11,12 and antiviral activity.7 Recently, elemicin has attracted attention due to its potential for eliciting toxicity and hallucinatory side-effects.13 However, the mechanism by which elemicin causes toxicity is not clear.
The use of nutmeg (soft drugs) is increasing, and its main potentially toxic components include elemicin, myristicin, and safrole.14 A previous study revealed that the major metabolic reactions of elemicin are the cinnamoyl pathway and the epoxidediol pathway, leading to 3-(3,4,5-trimethoxyphenyl)-propionic acid, and its glycine conjugate, found in urine.15 Earlier studies reported that elemicin could react with DNA, and exhibited activity in genotoxicity assays in adult rat hepatocytes16 and mice.17 Investigation of elemicin metabolism and toxicity would be of value to elucidate the potential health risks related to the intake of elemicin from dietary sources.
Drugs or xenobiotics can be transformed into chemically reactive metabolites by a process known as metabolic activation, which is frequently related to drug toxicity.18 It is well-known that some herbal components can be converted to toxic, or even mutagenetic and carcinogenic metabolites by CYPs. Bioactivation of multiple alkenylbenzenes, including estragole, methyleugenol, safrole, apiole, and myristicin, can yield reactive metabolites, such as 1′-hydroxyestragole, 1′-hydroxymethyleugenol,19 1′-hydroxysafrole,20 and 1′-hydroxymyristicin,21 respectively, through 1′-hydroxylation at the allyl side chains. These reactive metabolites are likely the initial events in cascades leading to toxicities, because they can bind to nucleophilic endogenous metabolites, including glutathione,22 taurine, cysteine,23 DNA, RNA, and protein. It was reported that species differences may occur in the metabolic activation of elemicin using PBK modeling.8 Herein, it was proposed that metabolic activation of 1′-hydroxylation might play an important role in elemicin-triggered cellular toxicity.
Mass spectrometry-based metabolomics have been applied to study the mechanisms of drug and other xenobiotic toxicities that are associated with their metabolism.18,24-27 In the present study, ultraperformance liquid chromatography combined with quadrupole time-of-flight mass spectrometry (UPLC-QTOFMS) was applied to analyze the biological samples from elemicin and 1′-hydroxyelemicin treatment. A comparative metabolomics approach was employed to screen the reactive metabolites by comparing metabolic maps of elemicin and 1′-hydroxyelemicin. Metabolic activation phenomenon was initially observed in vivo. Subsequently, the formation mechanism of metabolic activation was verified by trapping experiments in vitro. The cytotoxicity of both elemicin and 1′-hydroxyelemicin was evaluated, revealing the role of elemicin’s metabolic activation in its cellular toxicity. The role of NAC involved in both elemicin- and 1′-hydroxyelemicin-induced cytotoxicity was investigated.
MATERIALS AND METHODS
Reagents.
Elemicin (PubChem CID: 10248) was provided by MAYA chemical reagent company (Jiaxing, China). Reduced nicotinamide adenine dinucleotide phosphate (NADPH), chlorpropamide, and formic acid were obtained from Sigma-Aldrich (St. Louis, MO, USA). Methoxsalen, ticlopidine, ketonazole, Cys, and NAC were purchased from Meilun chemical reagent company (Dalian, China). α-Naphthoflavone, trimethoprim, uinidine, and diethyl maleate were obtained from Shanghai Macklin reagent company (Shanghai, China). Sulfaphenazol was from MCE (Med Chem Express LLC, USA). Both mouse liver microsomes (MLMs) and human liver microsomes (HLMs) were purchased from Bioreclamationivt Inc. (Hicksville, NY). Recombinant human P450s isoforms were provided by Xenotech, LLC (Kansas City, KS). Microanticoagulant tubes (EDTA dipotassium salt as anticoagulant) were obtained from Jiangsu Xinkang Medical Instrument company (Taizhou, China). All used reagents and organic solvents (acetonitrile, ACN) were of either analytical or HPLC grade.
Chemical Syntheses and Structural Characterization of 1′-Hydroxyelemicin.
1′-Hydroxyelemicin (PubChem CID: 3031087) was synthesized by nucleophilic addition of 3,4,5-trimethoxybenzaldenyde. To a solution of 3,4,5-trimethoxybenzaldenyde (110 mg, 0.56 mM) in dry tetrahydrofuran (2 mL) under N2 was added vinylmagnesium bromide (0.56 mL, 1 mol/L, 0.56 mM) dropwise at 0 °C. After stirring for 1 h at 20 °C, the mixture was quenched with saturated aqueous NH4Cl and further extracted with ethyl acetate three times. The combined organic layer was washed sequentially with saturated aqueous sodium carbonate solution, water, and brine, and dried over Na2SO4. The crude product was filtered and concentrated, and then was purified by silica gel column chromatography using EtOAc/petroleum ether (1:10) yielding an alcohol product (103 mg) as a colorless oil. The yield of 1′-hydroxyelemicin was 82% from 3,4,5-trimethoxybenzaldenyde. The purity of 1′-hydroxyelemicin was >98% determined by UPLC equipped with a diode array detector. Nuclear magnetic resonance (NMR) spectra were recorded on 600 MHz for 1H NMR spectrum and 150 MHz for 13C NMR spectrum. Deuterochloroform (CDCl3) was used as solvent for NMR detection. The structural identification of 1′-hydroxyelemicin was characterized by 1H and 13C NMR (Figure S1). 1H NMR (CDCl3 600 MHz): δ 3.86 (3H, s, OCH3), 3.82 (6H, s, 2OCH3), 6.60 (2H, s, 2H/4H), 5.12 (1H, d, H1′), 6.03 (1H, d, H2′), 5.36/5.20 (2H, d, H3′) (Figure S1A). 13C NMR (CDCl3, 150 MHz): δ 138.33(C-1), 103.13 (C-2/C-6), 153.32 (C-3/C-5), 137.2 (C-4), 75.39 (C-1′), 140.01 (C-2′), 115.24 (C-3′), 56.07 (3/5-OCH3), 60.81 (4-OCH3) (Figure S1B). HR-ESI-MS: [M + H]+ at m/z 225.1116 (calculated for C12H17O4 at 225.1121).
Animals and Treatment.
Male, 6–7-week-old C57BL/6J mice (20–22 g) were purchased from the Kunming Institute of Zoology, Chinese Academy of Sciences (Kunming, China). Mice received free diet daily and were kept in a temperature-controlled (22–24 °C) facility with a 12 h dark/light cycle and 50–60% humidity for at least 7 days after receipt and before treatment. All animal studies were in accordance with study procedures approved by the Ethics Review Committee for Animal Experimentation of the Kunming Institute of Botany, Chinese Academy of Sciences. Fifteen mice were randomly divided into three groups (n = 5). The mice were kept in standard cages with Aspen bedding. The control group was treated orally by gavage with 0.5% sodium carboxymethyl cellulose (CMC-Na) suspension, and the other two groups were orally administered elemicin (100 mg/kg, suspended in 0.5% CMC-Na) and 1′-hydroxyelemicin (100 mg/kg, suspended in 0.5% CMC-Na), respectively. The dosage of elemicin was selected according to a previous study, and further optimized.
Collection and Preparation of Mice Samples.
All tested mice were kept individually in metabolic cages for 24 h after administration. Whole blood was collected from the suborbital venous plexus of mice at 1 and 24 h after administration, and centrifuged at 2000 × g for 5 min at 4 °C to acquire plasma. Urine and feces samples were collected from 0 to 24 h post-procedure in the metabolic cages. The preparation method of plasma, urine, and feces samples used was as described in a previous report with minor modifications.29 Finally, 150 μL of urine, plasma, and feces extract supernatants were transferred into automatic sampling bottle, and 5 μL aliquots of supernatants were injected into the UPLC-MS/MS for analyses.
In Vitro Metabolism of Elemicin and 1′-Hydroxyelemicin.
Co-incubation experiments of elemicin (dissolved in ACN, final concentration was 25 μM) or 1′-hydroxyelemicin (dissolved in ACN, final concentration was 25 μM) individually with pooled MLMs and HLMs in vitro were carried out in potassium phosphate buffer (1× PBS, pH = 7.4). The incubation mixtures were prepared in a final volume of 200 μL, containing 0.5 mg/mL MLMs or HLMs protein or CYPs (2 pmol/mL). The incubation of microsomes with elemicin or 1′-hydroxyelemicin was carried out consistently with a previous report.29 The biotransformations of elemicin by recombinant human P450s were also performed according to a previous report.29 A 5 μL aliquot of the supernatant was injected into UPLC-QTOF-MS for analysis.
Evaluation of Bioactivation of Elemicin.
A trapping experiment was conducted to determine the potential for 25 μM elemicin to form electrophilic metabolites in the presence of nucleophiles, including Cys or NAC (final concentration of 1 mM, respectively, dissolved in PBS). The samples were prepared as detailed above. To further ascertain the chemically reactive activity of 1′-hydroxyelemicin, 25 μM of 1′-hydroxyelemicin was incubated with Cys or NAC in the absence of MLMs or HLMs. The structures of activated metabolite conjugates were characterized by MS/MS.
To evaluate the contribution of CYPs responsible for bioactivation of elemicin, microsomal mixtures containing 0.5 mg protein/mL pooled HLMs, 10 mM NADPH, and 1 mM Cys or NAC were incubated with specific CYP inhibitors individually. Next, inhibition assays were performed with a panel of chemical inhibitors of CYP1A2, CYP2B6, CYP2C9, CYP2C19, CYP2D6, CYP2E1, and CYP3A4 separately to determine the effect of CYPs on the formation of Cys or NAC conjugates. Preincubation of CYP chemical inhibitors individually with pooled human liver microsomes (0.5 mg protein/ mL) for 1 min was carried out. The CYP chemical inhibitors were as follows: α-naphthoflavone (1.0 μM for CYP1A1/2), sulfaphenazole (100 μM for CYP2C9), trimethoprim (2.5 μM for CYP2C8), ticlopidine (100 μM for CYP2B6 and CYP2C19), quinidine (5.0 μM for CYP2D6), methoxsalen (20 μM for CYP2A13 and CYP2A6), and ketoconazole (100 μM for CYP3A4). Working solutions of each inhibitor were prepared in dimethyl sulfoxide (DMSO). Control incubations were carried out with vehicle (DMSO, the final concentration below 1%) in the absence of inhibitors. The reaction mixtures were submitted to UPLC-MS/MS to determine the formation of elemicin-derived Cys/NAC conjugates.
UPLC-MS/MS Analysis.
All samples were analyzed on an Agilent 1290 infinity UPLC system (Agilent Technologies, Santa Clara, CA) equipped with an Agilent 6530 QTOF mass spectrometric detector. The chromatographic and mass spectrometric conditions were in accordance with a previous report.29 The MS spectral data were processed by the Agilent Mass Hunter Workstation data acquisition software (Agilent, Santa Clara, CA). The structural characterization of elemicin/1′-hydroxyelemicin metabolites was estimated based on their accurate masses and MS/MS fragmentation patterns by comparing with parent compounds.
Multivariate Data Analysis (MDA).
The raw MS spectrum data were acquired and analyzed with the Agilent Mass Hunter Workstation data acquisition software. The raw data preprocessing by Mass Hunter was in strict conformity with a previous report.29 Subsequently, the acquired data matrix was submitted to SIMCA-P + 13.0 software (Umetrics, Kinnelon, NJ) for unsupervised principal component analysis (PCA). The option of “Autofit” was selected. Elemicin, 1′-hydroxyelemicin, and their metabolites in microsomal incubations and mice were distinguished by screening the differential ions, which contributed to the separation from the control group in the S-plot acquired from PCA. Other necessary criteria for the metabolites could be observed only in the treatment group.
Evaluation of Elemicin and 1′-Hydroxyelemicin Cytotoxicity.
HepG2 cells, a human hepatocellular carcinoma cell line, were purchased from Culture Collection of the Chinese Academy of Sciences (Shanghai, China). Tested cells were maintained in Dulbecco’s modified Eagle medium (DMEM) supplemented with 10% fetal bovine serum and 1% penicillin–streptomycin solution, and placed in a humidified atmosphere of 5% CO2 at 37 °C. 1 × 10⁴ cells/ well (in 200 μL of DMEM medium) was planted to a 96-well plate. Confluent monolayer cells were allowed to attach for 24 h and exposed to different concentrations of elemicin or 1′-hydroxyelemicin. MTT assay was used to measure cell viability after treatment with elemicin or 1′-hydroxyelemicin.
NAC (Cys supplement) or DEM (thiol depletion) was added to the incubation mixtures to determine the role of Cys and NAC in elemicin toxicity. Cells were pre-exposed to DEM for 1 h or coexposed to NAC with elemicin or 1′-hydroxyelemicin, followed by incubation for 24 h. Cell viability was tested according to the MTT assay protocol described above. After a series of pre-experiments tests, the final concentrations of both elemicin and 1′-hydroxyelemicin were tested at IC50 concentration, and 500 and 400 μM were used as the final concentration of NAC and DEM, respectively. All stock solutions of test compounds (elemicin, 1′-hydroxyelemicin, and NAC and DEM) were prepared in DMSO (<0.25%).
Statistical Analysis.
Experimental data are presented as mean ± SEM. Statistical analysis was performed by unpaired Student’s t-tests for two groups in Graph Pad Prism software 6.0. Differences were considered to be significant when P-value was lower 0.05.
RESULTS AND DISCUSSION
Elemicin is not only the flavor component of multiple aromatic plants consumed in the diet, but also an active ingredient of various medicinal plants. However, in 2008, the Joint FAO/ WHO Expert Committee on Food Additives (JECFA) in the United States warned that for alkenylbenzenes (including elemicin), “further research is needed to assess the potential risk to human health from low-level dietary exposure to alkoxysubstituted allylbenzenes present in foods and essential oils, and used as flavoring agents”. Most alkenylbenzenes including safrole and methyleugenol can usually form DNA adducts and exhibit obvious carcinogenicity after metabolic activation, when they are used in large dosage or exposure is long-term.16 In the present study, the metabolic activation of elemicin generated 1′-hydroxyelemicin was determined in mice. Subsequently, the formation mechanism of metabolic activation was verified by electrophile trapping experiments in liver microsomes. Finally, the cytotoxicity of elemicin and 1′-hydroxyelemicin was evaluated.
Comparative Metabolism of Elemicin and 1′-Hydroxyelemicin in Mice by Metabolomics.
Since multivariate data analysis in metabolomics can simultaneously perform metabolite screening and metabolic pathway analysis, a LC-MS-based metabolomic approach has become a powerful tool to determine drug or xenobiotic metabolism.28,29 Therefore, LC-MS-based metabolomics may gain extensive applications in structural characterization of drug metabolites and provide clues about the mechanisms of bioactivation. Comparative metabolomics was demonstrated as an efficient tool to observe the similarities and differences of metabolic behavior of two drugs.18,25 Herein, UPLC-QTOFMS-based metabolomics were used to screen the metabolites of both elemicin and 1′-hydroxyelemicin in vitro and in vivo. An unbiased principal component analysis (PCA) model was initially used to screen metabolites excreted in urine of elemicin-, 1′-hydroxyelemicin-, and the vehicle-treated groups (Figure 1A) and the distribution of ions is shown by S-plot (Figure 1B). Trend plots of mutual metabolites of both elemicin and 1′-hydroxyelemicin are presented in Figure 1C and D. Trend plots of unique metabolites in elemicin and 1′-hydroxyelemicin metabolism are shown in Figure 1E and F, respectively. Of the total of 33 metabolites identified for elemicin and 1′-hydroxyelemicin metabolism in ESI+ mode, one sulfonated metabolite M22 was detected in the ESI− mode. Among these metabolites, 18 were observed in the present study (Table 1 and Table S1). The relative percentage of all elemicin and 1′-hydroxyelemicin metabolites in ESI+ mode excreted in urine are displayed in Supporting Information Figure S2A,B.
Figure 1.

Comparative metabolomic analysis for screening elemicin and 1′-hydroxyelemicin metabolites in urine. (A) PCA model for control (■), elemicin (E, ●) and 1′-hydroxyelemicin (E′, ▲) treated mice group (n = 5). (B) Loading scatter plot for screening potential metabolites in urine. (C) Trend plot of M15/H8. (D). Trend plot of M16/H9. (E) Trend plot of M14. (F) Trend plot of H10.
Table 1.
Summary of Elemicin Metabolites Produced in Vivo and in Vitro Metabolism
| Metabolite (ID) |
Rt (min) |
Observed [M + H]+/[M – H]− |
Molecular formula |
Mass error (ppm) |
ClogP | Major fragment ions | Reaction | Source |
|---|---|---|---|---|---|---|---|---|
| M0 | 9.60 | 209.1152+ | C12H16O3 | –9.64 | 2.51 | 194,168,153 | - | |
| M1 | 8.32 | 195.1032+ | C11H14O3 | 8.38 | 1.53 | 180,154,78,77 | 1 | U, M, H |
| M2 | 8.44 | 195.1015+ | C11H14O3 | –0.34 | 2.18 | 180,154,78,77 | 1 | U |
| M3 | 6.69 | 225.1126+ | C12H16O4 | 2.11 | 0.95 | 210,193,181,161 | 2 | U, P, M, H |
| M4 | 8.72 | 225.1119+ | C12H16O4 | –1.00 | 0.90 | 210,191,161 | 2 | U, M, H |
| M5a | 6.54 | 227.1283+ | C12H18O4 | 2.31 | 1.02 | 207,182 | 3 | M, H |
| M6a | 7.69 | 223.0973+ | C12H14O4 | 3.69 | 1.35 | 205,195,190,181,169 | 4 + 6 | M, H |
| M7a | 7.36 | 211.0963+ | C11H14O4 | –0.83 | 0.74 | 195, 169, 154,139 | 1 + 6 | U |
| M8a | 6.97 | 239.0898+ | C12H14O5 | –6.68 | 0.69 | 221,209,181,149 | 2 + 4 + 6 | U, P, M, H |
| M9 | 6.13 | 227.0910+ | C11H14O5 | –1.74 | 0.77 | 195,193 | 1 + 7 | U |
| M10 | 5.39 | 243.1228+ | C12H18O5 | 0.43 | –0.19 | 225,207,181 | 8 | U, P, M, H |
| M11a | 5.52 | 257.1024+ | C12H16O6 | 1.73 | –0.86 | 239, 211, 193 | 6 + 8 | U, F, P |
| M12 | 6.57 | 241.1070+ | C12H16O5 | –0.19 | 1.20 | 195,193 | 5/7 | U, F, P, M, H |
| M13 | 6.74 | 239.0916+ | C12H14O5 | 0.85 | 1.54 | 193,181,149 | 4 + 7 | U |
| M14a | 5.62 | 298.1276+ | C14H19NO6 | –3.04 | 0.48 | 225 | M12+Gly | U, F, P |
| M15a | 5.26 | 344.1149+ | C15H21NSO6 | –3.85 | - | 225,209,195,181 | M3+S-Cys | U |
| M16a | 6.60 | 386.1260+ | C17H23NSO7 | –2.06 | - | 225,207,176 | M3+NAC | U |
| M17a | 4.11 | 362.1244+ | C15H23NSO7 | –6.62 | - | 225,207 | M10+S-Cys | U |
| M18a | 4.98 | 404.1359+ | C17H25NSO8 | –3.60 | - | 319,238,225 | M10+NAC | U |
| M19a | 4.94 | 348.1108+ | C14H21NSO7 | –0.99 | –1.23 | 240,225,196 | M12+Tau | U |
| M20a | 5.22 | 369.1670+ | C17H24N2O7 | 3.75 | –1.00 | 352,223,195,181 | M12+Gln | U |
| M21a | 6.03 | 371.1338+ | C17H22O9 | 0.39 | –0.73 | 195,168,131 | M1+Gluc | U, P |
| M22 | 6.05 | 303.0544− | C12H16O7S | 1.98 | 0.32 | 239,223 | M1+SO3 | U |
Represent undescripted metabolites found in the study. 1demethylation; 2hydroxylation; 3hydration; 4allyl rearrangement; 5reduction; 6hydroformylation; 7carboxylation; 8 dihydration; Glyglycine; S-Cys Sulfur atom linker cysteine; NACN-acetylcysteine; Tau taurine; Gln glutamine; Gluc glucuronide; Uurine; Ffeces; Pplasma; M mouse liver microsome; Hhuman liver microsome.
A total of 22 metabolites were identified for elemicin in mouse urine (Figure S2A), feces, plasma, and the microsomal incubation system (Figure S3). The metabolic map of elemicin is summarized in Figure 5. Elemicin and most of its metabolites were mainly excreted in urine. These results indicated that allyl and methoxyl moieties were the major metabolites of elemicin. In addition, the phase I metabolic reactions of elemicin included demethylation, hydroxylation, hydration, allyl rearrangement, reduction, hydroformylation, and carboxylation. The phase II metabolism of elemicin included its conjugation with Cys, NAC, glucuronic acid, glycine, taurine, glutamine, and SO3. Compared with elemicin metabolism, a total 10 of 1′-hydroxyelemicin metabolites were determined in vivo and in vitro (Figure S2B and Figure 4). The metabolic map of 1′-hydroxyelemicin is shown in Figure S7. Similar to the excretion pathway of elemicin, 1′-hydroxyelemicin and most its metabolites were majorly excreted in urine. The phase I metabolic reactions of 1′-hydroxyelemicin contained hydroxylation, demethylation, dehydrogenation, and dehydration, while its phase II metabolic reaction majorly included the conjugation with Cys, NAC, glycine, and glutamine. No glucuronic acid and taurine conjugates with 1′-hydroxyelemicin were detected in mice.
Figure 5.

Metabolic map of elemicin.
Figure 4.

Evaluation of cytotoxicity of elemicin and 1′-hydroxyelemicin in HepG2 cells. (A) Effects of elemicin from 31.5 to 1000 μM on the viability of HepG2 cells. (B) Effects of 1′-hydroxyelemicin from 31.5 to 1000 μM on the viability of HepG2 cells. (C) Effect of NAC on elemicin or 1′-hydroxyelemicin cytotoxicity HepG2 cells. (D) Effect of DEM on elemicin (E) or 1′-hydroxyelemicin (E′) cytotoxicity HepG2 cells. ***P < 0.001 compared with vehicle control, ##P < 0.01, ###P < 0.05 compared with elemicin or 1′-hydroxyelemicin group.
Structural Characterization of Cys and NAC Adducts of Elemicin.
Among the identified metabolites of elemicin, two Cys or NAC conjugates (M15 and M16) were detected in urine following elemicin exposure (Figure 1C,D and Figure 2B). Similarly, 1′-hydroxyelemicin plus Cys or NAC adducts (H8 or H9) were found in urine after 1′-hydroxyelemicin administration (Figure 1C,D and Figure 2C). Through comparing the chromatographic behavior, accurate mass and tandem MS fragmentography, H8 found in the 1′-hydroxyelemicin urine sample was the same as M15 from the elemicin urine sample, while H9 was the same as M16. This suggested that 1′-hydroxyelemicin was a reactive metabolite of elemicin in vivo through metabolic activation, which may subsequently form Cys and NAC adducts. The common Cys and NAC conjugates (M15/H8 and M16/H9) showed the characteristic neutral losses of 119 Da (Cys moiety) and 161 Da (NAC moiety) derived from the Cys and NAC groups in the MS/MS spectrum, respectively. Additionally, the characteristic product ion at m/z 225+ could be assigned as the 1′-hydroxyelemicin moiety (Figure 2D and E).
Figure 2.

Identification of Cys and NAC conjugates with elemicin and 1′-hydroxyelemicin in vivo. Extracted ions (m/z 344.11447+ and 386.1268+) in chromatogram obtained from (A) mouse urine samples of elemicin (M15 and M16), and (B) mouse urine samples of 1′-hydroxyelemicin (H8 and H9). (C) MS/MS spectra and fragmentation patterns of M15/H8. (D) MS/MS spectra and fragmentation patterns of M16/H9. Urine samples for the MS/MS mode were prepared using the SPE approach.
In order to further demonstrate the formation of Cys and NAC adducts from elemicin in vivo metabolism, Cys and NAC trapping experiments for reactive metabolites were separately performed with elemicin in HLMs, respectively. Elemicin was converted to reactive 1′-hydroxyelemicin, which was further transformed to two Cys or NAC conjugates (M15 and M16) in the NADPH-regenerating system (Figure 3B), whereas the conjugates could not be detected in the HLMs incubation without NADPH (Figure 3A). Moreover, 1′-hydroxyelemicin could spontaneously covalently bind Cys or NAC, leading to the formation of Cys or NAC conjugates (H8 or H9) without any catalysis (Figure 3C). These data indicated that the production of Cys or NAC conjugates was in NADPHdependent manner, and 1′-hydroxyelemicin was a reactive metabolite of elemicin, which can spontaneously react with Cys or NAC.
Figure 3.
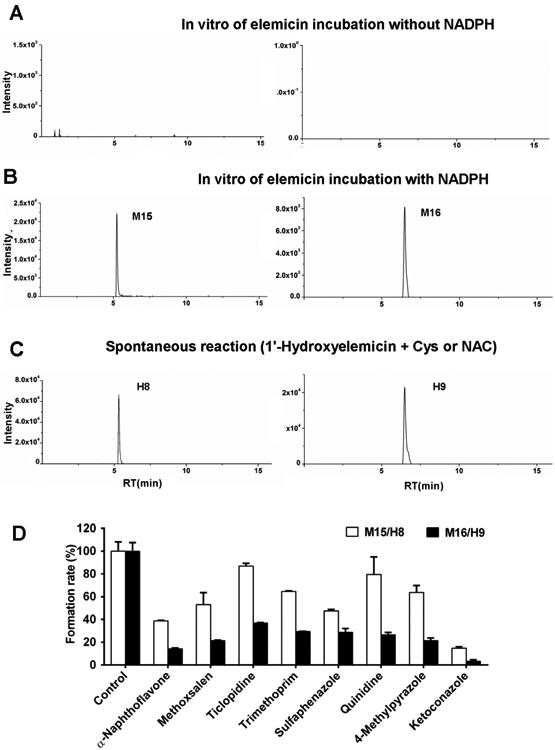
Formation of Cys and NAC conjugates of elemicin in HLMs. Chromatograms of ion m/z 344.1144+ and 386.1268+ extracted from HLM incubations (A) in the absence of NADPH or (B) in the presence of NADPH (M15 and M16). (C) 1′-Hydroxyelemicin captured with Cys or NAC without liver microsomes and NAPDH (H8 and H9). (D) Inhibitory effects of CYPs inhibitors on the formation of M15/H8 and M16/H9 in HLMs incubations.
Metabolic activation resulting in the formation of chemically reactive metabolites is a potential risk factor for drug toxicity. Identification of electrophilic intermediates in the in vitro and in vivo metabolism of xenobiotics through appropriate trapping experiments has become important for appraising their potential toxicity. Currently, UPLC-MS/MS plays a beneficial role in the detection, identification, and quantification of reactive metabolites of xenobiotics.29-31 Chemically reactive metabolites can be detected by performing in vitro nucleophilic reagent trapping studies, such as GSH, Cys, and NAC; a previous report indicated that reactive 1′-hydroxymyristicin can capture Cys.32
Roles of NAC and Cys in Elemicin-Induced Toxicity.
Metabolic activation of alkenylbenzenes in herbal medicines is an important factor associated with increasing toxicity.33,34 On the basis of the above studies, 1′-hydroxyelemicin was characterized as a reactive metabolite of elemicin. The cytotoxicity of elemicin or 1′-hydroxyelemicin (62.5, 125, 250, 500, and 1000 μM) was compared in HepG2 cells. Moreover, the IC50 value of elemicin was 910 ± 26.8 μM, and that of C-hydroxyelemicin was 638 ± 26.7 μM (Figure 4A and B), suggesting that HepG2 cells were more sensitive to 1′-hydroxyelemicin than elemicin. This provided evidence that metabolic activation may mediate the cytotoxicity induced by elemicin.
It is known that Cys and NAC are the synthetic precursors of glutathione (GSH) in organisms, and act as the important endogenous antioxidants and protect against cell damage.35 The toxicities of many drugs were usually accompanied by the existence of Cys and NAC conjugates.36-38 To order to investigate the role of Cys and NAC in elemicin-induced toxicity, NAC and Cys were tested in HepG2 cells treated with elemicin. NAC could significantly attenuate the cytotoxicity induced by both elemicin and 1′-hydroxyelemicin (Figure 4C), while depletion of Cys by DEM increased both elemicin and 1′-hydroxyelemicin triggered cytotoxicity (Figure 4D). DEM can decrease cellular levels of glutathione and Cys, resulting in significant cytotoxicity through thiol-exhaustion and oxidative stress.39 These data demonstrated that the formation of Cys and NAC adduct may lead to consumption of Cys and NAC, further resulting in toxicity.
CYPs Involved in the Bioactivation and Metabolism of Elemicin.
Drug metabolizing enzymes catalyzing the formation of reactive metabolites include some CYPs and Phase II conjugating enzymes.40 CYP-mediated metabolic activation was an initial event in the formation and development of idiosyncratic adverse drug reactions, such as genotoxicity, hepatotoxicity, and immune-mediated adverse drug reactions.41 To examine the role of CYPs on metabolic activation of elemicin and formation of Cys/NAC adducts, elemicin was incubated with 13 human recombinant CYPs. Several human recombinant CYPs contributed to the formation of 1′-hydroxyelemicin, notably CYP1A1 and CYP1A2 that showed more potent catalytic capacity than the other CYPs (Figure S8B). Additionally, a series of selective CYP inhibitors were incubated with elemicin in HLMs, to determine which CYPs preferentially catalyzed 1′-hydroxylation of elemicin in the more complex and physiologically relevant liver extracts. Formation of the Cys/NAC adducts was decreased significantly by α-naphthoflavone, methoxsalen, trimethoprim, sulfaphenazole, 4-methylpyrazole, and ketoconazole, suggesting that various CYPs are involved in metabolic activation (Figure 3D). Among these inhibitors, the CYP3A inhibitor of ketoconazole and CYP1A inhibitor of α-naphthoflavone showed the strongest inhibition of the formation of these two conjugates compared to others, suggesting that CYP1A1, CYP1A2, and CYP3A4 were mainly responsible for metabolic activation of elemicin. Consistently, CYP1A1, CYP1A2, and CYP3A4 were the major CYPs responsible for bioactivation of elemicin to yield 1′-hydroxyelemicin (M3/H0), that was converted into the Cys and NAC conjugates.
Additionally, in order to further determine the CYPs responsible for systematic elemicin metabolism, a series of human recombinant CYPs was individually screened for the formation of elemicin metabolites. Among all CYPs tested, CYP1B1 predominantly catalyzed demethylation of elemicin to yield M1 (Figure S8A). CYP1A1 primarily catalyzed the 1′-hydroxylation to form M3 (Figure S8B). In addition, only CYP3A4 and CYP3A5 were involved in hydroxylation at the 3′-carbon to produce M4 (Figure S8C). CYP1A2 and CYP2B6 were the primary CYPs responsible for formation of M5 (Figure S8D), and CYP1A1 and CYP1A2 were involved in M6 formation (Figure S8E). CYP1A2 predominantly catalyzed the formation of M8 (Figure S8F).
In summary, this study elucidated the key role of metabolic activation in the elemicin induced toxicity. These results suggested that 1′-hydroxyelemicin resulting from the metabolic activation of elemicin leads to Cys or NAC adducts as demonstrated in vitro and in vivo. CYP1A1/2 and CYP3A4 were the primary human CYPs involved in the formation of electrophilic metabolites that give rise to the Cys and NAC adducts. Pretreatment with NAC could ameliorate the cellular cytotoxicity induced by both elemicin and 1′-hydroxyelemicin, while depletion of Cys by DEM would potentiate their cytotoxicity on HepG2 cells. Excessive intake of dietary foods and herbs containing elemicin may result in cellular toxicity.
Supplementary Material
Acknowledgments
Funding
This work was supported by the National Key Research and Development Program of China (2017YFC1700906, 2017YFC0906903), CAS “Light of West China” Program (Y72E8211W1), Kunming Institute of Botany (Y76E1211K1, Y4662211K1), State Key Laboratory of Phytochemistry and Plant Resources in West China (52Y67A9211Z1), and open funding of state key laboratory of Pharmaceutical Biotechnology, Nanjing University (KF-GN-201705).
ABBREVIATIONS
- CDCl3
deuterochloroform
- CMC-Na
carboxymethyl cellulose
- Cys
cysteine
- CYPs
cytochrome P450s
- DEM
diethyl maleate
- DMSO
dimethyl sulfoxide
- ESI+
electrospray ionization in the positive ion mode
- UPLC-QTOFMS
ultraperformance liquid chromatography, quadrupole time-of-flight mass spectrometry
- HLMs
human liver microsomes
- MLMs
mouse liver microsomes
- MS
mass spectrum
- NMR
nuclear magnetic resonance
- NAC
N-acetylcysteine
- NADPH
nicotinamide adenine dinucleotide phosphate
- PCA
principal component analysis
- SPE
solid phase extraction
- v
Volt
Footnotes
Supporting Information
The Supporting Information is available free of charge on the ACS Publications website at DOI: 10.1021/acs.jafc.9b02137.
Identification of elemicin and 1′-hydroxyelemicin metabolites in vitro and in vivo metabolism; structural characterization of synthetic 1′-hydroxyelemicin; relative abundance of elemicin and 1′-hydroxyelemicin metabolites in mice urine after elemicin and 1′-hydroxyelemicin exposure, of elemicin and its metabolites in vitro and in vivo, and of 1′-hydroxyelemicin and its metabolites in vitro and in vivo; MS/MS spectra and fragmentation patterns of elemicin and its representative metabolites and of some representative metabolites of 1′-hydroxyelemicin; metabolic mapping of 1′-hydroxyelemicin; summary of 1′-hydroxyelemicin metabolites produced in vivo and in vitro metabolism (PDF)
The authors declare no competing financial interest.
REFERENCES
- (1).Wang J; Li YZ; Chen RR; Bao JY; Yang GM Comparison of Volatiles of Banana Powder Dehydrated by Vacuum Belt Drying, Freeze-Drying and Air-Drying. Food Chem. 2007, 104 (4), 1516–1521. [Google Scholar]
- (2).Mobarak Z; Zaki N; Bieniek D; El-Darawy Z Some Chromatographic Aspects of Nutmeg Analysis. Chemosphere 1977, 6 (10), 633–639. [Google Scholar]
- (3).Rossi P-G; Bao L; Luciani A; Panighi J; Desjobert J-M; Costa J; Casanova J; Bolla J-M; Berti L (E)-Methylisoeugenol and Elemicin: Antibacterial Components of Daucus carota L. Essential Oil against Campylobacter jejuni. J. Agric. Food Chem 2007, 55 (18), 7332–7336. [DOI] [PubMed] [Google Scholar]
- (4).De Vincenzi M; De Vincenzi A; Silano M Constituents of Aromatic Plants: Elemicin. Fitoterapia 2004, 75 (6), 615–618. [DOI] [PubMed] [Google Scholar]
- (5).Lal M; Dutta S; Munda S; Pandey SK Novel High Value Elemicin-Rich Germplasm of Lemon Grass (Cymbopogon khasianus (Hack)Stapf(ex Bor) from North East India. Ind. Crops Prod 2018, 115, 98–103. [Google Scholar]
- (6).Medinaholguín AL; Holguín FO; Micheletto S; Goehle S; Simon JA; O’Connell MA Chemotypic Variation of Essential Oils in the Medicinal Plant, Anemopsis californica. Phytochemistry 2008, 69 (4), 919–927. [DOI] [PMC free article] [PubMed] [Google Scholar]
- (7).Sajjadi S; Shokoohinia Y; Hemmati S Antivirial Activity of Elemicin from Peucedanum pastinacifolium. Cytokine 2012, 43 (3), 278–278. [Google Scholar]
- (8).Van den Berg SJPL; Punt A; Soffers AEMF; Vervoort J; Ngeleja S; Spenkelink B; Rietjens IMCM Physiologically Based Kinetic Models for the Alkenylbenzene Elemicin in Rat and Human and Possible Implications for Risk Assessment. Chem. Res. Toxicol 2012, 25 (11), 2352–2367. [DOI] [PubMed] [Google Scholar]
- (9).Rossi P-G; Bao L; Luciani A; Panighi J; Desjobert J-M; Costa J; Casanova J; Bolla J-M; Berti L (E)-Methylisoeugenol and Elemicin: Antibacterial Components of Daucus carota L. Essential Oil against Campylobacter jejuni. J. Agric. Food Chem 2007, 55 (18), 7332–7336. [DOI] [PubMed] [Google Scholar]
- (10).Surveswaran S; Cai Y-Z; Corke H; Sun M Systematic Evaluation of Natural Phenolic Antioxidants from 133 Indian Medicinal Plants. Food Chem. 2007, 102 (3), 938–953. [Google Scholar]
- (11).Seo S-M; Jung C-S; Kang J; Lee H-R; Kim S-W; Hyun J; Park I-K Larvicidal and Acetylcholinesterase Inhibitory Activities of Apiaceae Plant Essential Oils and Their Constituents against Aedes albopictus and Formulation Development. J. Agric. Food Chem 2015, 63 (45), 9977–86. [DOI] [PubMed] [Google Scholar]
- (12).Xiang CP; Han JX; Li XC; Li YH; Zhang Y; Chen L; Qu Y; Hao CY; Li HZ; Yang CR; Zhao SJ; Xu M Chemical Composition and Acetylcholinesterase Inhibitory Activity of Essential Oils from Piper Species. J. Agric. Food Chem 2017, 65 (18), 3702–3710. [DOI] [PubMed] [Google Scholar]
- (13).Beyer J; Ehlers D; Maurer HH Abuse of Nutmeg (Myristica fragrans Houtt.): Studies on the Metabolism and the Toxicologic Detection of its Ingredients Elemicin, Myristicin, and Safrole in Rat and Human Urine Using Gas Chromatography/Mass Spectrometry. Ther. Drug Monit 2006, 28 (4), 568–575. [DOI] [PubMed] [Google Scholar]
- (14).Sangalli BC; Sangalli B; Chiang W Toxicology of Nutmeg Abuse. J. Toxicol., Clin. Toxicol 2000, 38 (6), 671–678. [DOI] [PubMed] [Google Scholar]
- (15).Solheim E; Scheline RR Metabolism of Alkenebenzene Derivatives in the Rat III Elemicin and Isoelemicin. Xenobiotica 1980, 10 (5), 371–380. [DOI] [PubMed] [Google Scholar]
- (16).Hasheminejad G; Caldwell J Genotoxicity of the Alkenylbenzenes α- and β-Asarone, Myristicin and Elemicin as Determined by the UDS Assay in Cultured Rat Hepatocytes. Food Chem. Toxicol 1994, 32 (3), 223–231. [DOI] [PubMed] [Google Scholar]
- (17).Randerath K; Haglund RE; Phillips DH; Reddy MV 32P-Post-Labelling Analysis of DNA Adducts Formed in the Livers of Animals Treated with Safrole, Estragole and Other Naturally-Occurring Alkenylbenzenes. II. Newborn Male B6C3F1Mice. Carcinogenesis 1984, 5 (12), 1613–1622. [DOI] [PubMed] [Google Scholar]
- (18).Li F; Patterson AD; Hofer CC; Krausz KW; Gonzalez FJ; Idle JR Comparative Metabolism of Cyclophosphamide and Ifosfamide in the Mouse Using UPLC-ESI-QTOFMS-Based Metabolomics. Biochem. Pharmacol 2010, 80 (7), 1063–1074. [DOI] [PMC free article] [PubMed] [Google Scholar]
- (19).Jeurissen SM; Punt A; Boersma MG; Bogaards JJ; Fiamegos YC; Schilter B; van Bladeren PJ; Cnubben NH; Rietjens IM Human cytochrome p450 enzyme specificity for the bioactivation of estragole and related alkenylbenzenes. Chem. Res. Toxicol 2007, 20 (5), 798–806. [DOI] [PubMed] [Google Scholar]
- (20).Jeurissen SM; Bogaards JJ; Awad HM; Boersma MG; Brand W; Fiamegos YC; van Beek TA; Alink GM; Sudholter EJ; Cnubben NH Human Cytochrome p450 Enzyme Specificity for Bioactivation of Safrole to the Proximate Carcinogen 1’-Hydroxysafrole. Chem. Res. Toxicol 2004, 17 (9), 1245–1250. [DOI] [PubMed] [Google Scholar]
- (21).Marabini L; Neglia L; Monguzzi E; Galli CL; Marinovich M Assessment of Toxicity of Myristicin and 1’-Hydroxymyristicin in HepG2 Cell Line. J. Pharmacol. Toxicol 2017, 12 (4), 170–179. [Google Scholar]
- (22).Yao H; Peng Y; Zheng J Identification of Glutathione and Related Cysteine Conjugates Derived from Reactive Metabolites of Methyleugenol in Rats. Chem.-Biol. Interact 2016, 253, 143–152. [DOI] [PubMed] [Google Scholar]
- (23).Feng Y; Wang H; Wang Q; Huang W; Peng Y; Zheng J Chemical interaction of protein cysteine residues with reactive metabolites of methyleugenol. Chem. Res. Toxicol 2017, 30 (2), 564–573. [DOI] [PubMed] [Google Scholar]
- (24).Zhao Q; Zhang T; Xiao XR; Huang JF; Wang Y; Gonzalez FJ; Li F Impaired Clearance of Sunitinib Leads to Metabolic Disorders and Hepatotoxicity. Br. J. Pharmacol 2019, 176 (13), 2162–2178. [DOI] [PMC free article] [PubMed] [Google Scholar]
- (25).Hu DD; Chen XL; Xiao XR; Wang YK; Liu F; Zhao Q; Li X; Yang XW; Li F Comparative Metabolism of Tripolide and Triptonide Using Metabolomics. Food Chem. Toxicol 2018, 115, 98–108. [DOI] [PubMed] [Google Scholar]
- (26).Zhao Q; Zhang JL; Li F Application of Metabolomics in the Study of Natural Products. Nat. Prod. Bioprospect 2018, 8 (4), 321–334. [DOI] [PMC free article] [PubMed] [Google Scholar]
- (27).Jaiswal Y; Liang Z; Ho A; Chen H; Williams L; Zhao Z Tissue-Based Metabolite Profiling and Qualitative Comparison of Two Species of Achyranthes Roots by Use of UHPLC-QTOF MS and Laser Micro-Dissection. J. Pharm. Anal 2018, 8 (1), 10–19. [DOI] [PMC free article] [PubMed] [Google Scholar]
- (28).Chen C; Gonzalez FJ; Idle JR LC-MS-Based Metabolomics in Drug Metabolism. Drug Metab. Rev 2007, 39 (2–3), 581–597. [DOI] [PMC free article] [PubMed] [Google Scholar]
- (29).Li F; Gonzalez FJ; Ma X LC-MS-Based Metabolomics in Profiling of Drug Metabolism and Bioactivation. Acta Pharm. Sin. B 2012, 2 (2), 116–123. [Google Scholar]
- (30).Wen B; Fitch WL Analytical Strategies for the Screening and Evaluation of Chemically Reactive Drug Metabolites. Expert Opin. Drug Metab. Toxicol. 2009, 5 (1), 39–55. [DOI] [PubMed] [Google Scholar]
- (31).Zhao S; Y A.; Sun L; Shi W; Ma J; Tu J; Zhou G Simultaneous Quantitation of Lovastatin and an Active Metabolite in Rat Plasma by UPLC-QTRAP-MS/MS and Its Application in the Pharmacokinetic. Chin J. Mod. Appl. Pharm 2018, 35 (2), 193–198. [Google Scholar]
- (32).Zhu X; Wang Y-K; Yang X-N; Xiao X-R; Zhang T; Yang X-W; Qin H-B; Li F Metabolic Activation of Myristicin and Its Role in Cellular Toxicity. J. Agric. Food Chem 2019, 67 (15), 4328–4336. [DOI] [PubMed] [Google Scholar]
- (33).Prinsloo G; Nogemane N; Street R The Use of Plants Containing Genotoxic Carcinogens as Foods and Medicine. Food Chem. Toxicol 2018, 116, 27–39. [DOI] [PubMed] [Google Scholar]
- (34).Rietjens IMCM; Huseiny WA; Boersma MG Flavonoids and Alkenylbenzenes: New Concepts in Bioactivation Studies. Chem.-Biol. Interact 2011, 192 (1), 87–95. [DOI] [PubMed] [Google Scholar]
- (35).McBean G Cysteine, Glutathione, and Thiol Redox Balance in Astrocytes. Antioxidants 2017, 6 (3), 62–62. [DOI] [PMC free article] [PubMed] [Google Scholar]
- (36).Fang ZZ; Tosh DK; Tanaka N; Wang H; Krausz KW; O’Connor R; Jacobson KA; Gonzalez FJ Metabolic Mapping of A3 Adenosine Receptor Agonist MRS5980. Biochem. Pharmacol 2015, 97 (2), 215–223. [DOI] [PMC free article] [PubMed] [Google Scholar]
- (37).Liu X; Lu YF; Guan X; Zhao M; Wang J; Li F Characterizing Novel Metabolic Pathways of Melatonin Receptor Agonist Agomelatine Using Metabolomic Approaches. Biochem. Pharmacol 2016, 109, 70–82. [DOI] [PubMed] [Google Scholar]
- (38).Wang YK; Yang XN; Liang WQ; Xiao Y; Zhao Q; Xiao XR; Gonzalez FJ; Li F A Metabolomic Perspective of Pazopanib-Induced Acute Hepatotoxicity in Mice. Xenobiotica 2019, 49, 655. [DOI] [PMC free article] [PubMed] [Google Scholar]
- (39).Gerard-Monnier D; Fougeat S; Chaudiere J Glutathione and Cysteine Depletion in Rats and Mice Following Acute Intoxication with Diethylmaleate. Biochem. Pharmacol 1992, 43 (3), 451–456. [DOI] [PubMed] [Google Scholar]
- (40).Grillo MP Detecting Reactive Drug Metabolites for Reducing the Potential for Drug Toxicity. Expert Opin. Drug Metab. Toxicol 2015, 11 (8), 1281–1302. [DOI] [PubMed] [Google Scholar]
- (41).Thompson RA; Isin EM; Ogese MO; Mettetal JT; Williams DP Reactive Metabolites: Current and Emerging Risk and Hazard Assessments. Chem. Res. Toxicol 2016, 29 (4), 505–533. [DOI] [PubMed] [Google Scholar]
Associated Data
This section collects any data citations, data availability statements, or supplementary materials included in this article.