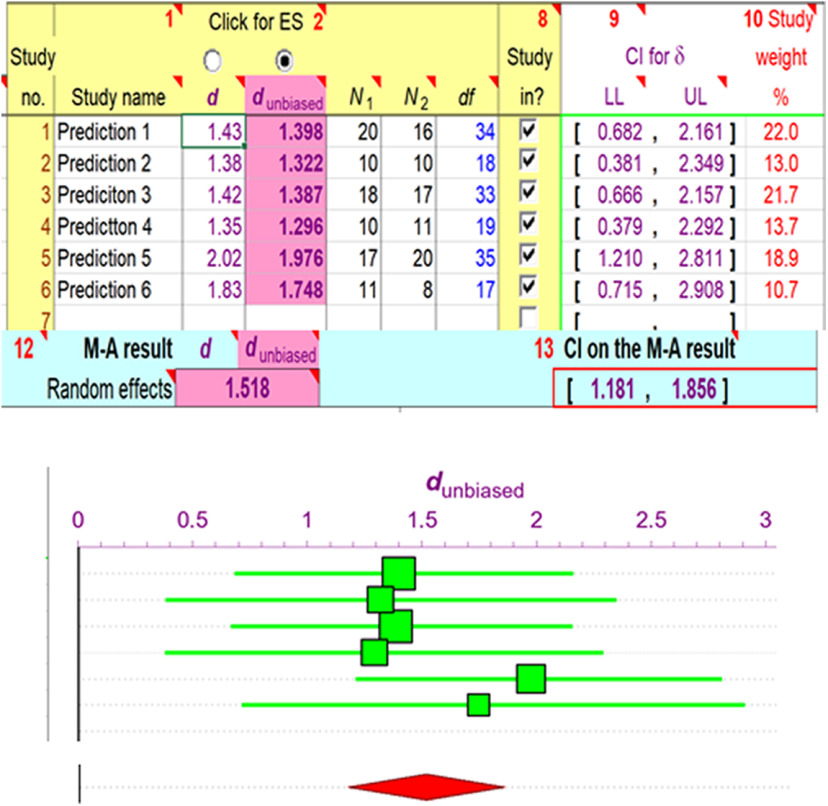
Figure 3.
Meta-analysis of the effect sizes observed in the primary tests of the main hypothesis of Cen et al. (2018; n = 6; shown in Fig. 1). I obtained effect sizes by measuring the published figures and calculated Cohen’s d values with an on-line calculator: https://www.socscistatistics.com/effectsize/default3.aspx. Analysis and graphic display (screenshot) were done with ESCI (free at https://thenewstatistics.com/itns/esci/). Top panel shows individual effect sizes (corrected, dunbiased) for the tendency of small samples to overestimate true effect sizes (see Cummings and Calin-Jageman, 2017; pp 176–177), Ns and degrees of freedom (df) of samples compared, together with confidence intervals (CIs) of effect sizes and relative weights (generated by ESCI and based mainly on sample size) that were assigned to each sample. Upper panel also shows mean effect size for random effects model and CI for mean. Bottom panel shows individual means (squares) and CIs for dunbiased (square size is proportional to sample weight). The large diamond at the very bottom is centered (vertical peak of diamond) at the mean effect size, while horizontal diamond peaks indicate CI for the mean.

