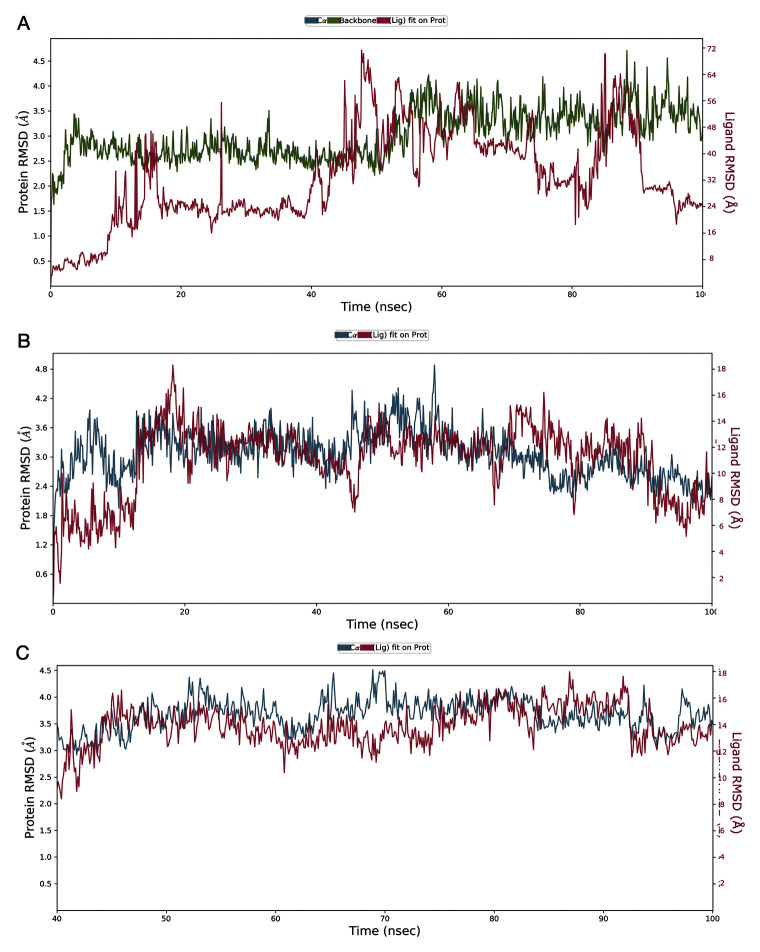
Figure 10. The root mean square deviation (RMSD) plot for protein ligand complexes generated after 100 ns molecular dynamics simulation in the NPT ensemble.
A) streptomycin/SARS-CoV-2-S complex; B) ciprofloxacin SARS-CoV-2-S complex; C) glycyrrhizic acid/SARS-CoV-2-S complex. This figure was generated using Desmond version 4.2 42. This analysis could also have been performed using open source software such as GROMACS 43.

