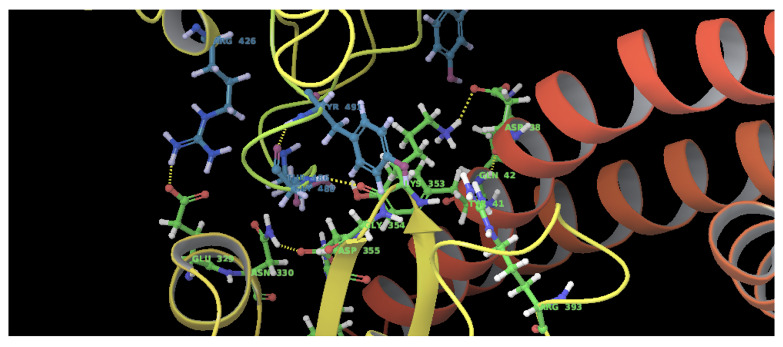
Figure 6. Amino acids involved in the SARS-CoV B-chain and ACE2 D-chain interaction.
The residues highlighted in blue correspond to the B-Chain of SARS-CoV and residues in green correspond to the ACE2 D-Chain. This figure was generated using Schrodinger’s Maestro visualizer. As an alternative, the open source visualizer Python Molecule Viewer (PMV) 48 could also be used.

