

Abstract
Peroxisome proliferator-activated receptor-α (PPARα) has been suggested to protect against chemically induced hepatobiliary injuries in rodents. This function could mask the potential toxicities of perfluorooctanoic acid (PFOA) that is an emerging environmental contaminant and a weak ligand of PPARα. However its function has not been clarified. In this study, PFOA was found to elicit hepatocyte and bile duct injuries in Pparα-null mice after 4 wk treatment with PFOA ammonium salt (0, 12.5, 25, 50 μmol/kg/d, gavage). In wild-type mice, PFOA caused major hepatocellular damage dose-dependently and minor cholangiopathy observed only at 25 and 50 μmol/kg. In treated Pparα-null mice, PFOA produced marked fat accumulation, severe cholangiopathy, hepatocellular damage and apoptotic cells especially in bile ducts. Oxidative stress was also increased 4-fold at 50 μmol/kg and TNF-α mRNA was upregulated more than 3fold at 25 μmol/kg in Pparα-null mice. Biliary bile acid/phospholipid ratios were higher in Pparα-null mice than in wild-type mice. Results from these studies suggest that PPARα is protective against PFOA and have a critical role in drug induced hepatobiliary injury.
Keywords: Peroxisome proliferator-activated receptor-α, Perfluorooctanoic acid, Hepatobiliary injury, Bile acid transporter, Histopathology
Introduction
Peroxisome proliferator-activated receptor-α (PPARα) is a ligand-activated receptor that mediates critical transcriptional regulation of genes associated with lipid homeostasis. PPARα is also suggested to have important roles in inflammation, immune response and hepatocarcinogenesis, however the mechanism has not been clarified. Perfluorooctanoic acid (PFOA) is a fluorinated eight-carbon member of the perfluoroalkyl acid family that is amphiphilic and is used in the preparation of surfactants and fabricants1). The potential health risk for PFOA arises from its ubiquitous distribution and persistence in the environment, and its presence in humans and wildlife2, 3). PFOA is assumed to be a weak PPARα ligand because of its low degree PPARα transcriptional activations among PPARα ligands4) and is carcinogenic to rodents5, 6).
The pathophysiological roles of PPARα in toxicity caused by PFOA is well delineated by Pparα-null mice7, 8). Rosen et al. (2008) demonstrated that ablation of PPARα changes profiles of transcripts related to fatty acid metabolisms, inflammation, xenobiotic metabolism and cell cycle regulation7). Qualitative changes in transcripts modified hepatortoxicity significantly in Pparα-null mice, leading a conclusion that PPARα is required for PFOA-induced cellular alterations in mouse hepatocytes.
Recently, Hays et al. demonstrated that a weak PPARα ligand, bezafibrate, induces cholestasis without neoplastic changes in Pparα-null mice, and have concluded that PPARα protects against potential cholestasis, while it facilitates tumor promotion9). They have also demonstrated that a very specific PPARα ligends, Wy-14,643, does not induce cholestastis9). Thus, the toxicity profile of a chemical that up- or down-regulates via PPARα-dependent and independent pathways may be modified depending on its affinity to PPARα and its dose.
A reasonable conjecture would be that PFOA, which is known as a PPARα weak ligand, might also induce cholestatic disease in Pparα-null mice. No study on PFOA has ever investigated so far biliary duct toxicity. This study examined whether PFOA has the potential for inducing cholestatic disease and PPARα has a role in protecting against chemical induced choestasis. We investigated whether PFOA induces cholestasis in Pparα-null mice and the dose-response relationship between PFOA and toxicological responses in Pparα-wild and null mice. It is well known that cholestasis is not a common response in mice, although it is a very common response to xenobiotics including therapeutic drugs in human10). Thus, the null genotype of PPARα might reveal bile duct toxicity of many PPARα inducers otherwise overlooked, although they may be recognized only at very high doses11).
Subjects and Methods
Animals and treatment
Wild-type mice (129S4/SvlmJ) and Pparα-null mice (129S4/SvJae-Pparαtm1Gonz/J) were originally provided from Dr. Frank J. Gonzalez (National Cancer Institute, Bethesda, MD) and housed in Kyoto University Institute of Laboratory Animals. All experiments were performed with male mice aged 8–10 wk (22–25 g). 39 wild-type mice and 40 Pparα-null mice were randomly assigned to four groups in accordance with the administered doses of PFOA (0, 12.5, 25, 50 μmol/kg/d). PFOA ammonium salt (>98% purity) was purchased from Fluka Chemical (Steinheim, Switzerland) and dissolved in deionized water. Mice were treated by oral gavage (8 ml/kg) daily for 4 wk and killed by euthanasia at the end of 4 wk, at which time, blood, liver and bile were collected.
Livers were weighed, and the tissue was fixed in 10% neutral-buffered formalin for light microscopic examination or 1% glutaraldehyde/1.44% paraformaldehyde solution for transmission electron microscopy for ultrastructural examination. The remaining portion was flashfrozen in liquid nitrogen and stored at −80°C.
Biochemical measurements
Biochemical analyses were performed on plasma samples. These analyses were examined by Nagahama Life Science Laboratory, Oriental Yeast Co. Ltd. (Shiga, Japan), and included aspartate aminotransferase (AST) and alanine aminotransferase (ALT) as hepatocellular damage markers, total bilirubin (T-Bil) and total bile acid (TBA) as cholestatic markers, and total cholesterol (T-Cho) and triglyceride (TG) as fat metabolism markers.
Histology
For light microscopy, livers were processed by routine paraffin sectioning and staining with hematoxylin and eosin (HE). For the determination of apoptosis, a terminal deoxynucleotidyltransferase-mediated dUTP-biotin nick end labeling, TUNEL, test was performed. An Apop Tag kit (Oncor, Gaithersburg, MD) was used according to the manufacturer’s recommendations.
For ultrastructural studies, livers were post-fixed in 1% osmium tetroxide in 0.2 M phosphate buffer, routinely dehydrated through a graded ethanol series, and embedded in Epon using the Luft method12). Sections were cut in 80 μm on a Leica EM UC6 ultramicritome (Hitachi, Tokyo, Japan) with a diamond knife, and stained by the Reynolds method13). The grids were examined under a Hitachi 7650 transmission electron microscope (Hitachi).
Analysis of PFOA
Determination of PFOA in whole blood, bile and liver was performed using a modification of a method originally developed by Yline et al14). Diluted blood, bile or homogenized liver was combined with 10 μl of a 1 μg/ml solution of 13C2-PFOA as an internal standard. One milliliter of tetrabutylammonium hydrogen sulfate and 2 ml 0.5 M sodium carbonate buffer solution (pH adjusted to 10) were combined and vortexed, then 2 ml methyl tert-butyl ether (MTBE) was added and vortexed. The tube was centrifuged to separate the aqueous and organic phases, and 1 ml of the MTBE layer was extracted, transferred to a glass tube, and evaporated to dryness at 38°C under a gentle stream of dry nitrogen. The residue was then redissolved in 100 μl of 100 mM benzyl bromide acetone for 1 h at 80°C and transferred to an autosampler vial. Extracts were analyzed using gas chromatography-mass spectrometry (Agilent 6890GC/5973MSD, Agilent Technologies Japan, Ltd., Tokyo, Japan) in electron impact ionization mode. PFOA was separated on an HP5MS column (30 m length, 0.25 mm i.d., 0.25 μm film thickness) with a helium carrier gas. Splitless injections (2 μl) were performed with the injector set at 220°C, and the split was opened after 1.5 min. The initial oven temperature was 60°C for 1.5 min, ramped at 15°C min−1 to 100°C, and then at 40°C min−1 to 240°C. Recoveries of 13C2 PFOA from biological samples (n=3) were 94 ± 2.6% for blood, 97 ± 4.4% for bile and 94.7 ± 4.9% for liver, respectively.
Measurement of 8-hydroxydeoxyguanosine (8-OHdG) in the liver
8-OHdG/dG levels were measured as an indicator of oxidative DNA damage. The frozen livers were minced and gently homogenized in a homogenizer by 5 strokes in lysis solution (Qiagen, Tokyo, Japan), DNA was extracted from mice frozen liver using a DNA Extractor WB kit (Wako Pure Chemical Industries, Ltd., Osaka, Japan)15). DNA was digested completely to nucleotides by combined treatment with Nuclease P1 (Wako Pure Chemical Industries, Ltd.) and alkaline phosphatase (Sigma Chemical Co., St. Louis, MO). Then the resulting deoxynucleoside mixture was injected into a high performance liquid chromatography apparatus (LC-10ADvp, Shimadzu, Kyoto, Japan) equipped with both a UV detector (SPD-10AVvp, Shimadzu) and an electrochemical detector (Coulochem model-5200–2, ESA, MA)16). Each liver was examined in duplicate and the means were reported.
Quantitative RT-PCR analysis for multidrug resistance protein 2 (Mdr2) and tumor necrosis factorα (TNF-α)
Quantitative real-time (RT)-PCR was used to study Mdr2 and Tnf mRNA expression in the liver. Total RNA was extracted from the liver using RNeasy Lipid Tissue Mini Kit (Qiagen). Aliquots (10 ng) were amplified using QuantiTect® SYBR® Green RT-PCR (Qiagen). Quantification of the amplified products was performed on an ABI PRISM 7700 Sequence Detection System (Applied Biosystems Japan, Tokyo, Japan). All expression data were normalized to glyceraldehyde 3-phophate dehydrogenase (GAPDH) mRNA from the same individual sample, to correct for differences in efficiency of RNA extraction and quality.
The following primers were used for RT-PCR: GAPDH: forward, 5’-ATGGTGAAGGTCGGTGTGAA-3’; reverse, 5’-GAGTGGAGTCATACTGGAAC-3’17), corresponding to GenBank accession number M32599; Mdr2: forward, 5’-ATCCTATGCACTGGCCTTCTGGT-3’; reverse, 5’-GAAAGCATCAATACAGGGGGCAG-3’18), corresponding to GenBank accession number NM_008830; Tnf forward, 5’-TCTTCTCAAAATTCGAGTGACAAG-3’; reverse, 5’-GAGAACCTGGGAGTAGACAAGGTA-3’, (note: designed in our lab) corresponding to GenBank accession number NM_013693.
Determination of bile acid/phospholipid ratio (BA/PL) in bile
Commercially available kit was used for determination of bile acid and phospholipid contents in bile (Wako Pure Chemical Industries). For bile acid determination, 0.1 μl bile was diluted in 200 μl double distilled H2O, that was added to 500 μl 3-α-hydroxysteroid dehydrogenase, incubated at 37°C for 10 min, added to 500 μl response fixing solution, and absorbance was read at 560 nm using a Hitachi U-2000A spectrophotometer (Hitachi). For phospholipid determination, 0.4 μl bile was diluted in 20 μl double distilled H2O, that was added to 3.0 ml color reagent (Phospholipid-C Test Wako, Wako Pure Chemical Industries), incubated at 37°C for 5 min, and absorbance was read at 600 nm against a color reagent blank.
Western blot analysis of BSEP and MRP2
Western blot analysis was carried out for quantification of the protein levels of the canalicular bile salt export pump (BSEP) and the canalicular multidrug resistance-associated protein 2 (MRP2). Membrane protein samples mixed with sample loading buffer (15 μg protein/lane) were loaded after heating for 10 min at 70°C onto a 3–8% Tris-acetate gel. Following electrophoresis, proteins in the gel were electrotransferred to PVDF-plus membranes (Immobilon-P Transfer Membrane; Millipore) for 1 h at 30 V at 4°C. Membranes were blocked for 1 h at room temperature with 5% non-fat dry milk in Tris-buffered saline that contained 0.05% Tween-20 (TBS-T). Blots were then incubated for 1 h at room temperature with the primary polyclonal antibody of rabbit BSEP, which was kindly provided by Rexue Wang, (British Columbia Cancer Research Center, Vancouver, BC, Canada) and rat MRP2, which was kindly provided by Bruno Stieger (University Hospital, Zurich, Switzerland). GAPDH antibody was used as a loading control. Each primary antibody was diluted in blocking buffer (1:5,000 for BSEP, 1:4,000 for MRP2, 1:1,000 for GAPDH). After thorough washing, blots were incubated with donkey anti-rabbit IgG horseradish peroxidase-linked secondary antibody (1:4,000 dilution with 5% non-fat milk in TBS-T) for 1 h. Immunoreactive bands were detected with an enhanced chemical luminescence (ECL) kit (Immobilon Western; Millipore). BSEP and MRP2 proteins were visualized by exposure to Fuji Medical X-Ray film (FUJIFILM Medical Co., Ltd, Tokyo, Japan).
Statistical analysis
Nine or 10 animals were studied in each group. All results were expressed as mean ± SD. Comparisons between two groups were performed using an unpaired Student’s t test, and Dunnett’s test for dose-response experiments. Levene’s test was used to assess the equality of variance. Trend test was performed using Jonckheere’s test. p<0.05 was considered to be statistically significant. Statistical analyses were done on SAS software (ver.8.2).
Results and Discussion
Body and liver weights (Table 1)
Table 1.
Body weight and liver weight changes after exposure to PFOA in wild-type and Pparα-null mice
| PFOA dose levels (umol/kg) | At the start of the experiment | At sacrifice after 4 wk dosing | |||||
|---|---|---|---|---|---|---|---|
| Gross body weight (g) | Body weight - Liver weight (g)a | Gross body weight (g) | Liver weight (g) | Relative liver weight (%) | Body weight - Liver weight (g) | Body weight gain excluded liver | |
| Wild-type | |||||||
| 0 (n=9) | 23.9 ± 1.97 | 23.0 ± 1.89 | 26.6 ± 2.13 | 1.0 ± 0.08 | 3.7 ± 0.4 | 25.7 ± 2.22 | 2.7 ± 1.36 |
| 12.5 (n=10) | 23.8 ± 0.79 | 22.9 ± 0.76 | 27.5 ± 2.07 | 3.2 ± 0.20*** | 11.3 ± 0.6*** | 24.7 ± 1.98 | 1.8 ± 1.95 |
| 25 (n=10) | 24.2 ± 1.98 | 23.3 ± 1.90 | 25.5 ± 1.94 | 3.3 ± 0.30*** | 12.9 ± 0.8*** | 22.5 ± 1.71 | −0.9 ± 1.64*** |
| 50 (n=10) | 24.5 ± 1.67 | 23.6 ± 1.61 | 23.0 ± 2.90** | 3.3 ± 0.45*** | 13.1 ± 0.9*** | 20.5 ± 2.50 | −3.1 ± 2.09*** |
| Pparα (−/−) | |||||||
| 0 (n=10) | 22.7 ± 1.53 | 21.6 ± 1.46 | 25.0 ± 1.56 | 1.0 ± 0.12 | 4.7 ± 2.1 | 24.1 ± 1.37 | 2.5 ± 0.58 |
| 12.5 (n=10) | 23.2 ± 1.87 | 22.1 ± 1.78 | 27.9 ± 1.99** | 3.3 ± 0.45*** | 11.6 ± 1.7*** | 25.1 ± 1.78 | 3.0 ± 1.44 |
| 25 (n=10) | 23.5 ± 1.54 | 22.4 ± 1.47 | 27.4 ± 0.93* | 3.4 ± 0.23*** | 11.9 ± 1.2*** | 24.5 ± 1.16 | 2.1 ± 1.37 |
| 50 (n=10) | 23.4 ± 1.88 | 22.3 ± 1.80 | 26.4 ± 2.07 | 3.4 ± 0.51*** | 13.0 ± 1.6*** | 23.7 ± 2.64 | 1.4 ± 1.98 |
Note: Values are expressed as mean ± SD.
p<0.05,
p<0.01,
p<0.001 by Dunnett’s test compared with 0 μmol/kg.
Liver weight was assumed as 3.7% in wild-type and 4.7% in Pparα-null mice of gross body weight.
Body and liver weight changes after exposure to PFOA in both groups of mice are shown in Table 1. Absolute and relative liver weights (% body weight) were increased approximately three fold in wild-type or Pparα-null mice, and induction of hepatomegaly reached plateau levels in both genetic backgrounds at doses higher or equal to 12.5 μmol/kg. These results demonstrated that PFOA induced hepatomegaly through non-PPARα-mediated pathways as previously reported19).
Biochemical analysis (Table 2)
Table 2.
Plasma analysis of PFOA-treated wild-type and Pparα-null mice
| PFOA dose levels (μmol/kg) | AST (IU/l) | ALT (IU/l) | ||
|---|---|---|---|---|
| Wild-type | Pparα (−/−) | Wild-type | Pparα (−/−) | |
| 0 (n=9, 10) | 145 ± 71.1 | 137 ± 25.9 | 26 ± 7.1 | 23 ± 7.2 |
| 12.5 (n=10) | 175 ± 29.2 | 145 ± 31.5† | 176 ± 62.4+++ | 136 ± 45.3+++ |
| 25 (n=10) | 265 ± 146.2* | 152 ± 20.2† | 284 ± 158.9+++ | 176 ± 42.8+++ |
| 50 (n=10) | 365 ± 106.0*** | 870 ± 523.5***†† | 328 ± 128.9+++ | 1356 ± 744+++††† |
| T-Bil (mg/dl) | TBA (mmol/l) | |||
| Wild-type | Pparα (−/−) | Wild-type | Pparα (−/−) | |
| 0 (n=9, 10) | 0.09 ± 0.05 | 0.06 ± 0.02 | 4.5 ± 7.2 | 2.4 ± 2.6 |
| 12.5 (n=10) | 0.05 ± 0.01* | 0.02 ± 0.01††† | 4.5 ± 1.6 | 1.0 ± 0††† |
| 25 (n=10) | 0.09 ± 0.03 | 0.03 ± 0.01††† | 9.0 ± 4.6 | 1.4 ± 0.6†† |
| 50 (n=10) | 0.15 ± 0.04** | 0.47 ± 0.39***† | 12.5 ± 9.9 | 34.8 ± 9.1***†† |
| T-Cho (mg/dl) | TG (mg/dl) | |||
| Wild-type | Pparα (−/−) | Wild-type | Pparα (−/−) | |
| 0 (n=9, 10) | 115 ± 9.7 | 136 ± 26.8††† | 59 ± 17.6 | 45 ± 17.3 |
| 12.5 (n=10) | 109 ± 17.7 | 84 ± 21.9***† | 87 ± 15.7** | 91 ± 35.5** |
| 25 (n=10) | 95 ± 15.4** | 87 ± 13.7*** | 89 ± 28.4** | 105 ± 23.8*** |
| 50 (n=10) | 86 ± 11.6*** | 226 ± 23.0***††† | 51 ± 18.4 | 114 ± 32.1***††† |
AST, aspartate aminotransferase; ALT, alanine aminotransferase; T-Bil, total bilirubin.
TBA, total bile acid; T-Cho, total cholesterol; TG, triglyceride.
Data are expressed as mean ± SD.
p<0.05,
p<0.01,
p<0.001 by Dunnett’s test compared with 0 μmol/kg.
p<0.05,
p<0.01,
p<0.001 by Dunnett’s test after log-transformation due to heteroscedasticity (Levene’s test p<0.05).
p<0.05,
p<0.01,
p<0.001 by t-test compared with wild-type and Pparα-null mice at same PFOA-dose level.
In wild-type mice, judging from the plasma AST and plasma ALT values, 12.5 or 25 μmol/kg PFOA caused hepatocellular damages with slight changes in T-Bil and TBA. The hepatocellular damages seemed to increase with increase in dose. Mild cholestasis was apparent at 50 μmol/kg, at which dose mild increases in T-Bil and TBA were observed. T-Cho was decreased after treatment with PFOA at 25 and 50 μmol/kg. TG was increased after treatment with PFOA at 12.5 and 25 μmol/kg, but was the same level at 50 μmol/kg.
In Pparα-null mice, 12.5 or 25 μmol/kg PFOA treatment induced mild hepatocellular damages indicated by ALT but those changes were not accompanied by elevation of T-Bil or TBA. At 50 μmol/kg, PFOA, however, induced extensive hepatocellular damages and cholestasis simultaneously with a sharp contrast with wild cholestasis in wild mice. TG metabolism was significantly disturbed, even at 12.5 μmol/kg, while cholesterol metabolism was disturbed only at the highest dose of 50 μmol/kg.
Biochemical analysis suggested a significant modification of liver toxicity of PFOA by PPARα. Hepatocytes were more vulnerable than bile duct cells to PFOA in wild-type mice. In contrast, ablation of PPARα rendered the hepatocytes tolerable to PFOA-induced damage, at doses lower than 50 μmol/kg, while extensive hepatic and bile duct injuries occurred at 50 μmol/kg as shown in next section. In addition, metabolism of both T-Cho and TG was impaired more extensively in Pparα null than wild-type mice.
Histology
In PFOA wild-type mice, PFOA induced hepatocellular hypertrophy. The liver parenchyma showed dose-dependent eosinophilic cytoplasmic changes that were morphologically consistent with peroxisome proliferation (Fig. 1A–D). However, no fat droplets or focal necrosis were observed in control or treated mice at any doses. Bile duct epithelium showed a slight increase in thickness, which suggested that slight cholangiopathy occurred at 25 and 50 μmol/kg (Fig. 1C, D).
Fig. 1. Effects of PFOA on the mouse liver by oral gavage for 4 wk.
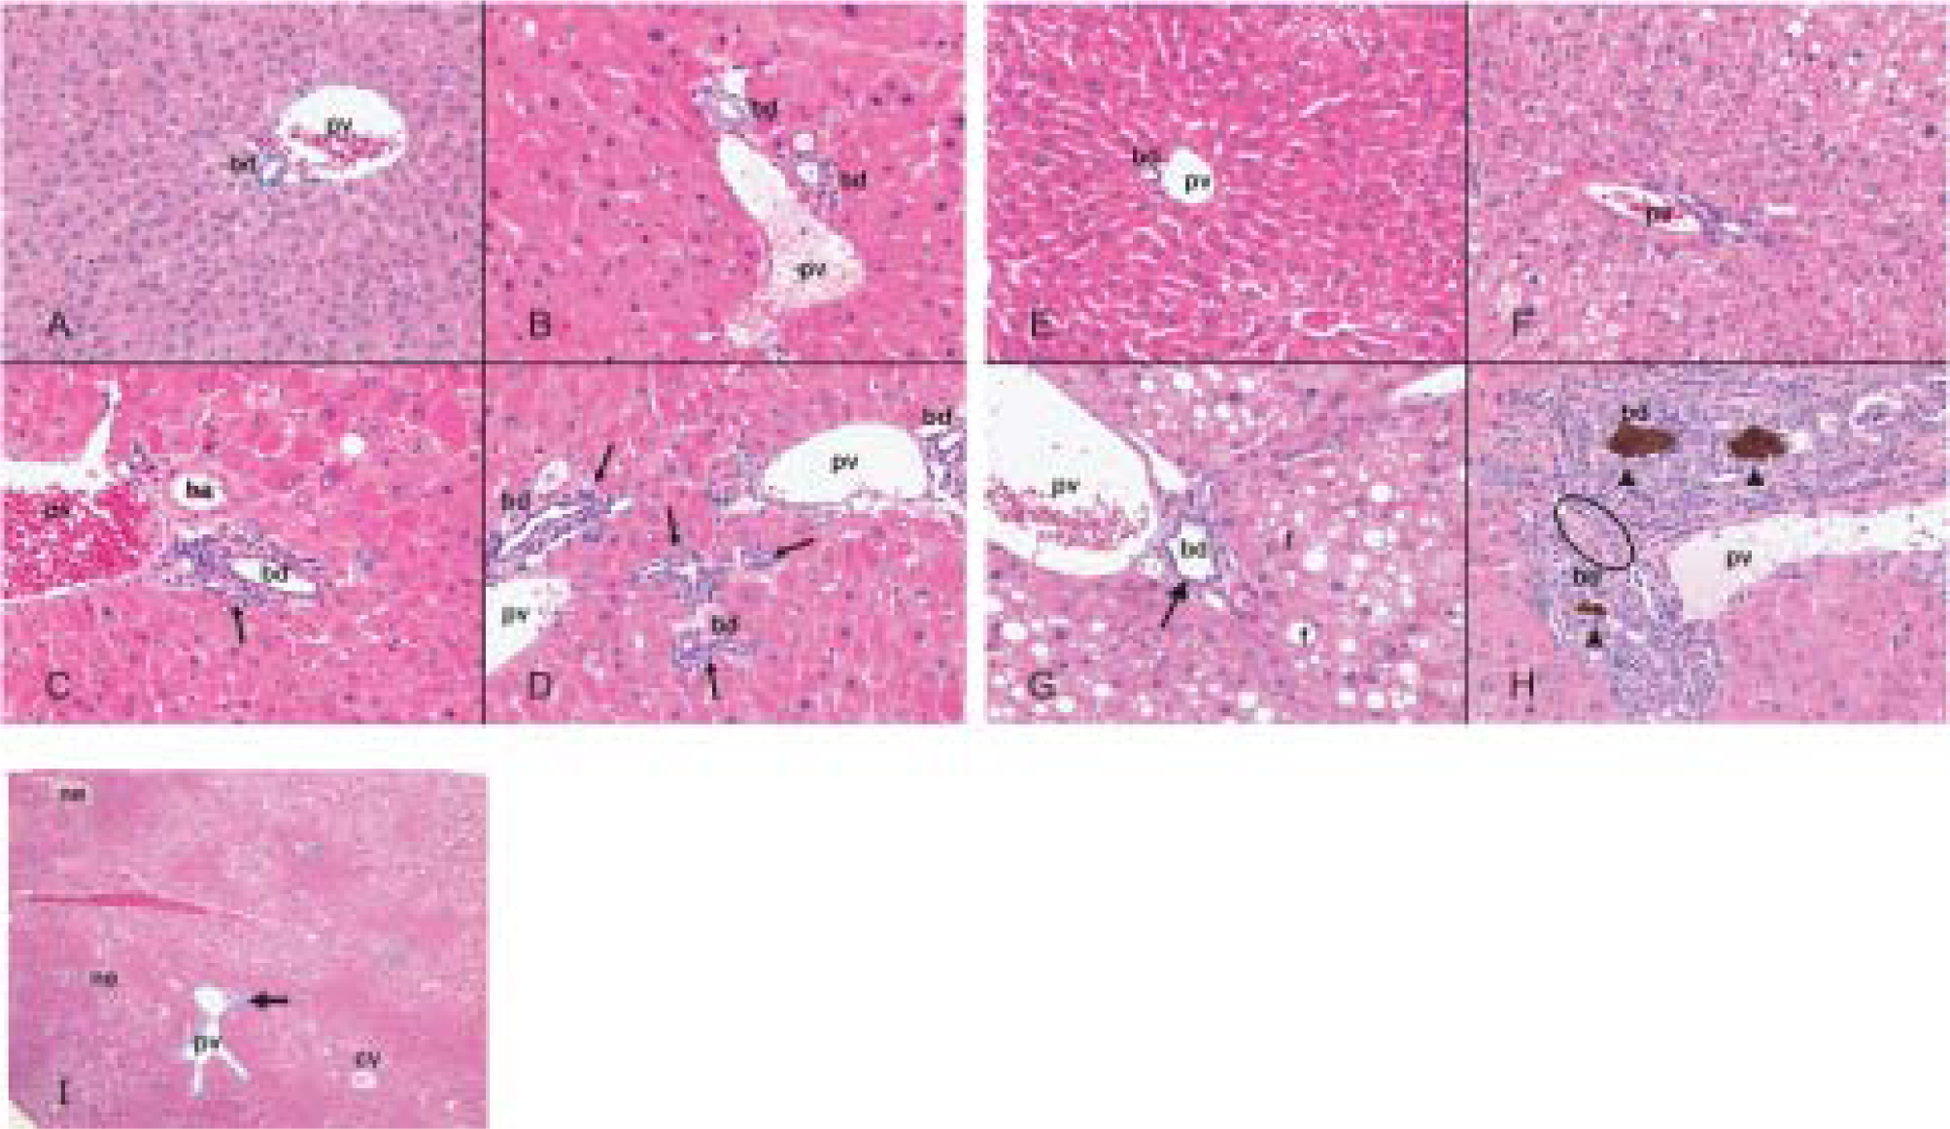
Hematoxylin-eosin stained sections of liver from control wild-type mice (A), wild-type mice treated with PFOA at 12.5 μmol/kg (B), 25 μmol/kg (C), 50 μmol/kg (D), control Pparα-null mice (E), Pparα-null mice treated with PFOA at 12.5 μmol/kg (F), 25 μmol/kg (G), 50 μmol/kg (H, I). Original magnification, × 200 (A–H), × 40 (I). Wild-type mice treated with PFOA (B–D) have diffuse hepatocyte hypertrophy with numerous eosinophilic cytoplasmic granules. Control Pparα-null mice (E) has scattered small fat vacuoles. Centrilobular fat accumulations were increased dose-independently in Pparα-null mice treated with PFOA at 12.5 μmol/kg (F), 25 μmol/kg (G), 50 μmol/kg (H, I). Focal necrosises are scattered with fat accumulation and proliferation of bile ductules is prominent in the portal tracts in Pparα-null mice treated with PFOA at 50 μmol/kg (I). Diffuse hepatocyte hypertrophy was observed in both mouse lines treated (B–D, F–H). Bile duct epithelial thickness (arrow) was observed in both mouse lines treated at 25 μmol/kg (C, G) and 50 μmol/kg (D, H). Diffusely distributed, fine, fatty droplets and ground-glass appearance is showed at 12.5 μmol/kg (F) and 25 μmol/kg (G) in Pparα-null mice. Note hyperplastic changes in the biliary duct epithelium with bile plaque (arrow head) and fibrosis (open circle) as evidenced by proliferation of bile ductules (arrow) in Pparα-null mice treated with PFOA at 50 μmol/kg (H). cv, central vein; pv, portal vein; ha, hepatic artery; bd, bile duct; f, fat droplet; ne, necrosis.
The histological appearance in control Pparα-null mice showed greater occurrence of microvesicular steatosis than in wild control mice (Fig. 1E). In PFOA-treated Pparα-null mice, the hepatocytes showed not only hepatocellular hypertrophy, but also cytoplasmic vacuolation and an increase in microvesicular steatosis (Fig. 1F–H). Focal necrosis was detectable at 50 μmol/kg (Fig. 1I). The most characteristic change was cholangiopathy. Although it was found in both wild and Pparα-null mice treated with PFOA at 25 (Fig. 1C and G) and 50 μmol/kg (Fig. 1D and H), it was more intensive in the latter than in the former (Fig. 1C, D, G, H). In particular, it was shown in Pparα-null mice that bile ducts were surrounded by a few inflammatory cells and areas of fibrosis and bile plaque (Fig. 1H).
TUNEL staining demonstrated increased apoptosis in hepatic cells, hepatic arterial walls and bile-duct epithelium in wild-type mice treated with PFOA at 25 and 50 μmol/kg (Fig. 2A, B, E, F). On the other hand, in Pparα-null mice, positive staining was observed mainly in bile duct epithelium at 25 and 50 μmol/kg (Fig. 2C, D, G, H).
Fig. 2. Distribution of apoptotic cells in liver PFOA treated by oral gavage for 4 wk by immunohistochemistry for TUNEL.
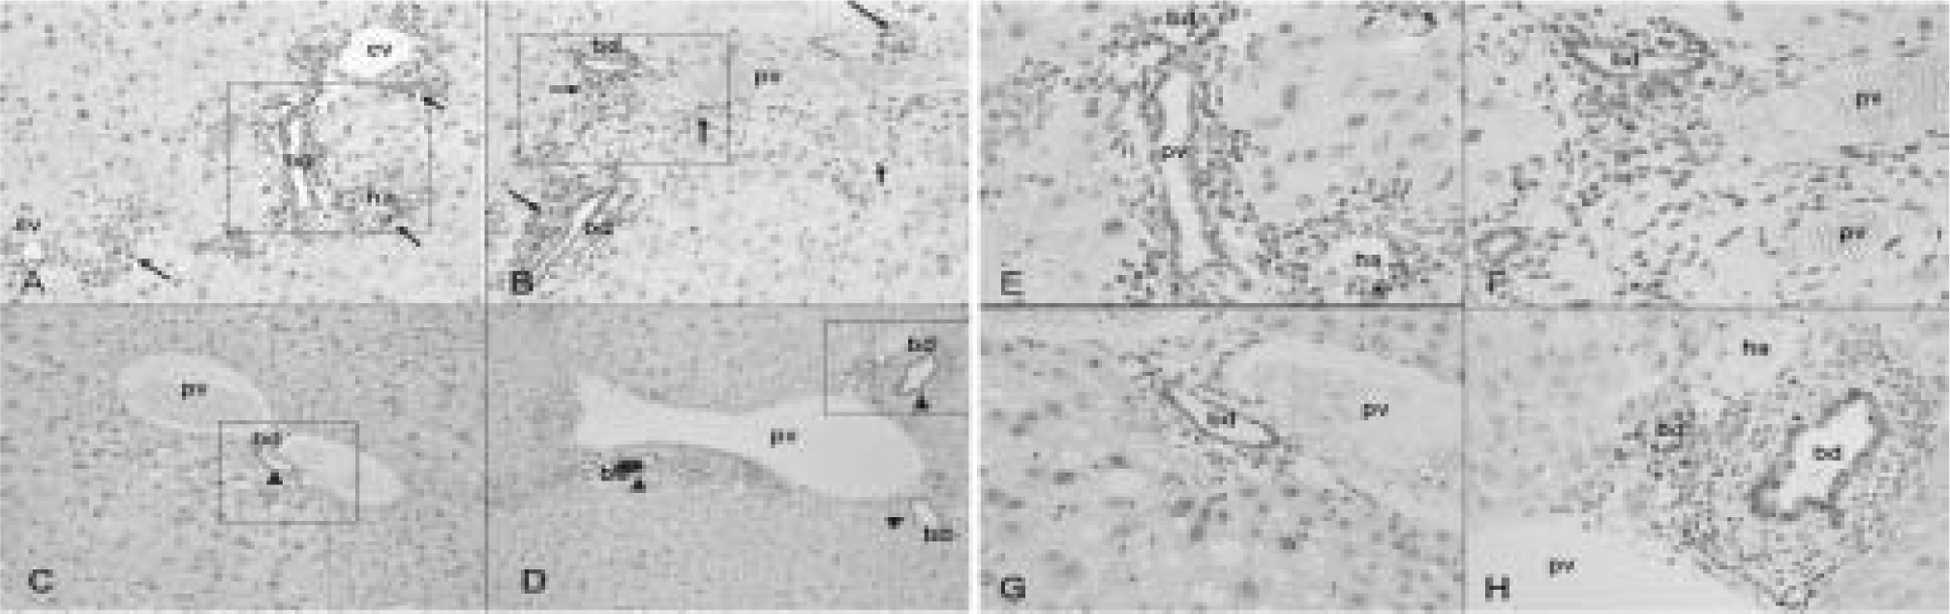
Wild-type mice treated with PFOA at 25 μmol/kg (A, E) and 50 μmol/kg (B, F), Pparα-null mice treated with PFOA at 25 μmol/kg (C, G) and 50 μmol/kg (D, H). Original magnification, × 100 (A–D), × 400 (E–H) the extended a part surrounded with a square in A–D, respectively. Wild-type mice treated with PFOA at 25 μmol/kg (A, E) and 50 μmol/kg (B, F) show diffuse positive stains in hepatocyte, vessel wall, and bile duct epithelium (arrow). Pparα-null mice treated with PFOA at 25 μmol/kg (C, G) and 50 μmol/kg (D, H) show positive stains mainly in bile duct epithelium (arrow head). cv, central vein; pv, portal vein; ha, hepatic artery; bd, bile duct.
The ultrastructure of livers from control wild-type mice (Fig. 3A) exhibited numerous glycogen granules, normal lamellar arrangement of the rough endoplasmic reticulum (RER), a few normal dense peroxisomes and mitochondria. In contrast to control livers, treated wild-type mice (Fig. 3B–D) displayed dose-dependent, hepatocyte hypertrophy, reduction or disappearance of glycogen granules, degranulation and disruption of the RER, nuclear vacuoles, extensive peroxisome proliferation, and slight proliferation of mitochondria. There were larger numbers and sizes of dark-staining peroxisomes and increased small, round-shaped mitochondria (Fig. 3B–D, I).
Fig. 3. Ultrastructure of hepatocyte and bile duct epithelium cells in control and after treatments of wild-type mice and Pparα-null mice with PFOA by oral gavage for 4 wk.
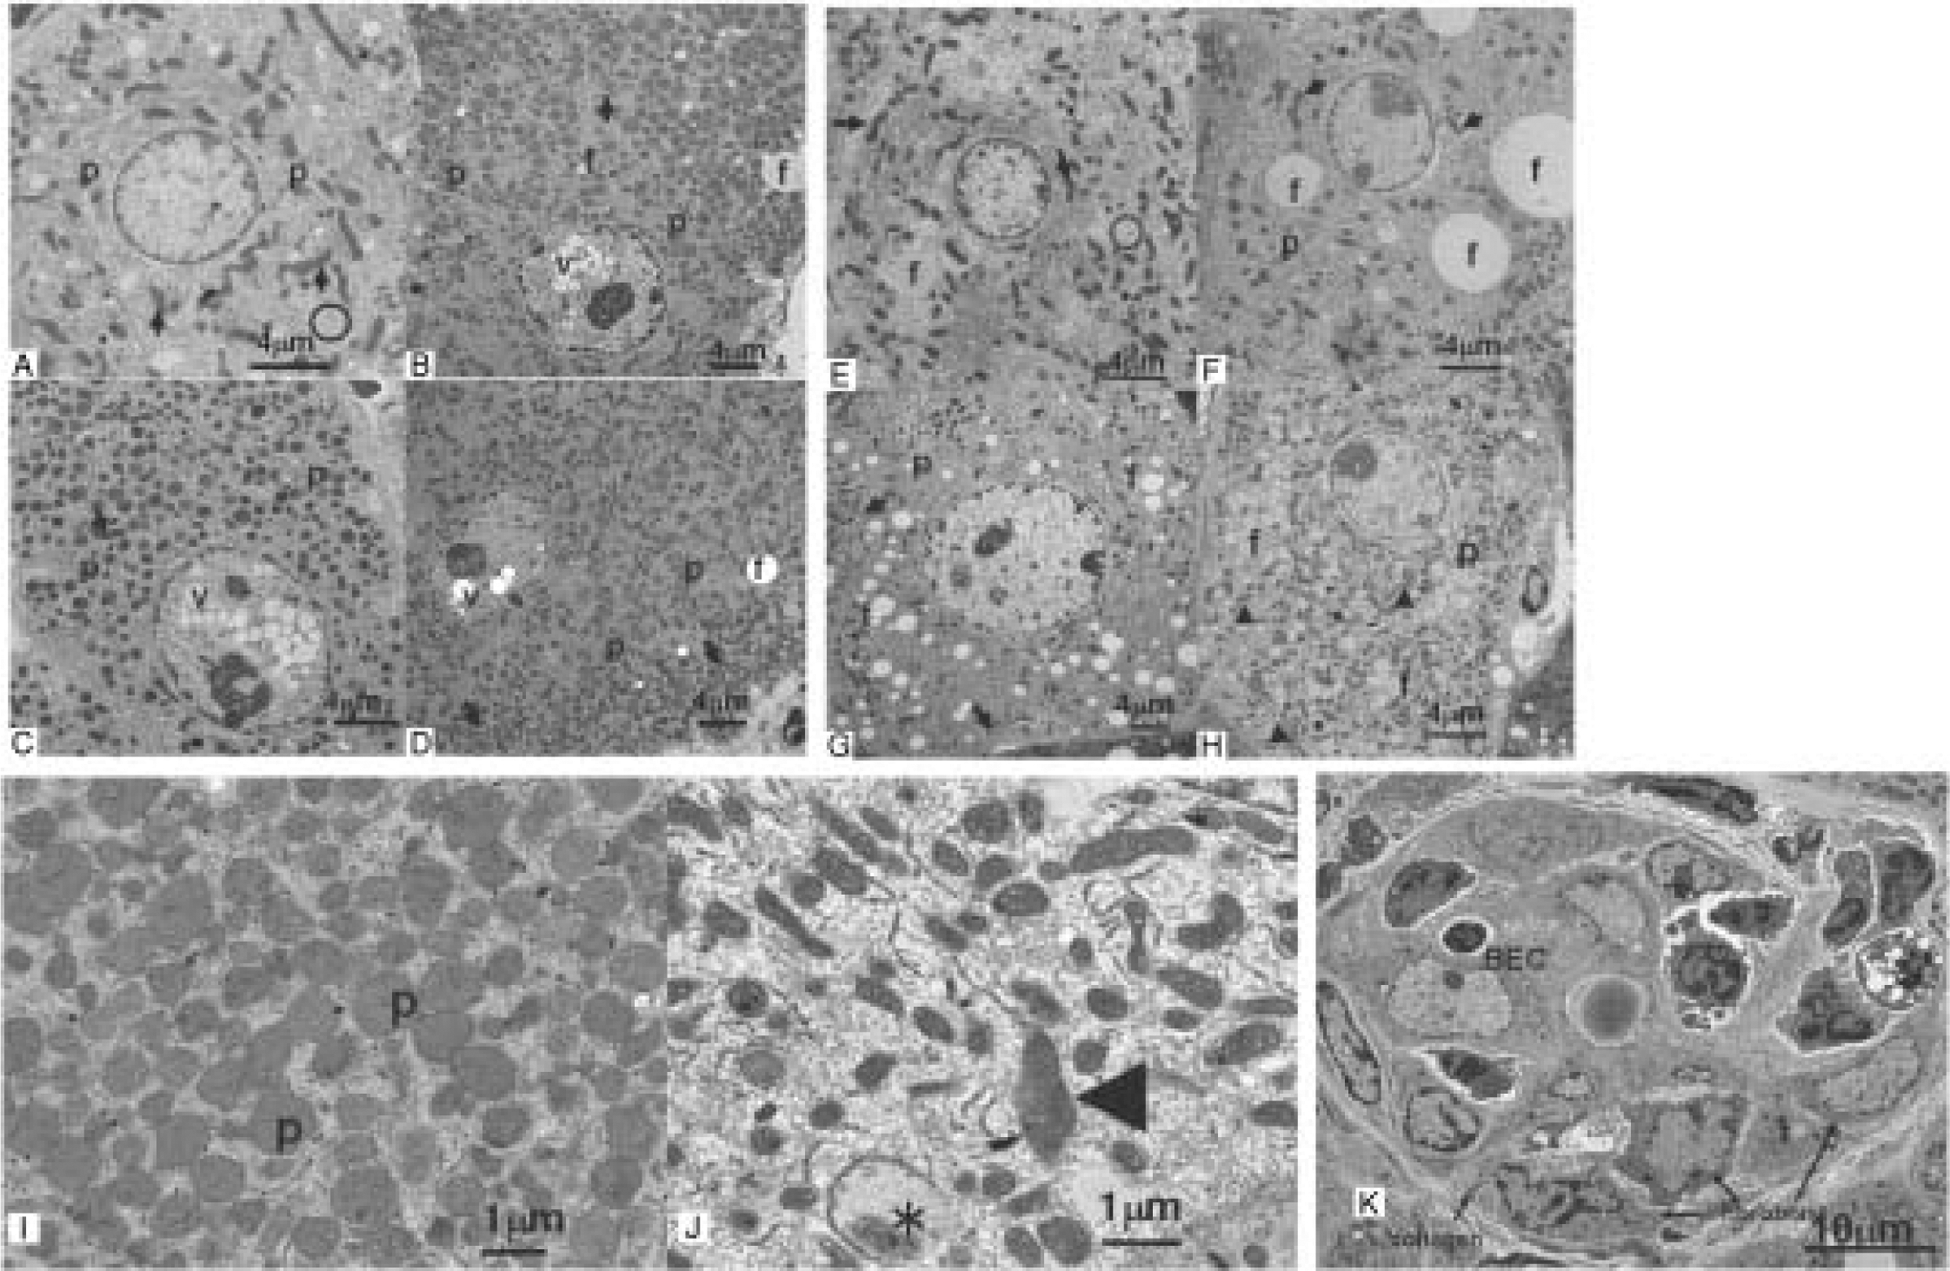
Hepatocytes from control wild-type mice (A), wild-type mice treated with PFOA at 12.5 μmol/kg (B), 25 μmol/kg (C), 50 μmol/kg (D, I), Control Pparα-null mice (E), Pparα-null mice treated with PFOA at 12.5 μmol/kg (F), 25 μmol/kg (G), 50 μmol/kg (H, J), Bile duct epithelial cell (BEC) of Pparα-null mice treated with PFOA at 50 μmol/kg (K).
Numerous glycogen granules (circle) are observed in control wild-type mice (A). The increased number and size of dark staining peroxisomes were shown in treated wild-type mice (B–D, I). Hepatocytes from control Pparα-null mice (E) are similar to control wild-type mice with fewer fat droplets (f) in cytoplasm. In contrast to controls, treated Pparα-null mice (F–H, J) also display hepatocyte hypertrophy, decreased glycogen granules, degranulation and disruption of the rough endoplasmic reticulum, and increased mitochondria in dose-dependently. The marked different points contrasts to wild-type mice treated with PFOA are increased fat droplets in cytoplasm, a few peroxisomes, and a variable size and shape of mitochondria (F–H, J). Note that peroxisomes are markedly increased and slightly enlarged in size in wild-type mice treated with PFOA at 50 μmol/kg (I), and mitochondria are pleomorphic, enlarged (*), and disorganization of cristae (arrowhead) in Pparα-null mice treated with PFOA at 50 μmol/kg (J). BECs (K) showed degradation of cytoplasmic structure, vacuolization, disintegration of nuclei and organelles, and were surrounded with fibroblasts and collagen. p, peroxisome; f, fat droplet; v, vacuole. (A–H) Bar=4 μm, (I, J) Bar=1 μm, (K) Bar=10 μm.
In control Pparα-null mice (Fig. 3E) there were discernible amounts of small fat deposits in the cytoplasm. In treated Pparα-null mice (Fig. 3F–H) there were dose-dependent hepatocyte hypertrophy, decreased amounts of glycogen granules, degranulation and disruption of the RER, and increased numbers of mitochondria. There is increased cytoplasmic lipid accumulation to varying extents, extensive mitochondrial changes that consisted of slight swelling, decreased matrix density and inconspicuous criste, but no peroxisome proliferation (Fig. 3F–H, J). In addition, bile duct epithelium showed degradation of cytoplasmic structure, vacuolization, and disintegration of nuclei and organelles. Severe bile duct epithelium injury was observed, with periductal infiltration of fibroblasts and macrophages, and fibrosis (Fig. 3K).
Pharmacokinetics of PFOA in whole blood, bile and liver (Table 3)
Table 3.
Whole blood, bile and liver concentrations of PFOA in wild-type and Pparα-null mice
| PFOA concentration (μg/ml) | ||||||
|---|---|---|---|---|---|---|
| PFOA dose levels (umol/kg) | Whole blood | Bile | Liver | |||
| Wild-type | Pparα (−/−) | Wild-type | Pparα (−/−) | Wild-type | Pparα (−/−) | |
| 0 (n=9, 10) | nd | nd | nd | nd | nd | nd |
| 12.5 (n=10) | 20.6 ± 2.4 | 19.3 ± 2.2 | 56.8 ± 26.9 | 19.6 ± 2.2 | 181.2 ± 6.3 | 172.3 ± 8.9 |
| 25 (n=10) | 46.9 ± 3.2 | 36.4 ± 2.7* | 784.0 ± 137.6 | 62.9 ± 16.7** | 198.8 ± 15.4 | 218.3 ± 14.5 |
| 50 (n=10) | 64.2 ± 6.5 | 71.2 ± 8.0 | 2174.0 ± 322.4 | 383.0 ± 109.9** | 211.6 ± 13.3 | 239.7 ± 25.0 |
Data are expressed as mean ± SD.
p<0.05,
p<0.01,
p<0.001 by t-test compared between wild-type and Pparα-null mice.
nd; not detected (less than 0.001 μg/ml).
In order to investigate whether the absence of PPARα changed the pharmacokinetics of PFOA, the concentration of PFOA was determined in whole blood, bile and liver after dosing for 4 wk. The concentrations of PFOA in whole blood increased in proportion to dose, in both wild-type and Pparα-null mice (Table 3). On the other hand, the concentrations in liver reached similar saturation levels at 12.5 μmol/kg in wild-type and Pparα-null mice.
The concentrations of PFOA in bile increased with dose; it increased by 13.8 times from 56.8 μg/ml at 12.5 μmol/kg to 784 μg/ml at 25 μmol/kg, and 38 times to 2,174 μg/ml at 50 μmol/kg in wild-type mice. Enhanced PFOA excretion indicates that the liver has a PFOA transport capacity from hepatocytes to bile duct that can be mediated at least partly by PPARα. In contrast, much lower increases were observed in Pparα-null mice. PFOA concentrations increased by 3.2 times from 19.6 μg/ml at 12.5 μmol/kg to 62.9 μg/ml at 25 μmol/kg, and by 19.5 times to 383.0 μg/ml at 50 μmol/kg, demonstrating existence of capacity-limited and PPARα-independent PFOA transport.
8-OHdG levels in liver and quantitative RT-PCR of TNF-α mRNA
In wild-type mice, PFOA did not elevate the levels of 8-OHdG in liver significantly at any dose (Fig. 4A). In contrast, in Pparα-null mice, the levels of 8-OHdG tended to increase dose-dependently (p<0.05), which was significantly increased at 50 μmol/kg (p<0.05) (Fig. 4A). PFOA did not alter the levels of TNF-α mRNA in wild-type mice (Fig. 4B). However, PFOA upregulated TNF-α mRNA significantly at doses of 25 and 50 μmol/kg in Pparα-null mice (p<0.01 and p<0.05, respectively) (Fig. 4B).
Fig. 4. Effects of PFOA on biomarkers associated with liver injury.
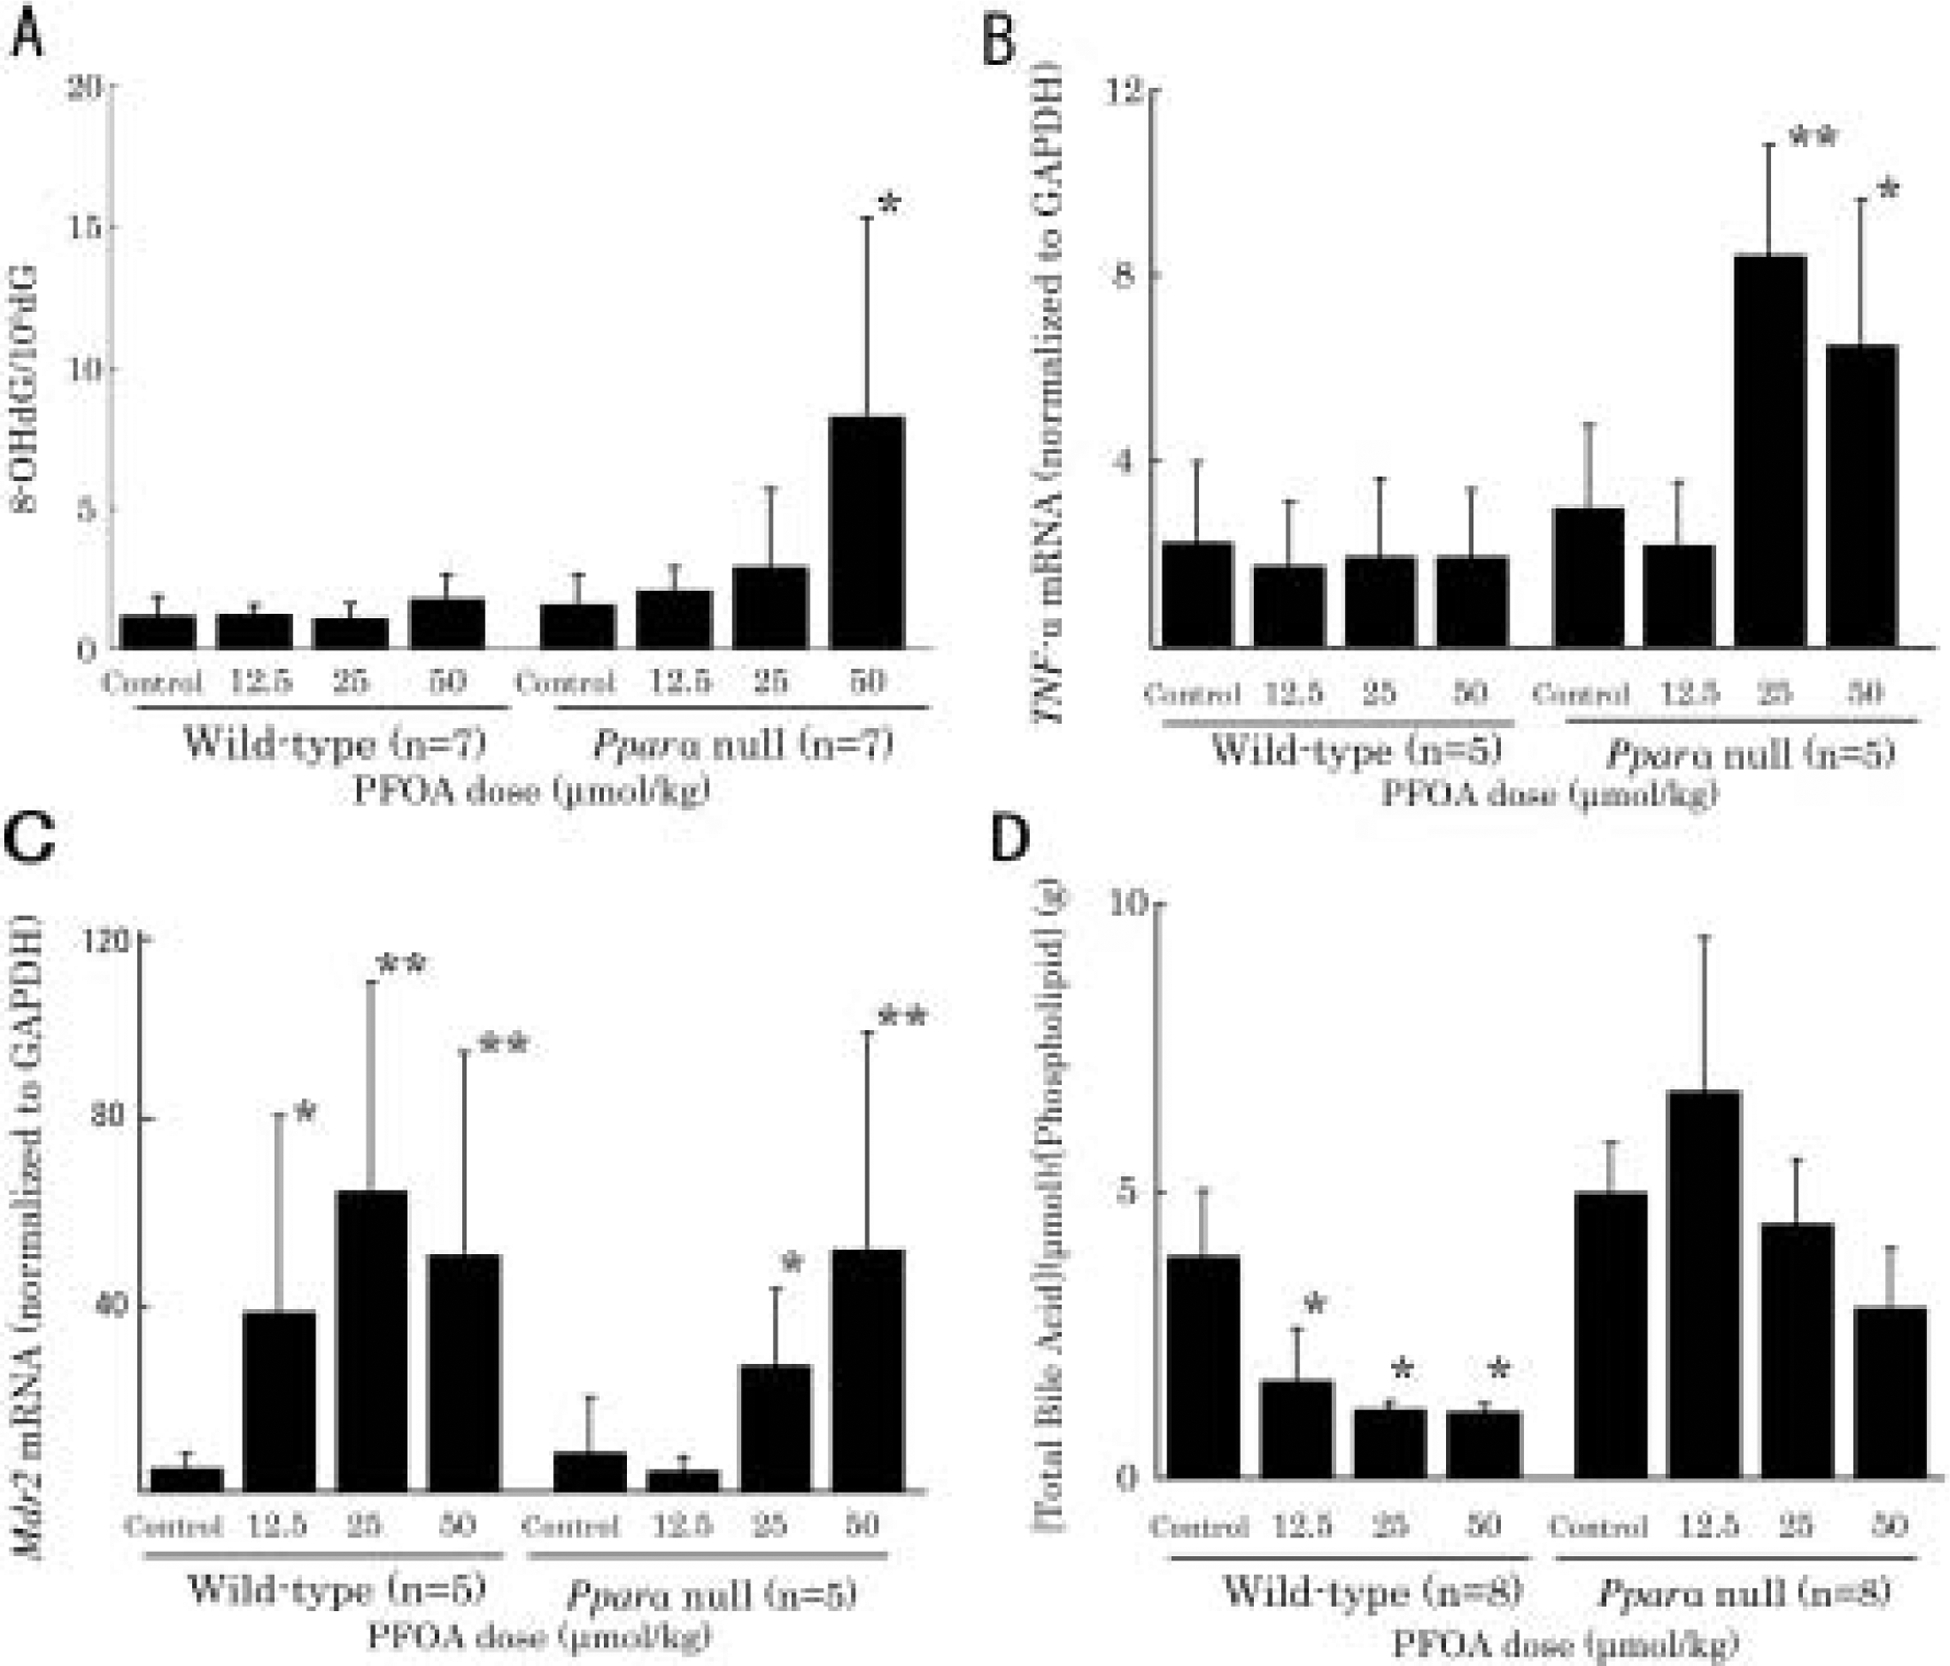
(A) Effects of PFOA on 8-hydroxydeoxyguanosine from unfractionated livers of wild-type and Pparα-null mice.
This figure reveals that the levels of 8-OHdG tend to increase dose-dependently in Pparα-null mice (Jonckheere’s test, p<0.05), in which the levels are increased significantly at 50 μmol/kg (p<0.05).
(B) The expressions of TNF-α mRNA are significantly increased in Pparα-null mice treated with PFOA at 25 (p<0.01) and 50 μmol/kg (p<0.05). (C) The expressions of Mdr2 mRNA are significantly up-regulated in wild-type mice treated with PFOA at all doses (at 12.5 μmol/kg, 25 μmol/kg and 50 μmol/kg, p<0.05, p<0.01, respectively). In Pparα-null mice treated with PFOA, the expressions of Mdr2 mRNA are not induced at 12.5 μmol/kg, however induced at 25 μmol/kg (p<0.05) and 50 μmol/kg (p<0.01) significantly.
(D) Effects of PFOA on biliary total bile acid/phospholipid (BA/PL) ratio.
Biliary BA/PL ratios show significant decrease in wild-type mice treated with PFOA dose-dependently (p<0.05). However, no such significant adaptation is observed in Pparα-null mice treated with PFOA. Data are presented as mean ± SD. Trend test is Jonckheere’s test. *p<0.05, **p<0.01 versus control controls in each group. Log-transformation was performed for expressions of Mdr2 mRNA levels due to heteroscedusticity.
These data demonstrated that ablation of PPARα exacerbated oxidative damage and enhanced production of inflammatory cytokines after PFOA administration.
Quantitative RT-PCR for Mdr2, bile acids/phospholipids ratio in bile
We investigated three prototypical hepatobiliary transporters. MDR2 transports biliary phospholipids from hepatocytes to bile via the canalicular phospholipid flippase, which alleviates bile acid toxicity in cholangiocytes20). BSEP transports bile acid from hepatocytes to bile via the canaliculi to keep bile acid concentrations constant in bile21, 22), and confers resistance to canalicular damages in humans23). MRP2 is a transporter of bile acid and is a sensitive indicator of canalicular damages24). Recently, PFOA has been reported to regulate liver transporters, organic anion transporting polypeptides (OATPs) and multidrug resistance-associated proteins responsible for uptake of bile acids (BAs) and other organic compounds into liver, primarily via activation of PPARα25, 26). For investigating expression of MDR2, we performed quantitative RT-PCR instead of Western blotting because the MDR2 antibody was not specific for mouse MDR2 (data not shown). In wild-type mice, the expression of Mdr2 mRNA was significantly upregulated by PFOA at 12.5, 25 and 50 μmol/kg (p<0.05, p<0.01 and p<0.01, respectively) (Fig. 4C). In Pparα-null mice, Mdr2 mRNA was not induced by PFOA at 12.5 μmol/kg, however, it was induced significantly at 25 and 50 μmol/kg (p<0.05 and p<0.01, respectively) (Fig. 4C). This non-PPARα-mediated increase in Mdr2 mRNA may likely be attributable to the increase in bile acid at high doses27) or other nuclear receptors28). To confirm adaptive phospholipid transport, we examined the biliary bile acid to phospholipid (BA/PL) ratio (Fig. 4D). As expected, BA/PL ratio decreased significantly in a dose-dependent manner in PFOA-treated wild-type mice (p<0.01). However, no such significant adaptation was observed in PFOA-treated Pparα-null mice, suggesting that bile duct protective mechanism characterized by increasing phospholipid transport into bile did not work in the null mice.
Western blotting for BSEP and MRP2
Protein levels of BSEP were downregulated in treated wild-type mice significantly at 50 μmol/kg (p<0.01). In contrast, in Pparα-null mice, protein level of BSEP was increased significantly at 12.5 μmol/kg (p<0.01), however decreased significantly at 50 μmol/kg (p<0.05) (Fig. 5).
Fig. 5. Effects of PFOA on Hepatic BSEP and MRP2 protein levels.
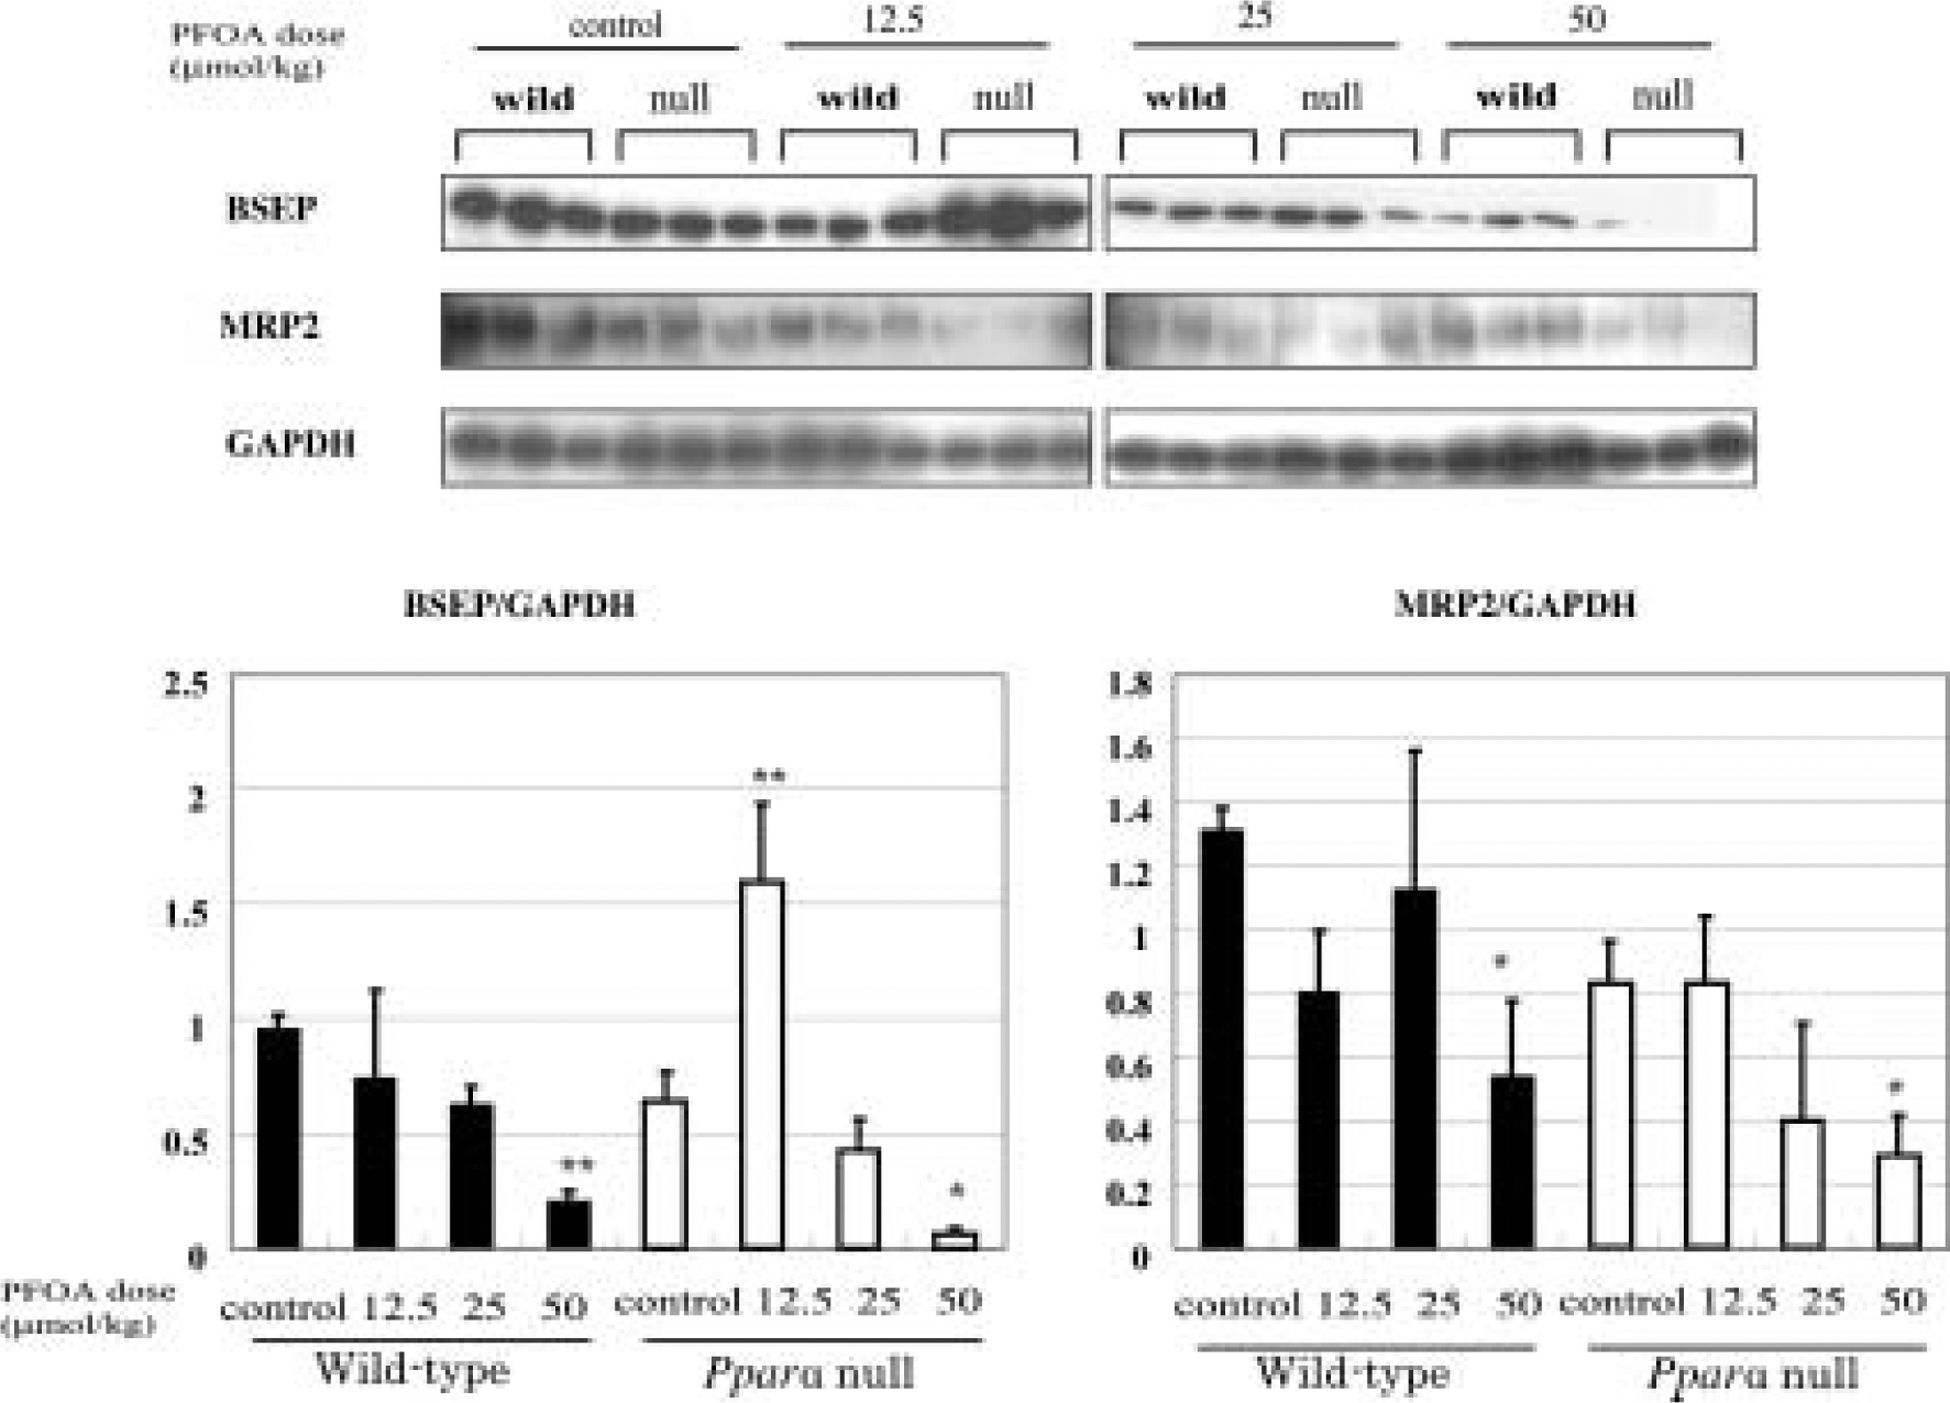
Each panel represents an individual experiment. There is a significant decrease in BSEP protein level in wild-type mice treated with PFOA at 50 μmol/kg (p<0.01). In Pparα-null mice treated with PFOA, the levels are increased significantly at 12.5 μmol/kg (p<0.01), however decreased significantly at 50 μmol/kg (p<0.05). There is a significant decrease in MRP2 protein levels in both wild-type and Pparα-null mice treated with PFOA at 50 μmol/kg (p<0.05). Control wild-type mice, w0; wild-type mice PFOA treated with 12.5 μmol/kg, w12.5; 25 μmol/kg, w25, 50 μmol/kg, w50; control Pparα-null mice, n0; Pparα-null mice treated with PFOA at 12.5 μmol/kg, n12.5; 25 μmol/kg, n25, 50 μmol/kg, n50. Black bars, wild-type mice; white bars, Pparα-null mice. Densitometric values are presented as mean ± SD of 3 animals in each group. *p<0.05, **p<0.01 versus control in each group. Trend test is Jonckheere’s test.
The decreased levels of BSEP in Pparα-null mice were very likely induced by severe injury of the hepatobiliary system and inflammation29, 30). Protein levels of MRP2 decreased in both wild-type mice and Pparα-null mice at 50 μmol/kg (p<0.05 for both types) (Fig. 5).
Bile duct transporters demonstrated that there were several PPARα-mediated adaptive responses in wild-type mice to alleviate toxicity of PFOA, such as up-regulation of Mdr2 mRNA and down-regulation of BSEP. In contrast, these responses were not mobilized in concert in PFOA-treated Pparα-null mice. Ablation of PPARα made mice highly susceptible to bile duct injury. MRP2 protein levels decreased in both wild-type and Pparα-null mice, which might be independent to PPARα.
To embark this study, we have hypothesized that PFOA has a potential toxicity for bile duct as Bezafibrate does9). As expected, PFOA was shown to induce cholestatic lesions more intensively in Pparα null mice than in wild mice as demonstrated by clinical and pathological investigations. Simultaneously, we could demonstrate clear differences in dose dependent mobilization of transporters, Mdr2 mRNA and BSEP, between wild and null mice. Furthermore, there were differences in inducing 8-OHdG, TNF-α induction and BA/PL ratios in bile between wild and null mice. This is the first study to demonstrate a potential toxicity of PFOA associated with cholestatic disease and PPARα dependent and independent responses.
Although hepatomegaly and increases in AST and ALT were observed in both wild-type and Pparα null mice, microscopic appearance and ultrastructure of liver indicated different modes of toxicity as evidenced by biomarkers investigated in this study.
In terms of the mechanism of bile duct injury, we focused on the changes in bile compositions and expression levels of hepatobilliary transporters. BA/PL ratio was decreased immediately in PFOA-treated wild-type mice. On the contrary it was increased at 12.5 μmol/kg and decreased gradually at higher PFOA dose in Pparα-null mice. In wild-type mice, the decreased BA/PL ratio may protect against bile duct-injury. Expression of Mdr2 mRNA was clearly upregulated in all treated wild-type mice, whereas it was less upregulated in Pparα-null mice, which was consistent with BA/PL ratio in both groups of mice. The bile acid transporter, BSEP, also showed different responses between wild and null mice. Decreased BSEP levels were observed in both genetic background mice at higher doses, while Pparα-null mice showed a transient increase in BSEP protein levels at lowest dose, 12.5 μmol/kg. Although the entire signal transduction for eliciting responses remains unknown, several other factors such as farnesoid X receptor-α (FXRα), which is known to downregulate BSEP31–33) and CAR28) may also be involved.
In conclusion, this study revealed the new insights that PPARα is protective against cholestastis induced by the weak PPARα ligand PFOA in using mouse model. PFOA mobilized adaptive processes regulated by PPARα— fat metabolism by mitochondria and peroxisomes, oxidative stress, elevation of TNF-α and hepatobiliary transport systems. So we propose that PPARα activators may induce either hepatocellular or bile duct injury, depending on their affinity to PPARα and dose level. If so, cholestasis and its associated morbidities may also be taken into account for risk assessment of PFOA in humans since species differences is well characterized in PPARα-associated signal transduction34). Further studies are needed to clarify this hypothesis.
Acknowledgement
This work was supported by Grants-in-Aid from the Japan Society for the Promotion of Science (grant number 19890107, 20590597, 20590600 and JSPS PE7509).
References
- 1).Kissa E (2001) Fluorinated surfactants and repellents, 2nd Ed., Marcel Dekker, New York. [Google Scholar]
- 2).Lau C, Anitole K, Hodes C, Lai D, Pfahles-Hutchens A, Seed J (2007) Perfluoroalkyl acids: a review of monitoring and toxicological findings. Toxicol Sci 99, 366–94. [DOI] [PubMed] [Google Scholar]
- 3).Harada K, Koizumi A (2009) Environmental and biological monitoring of persistent fluorinated compounds in Japan and their toxicities. Environmental Health and Preventive Medicine 14, 7–19. [DOI] [PMC free article] [PubMed] [Google Scholar]
- 4).Vanden Heuvel JP, Thompson JT, Frame SR, Gillies PJ (2006) Differential activation of nuclear receptors by perfluorinated fatty acid analogs and natural fatty acids: a comparison of human, mouse, and rat peroxisome proliferator-activated receptor-alpha, -beta, and -gamma, liver X receptor-beta, and retinoid X receptor-alpha. Toxicol Sci 92, 476–89. [DOI] [PubMed] [Google Scholar]
- 5).Kennedy GL Jr., Butenhoff JL, Olsen GW, O’Connor JC, Seacat AM, Perkins RG, Biegel LB, Murphy SR, Farrar DG (2004) The toxicology of perfluorooctanoate. Crit Rev Toxicol 34, 351–84. [DOI] [PubMed] [Google Scholar]
- 6).Abdellatif AG, Preat V, Vamecq J, Nilsson R, Roberfroid M (1990) Peroxisome proliferation and modulation of rat liver carcinogenesis by 2,4-dichlorophe-noxyacetic acid, 2,4,5-trichlorophenoxyacetic acid, perfluorooctanoic acid and nafenopin. Carcinogenesis 11, 1899–902. [DOI] [PubMed] [Google Scholar]
- 7).Rosen MB, Abbott BD, Wolf DC, Corton JC, Wood CR, Schmid JE, Das KP, Zehr RD, Blair ET, Lau C (2008) Gene profiling in the livers of wild-type and PPARalpha-null mice exposed to perfluorooctanoic acid. Toxicol Pathol 36, 592–607. [DOI] [PubMed] [Google Scholar]
- 8).Wolf DC, Moore T, Abbott BD, Rosen MB, Das KP, Zehr RD, Lindstrom AB, Strynar MJ, Lau C (2008) Comparative hepatic effects of perfluorooctanoic acid and WY 14,643 in PPAR-alpha knockout and wild-type mice. Toxicol Pathol 36, 632–9. [DOI] [PubMed] [Google Scholar]
- 9).Hays T, Rusyn I, Burns AM, Kennett MJ, Ward JM, Gonzalez FJ, Peters JM (2005) Role of peroxisome proliferator-activated receptor-alpha (PPARalpha) in bezafibrate-induced hepatocarcinogenesis and cholestasis. Carcinogenesis 26, 219–27. [DOI] [PubMed] [Google Scholar]
- 10).Velayudham LS, Farrell GC (2003) Drug-induced cholestasis. Expert Opin Drug Saf 2, 287–304. [DOI] [PubMed] [Google Scholar]
- 11).Bhat HK, Kanz MF, Campbell GA, Ansari GA (1991) Ninety day toxicity study of chloroacetic acids in rats. Fundam Appl Toxicol 17, 240–53. [DOI] [PubMed] [Google Scholar]
- 12).Luft JH (1961) Improvements in epoxy resin embedding methods. J Biophys Biochem Cytol 9, 409–14. [DOI] [PMC free article] [PubMed] [Google Scholar]
- 13).Reynolds ES (1963) The use of lead citrate at high pH as an electron-opaque stain in electron microscopy. J Cell Biol 17, 208–12. [DOI] [PMC free article] [PubMed] [Google Scholar]
- 14).Ylinen M, Hanhijärvi H, Peura P, Rämö O (1985) Quantitative gas chromatographic determination of perfluorooctanoic acid as the benzyl ester in plasma and urine. Arch Environ Contam Toxicol 14, 713–7. [DOI] [PubMed] [Google Scholar]
- 15).Iwai S, Murai T, Makino S, Min W, Morimura K, Mori S, Hagihara A, Seki S, Fukushima S (2007) High sensitivity of fatty liver Shionogi (FLS) mice to diethylnitrosamine hepatocarcinogenesis: comparison to C3H and C57 mice. Cancer Lett 246, 115–21. [DOI] [PubMed] [Google Scholar]
- 16).Murata M, Kurimoto S, Kawanishi S (2006) Tyrosinedependent oxidative DNA damage induced by carcinogenic tetranitromethane. Chem Res Toxicol 19, 1379–85. [DOI] [PubMed] [Google Scholar]
- 17).Hirosawa M, Minata M, Harada KH, Hitomi T, Krust A, Koizumi A (2008) Ablation of estrogen receptor alpha (ERalpha) prevents upregulation of POMC by leptin and insulin. Biochem Biophys Res Commun 371, 320–3. [DOI] [PubMed] [Google Scholar]
- 18).Wagner M, Halilbasic E, Marschall HU, Zollner G, Fickert P, Langner C, Zatloukal K, Denk H, Trauner M (2005) CAR and PXR agonists stimulate hepatic bile acid and bilirubin detoxification and elimination pathways in mice. Hepatology 42, 420–30. [DOI] [PubMed] [Google Scholar]
- 19).Yang Q, Abedi-Valugerdi M, Xie Y, Zhao XY, Moller G, Nelson BD, DePierre JW (2002) Potent suppression of the adaptive immune response in mice upon dietary exposure to the potent peroxisome proliferator, perfluorooctanoic acid. Int Immunopharmacol 2, 389–97. [DOI] [PubMed] [Google Scholar]
- 20).Fickert P, Fuchsbichler A, Wagner M, Zollner G, Kaser A, Tilg H, Krause R, Lammert F, Langner C, Zatloukal K, Marschall HU, Denk H, Trauner M (2004) Regurgitation of bile acids from leaky bile ducts causes sclerosing cholangitis in Mdr2 (Abcb4) knockout mice. Gastroenterology 127, 261–74. [DOI] [PubMed] [Google Scholar]
- 21).Alrefai WA, Gill RK (2007) Bile acid transporters: structure, function, regulation and pathophysiological implications. Pharm Res 24, 1803–23. [DOI] [PubMed] [Google Scholar]
- 22).Trauner M, Boyer JL (2003) Bile salt transporters: molecular characterization, function, and regulation. Physiol Rev 83, 633–71. [DOI] [PubMed] [Google Scholar]
- 23).Zollner G, Fickert P, Zenz R, Fuchsbichler A, Stumptner C, Kenner L, Ferenci P, Stauber RE, Krejs GJ, Denk H, Zatloukal K, Trauner M (2001) Hepatobiliary transporter expression in percutaneous liver biopsies of patients with cholestatic liver diseases. Hepatology 33, 633–46. [DOI] [PubMed] [Google Scholar]
- 24).Trauner M, Arrese M, Soroka CJ, Ananthanarayanan M, Koeppel TA, Schlosser SF, Suchy FJ, Keppler D, Boyer JL (1997) The rat canalicular conjugate export pump (Mrp2) is down-regulated in intrahepatic and obstructive cholestasis. Gastroenterology 113, 255–64. [DOI] [PubMed] [Google Scholar]
- 25).Cheng X, Klaassen CD (2008) Critical role of PPARalpha in perfluorooctanoic acid- and perfluorodecanoic acid-induced downregulation of Oatp uptake transporters in mouse livers. Toxicol Sci 106, 37–45. [DOI] [PMC free article] [PubMed] [Google Scholar]
- 26).Maher JM, Aleksunes LM, Dieter MZ, Tanaka Y, Peters JM, Manautou JE, Klaassen CD (2008) Nrf2- and PPAR alpha-mediated regulation of hepatic Mrp transporters after exposure to perfluorooctanoic acid and perfluorodecanoic acid. Toxicol Sci 106, 319–28. [DOI] [PMC free article] [PubMed] [Google Scholar]
- 27).Schrenk D, Gant TW, Preisegger KH, Silverman JA, Marino PA, Thorgeirsson SS (1993) Induction of multidrug resistance gene expression during cholestasis in rats and nonhuman primates. Hepatology 17, 854–60. [PubMed] [Google Scholar]
- 28).Rosen MB, Lee JS, Ren H, Vallanat B, Liu J, Waalkes MP, Abbott BD, Lau C, Corton JC (2008) Toxicogenomic dissection of the perfluorooctanoic acid transcript profile in mouse liver: evidence for the involvement of nuclear receptors PPAR alpha and CAR. Toxicol Sci 103, 46–56. [DOI] [PubMed] [Google Scholar]
- 29).Hartmann G, Cheung AK, Piquette-Miller M (2002) Inflammatory cytokines, but not bile acids, regulate expression of murine hepatic anion transporters in endo-toxemia. J Pharmacol Exp Ther 303, 273–81. [DOI] [PubMed] [Google Scholar]
- 30).Green RM, Hoda F, Ward KL (2000) Molecular cloning and characterization of the murine bile salt export pump. Gene 241, 117–23. [DOI] [PubMed] [Google Scholar]
- 31).Lu TT, Makishima M, Repa JJ, Schoonjans K, Kerr TA, Auwerx J, Mangelsdorf DJ (2000) Molecular basis for feedback regulation of bile acid synthesis by nuclear receptors. Mol Cell 6, 507–15. [DOI] [PubMed] [Google Scholar]
- 32).Goodwin B, Jones SA, Price RR, Watson MA, McKee DD, Moore LB, Galardi C, Wilson JG, Lewis MC, Roth ME, Maloney PR, Willson TM, Kliewer SA (2000) A regulatory cascade of the nuclear receptors FXR, SHP-1, and LRH-1 represses bile acid biosynthesis. Mol Cell 6, 517–26. [DOI] [PubMed] [Google Scholar]
- 33).Kok T, Bloks VW, Wolters H, Havinga R, Jansen PL, Staels B, Kuipers F (2003) Peroxisome proliferator-activated receptor alpha (PPARalpha)-mediated regulation of multidrug resistance 2 (Mdr2) expression and function in mice. Biochem J 369, 539–47. [DOI] [PMC free article] [PubMed] [Google Scholar]
- 34).Gonzalez FJ, Shah YM (2008) PPARalpha: mechanism of species differences and hepatocarcinogenesis of peroxisome proliferators. Toxicology 246, 2–8. [DOI] [PubMed] [Google Scholar]