

Abstract
A single-step spectral editing approach using an always-on editing pulse was proposed to enhance the signals of strongly coupled spins. Specifically, a single-step spectral editing sequence with an always-on editing pulse applied at 2.12 ppm was used to enhance glutamine (Gln) and glutathione (GSH) signals at TE = 56 ms on a 7 T scanner. Density matrix simulations demonstrated that the current method (TE = 56 ms) led to large signal enhancement of at least 61% for Gln and 51% for GSH compared to a previous single-step method (TE = 106 ms). Monte Carlo simulations showed that the current method reduced noise-originated variations by 31% for Gln and 26% for GSH compared to a previous three-step spectral editing method from which the present method was derived.
Keywords: glutamate, glutamine, glutathione, spectral editing
Graphical Abstract
INTRODUCTION
Glutamine (Gln), which is predominantly located in astroglia in the brain, is connected to the major excitatory neurotransmitter glutamate (Glu) via the glutamate-glutamine cycle [1]. Abnormal Gln concentrations have been associated with many brain diseases including hepatic encephalopathy, cancer, and several neurodegenerative and psychiatric disorders [1–3]. Glutathione (GSH) is an important antioxidant whose levels are a marker of redox state, which is altered in aging, cancer, and certain neurological and psychiatric disorders [4–7].
In vivo measurement of Gln using magnetic resonance spectroscopy (MRS) is often hampered by its overlap with the dominant Glu signal due to the marked similarity between the resonances of the two molecules. Many MRS techniques are designed to optimally detect Glu while minimizing spectral interference from Gln and other signals [8]. Alternatively, Glu and Gln, collectively referred to as Glx, are measured together without attempting to separate the two [9]. In many clinical studies, two experiments are used to extract Gln: one measures Glx and the other measures Glu [10].
In this context, an MRS technique capable of spectrally resolving Gln from Glu—ideally with a single step—would be a valuable tool for clinical investigation of brain dysfunction and pathophysiology. At 3 T, multi-step, multi-echo techniques have been used to resolve Gln [11, 12]. With the higher spectral resolution of 7 T, Gln H4 protons as well as the Glu and GSH glutamyl H4 protons were observed to form intense pseudo singlets at echo times (TE) of ~100 ms [13]. This phenomenon is the basis for single-step MRS detection of Gln at 7 T because the Gln H4 pseudo singlet at 2.45 ppm is spectrally resolved from the dominant Glu H4 pseudo singlet at 2.35 ppm [13, 14]. At TE of ~100 ms, the Gln pseudo singlet is relatively weak [13, 14], and the in vivo Gln/Glu peak amplitude ratio is only 0.13 ± 0.02 at TE of 106 ms in healthy subjects [14]. This low signal intensity of Gln makes it difficult to accurately quantify Gln, especially in brain disorders where Gln is expected to be lower [15, 16].
We recently developed a three-step spectral editing technique (hereafter referred to as the ‘multi-edit’ method) to measure Glu, Gln, GSH, and γ-aminobutyric acid (GABA) at 7 T [17]. This previous study observed a novel phenomenon; specifically, at the presence of an editing pulse placed at 2.12 ppm, the H4 protons of Glu, Gln, and the glutamyl moiety of GSH all formed intense pseudo singlets at TE = 56 ms, thus allowing spectral resolution of Glu, Gln, and GSH. Building on this work, we sought to convert the multi-edit method into a single-step method and use it to reliably measure Gln and GSH. Density matrix simulations were further used to quantitatively compare this single-step method with the previous single-step method at TE = 106 ms [14] to evaluate signal enhancements of Gln and GSH with and without considering T2 decay. Using Monte Carlo analysis, we also compared this method with the multi-edit method.
METHODS
Pulse Sequence
As shown in Figure 1, the first component of the pulse sequence was the water suppression block, which contained eight variable power RF pulses with optimized relaxation delays (VAPOR). Each pulse was a 12-ms sinc-Gauss pulse with a bandwidth of ~ 240 Hz. The main component of the pulse sequence was a point resolved spectroscopy sequence (PRESS) with an editing RF pulse between the two 180° refocusing pulses. The excitation pulse was an amplitude-modulated pulse with duration = 4.5 ms and bandwidth = 3.1 kHz, and the 180° refocusing pulses were also amplitude-modulated with duration = 8.0 ms and bandwidth = 2.0 kHz [18]. The editing RF pulse was a truncated Gaussian pulse with a duration of 10 ms [17]. The pulse sequence parameters were repetition time (TR) = 2.2 s, TE = 56 ms, TE1 = 40 ms, editing pulse time delay Td = 15.3 ms, editing pulse frequency = 2.12 ppm, editing pulse flip angle = 180°, spectral width = 4000 Hz, and number of data points = 1024.
FIGURE 1.

Schematic diagram of the pulse sequence. TR = 2.2 s; TE = 56 ms; TE1 = 40 ms; Td = 15.3 ms; editing pulse frequency = 2.12 ppm; editing pulse flip angle = 180°; spectral width = 4000 Hz; and number of data points = 1024.
Comparison of Numerically Computed Spectra
The basis functions of Glu, Gln, and GSH for the previous pulse sequence with TE = 106 ms [14] and the proposed pulse sequence with TE = 56 ms were numerically computed using full density matrix calculations with high spatial digitization [19, 20]. First, with T2 relaxation being ignored, the spectra of Glu, Gln, and GSH for the two different pulse sequences were simulated and compared. Then, the T2 relaxation factors for TE = 106 and 56 ms were respectively multiplied to the two sets of simulated spectra to generate two new sets of spectra. For a conservative evaluation of signal enhancement, the T2 of all three metabolites was set to that of Glu, which was 184 ms [25].
In Vivo 1H MRS Experiments
Eight healthy volunteers (three females, five males; age = 34 ± 11 years) were recruited for the study. All volunteers gave informed consent in accordance with procedures approved by our local institutional review board. Experiments were performed on a Siemens Magnetom 7 T scanner equipped with a 32-channel receiver head coil. T1-weighted magnetization prepared rapid gradient echo (MPRAGE) images were acquired with TR = 3 s, TE = 3.9 ms, matrix = 256 × 256 × 256, and resolution = 1 × 1 × 1 mm3 to position the MRS voxel with a size of 3.5 × 1.8 × 2 cm3 in the dorsal anterior cingulate cortex (dACC) of the volunteers. To compute within-subject coefficient of variation (CV) values for each participant, the same MRS measurement was performed twice during the same exam using the same voxel prescription. The first- and second-order B0 shimming coefficients were adjusted before each measurement, achieving water linewidths of 12 ± 1 Hz. For each MRS scan, the number of averages was 132 and the total scan time was five minutes.
The 32-channel free induction decay (FID) data were combined into single-channel FIDs using the generalized least square (GLS) method [21], in which coil sensitivities were computed from the unsuppressed water signals acquired with two averages. The unsuppressed water signals were also used to correct for the phase errors in the combined single-channel FIDs caused by zero-order eddy currents [22]. These FIDs were Fourier transformed into the frequency domain to obtain spectra for all 132 data averages. Bloch-Siegert phase shift in each individual spectrum due to the use of the single editing pulse was corrected by multiplying each individual spectrum with the complex-conjugate of the corresponding Bloch-Siegert phasor function computed using density matrix simulations [20]. The frequency deviation and zero-order phase in each individual spectrum were determined and corrected by fitting the creatine and choline peaks with two Voigt curves [20]. Meanwhile, a histogram of the frequency deviations, which was a distribution of the frequency deviations at 1 Hz intervals for all 132 acquisitions, was generated for later use. The 132 individual spectra were then summed to give the reconstructed spectrum. This spectrum was fitted in the range of 1.8 – 3.7 ppm by linear combination of numerically computed basis spectra of acetate, acetate moiety of N-acetyl-aspartate (NAA CH3), aspartate moiety of NAA (NAA CH2), N-acetylaspartylglutamate (NAAG), GABA, Glu, Gln, GSH, aspartate, total creatine (tCr, 1/2 creatine and 1/2 phosphocreatine [23]), glycerophosphocholine + phosphocholine (GPC + PC, 2/3 GPC and 1/3 PC [23]), phosphoethanolamine (PE), myo-inositol (mI), taurine (Tau), scyllo-inositol, and glycine, as well as a cubic spline baseline. Because the resonance signals downfield from 3.9 ppm were partially suppressed by the water suppression pulses, the upper limit of the fitting range was set to 3.7 ppm, which covered the PE resonance signals at 3.22 ppm but not those at 3.98 ppm. Hence, PE was constrained to 2 [GPC + PC] [13, 24]. The fitting program was developed in-house and was based on the Levenberg-Marquardt least square minimization algorithm. Basis spectra for 31 frequency deviation values ranging from −15 Hz to 15 Hz at 1 Hz intervals were computed. The basis spectra used in the fitting were computed as the average of the basis spectra corresponding to 31 frequency deviation values where the experimentally measured histogram was used as the weighting function [20].
Comparison of the Multi-Edit and Single-Step Methods at 56 ms TE
Monte Carlo analysis was used to evaluate whether the proposed 56 ms TE single-step spectral editing method was more precise in quantifying Glu, Gln, and GSH than the multi-edit method, as in vivo measurement of precision may be affected by external factors (e.g., subject movement). To simulate multi-edit MRS data, the concentrations, linewidths, and the lineshape of 16 metabolite resonance signals obtained in vivo [17] were used to combine the basis functions of the 16 metabolites to generate noise-free FIDs. These FIDs were Fourier transformed into the frequency domain to obtain the three noise-free multi-edit spectra corresponding to editing OFF, editing ON at 1.89 ppm, and editing ON at 2.12 ppm. The third spectrum with editing ON at 2.12 ppm was also used as the ground-truth spectrum for the proposed method. For the multi-edit method, uncorrelated Gaussian noise was added to each of the three ground-truth spectra where the noise level was set to be the same as that of the in vivo spectra. For the proposed method, Gaussian noise was added to the single ground-truth spectrum, for which the noise level was set to be that of the in vivo spectra because the number of averages for the proposed method was three times that of the multi-edit method in the same amount of scan time. The fitting routines for the multi-edit method and the proposed single-step method were used respectively to quantify the corresponding simulated spectra. This whole simulation process was repeated 300 times, and each repetition used a different realization of the random noise. After all the repetitions were finished, CVs of the metabolite concentrations were computed for both methods. F-tests were performed to see if the two methods gave significantly different variances in metabolite concentration values.
RESULTS
Numerically computed spectra of Glu, Gln, and GSH for the previous method with TE = 106 ms and the proposed method with TE = 56 ms are displayed in Figure 2. In the simulation, the three metabolites had equal concentrations. All spectra were broadened to a singlet linewidth of 9 Hz. T2 relaxation was ignored when computing the two spectra in Figure 2a. The peak amplitude ratios between TE = 56 ms and 106 ms were found to be 0.70 for Glu, 1.23 for Gln, and 1.15 for GSH. The two spectra in Figure 2b were computed with T2 relaxation considered. The peak amplitude ratios between TE = 56 ms and 106 ms were found to be 0.92 for Glu, 1.61 for Gln, and 1.51 for GSH. Therefore, compared to the previous single-step method, the proposed single-step method resulted in large signal enhancements of 61% for Gln and 51% for GSH, and a slight signal reduction of 8% for Glu. The large enhancements in Gln and GSH peak amplitudes will lead to higher sensitivities for detecting Gln and GSH signals and lower noise-originated variability in Gln and GSH quantification.
FIGURE 2.
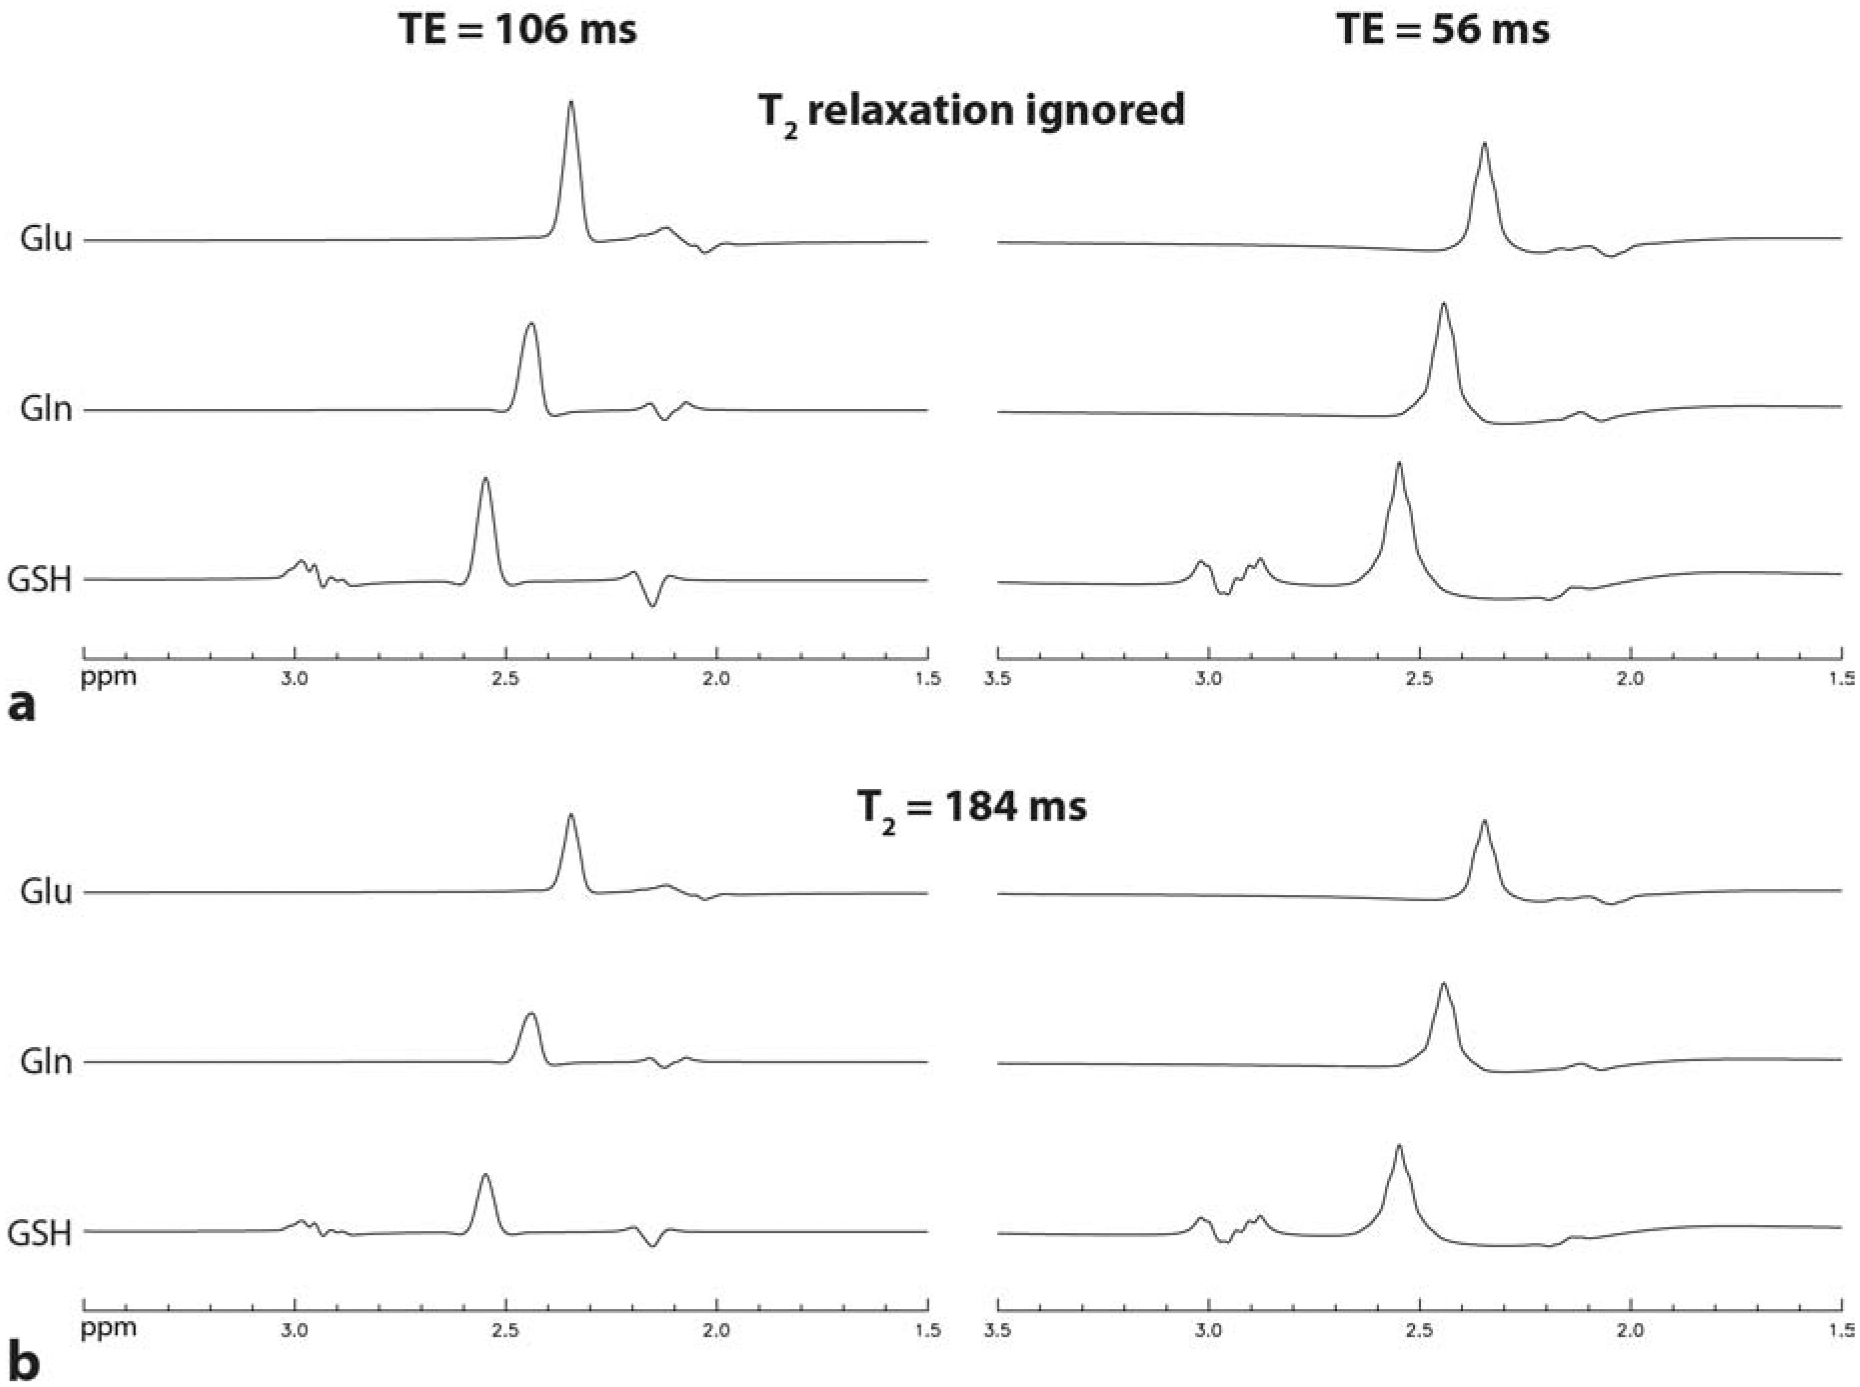
Numerically simulated spectra of Glu, Gln, and GSH at TE = 106 ms and 56 ms. The three metabolites had equal concentrations. All spectra were broadened to a singlet linewidth of 9 Hz. a. T2 relaxation was ignored. The peak amplitude ratios between TE = 56 ms and 106 ms were 0.70 for Glu, 1.23 for Gln, and 1.15 for GSH. b. T2 relaxation was considered using the same T2 of 184 ms for the three metabolites. The peak amplitude ratios between TE = 56 ms and 106 ms were 0.92 for Glu, 1.61 for Gln, and 1.51 for GSH.
Figure 3 displays all 16 proton-only spectra from the dACC of eight healthy volunteers. The peak amplitudes of Glu, Gln, and GSH were obtained from the fitted spectrum of each individual metabolite. The Gln/Glu and GSH/Glu peak amplitude ratios were 0.23 ± 0.04 and 0.25 ± 0.03, respectively. These ratios are substantially higher than the corresponding ratios of 0.13 ± 0.02 and 0.13 ± 0.01 found in the previous single-step spectral editing study using TE = 106 ms [14]. A larger Gln/Glu ratio is important in practice for quantification of Gln because of the more intense Glu and its close proximity to the much weaker Gln. One pair of spectra and corresponding fits from the dACC of one healthy volunteer are displayed in Figure 4. The fitted Gln peak is much higher than the combined Gln/NAA peak in the in vivo spectrum because the combined Gln/NAA peak is pulled down by the negative peak at ~2.5 ppm originating from the aspartyl moiety of NAA. Because of the 180° editing pulse applied at 2.12 ppm and the corresponding bipolar crusher gradients, the baseline signals near 2.12 ppm were greatly suppressed and thus the fitted baseline was very flat in that region. Metabolite ratios (/[tCr]) measured from the eight healthy volunteers agreed well with results from previous studies [13, 14, 17] (see Table 1). The within-subject CVs for Gln and GSH were 5.4% and 7.1%, respectively; these values are very small in spite of the low concentration of these two metabolites. The within-subject CVs were significantly smaller than the between-subject CVs for all the metabolites listed in Table 1. Scatter plots of measurement 1 vs measurement 2 for Glu/tCr, Gln/tCr, and GSH/tCr from the eight subjects are displayed in Figure 5. All three scatter plots showed strong correlation between the two measurements, indicating high repeatability.
FIGURE 3.

Spectra from the dorsal anterior cingulate cortex (dACC) of eight healthy volunteers. The same voxel in each subject was scanned twice. Voxel size = 3.5 × 1.8 × 2 cm3; TR = 2.2 s; number of averages = 132; number of prescans = 2; number of water acquisitions = 2; and total scan time = 5 min.
FIGURE 4.

Spectra and corresponding fits from a 3.5 × 1.8 × 2 cm3 voxel in the dorsal anterior cingulate cortex (dACC) of a healthy volunteer.
Table 1.
Metabolite ratios (/[tCr]) in the dACC of eight healthy volunteers. The same voxel in each subject was scanned twice.
| Concentration (/rtCrl) | Within-subject CV (%) | Between-subject CV (%) | |
|---|---|---|---|
| NAA (CH3) | 1.45 ± 0.15 | 2.8 | 15 |
| NAA (CH2) | 1.30 ± 0.19 | 2.8 | 21 |
| Glu | 1.26 ± 0.10 | 2.1 | 11 |
| Gln | 0.26 ± 0.06 | 5.4 | 32 |
| GSH | 0.27 ± 0.05 | 7.1 | 24 |
| GPC + PC | 0.26 ± 0.02 | 1.6 | 13 |
| mI | 0.71 ± 0.05 | 1.7 | 9.1 |
Abbreviations: tCr: total creatine; dACC: dorsal anterior cingulate cortex; CV: coefficient of variation; NAA: N-acetyl-aspartate; Glu: glutamate; Gln: glutamine; GSH: glutathione; GPC: glycerophosphocholine; PC: phosphocholine; mI: myo-inositol.
FIGURE 5.
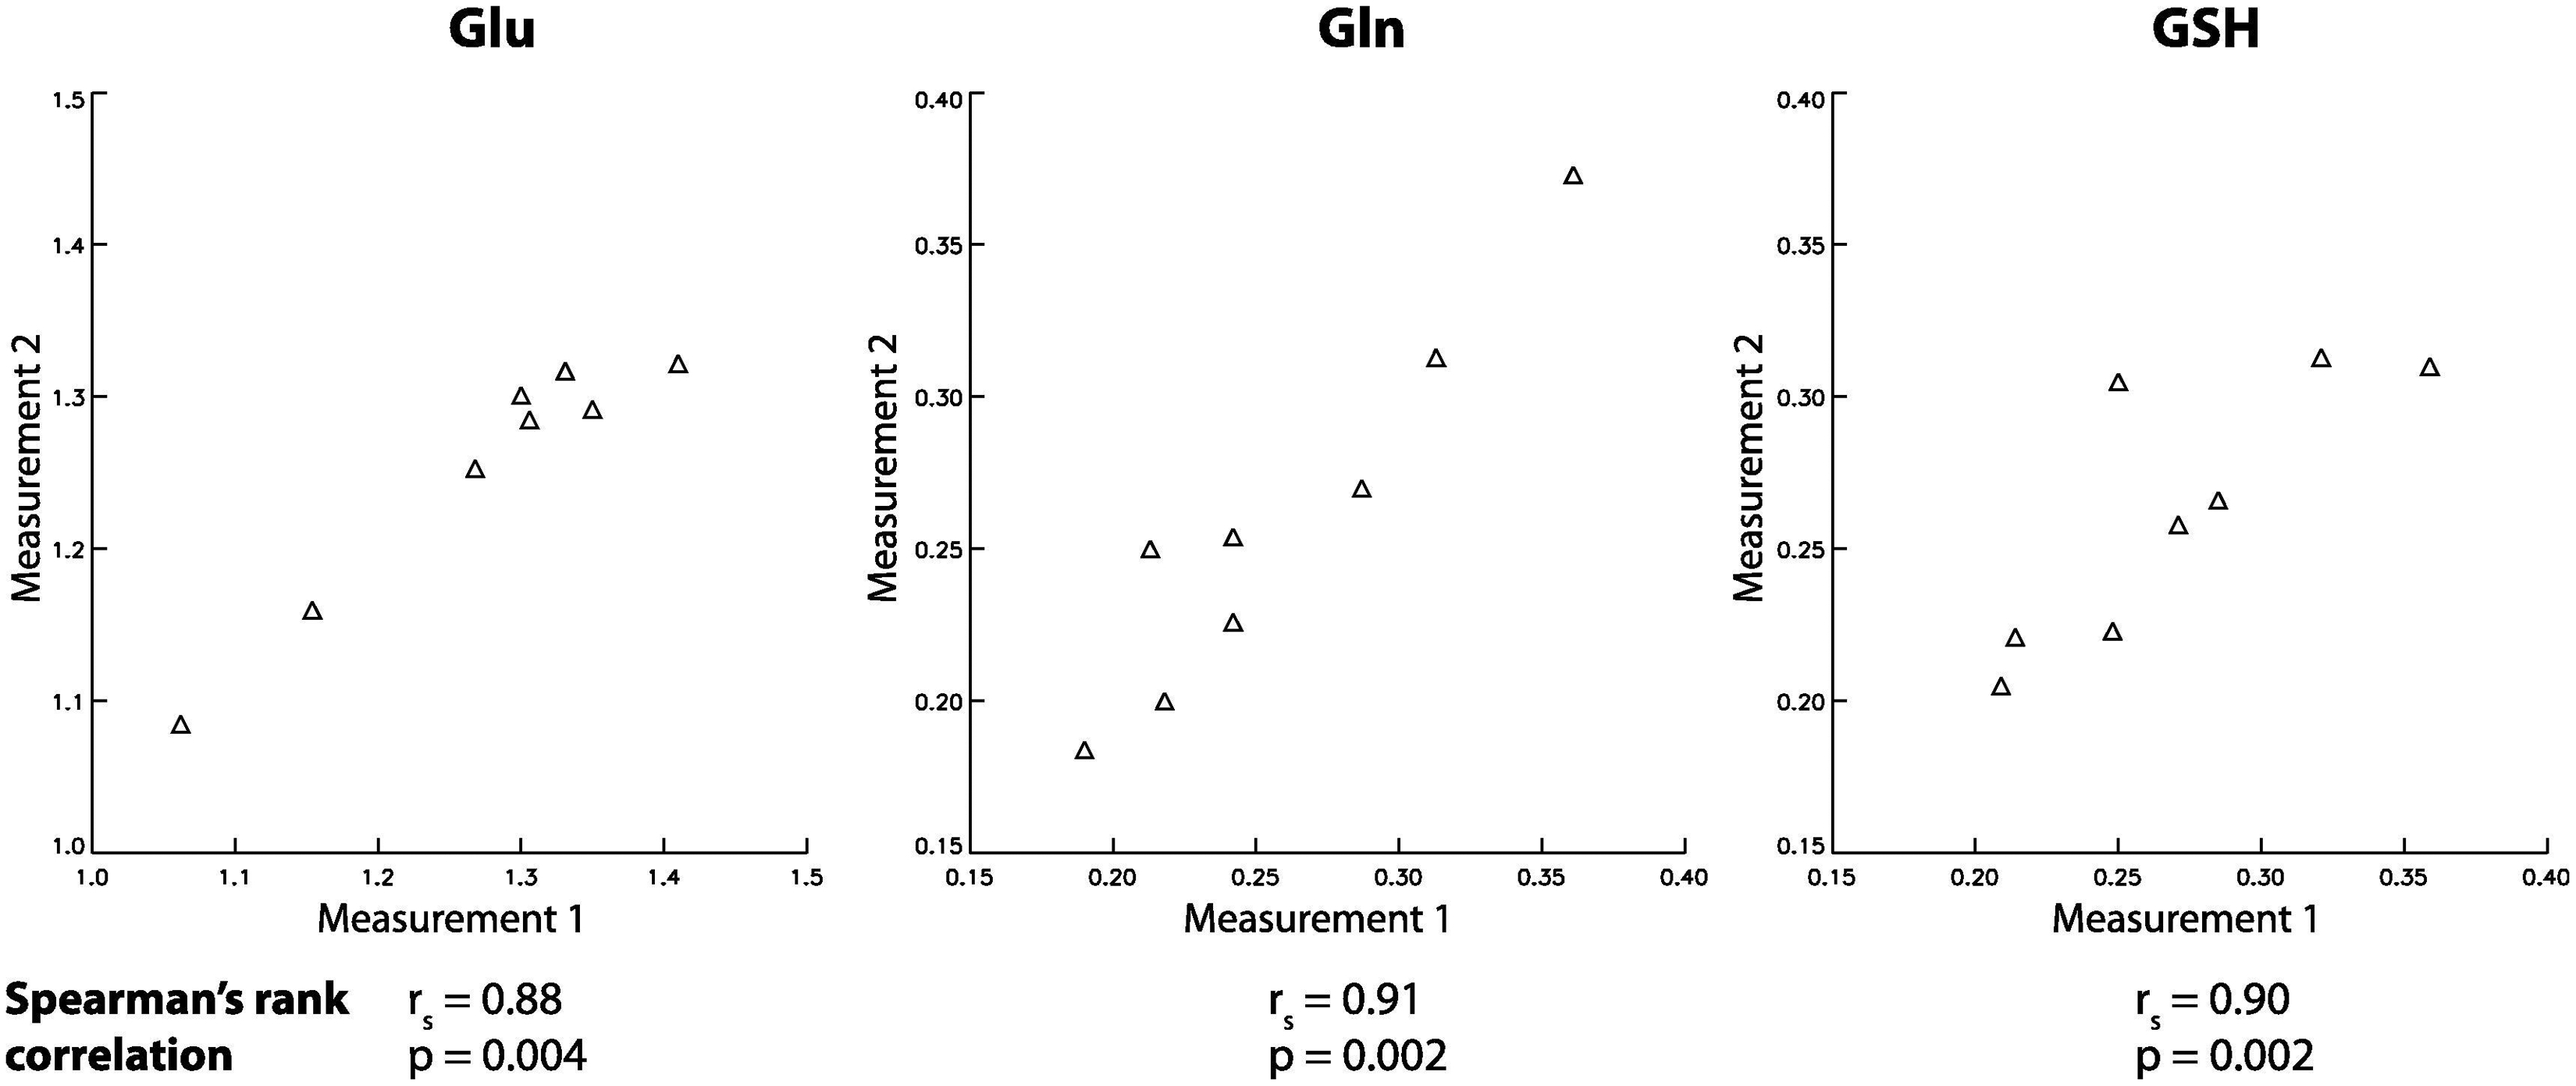
Scatter plots of measurement 1 vs measurement 2 for Glu/tCr, Gln/tCr, and GSH/tCr from the eight subjects.
Simulation results of the intrinsic precision of metabolite quantifications using the multi-edit and proposed single-step methods are given in Table 2. The noise-originated CV values of Glu, Gln, and GSH concentrations using the multi-edit method were 0.95%, 3.67%, and 3.25%, respectively. Using the proposed single-step method, the noise-originated CV values for Glu, Gln, and GSH concentrations were significantly (F-test, p < 0.01) reduced to 0.76%, 2.53%, and 2.39%, respectively. Thus, the proposed single-step method reduced intrinsic variation by 20% for Glu, 31% for Gln, and 26% for GSH compared to the multi-edit method.
Table 2.
Comparison of metabolite quantification precisions between the multi-edit method and the proposed single-step spectral editing method by Monte Carlo analysis. Simulated MRS data were added with random noise and then quantified by spectral fitting. This simulation was repeated 300 times to compute the noise-originated CVs of the metabolite concentrations and F-tests were performed to evaluate if the two methods gave significantly different variances in metabolite concentration values.
| CV (%) multi-edit | CV (%) single-step edit | Significantly different (p < 0.01) | |
|---|---|---|---|
| NAA (CH3) | 0.30 | 0.71 | Yes |
| NAA (CH2) | 1.02 | 1.28 | Yes |
| GABA | 7.21 | 19.84 | Yes |
| Glu | 0.95 | 0.76 | Yes |
| Gln | 3.67 | 2.53 | Yes |
| GSH | 3.25 | 2.39 | Yes |
| tCr | 0.37 | 0.54 | Yes |
| GPC + PC | 0.43 | 0.48 | No |
| mI | 0.82 | 0.90 | No |
Abbreviations: CV: coefficient of variation; NAA: N-acetyl-aspartate; GABA: γ-aminobutyric acid; Glu: glutamate; Gln: glutamine; GSH: glutathione; tCr: total creatine; GPC: glycerophosphocholine; PC: phosphocholine; mI: myo-inositol.
DISCUSSION
Here, we demonstrated the efficacy of a single-step spectral editing method to enhance Gln and GSH signals at 7 T with TE = 56 ms. For in vivo MRS, subtraction-based two-step spectral editing techniques are widely used to detect low concentration metabolites whose resonance signals overlap with signals from metabolites with higher concentrations; the purpose of applying the editing pulse is to induce signal changes on the metabolite of interest between the ON and OFF acquisitions while keeping the overlapping signals unchanged. Our laboratory previously developed a single-step spectral editing method with TE = 106 ms that used the editing pulse in a different way [14]. The editing pulse was not used to induce signal changes between editing ON and OFF acquisitions for generating the difference spectrum. Instead, the editing pulse was used to suppress spectral interference from the aspartyl CH2 signal of NAA at 2.5 ppm to the H4 resonance signals of Gln and GSH. In contrast, the editing pulse in the current method is used differently from the previous single-step method with TE = 106 ms. Instead of suppressing unwanted signals, the editing pulse here was used to induce formation of pseudo singlets of strongly coupled spins at a medium TE. Specifically, the editing pulse targeted the H3 protons of Glu, Gln, and the glutamyl moiety of GSH near 2.12 ppm to alter the J-evolution of the corresponding H4 resonance signals such that they formed sharp and intense pseudo singlet peaks at TE = 56 ms. Without using an editing pulse, Glu, Gln, and GSH form intense pseudo singlet peaks at a much longer TE of 100 – 110 ms through free evolution of the strongly coupled spins but cannot form intense pseudo singlet peaks at shorter TE values [14].
The current technique is based on the multi-edit technique [17], which used a three-step spectral editing approach to measure Glu, Gln, GABA, and GSH. In the multi-edit pulse sequence, the editing RF pulse was set to OFF, ON at 1.89 ppm, and ON at 2.12 ppm. The first two editing steps mainly provided information for measuring GABA and the NAA singlet signals. Most of the Glu, Gln, and GSH signals came from the third editing step where the editing pulse was applied at 2.12 ppm. Because of only using the third step of multi-edit, the current technique compromised the ability to measure NAA and GABA. This tradeoff is worthwhile for many applications because this single-step method reduced intrinsic variation by 20% for Glu, 31% for Gln, and 26% for GSH compared to the multi-edit method as shown in Table 2. If the three-step method were used, a 31% reduction of variation for Gln would have required a 72% increase in scan time, which is not preferable in many MRS studies. Historically, accurate assessment of Gln in vivo has been fraught with technical challenges because of its much lower concentration, similar spin network, and proximity to Glu. Many studies only reported Glx. The signal enhancements of Gln and Glu achieved by this single-step editing method hold considerable promise for better characterizing glutamatergic abnormalities in clinical studies of brain disorders. In addition, the signal enhancement of Gln is especially helpful for measuring 13C labeling of Gln [14] because the absolute signal change of Gln due to 13C label incorporation into its carbon skeleton is much smaller than that of Glu. Although the idea of applying the editing pulse at 2.12 ppm came from the multi-edit technique, the current single-step technique represents a more general and applicable spectral editing approach, in which an always-on editing pulse is used to enhance the signals of strongly coupled spins. From the post-processing perspective, the spectral fitting algorithm used by multi-edit to simultaneously fit the three spectra of different editing settings is hard to implement and not supported by widely used MRS post-processing software packages. In contrast, most MRS data fitting software packages can be readily modified to process data acquired using the current single-step technique since its data are similar to regular MRS data.
When the Gln and GSH spectra were numerically simulated, the T2 values of Gln and GSH were conservatively set to be the same as that of Glu due to the lack of accurate in vivo Gln and GSH T2 data. The true in vivo T2 of the electrically neutral Gln is expected to be shorter than that of the negatively charged Glu [25]. GSH should also have shorter T2 than Glu because the T1 of GSH is short [25, 26] and molecules with molecular weights similar to GSH correlate positively between T1 and T2 [27]. Therefore, the true in vivo signal enhancements for Gln and GSH due to the use of a shorter TE of 56 ms are expected to be greater than the ratios given by these numerical simulations shown in Figure 2b. This is supported by the larger increase in peak amplitude ratios for Gln/Glu (from 0.13 ± 0.02 to 0.23 ± 0.04) and GSH/Glu (from 0.13 ± 0.01 to 0.25 ± 0.03) observed in vivo when comparing the current single-step method (TE = 56 ms) with the previous single-step method (TE = 106 ms).
CONCLUSIONS
A single-step spectral editing approach using an always-on editing pulse was proposed to enhance the signals of strongly coupled spins. Specifically, a single-step spectral editing sequence with an always-on editing pulse applied at 2.12 ppm was used to enhance glutamine (Gln) and glutathione (GSH) signals at TE = 56 ms on a 7 T scanner. Density matrix simulations demonstrated that the current method led to large signal enhancement of at least 61% for Gln and 51% for GSH compared to a previous single-step method with TE = 106 ms. In vivo spectra acquired from healthy participants showed that the Gln/Glu and GSH/Glu peak amplitude ratios increased from 0.13 ± 0.02 and 0.13 ± 0.01 for the previous single-step method (TE = 106 ms) to 0.23 ± 0.04 and 0.25 ± 0.03 for the current method, respectively. Monte Carlo simulations showed that the proposed method reduced intrinsic variation by 31% for Gln and 26% for GSH compared to the previous three-step editing method. The in vivo within-subject CV for Gln and GSH had very low values of 5.4% and 7.1%, respectively. Although the present study was conducted at 7 T, it is also possible to use RF pulses to induce formation of pseudo singlets at other field strengths such as 3 T.
Single-step spectral editing for enhancing glutamine and glutathione signals at 7 T
By applying an editing pulse at 2.12 ppm targeting the H3 protons of Glu, Gln, and the glutamyl moiety of GSH, the corresponding H4 protons form sharp and intense pseudo peaks at TE = 56 ms.
Signal enhancement of at least 61% for Gln and 51% for GSH compared to a previous single-step method with TE = 106 ms
ACKNOWLEDGEMENTS
Ioline Henter provided invaluable editorial assistance.
Footnotes
Publisher's Disclaimer: This is a PDF file of an unedited manuscript that has been accepted for publication. As a service to our customers we are providing this early version of the manuscript. The manuscript will undergo copyediting, typesetting, and review of the resulting proof before it is published in its final form. Please note that during the production process errors may be discovered which could affect the content, and all legal disclaimers that apply to the journal pertain.
DECLARATION OF INTEREST
This work was supported by the Intramural Research Program, National Institute of Mental Health, National Institutes of Health. The authors have no conflict of interest to disclose, financial or otherwise.
REFERENCES
- [1].Erecinska M, Silver IA, Metabolism and role of glutamate in mammalian brain, Prog Neurobiol, 35 (1990) 245–296. [DOI] [PubMed] [Google Scholar]
- [2].Chavarria L, Cordoba J, Magnetic resonance imaging and spectroscopy in hepatic encephalopathy, J Clin Exp Hepatol, 5 (2015) S69–74. [DOI] [PMC free article] [PubMed] [Google Scholar]
- [3].Natarajan SK, Venneti S, Glutamine Metabolism in Brain Tumors, Cancers, 11 (2019). [DOI] [PMC free article] [PubMed] [Google Scholar]
- [4].Crisi G, H-1 MR Spectroscopy of Meningiomas at 3.0T: the Role of Glutamate-Glutamine Complex and Glutathione, Neuroradiol J, 24 (2011) 846–853. [DOI] [PubMed] [Google Scholar]
- [5].Dringen R, Brandmann M, Hohnholt MC, Blumrich EM, Glutathione-Dependent Detoxification Processes in Astrocytes, Neurochemical Research, 40 (2015) 2570–2582. [DOI] [PubMed] [Google Scholar]
- [6].Harris JL, Choi IY, Brooks WM, Probing astrocyte metabolism in vivo: proton magnetic resonance spectroscopy in the injured and aging brain, Front Aging Neurosci, 7 (2015). [DOI] [PMC free article] [PubMed] [Google Scholar]
- [7].Das TK, Javadzadeh A, Dey A, Sabesan P, Theberge J, Radua J, Palaniyappan L, Antioxidant defense in schizophrenia and bipolar disorder: A meta-analysis of MRS studies of anterior cingulate glutathione, Prog Neuro-Psychoph, 91 (2019) 94–102. [DOI] [PubMed] [Google Scholar]
- [8].Hurd R, Sailasuta N, Srinivasan R, Vigneron DB, Pelletier D, Nelson SJ, Measurement of brain glutamate using TE-averaged PRESS at 3T, Magnetic Resonance in Medicine, 51 (2004) 435–440. [DOI] [PubMed] [Google Scholar]
- [9].Padowski JM, Weaver KE, Richards TL, Laurino MY, Samii A, Aylward EH, Conley KE, Neurochemical Correlates of Caudate Atrophy in Huntington’s Disease, Movement Disorders, 29 (2014) 327–335. [DOI] [PMC free article] [PubMed] [Google Scholar]
- [10].Salvadore G, van der Veen JW, Zhang Y, Marenco S, Machado-Vieira R, Baumann J, Ibrahim LA, Luckenbaugh DA, Shen J, Drevets WC, Zarate CA, An investigation of amino-acid neurotransmitters as potential predictors of clinical improvement to ketamine in depression, Int J Neuropsychoph, 15 (2012) 1063–1072. [DOI] [PMC free article] [PubMed] [Google Scholar]
- [11].Yue K, Chang L, Ernst T, Enhancing glutamine signals in TE‐averaged PRESS spectra, in: Proceedings of the 13th Annual Meeting of ISMRM, Miami Beach, Florida, USA, 2005, pp. 2497. [Google Scholar]
- [12].Zhang Y, Shen J, Simultaneous Quantification of Glutamate and Glutamine by J-modulated Spectroscopy at 3 Tesla, Magnetic Resonance in Medicine, 76 (2016) 725–732. [DOI] [PMC free article] [PubMed] [Google Scholar]
- [13].Choi CH, Dimitrov IE, Douglas D, Patel A, Kaiser LG, Amezcua CA, Maher EA, Improvement of resolution for brain coupled metabolites by optimized H-1 MRS at 7 T, Nmr in Biomedicine, 23 (2010) 1044–1052. [DOI] [PubMed] [Google Scholar]
- [14].An L, Li S, Murdoch JB, Araneta MF, Johnson C, Shen J, Detection of glutamate, glutamine, and glutathione by radiofrequency suppression and echo time optimization at 7 tesla, Magnetic Resonance in Medicine, 73 (2015) 451–458. [DOI] [PubMed] [Google Scholar]
- [15].Danielsen ER, Elberling TV, Rasmussen AK, Dock J, Hording M, Perrild H, Waldemar G, Feldt-Rasmussen U, Thomsen C, Reduced parietooccipital white matter glutamine measured by proton magnetic resonance Spectroscopy in treated Graves’ disease patients, J Clin Endocr Metab, 93 (2008) 3192–3198. [DOI] [PubMed] [Google Scholar]
- [16].Yuksel C, Ongur D, Magnetic Resonance Spectroscopy Studies of Glutamate-Related Abnormalities in Mood Disorders, Biological Psychiatry, 68 (2010) 785–794. [DOI] [PMC free article] [PubMed] [Google Scholar]
- [17].An L, Araneta MF, Johnson C, Shen J, Simultaneous measurement of glutamate, glutamine, GABA, and glutathione by spectral editing without subtraction, Magn Reson Med, 80 (2018) 1776–1786. [DOI] [PMC free article] [PubMed] [Google Scholar]
- [18].Murdoch JB, Lent AH, Kritzer MR, Computer-Optimized Narrow-Band Pulses for Multislice Imaging, Journal of Magnetic Resonance, 74 (1987) 226–263. [Google Scholar]
- [19].Zhang Y, An L, Shen J, Fast computation of full density matrix of multispin systems for spatially localized in vivo magnetic resonance spectroscopy, Medical Physics, 44 (2017) 4169–4178. [DOI] [PMC free article] [PubMed] [Google Scholar]
- [20].An L, Araneta MF, Johnson C, Shen J, Effects of carrier frequency mismatch on frequency-selective spectral editing, MAGMA, (2018). [DOI] [PMC free article] [PubMed] [Google Scholar]
- [21].An L, van der Veen JW, Li SZ, Thomasson DM, Shen J, Combination of multichannel single-voxel MRS signals using generalized least squares, Journal of Magnetic Resonance Imaging, 37 (2013) 1445–1450. [DOI] [PMC free article] [PubMed] [Google Scholar]
- [22].Klose U, Invivo Proton Spectroscopy in Presence of Eddy Currents, Magnetic Resonance in Medicine, 14 (1990) 26–30. [DOI] [PubMed] [Google Scholar]
- [23].de Graaf RA, in vivo NMR Spectroscopy - Principles and Techniques, Second Edition ed., John Wiley & Sons Ltd, West Sussex, England, 2007. [Google Scholar]
- [24].Tkac I, Oz G, Adriany G, Ugurbil K, Gruetter R, In Vivo H-1 NMR Spectroscopy of the Human Brain at High Magnetic Fields: Metabolite Quantification at 4T vs. 7T, Magnetic Resonance in Medicine, 62 (2009) 868–879. [DOI] [PMC free article] [PubMed] [Google Scholar]
- [25].An L, Li S, Shen J, Simultaneous determination of metabolite concentrations, T1 and T2 relaxation times, Magn Reson Med, 78 (2017) 2072–2081. [DOI] [PMC free article] [PubMed] [Google Scholar]
- [26].Choi IY, Lee P, Doubly selective multiple quantum chemical shift imaging and T-1 relaxation time measurement of glutathione (GSH) in the human brain in vivo, Nmr in Biomedicine, 26 (2013) 28–34. [DOI] [PMC free article] [PubMed] [Google Scholar]
- [27].Gunther H, NMR Spectroscopy: Basic Principles, Concepts, and Applications in Chemistry, Second Edition ed., John Wiley & Sons Ltd, Chichester, U.K., 1992. [Google Scholar]