Abstract
Pancreatic cancer remains a major health problem, and only less than 20% of patients have resectable disease at the time of initial diagnosis. Systemic chemotherapy is often used in the patients with borderline resectable, locally advanced unresectable disease and metastatic disease. CT is often used to assess for therapeutic response; however, conventional imaging including CT may not correctly reflect treatment response after chemotherapy. Dual-energy (DE) CT can acquire datasets at two different photon spectra in a single CT acquisition, and permits separating materials and extract iodine by applying a material decomposition algorithm. Quantitative iodine mapping may have an added value over conventional CT imaging for monitoring the treatment effects in patients with pancreatic cancer and potentially serve as a unique biomarker for treatment response. In this pictorial essay, we will review the technique for iodine quantification of pancreatic cancer by DECT and discuss our observations of iodine quantification at baseline and after systemic chemotherapy with conventional cytotoxic agents, and illustrate example cases.
Keywords: Pancreatic adenocarcinoma, Dual-energy CT, Chemotherapy, Iodine uptake, Treatment response
Pancreatic cancer remains a major health problem, representing the fourth leading cause of cancer-related death in men and women in the United States in 2012 [1]. In contrast to declining trends for the major cancers and the steady increase in survival for most cancers, death rates rose in both sexes for pancreatic cancers from 2003 to 2012, and the 5-year relative survival remains low, currently 8% from 2005 to 2011 [1]. Early detection and surgical resection remains the only potential cure for pancreatic cancer. However, only less than 20% of patients have resectable disease at the time of initial diagnosis [2], and 45% of patients with overtly metastatic disease [2, 3]. Remaining 30 to 40% of patients are affected by a locally advanced cancer at the time of the initial diagnosis [2–4] due to solid tumor contact with the superior mesenteric artery or celiac axis over greater than 180 of the vessel circumference, or aortic invasion or encasement, or unreconstructible superior mesenteric vein or portal vein tumor involvement or occlusion [1, 5]. Systemic chemotherapy is often used in the management of locally advanced unresectable and metastatic pancreatic cancer [6]. Approximately 20% of patients have borderline resectable tumor, and those patients often receive neoadjuvant therapy to achieve downstage tumors and to convert resectable disease [4, 7].
To evaluate treatment response to systemic chemotherapy, we evaluated iodine quantification in advanced pancreatic cancer using dual-energy computed tomography (DECT) in addition to conventional markers including change in tumor size (RECIST diameter and volume) as well as carbohydrate antigen 19–9 (CA19–9) values. In this pictorial essay, we will review the technique of iodine quantification of pancreatic cancer by DECT, and discuss our observations of iodine uptake by pancreatic cancer at baseline and at follow-up after systemic chemotherapy with conventional cytotoxic agents and illustrate example cases. We also briefly review limitations of conventional CT to monitor treatment response of pancreatic cancer to chemotherapy and factors that need to be considered for the use of this technique.
Limitations of conventional CT imaging for monitor treatment response
Multidetector CT is the primary modality of choice in the preoperative diagnosis and the initial staging of pancreatic cancer [8–11] and helps to determine treatment planning. A dedicated pancreatic protocol CT maximizes the contrast differences between various tissues during the pancreatic and portovenous phases and improves the sensitivity for detecting vascular invasion and liver metastases [9–11].
CT is also often used to evaluate treatment response [11]. However, for evaluation of treatment response, CT and other current conventional anatomical imaging modalities have limitations. It has been reported that post-neoadjuvant chemotherapy and/or chemoradiation therapy CT often underestimates the disease response. Katz et al. reported that among 129 patients with borderline resectable pancreatic adenocarcinoma underwent gemcitabine-based neoadjuvant chemotherapy and/or chemoradiation therapy; post-treatment CT demonstrated stable disease (69%) or partial response (12%) according to RECIST criteria, and only 1 patient (0.8%) was downstaged to resectable disease [7]. Despite persistent borderline resectability in majority of patients, 81 or 85 patients (95%) achieved negative resection margins (R0) [7]. Similarly, Ferrone et al. reported that 40 patients with locally advanced and borderline resectable disease underwent neoadjuvant FOLFIRINOX therapy with or without additional radiation or other therapy; post-treatment CT still classified as locally advanced or borderline resectable disease in 70% of patients. However, 92% of patients achieved R0 resection [4].
CT often reveals persistent close relationship between the tumor and mesenteric vasculature after neoadjuvant therapy even without the presence of tumor correlated with surgical result [7]. Therefore, more accurate modalities are needed to accurately assess the true response to treatment which can provide more accurate prognostic information, and guide optimal treatment [2]. Positron emission tomography (PET) is one of such modalities, and provides metabolic and functional information, and has been used to monitor post-chemotherapy and postradiation treatment response [12, 13].
DECT with iodine quantification
DECT systems are FDA-approved equipment, and can acquire datasets simultaneously at two different photon spectra in a single CT acquisition [14]. In addition to providing images similar to those obtained with single-energy CT, post-processing DECT datasets permit separating materials and extract iodine by applying a material decomposition algorithm [14, 15]. With this advantage, dual-energy CT allows to differentiate and isolate the imaged iodine distribution in soft tissues and can provide the amount of iodine in tumor which reflects vascularity within the tumor [16]. Quantitative iodine mapping may have an added value over conventional CT imaging for monitoring the treatment effects in patients with pancreatic adenocarcinoma [17] and potentially serve as a unique biomarker for treatment response.
CT protocol
The patients were scanned with a second-generation dual-source DECT scanner (SOMATOM Definition Flash, Siemens Medical Solutions USA, Inc., Malvern, PA). The quality reference mAs for the online dose modulation system (CARE Dose4D; Siemens Medical Solutions USA, Inc., Malvern, PA) were 250 mAs for tube A (100 kVp) and 193 mAs for tube B (140 kVp).
The patients were administered with 120 ml of nonionic contrast material (Iohexol [Omnipaque 350, GE Healthcare, Princeton, NJ], or Iodixanol [Visipaque 320, GE Healthcare, Princeton, NJ]) intravenously through a peripheral venous line with injection rate of 4–5 mL/s. Each patient had the same amount of iodine administration at the baseline and post-chemotherapy CT. Dual-phase CT protocol included arterial phase timed by BolusTracking (Siemens Medical Solutions USA, Inc., Malvern, PA) at 230 HU in the abdominal aorta, followed by a 30-s delay for venous phase. Both phases were scanned with DE mode. Anatomical coverage in arterial phase was the abdomen to include the dome of the liver through the iliac artery bifurcation, and in venous phase the abdomen and pelvis to include the dome of the liver through the symphysis pubis. CT protocol was the same as our standard protocol except that the scans were performed in DE mode.
The patients were scanned with 32 × 0.6 mm collimation. The reconstruction field of view (FOV) for the DE data was 33.2 × 33.2 cm. The image data were reconstructed with the body soft tissue convolution kernel (D30f) with a 512 × 512 matrix. The reconstruction thickness and increment used for tumor segmentation were 1.5 and 1.0 mm, respectively. For diagnostic reading and three-dimensional and multiplanar reformation imaging, additional reconstructions were generated with 3 mm slice thickness at 3-mm interval and 0.75 mm slice thickness at 0.5-mm interval.
Post-processing
The reconstructed DECT data were loaded on a workstation, and tumor segmentation was performed using a prototype automated segmentation software (Siemens Medical Solutions USA, Inc., Malvern, PA) followed by manual editing. For tumor segmentation, the border of the tumor was carefully determined by reviewing both arterial and venous phase using the simulated weighted-average 120-kVp images and iodine map images shown side by side, and adding all axial slices including the tumor (Fig. 1). For tumors infiltrating outside of the pancreas into the retroperitoneum and peritoneum, soft tissue mass contiguous from the primary pancreatic tumor was included for tumor volume measurement. Arteries and veins containing iodine were removed from tumor segmentation. Calcifications and metallic objects (e.g., stent) were also removed from tumor segmentation. Apparent cystic component (well-defined round or oval hypoattenuating structure with CT number less than 10 HU on simulated weighted-average 120-kVp images) was removed from tumor segmentation, and only soft tissue component was included.
Fig. 1.
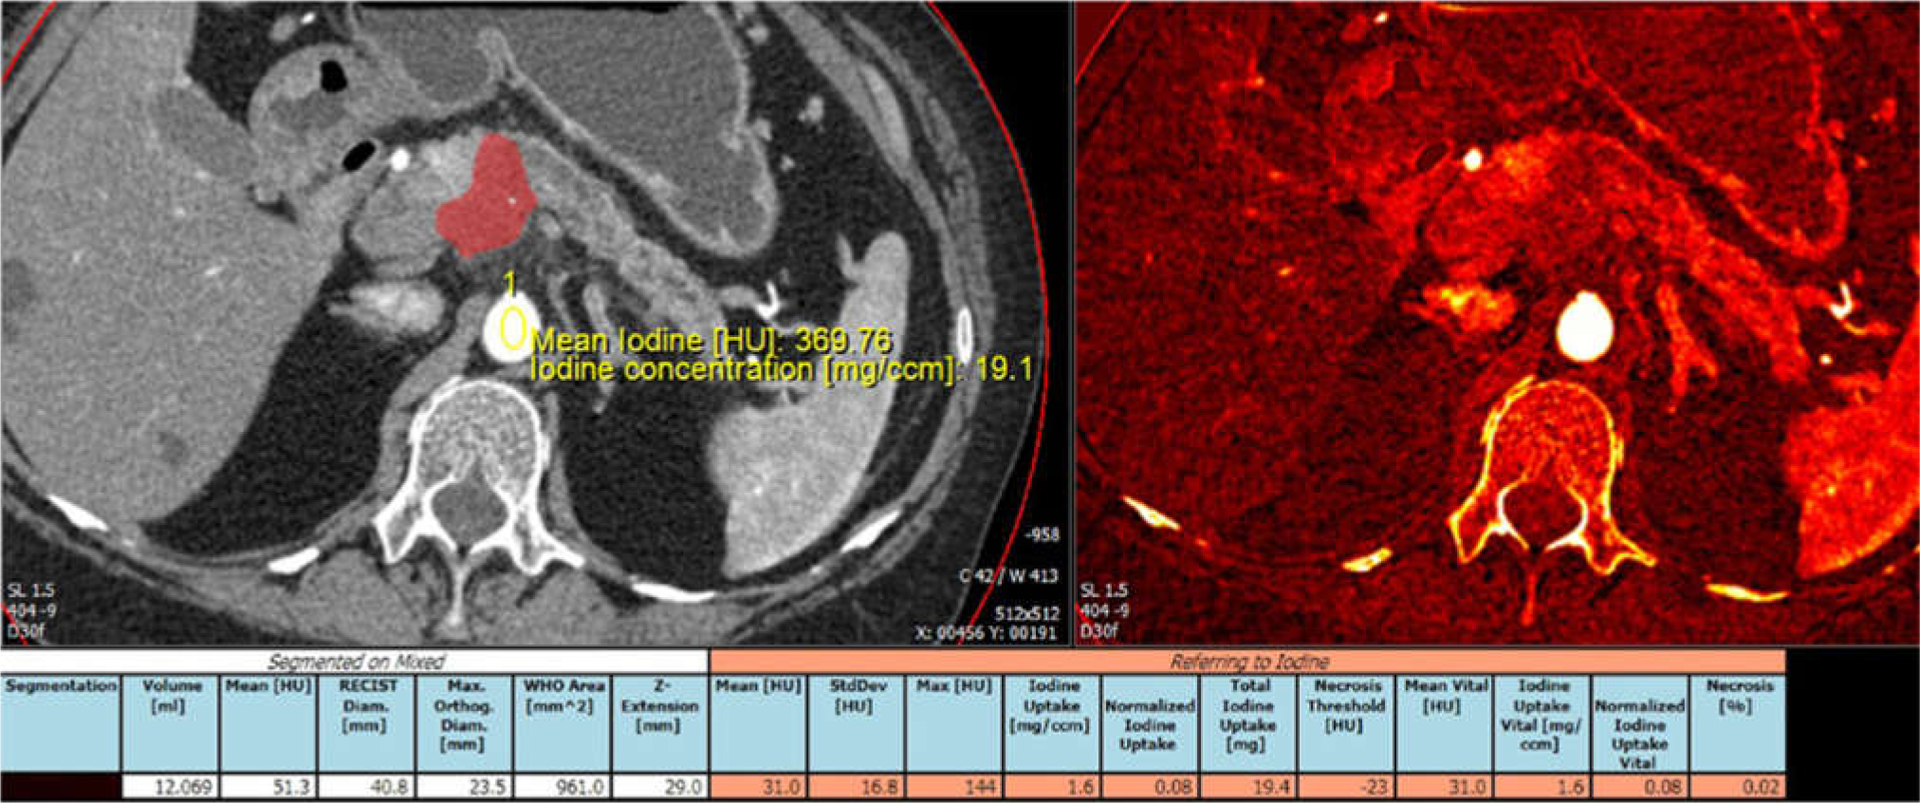
Example of tumor segmentation and iodine uptake measurement. Arterial phase CT image and iodine overlay image displayed side by side. Automated segmentation was followed by manual editing through the entire tumor volume. Tumor was segmented and color displayed. Aortic iodine uptake acquired by placing ROI over the aorta was used to obtain normalized tumor iodine uptake.
The parameters obtained using tumor segmentation software included (1) RECIST diameter (mm), (2) tumor volume (mL), (3) mean CT number of tumor (HU) at simulated weighted-average 120-kVp images, (4) iodine uptake by tumor per volume of tissue (mg/mL), and (5) normalized tumor iodine uptake (tumor iodine uptake normalized to the reference value acquired using region of interest place in the abdominal aorta at the level of the pancreatic tumor, calculated by tumor iodine uptake [mg/dL]/abdominal aortic uptake [mg/dL]).
Clinical experience
The protocol was approved by our institutional review board. The protocol was explained to the patients, and was performed if patient consent to participate was granted.
We scanned 18 patients (11 males, 7 females, average age 68.1 ± 11.6 years) with newly diagnosed borderline resectable or unresectable pancreatic adenocarcinoma due to vascular involvement referred to dedicated CT examination. Two patients also had liver metastasis, and one patient had peritoneal carcinomatosis at the time of initial diagnosis. Patients were treated with conventional cytotoxic chemotherapy with variable regimens including nine patients with FOLFIRINOX regimen (2–4 cycles) and eight patients with gemcitabine-based regimens (2–7 cycles). One patient was initially treated with FOLFIR INOX switched to gemcitabine-based regimen for poor tolerance. CT examinations were performed as a part of our standard diagnostic algorithm. Baseline CT was performed within 3 weeks (average 2.0 ± 1.5 weeks) before the initiation of chemotherapy. Post-chemotherapy CT examination was performed with average 10.0 ± 5.4 weeks after the initiation of chemotherapy. Iodine uptake in the pancreatic tumor was quantified.
Observations and case examples
Generally, tumor size was only minimally decreased on post-chemotherapy CT. No patients met criteria for partial response (tumor diameter <70% in the greatest dimension of the primary tumor of baseline) defined by RESICT (version 1.1) [18]. Average tumor diameter on post-chemotherapy CT was reduced to 94% of the baseline, and average tumor volume was reduced to 78% of the baseline. In three patients, tumor size increased on post-chemotherapy CT. In 12 patients, CA19–9 values were elevated (>36 U/mL) at baseline, and were available within 14 days of both baseline CT and post-chemotherapy. Average CT19–9 was decreased to 45% of the baseline in 12 patients, but one patient had increased CA19–9 value.
Generally, tumor iodine uptake and normalized tumor iodine uptake (calculated by tumor iodine uptake [mg/dL] divided by abdominal aortic uptake [mg/dL]) decreased in post-chemotherapy CT compared to the baseline, which may be more apparent in tumors which had larger reduction in their size. This tendency may be more apparent in normalized tumor iodine uptake than tumor uptake. However, the change in iodine uptake is small, and there were cases that did not follow these trends. CT attenuation of the tumor on simulated weighted-average 120-kVp images was generally very minimally lower in post-chemotherapy CT, but difference is generally smaller than change in iodine uptake.
Figure 2 illustrates a patient with unresectable pancreatic cancer due to vascular encasement. Tumor size decreased (post-chemotherapy tumor diameter was 89% of the baseline and tumor volume was 53% of the baseline), and CA19–9 decreased to 10% of the baseline after chemotherapy. Tumor iodine uptake decreased on post-chemotherapy CT compared to the baseline CT.
Fig. 2.
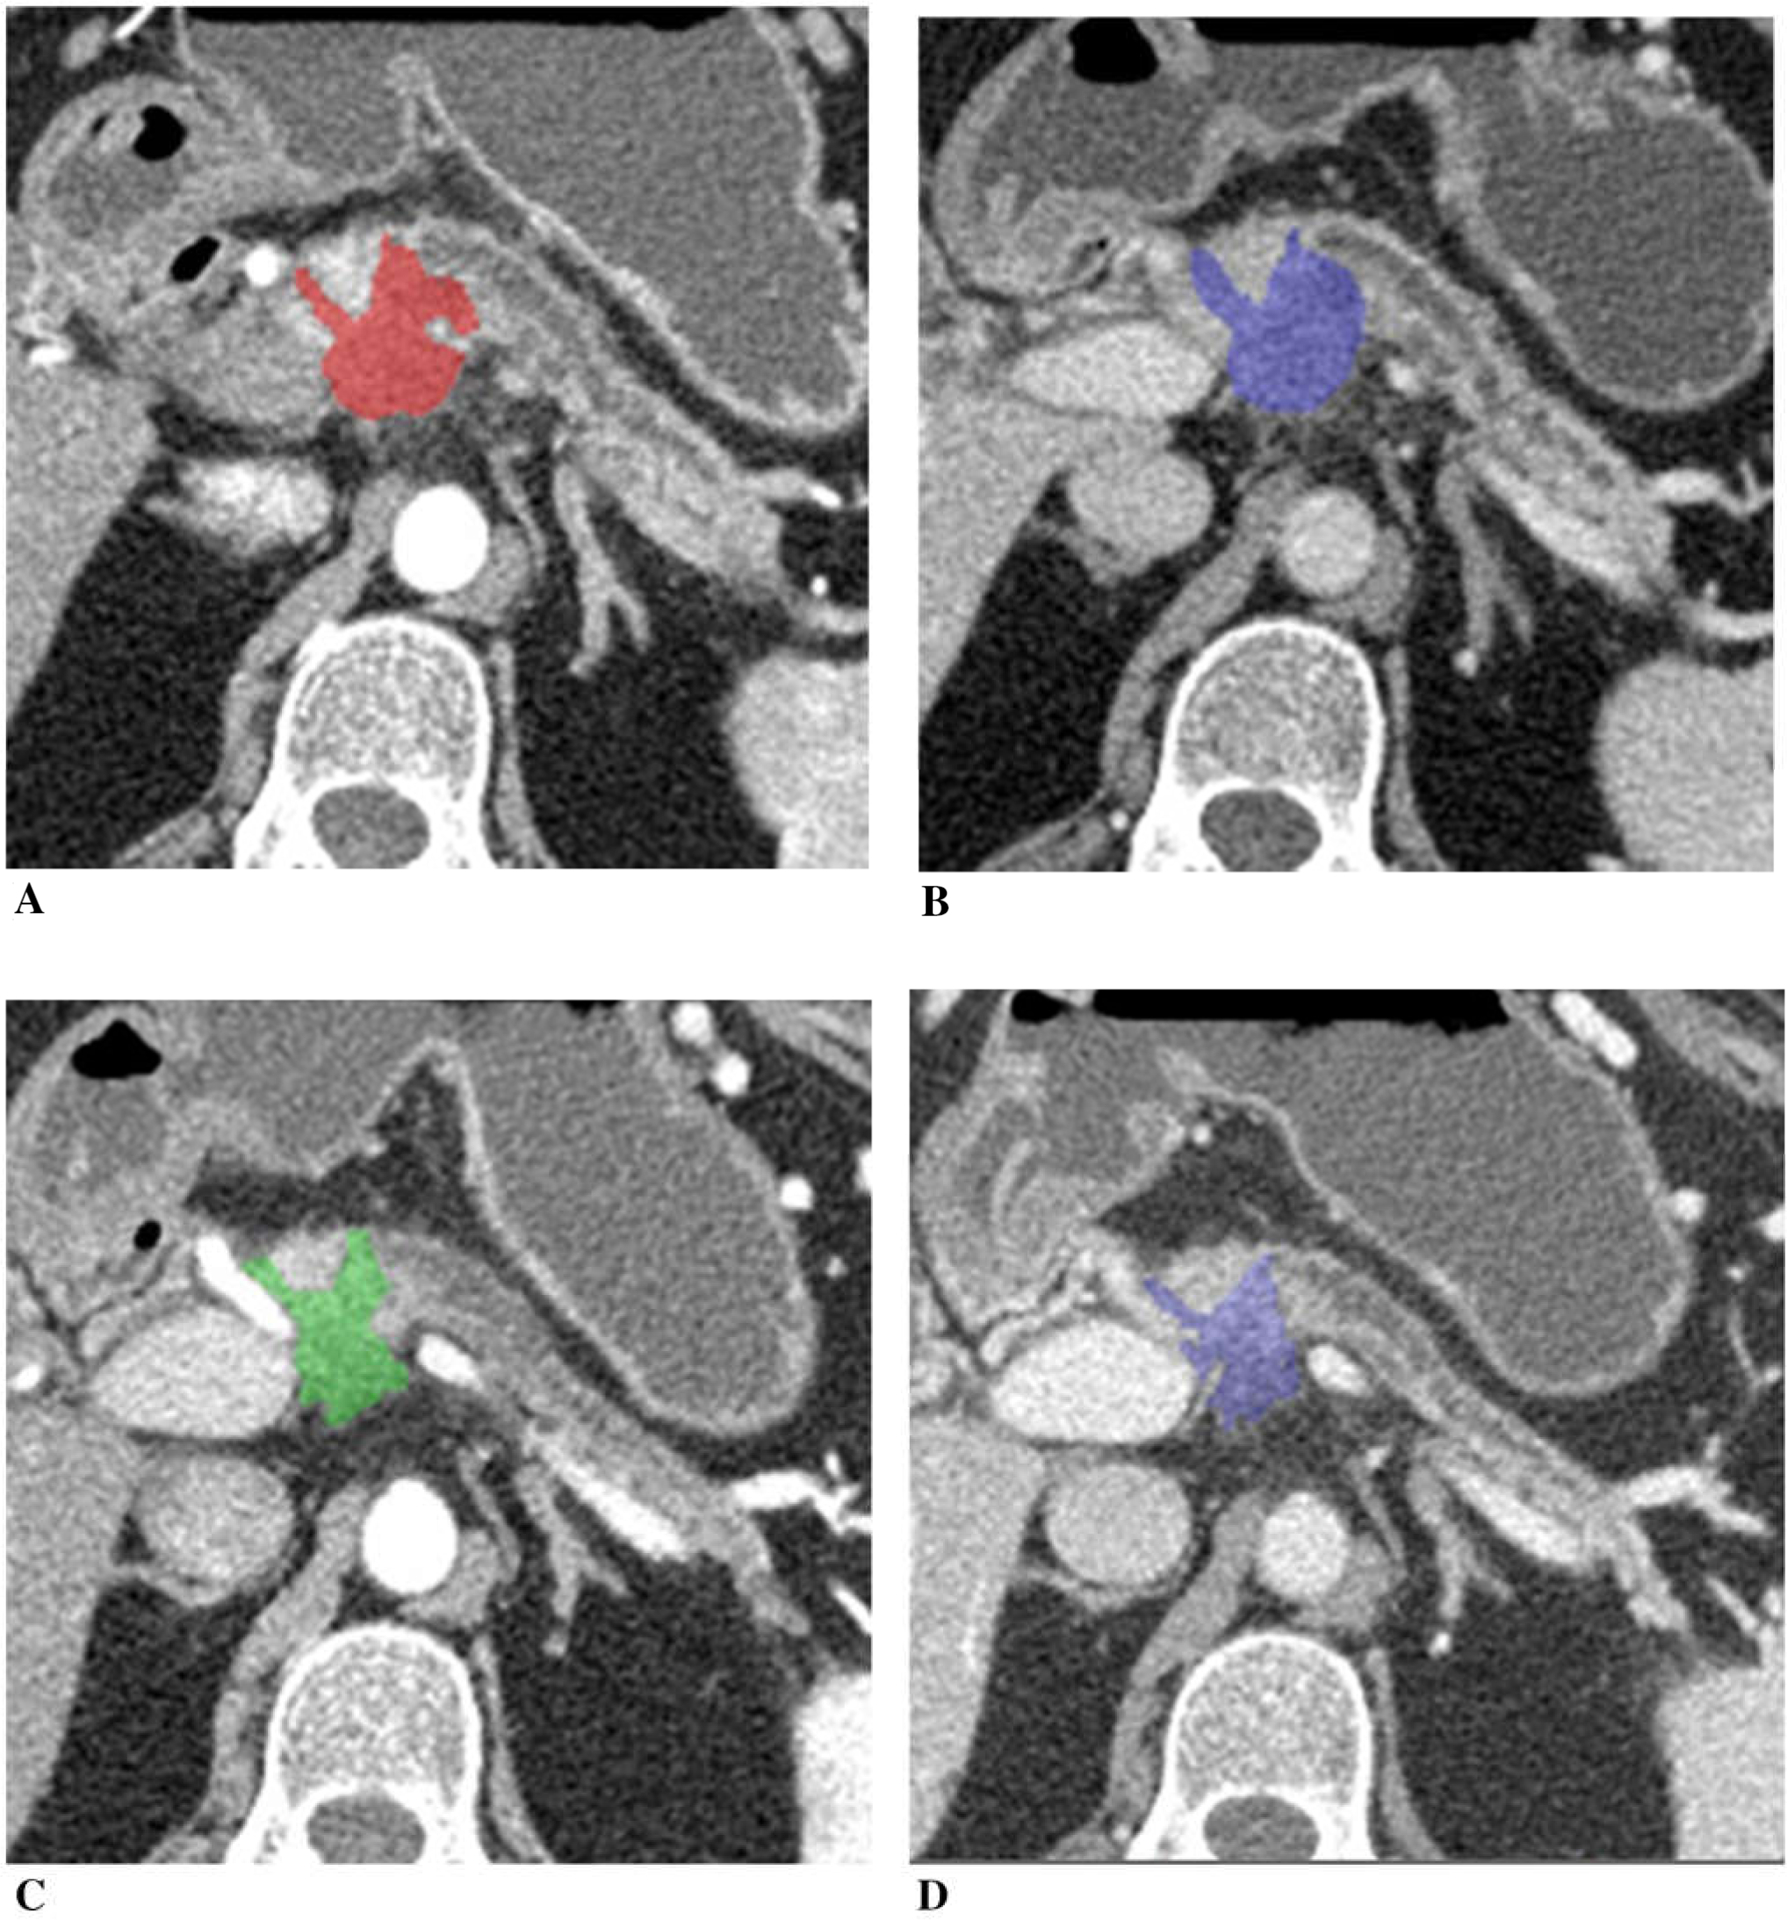
A 73-year-old woman with unresectable adenocarcinoma of the neck of the pancreas with encasement of celiac axis and portal vein/SMV confluence, treated with gemcitabine, taxotere, and xeloda. Tumor diameter decreased to 89% of the baseline, tumor volume 53%, and CA19–9 10%. A Baseline arterial and B venous phase CT. C Post-chemotherapy arterial and D venous phase CT. Tumor iodine uptake and normalized tumor iodine uptake were A 1.6 mg/mL and 8%, B 2.7 mg/mL and 50%, C 1.0 mg/mL and 7%, and D 1.0 mg/mL and 29%.
Figure 3 illustrates a patient with unresectable pancreatic cancer due to vascular encasement. Tumor size decreased (post-chemotherapy tumor diameter was 85%, and tumor volume was 59% of the baseline), and CA19–9 decreased to 47% of the baseline after chemotherapy. Tumor iodine uptake decreased on post-chemotherapy CT compared to the baseline CT, which was more apparent in normalized tumor iodine uptake than tumor uptake.
Fig. 3.
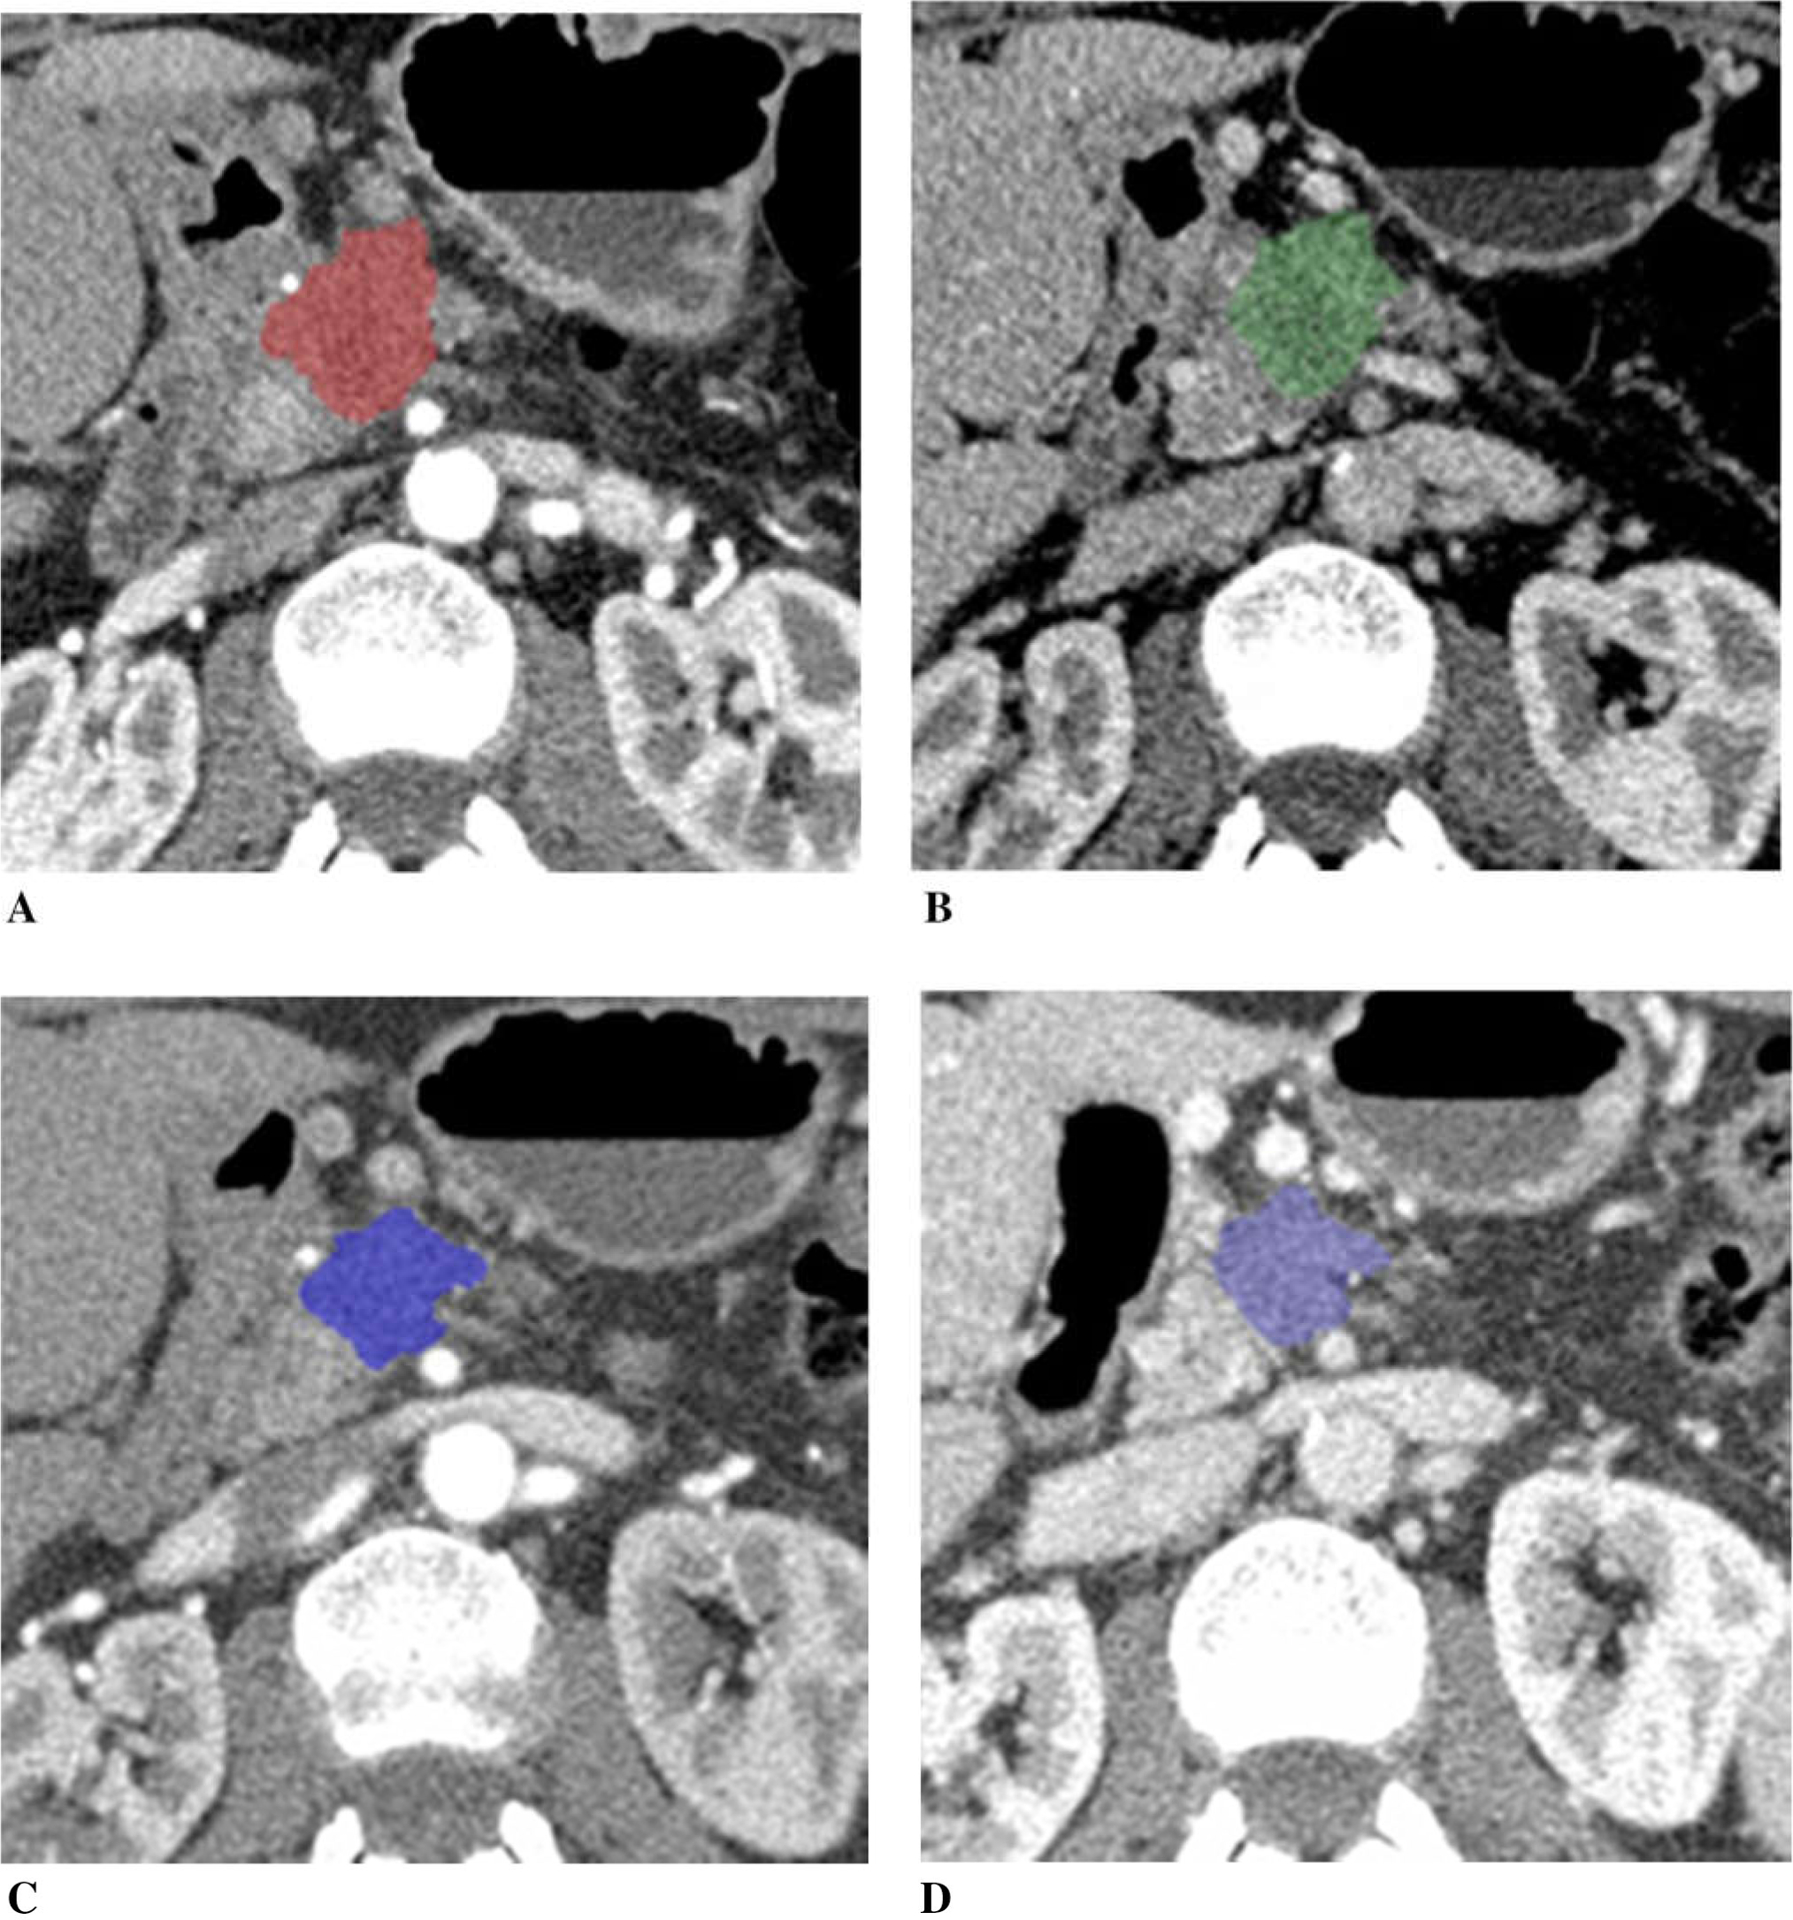
A 73-year-old woman with unresectable pancreatic adenocarcinoma with encasement and occlusion of the portal vein/SMV confluence, treated with FOLFIRINOX. Tumor diameter decreased to 85% of the baseline, tumor volume 59%, and CA19–9 47% after chemotherapy. A Baseline arterial and B venous phase CT. C Post-chemotherapy arterial and D venous phase CT. Tumor iodine uptake and normalized tumor iodine uptake were A 1.0 mg/mL and 6%, B 1.6 mg/mL and 45%, C 0.4 mg/mL and 3%, and D 1.3 mg/mL and 21%.
Figure 4 illustrates a patient with unresectable pancreatic cancer due to vascular encasement. Tumor size decreased (diameter was 75%, volume was 57% of the baseline), and CA19–9 decreased to 70% of the baseline after chemotherapy. Tumor iodine uptake was slightly lower on the post-chemotherapy CT compared to the baseline CT, which was more apparent in normalized tumor iodine uptake than tumor uptake. This patient underwent pancreaticojejunostomy after additional radiation treatment. Pathologically, there were 0.5 mm poorly differentiated adenocarcinoma in the pancreas, and soft tissue associated with large blood vessels, ganglia, and nerve trunk showed dense scarring without remaining tumor.
Fig. 4.
A 47-year-old man with pancreatic adenocarcinoma arising from the pancreatic neck with encasement of the celiac axis and common hepatic artery, treated with FOLFIRINOX. Tumor diameter decreased to 75% of the baseline, tumor volume 57%, and CA19–9 70%. A Baseline arterial and B venous phase CT. C Post-chemotherapy arterial and D venous phase CT. Tumor iodine uptake and normalized tumor iodine uptake were A 1.5 mg/mL and 23%, B 1.7 mg/mL and 43%, C 1.4 mg/mL and 13%, and D 1.6 mg/mL and 38%. After completion of chemotherapy, patient had radiation therapy followed by pancreaticoduodenectomy. Pathology revealed 0.5 cm poorly differentiated adenocarcinoma in the pancreas and an area of dense scarring associated with large blood vessels, ganglia, and nerve trunks without remaining tumor.
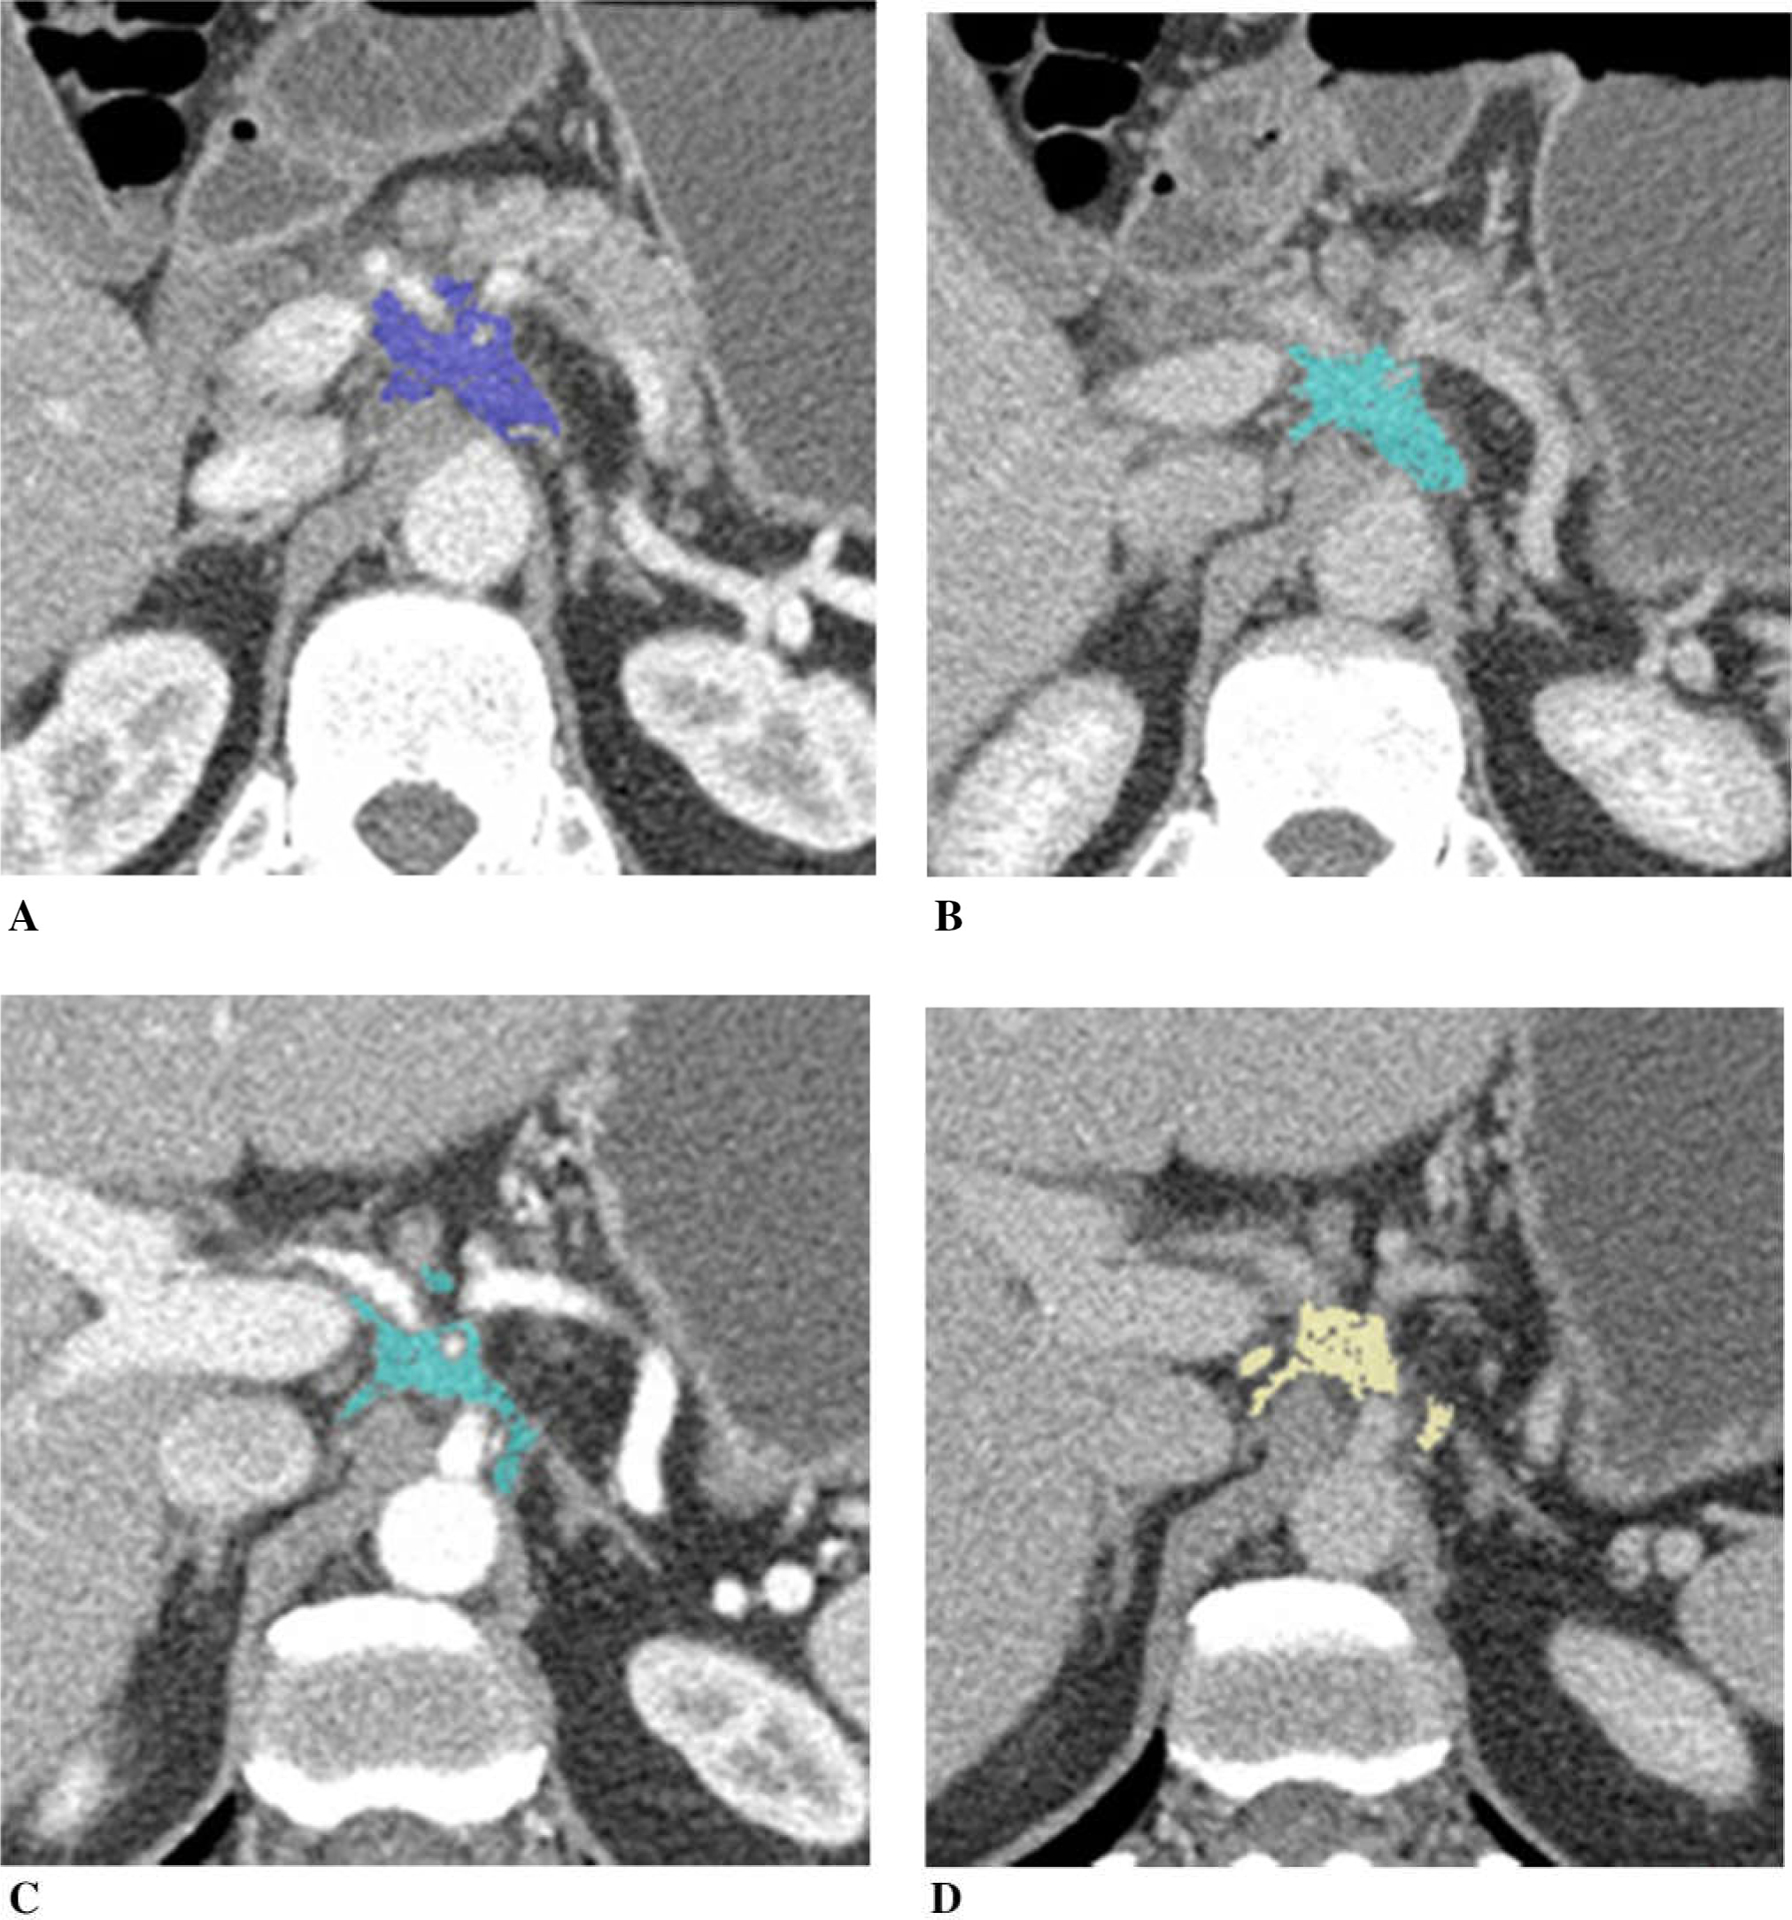
Figure 5 illustrates a patient with unresectable pancreatic cancer with vascular encasement. Tumor diameter was nearly unchanged (98% of the baseline), tumor volume was slightly decreased (88% of the baseline), and CA19–9 was decreased (70% of the baseline) on post-chemotherapy. Tumor iodine uptake was nearly same on the post-chemotherapy CT compared to the baseline.
Fig. 5.
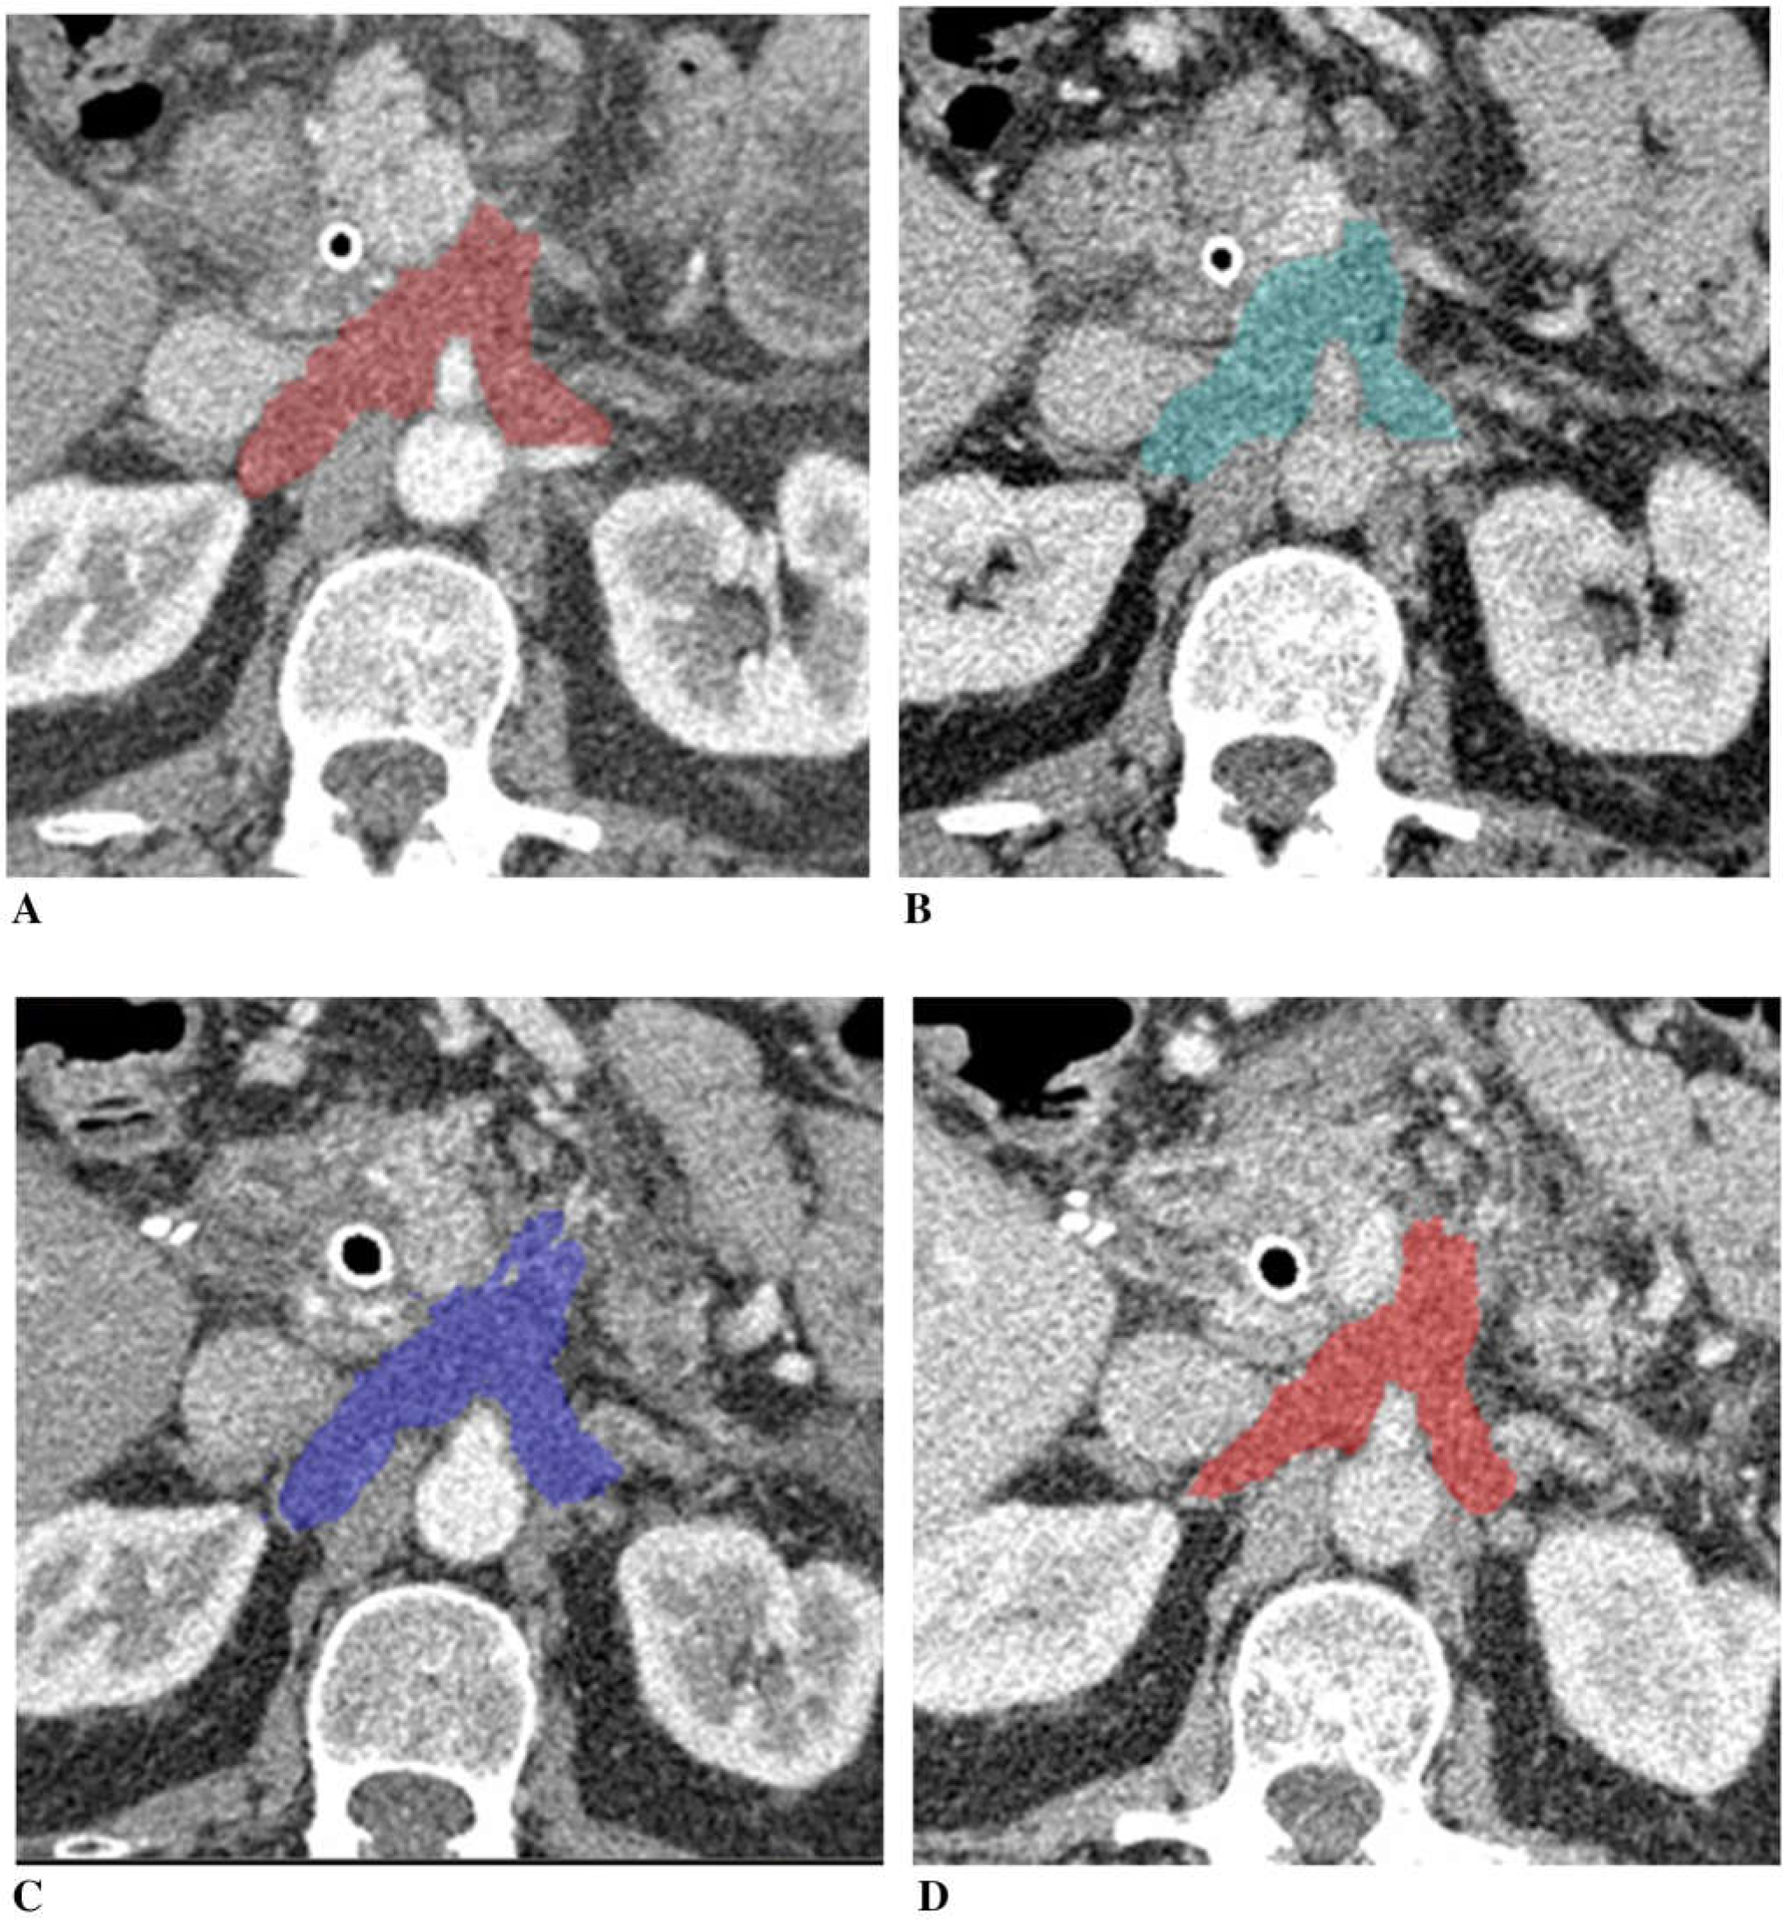
A 65-year-old man with unresectable adenocarcinoma of the body of the pancreas encasing the celiac axis and superior mesenteric artery, and extending around the aorta, treated with gemcitabine and cisplatin. Tumor diameter was nearly unchanged (98% of the baseline), tumor volume mini mally decreased to 88% and CA19–9 70%. A Baseline arterial and B venous phase CT. C Post-chemotherapy arterial and D venous phase CT. Tumor iodine uptake and normalized tumor iodine uptake were A 1.0 mg/mL and 12%, B 1.1 mg/mL and 28%, C 0.9 mg/mL and 11%, and D 1.1 mg/mL and 27%.
Figure 6 illustrates a patient with borderline resectable pancreatic cancer with borderline vascular encasement. The tumor did not change the size following chemotherapy (tumor diameter was 100% of the baseline, tumor volume was 98%, and CA19–9 was 93% after chemotherapy). Tumor iodine uptake was slightly higher on the post-chemotherapy CT compared to the baseline.
Fig. 6.
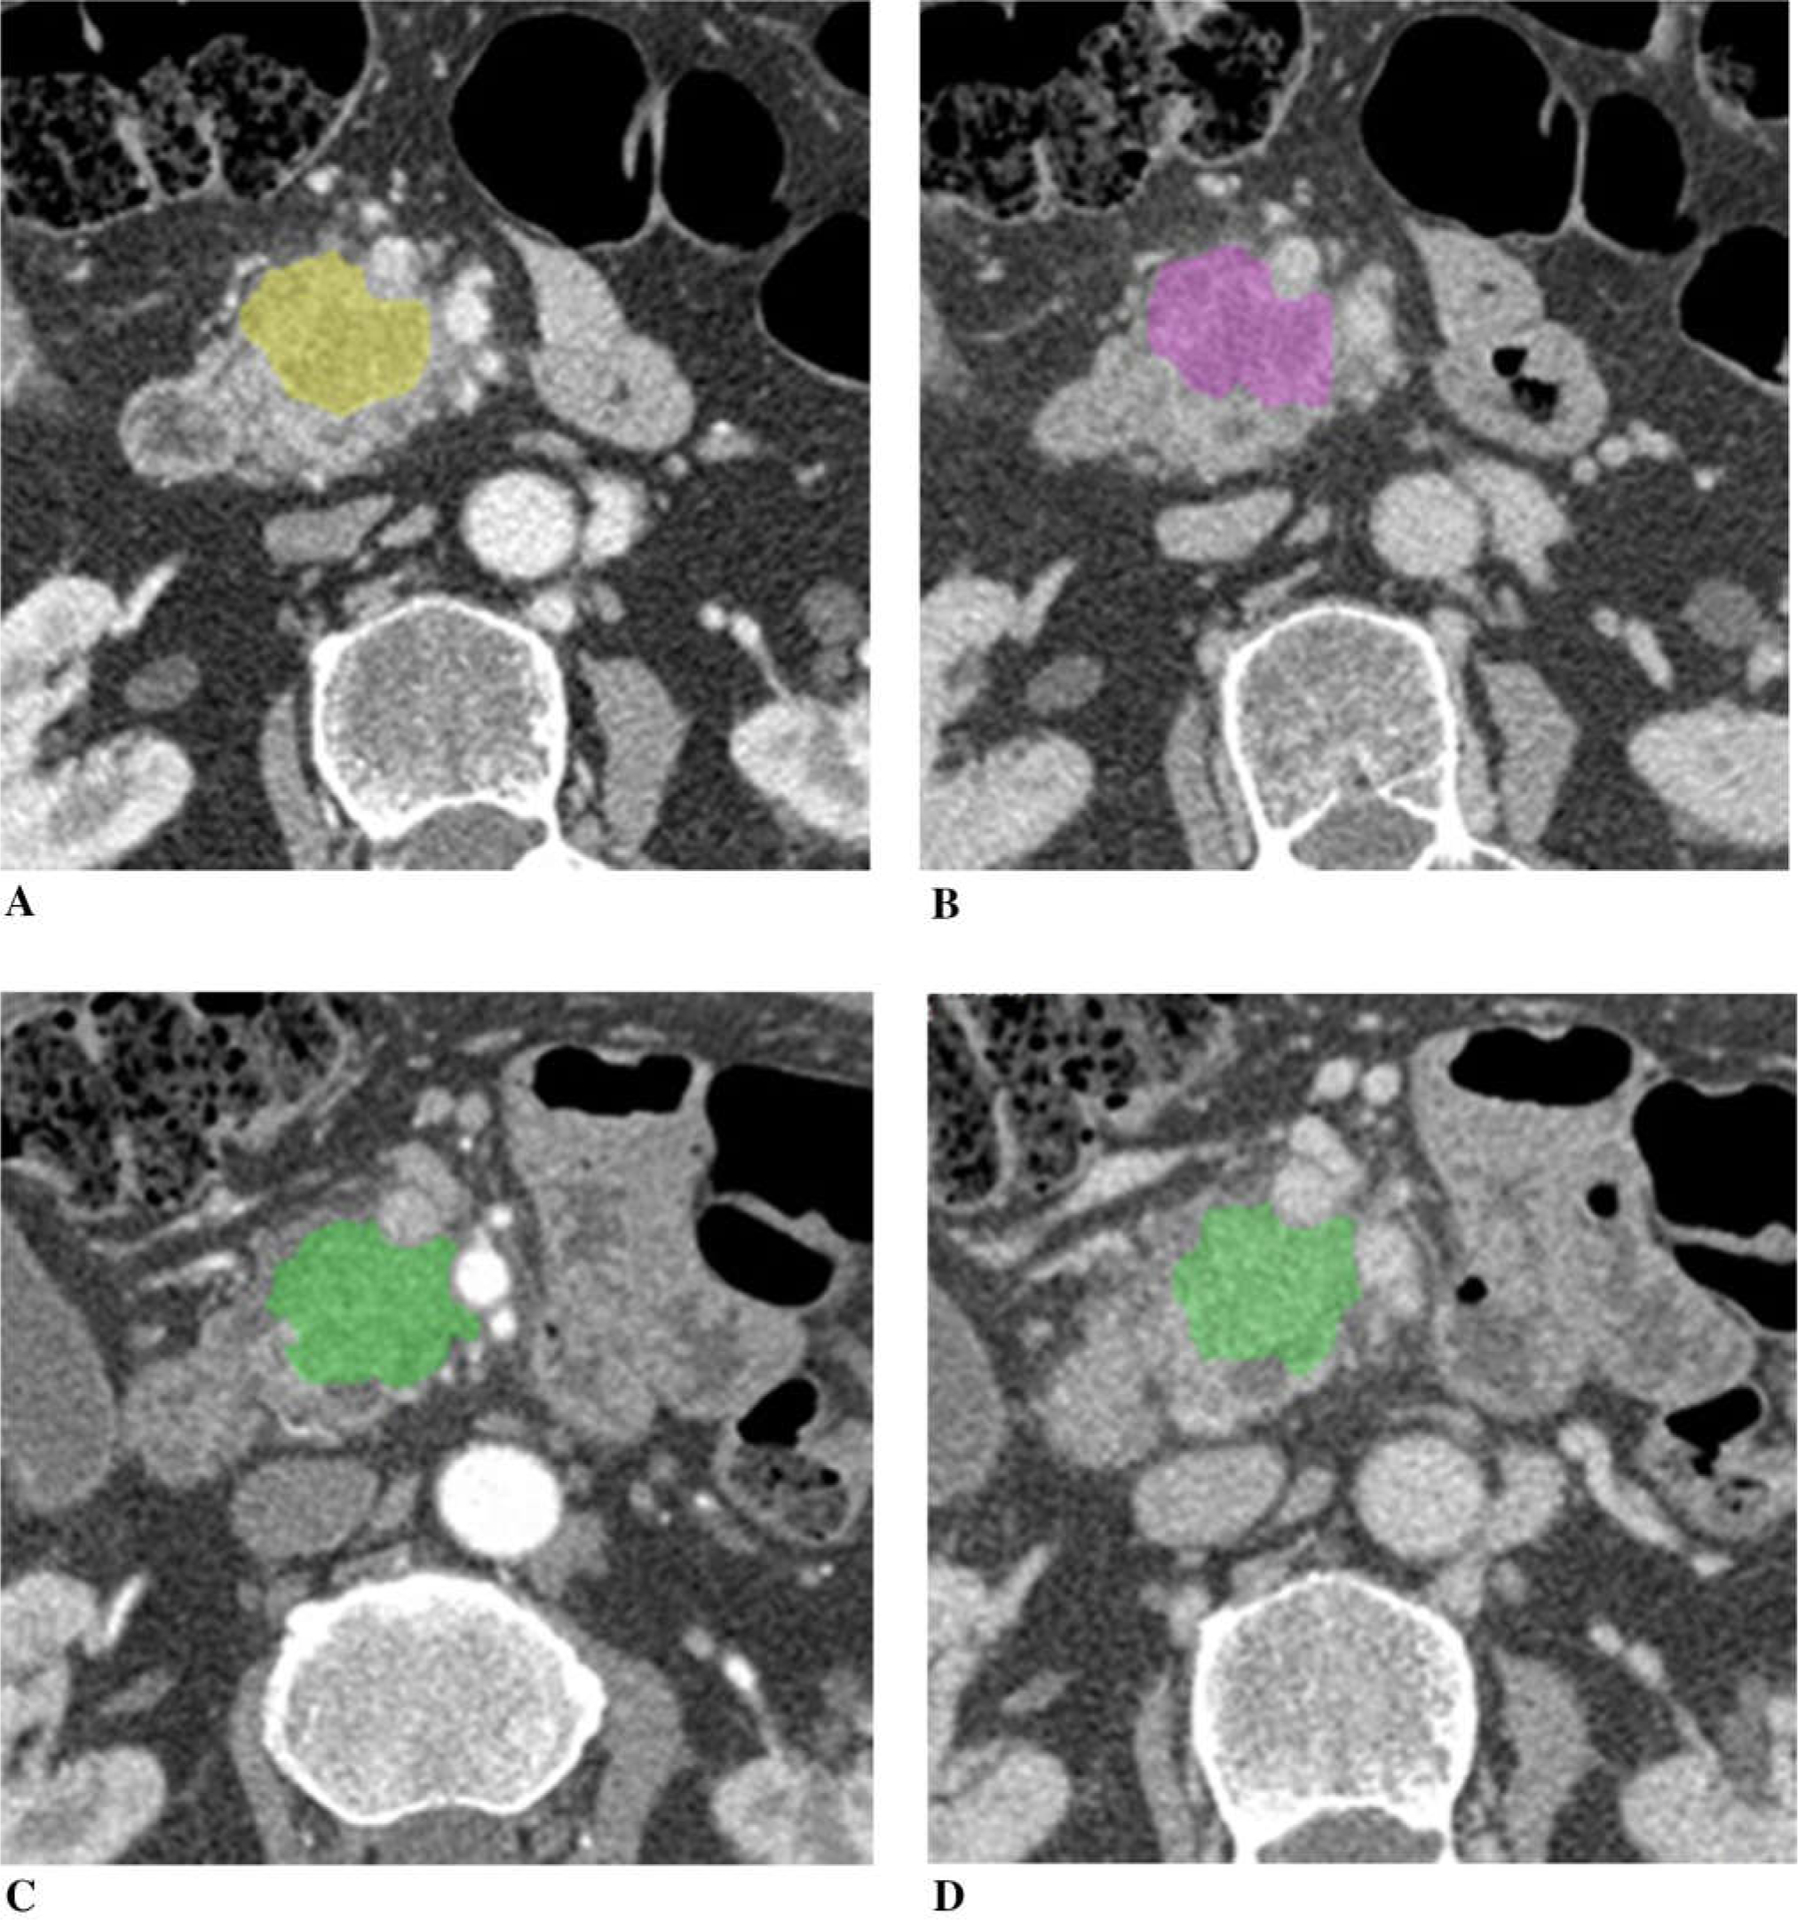
A 75-year-old man with borderline resectable adenocarcinoma of the head of the pancreas with borderline vascular encasement, treated with FOLFIRINOX. Tumor size was unchanged (tumor diameter 100% of the baseline, tumor volume 98%), and CA19–9 93% of the baseline after chemotherapy. A Baseline arterial and B venous phase CT. C Post-chemotherapy arterial and D venous phase CT. Tumor iodine uptake and normalized tumor iodine uptake were A 1.3 mg/mL and 20%, B 1.4 mg/mL and 31%, C 1.4 mg/mL and 12%, and D 1.6 mg/mL and 36%.
Figure 7 illustrates a patient with unresectable pancreatic cancer with vascular encasement. The tumor increased in size after chemotherapy (tumor diameter was 117%, tumor volume was 184%, and CA19–9 was 540% of the baseline). In addition, the patient developed ascites and peritoneal carcinomatosis on post-chemotherapy CT. Tumor iodine uptake was higher on post-chemotherapy CT.
Fig. 7.
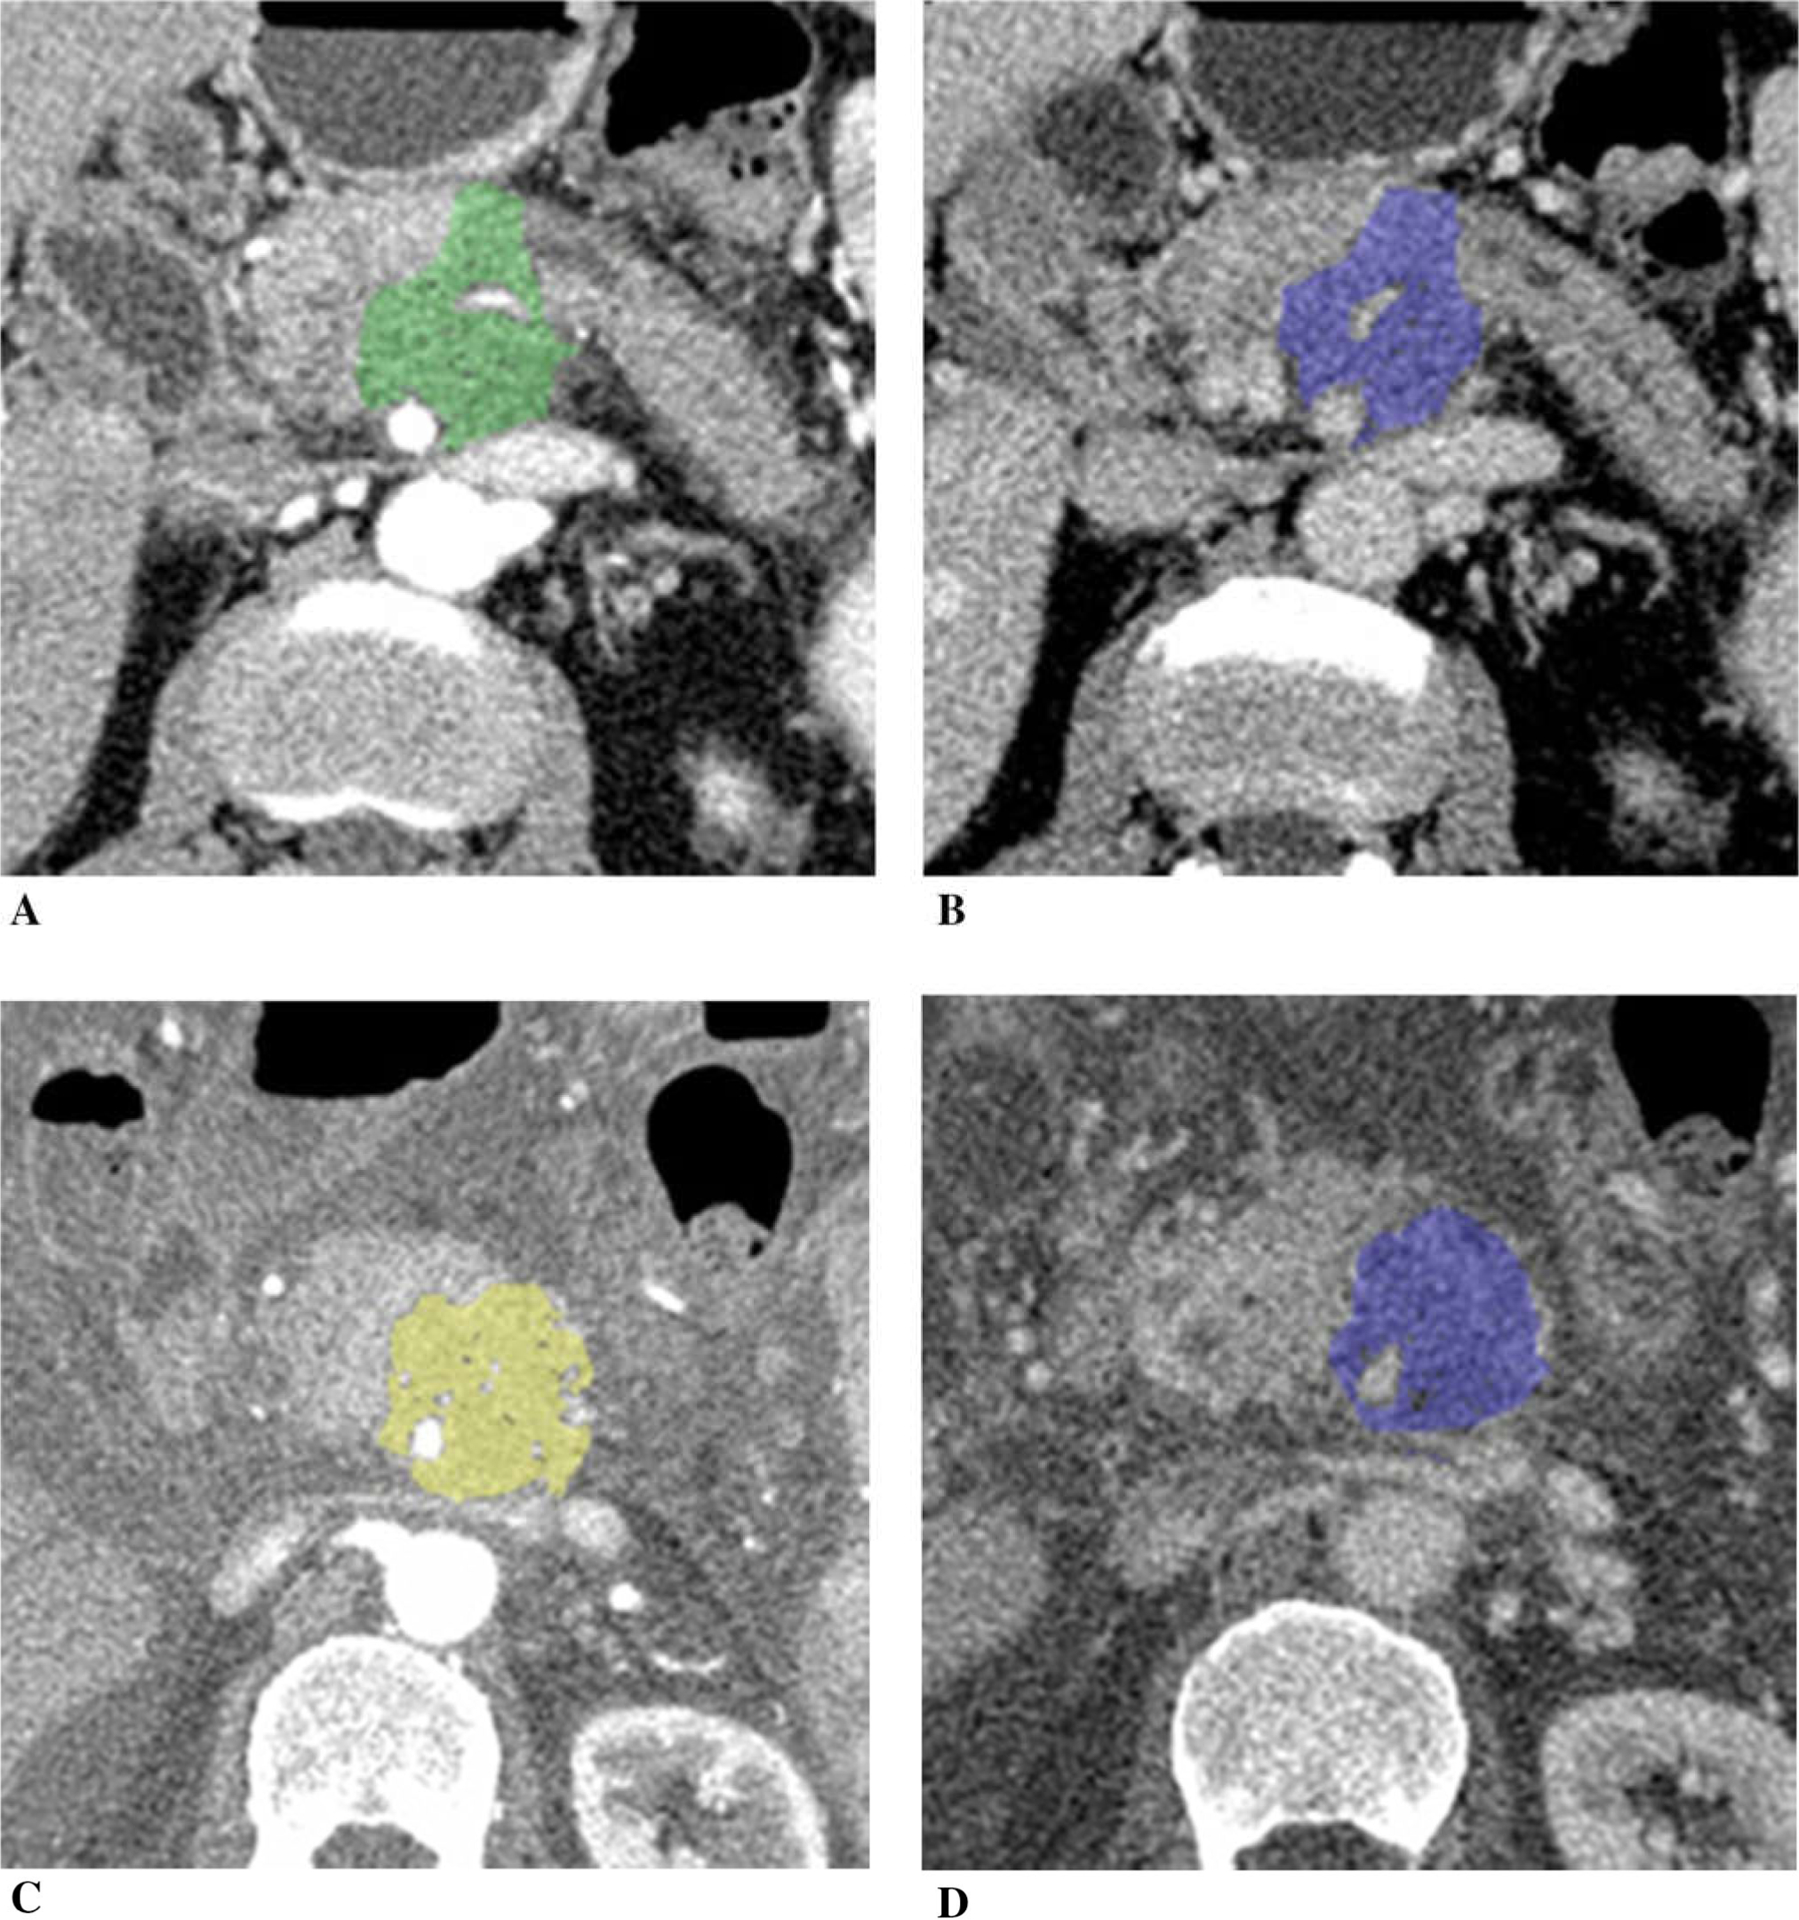
A 65-year-old man with unresectable adenocarcinoma of the body of the pancreas which encases and occludes the portal vein/SMV confluence, and encases the SMA and celiac axis, treated with FOLFIRINOX switched to gemcitabine/abraxane due to poor tolerance. Tumor diameter increased to 117% of the baseline, tumor volume 184%, and CA19–9 540% after chemotherapy. Peritoneal carcinomatosis with ascites developed on post-chemotherapy CT. A Baseline arterial and B venous phase CT. C Post-chemotherapy arterial and D venous phase CT. Tumor iodine uptake and normalized tumor iodine uptake were A 1.0 mg/mL and 9%, B 1.5 mg/mL and 41%, C 1.2 mg/mL and 8%, and D 2.4 mg/mL and 38%.
Pancreatic cancer and systemic chemotherapy
Generally, accepted chemotherapy combinations for pancreatic adenocarcinoma include FOLFIRINOX (leucovorin, fluorouracil, irinotecan, and oxaliplatin) and gemcitabine-based chemotherapy [6]. Since FOLFIRINOX has found to improve overall survival of patients with metastatic pancreatic adenocarcinoma when compared with gemcitabine [19], the same multidrug chemotherapy regimen became a rational choice to treat borderline and locally advanced pancreatic adenocarcinoma to render patients with locally advanced cancer resectable [20]. Gemcitabine have been the most widely used agents along with 5-fluorouracil for patients with pancreatic adenocarcinoma [2]. Gemcitabine with nabpaclitaxal chemotherapy including nab-paclitaxalpacrotaxine and other regimen are being tested, and their efficacies are being investigated [2].
Conventional anticancer chemotherapy may affect tumor vascularization [21]. Previous studies have shown reduction in CT perfusion parameters after conventional chemotherapy in various types of tumors including rectal cancer [22, 23] and non-small cell lung cancer [24]. Many of the conventional chemotherapeutic agents are cytotoxins that are capable of damaging the vascular endothelium [22]. These observations might be based on the loss of angiogenic cytokine support after cell death [25].
Iodine quantification for evaluation of anti-tumor therapy effect
Dynamic contrast enhancement CT or MRI assesses the vascular support of tumors by quantification of the perfusion parameters during a rapid series of images acquired with intravenous administration of contrast material [26]. Following the administration of a diffusible, extracellular contrast agent, the temporal change of the image signal is related to the local blood supply and the extravasation of the contrast agent into the interstitial space, reflecting the status of tissue microcirculation [27]. Dynamic contrast-enhanced CT has been used in pancreatic adenocarcinoma to improve diagnostic accuracy [28], assess tumor grading [29], and patient’s prognosis [30]. However, dynamic contrast-enhanced CT examination requires complex post-processing and evaluation is still not standardized [16].
DECT allows to determine imaged iodine distribution in soft tissues and can provide the amount of iodine in soft tissues expressed in milligrams per milliliters [17, 31]. Quantification of the iodine content provides indirect information about the underlying tissue microvascular environment [17, 31], and corresponds to the level of tissue perfusion at a concrete time point, and therefore reflects the degree of vascularization [16]. With this advantage, quantitative iodine mapping may have an added value over conventional CT imaging for monitoring the treatment effects in patients with pancreatic adenocarcinoma. Recently, Baxa et al. reported that dual-phase DECT in patients with advanced non-small cell lung cancer treated with anti-EGFR therapy demonstrated a decrease in vascularization in the responding primary tumors [16]. Several studies have been published focusing on the use of DECT in the evaluation of the effect of anti-tumor therapy [16, 32–34].
Accuracy of iodine quantification measured by DECT
Accuracy of iodine quantification measured by DECT have been investigated by a phantom studies [35, 36] and patient’s studies [37, 38], and is found to be influenced by multiple factors [35, 36]. Jacobsen et al. reported generally good agreement in iodine quantification across 3 DECT manufactures using a phantom representing a large body cross section with three iodine inserts (2, 5, and 15 mg/mL) [35]. They found that iodine measurement error ranged from −0.24 to 0.16 mg/mL (−12.0 to 8.0%) for 2 mg/mL iodine insert, with the largest absolute measurement error found in the 15 mg/mL iodine insert [35].
Pancreatic adenocarcinoma is typically a hypovascular tumor, and tumor iodine uptake is generally smaller than uptake by normal pancreatic parenchyma. In our cases, iodine concentration of tumor per tissue volume ranged from 0.7 to 1.7 mg/mL at baseline and from 0.6 to 1.5 mg/mL at post-chemotherapy in arterial phase, and from 1.1 to 2.7 mg/mL at baseline and from 0.9 to 2.3 mg/mL at post-chemotherapy in venous phase. Because iodine uptake by tumor as well as change in iodine uptake after chemotherapy was small, distinction between measurement error and a true therapeutic effect may be difficult.
Ratio of tumor to aortic iodine concentration
Tumor iodine uptake may be measured as absolute uptake per tissue volume as well as normalized tumor iodine uptake obtained by a tumor-to-aortic iodine concentration ratio [37]. The use of ratio of tumor to aortic iodine concentration more likely normalizes the technical and physiological variations such as contrast input function, patient’s hemodynamic status, patient’s body weight, and amount of tissue that iodine may distribute rather than absolute tumor iodine concentration, and compensate inter-subjective and intra-subjective variability [39, 40]. Also, venous phase may be less likely influenced by contrast input function and patient’s hemodynamic status, and more likely to relate to the presence of extravascular contrast material than arterial phase.
Our preliminary observations are limited by multiple factors. First, we only assessed a small number of patients. Second, chemotherapy regimens that patients received were not uniform. Third, because the CT examinations were performed as a part of clinical follow-up, duration of post-chemotherapy CT after the initiation of chemotherapy is not uniform. The optimal time to perform CT after the initiation of an anti-tumor treatment is not clear and may influence response evaluation [21]. Fourth, there were two different brands of iodinate contrast material that was used for our patients, and the amount of iodine is different between these two groups who received the different type of contrast material (42 vs. 38.4 g). However, each patient received the same amount of iodine at both baseline and post-chemotherapy CT examinations. Injection rate was 4 to 5 mL/s, and could not be exact. Therefore, unfortunately, in arterial phase iodine concentration, which would be corresponded to the so-called first-pass of a contrast material (i.e., intravascular component of iodine), was unable to be evaluated [16]. Finally, we were able to correlate tumor iodine uptake change only to anatomical parameters (diameter and volume) and CA19–9 values. However, more critical information, response in longer follow-up, and prognosis remain to be determined.
In conclusion, iodine uptake by pancreatic adenocarcinoma using DECT may add supplemental information for assessment of treatment response, although tumor iodine uptake by pancreatic adenocarcinoma is small, and it may be difficult to apply to each case. Normalized tumor iodine uptake might be more sensitive than iodine concentration to measure treatment response. More data are necessary to confirm these observations.
Funding
This study was funded by Siemens Medical Solutions, Inc. (grant number JHU-2012-CT-118-01).
Footnotes
Ethical approval All procedures performed in studies involving human participants were in accordance with the ethical standards of the institutional and/or national research committee and with the 1964 Helsinki declaration and its later amendments or comparable ethical standards.
Informed consent Informed consent was obtained from all individual participants included in the study.
References
- 1.Siegel RL, Miller KD, Jemal A (2016) Cancer statistics, 2016. CA Cancer J Clin 66:7–30 [DOI] [PubMed] [Google Scholar]
- 2.Loehrer AP, Kinnier CV, Ferrone CR (2016) Treatment of locally advanced pancreatic ductal adenocarcinoma. Adv Surg 50:115–128 [DOI] [PubMed] [Google Scholar]
- 3.Vincent A, Herman J, Schulick R, Hruban RH, Goggins M (2011) Pancreatic cancer. Lancet 378:607–620 [DOI] [PMC free article] [PubMed] [Google Scholar]
- 4.Ferrone CR, Marchegiani G, Hong TS, et al. (2015) Radiological and surgical implications of neoadjuvant treatment with FOLFIRINOX for locally advanced and borderline resectable pancreatic cancer. Ann Surg 261:12–17 [DOI] [PMC free article] [PubMed] [Google Scholar]
- 5.Al-Hawary MM, Francis IR, Chari ST, et al. (2014) Pancreatic ductal adenocarcinoma radiology reporting template: consensus statement of the Society of Abdominal Radiology and the American Pancreatic Association. Radiology 270:248–260 [DOI] [PubMed] [Google Scholar]
- 6.Tempero MA, Malafa MP, Al-Hawary M (2016) National Comprehensive Cancer Network Clinical Practice Guidelines in Oncology; Pancreatic adenocarcinoma Version 2.2016. NCCN.org 2016. https://www.nccn.org/professionals/physician_gls/pdf/pancreatic.pdf. Accessed 13 March 2017 [DOI] [PubMed] [Google Scholar]
- 7.Katz MH, Fleming JB, Bhosale P, et al. (2012) Response of borderline resectable pancreatic cancer to neoadjuvant therapy is not reflected by radiographic indicators. Cancer 118:5749–5756 [DOI] [PubMed] [Google Scholar]
- 8.Chang J, Schomer D, Dragovich T (2015) Anatomical, physiological, and molecular imaging for pancreatic cancer: current clinical use and future implications. Biomed Res Int. 10.1155/2015/269641 [DOI] [PMC free article] [PubMed] [Google Scholar]
- 9.Balachandran A, Bhosale PR, Charnsangavej C, Tamm EP (2014) Imaging of pancreatic neoplasms. Surg Oncol Clin N Am 23:751–788 [DOI] [PubMed] [Google Scholar]
- 10.Brennan DD, Zamboni GA, Raptopoulos VD, Kruskal JB (2007) Comprehensive preoperative assessment of pancreatic adenocarcinoma with 64-section volumetric CT. Radiographics 27:1653–1666 [DOI] [PubMed] [Google Scholar]
- 11.Lee ES, Lee JM (2014) Imaging diagnosis of pancreatic cancer: a state-of-the-art review. World J Gastroenterol 20:7864–7877 [DOI] [PMC free article] [PubMed] [Google Scholar]
- 12.Dibble EH, Karantanis D, Mercier G, et al. (2012) PET/CT of cancer patients: part 1, pancreatic neoplasms. AJR Am J Roentgenol 199:952–967 [DOI] [PubMed] [Google Scholar]
- 13.Sahani DV, Bonaffini PA, Catalano OA, Guimaraes AR, Blake MA (2012) State-of-the-art PET/CT of the pancreas: current role and emerging indications. Radiographics 32:1133–1158 [DOI] [PMC free article] [PubMed] [Google Scholar]
- 14.Johnson TRC (2012) Dual-Energy CT: General Principles. Am J Roentgenol 199:S3–S8 [DOI] [PubMed] [Google Scholar]
- 15.Johnson TRC, Krauss B, Sedlmair M, et al. (2007) Material differentiation by dual energy CT: initial experience. Eur Radiol 17:1510–1517 [DOI] [PubMed] [Google Scholar]
- 16.Baxa J, Matouskova T, Krakorova G, et al. (2016) Dual-phase dual-energy CT in patients treated with Erlotinib for advanced non-small cell lung cancer: possible benefits of iodine quantification in response assessment. Eur Radiol 26:2828–2836 [DOI] [PubMed] [Google Scholar]
- 17.Agrawal MD, Pinho DF, Kulkarni NM, et al. (2014) Oncologic applications of dual-energy CT in the abdomen. Radiographics 34:589–612 [DOI] [PubMed] [Google Scholar]
- 18.Eisenhauer EA, Therasse P, Bogaerts J, et al. (2009) New response evaluation criteria in solid tumours: revised RECIST guideline (version 1.1). Eur J Cancer 45:228–247 [DOI] [PubMed] [Google Scholar]
- 19.Conroy T, Desseigne F, Ychou M, et al. (2011) FOLFIRINOX versus gemcitabine for metastatic pancreatic cancer. N Engl J Med 364:1817–1825 [DOI] [PubMed] [Google Scholar]
- 20.Faris JE, Blaszkowsky LS, McDermott S, et al. (2013) FOLFIRINOX in locally advanced pancreatic cancer: the Massachusetts General Hospital Cancer Center experience. Oncologist 18:543–548 [DOI] [PMC free article] [PubMed] [Google Scholar]
- 21.Garcia-Figueiras R, Goh VJ, Padhani AR, et al. (2013) CT perfusion in oncologic imaging: a useful tool? AJR Am J Roentgenol 200:8–19 [DOI] [PubMed] [Google Scholar]
- 22.Sahani DV, Kalva SP, Hamberg LM, et al. (2005) Assessing tumor perfusion and treatment response in rectal cancer with multisection CT: Initial observations. Radiology 234:785–792 [DOI] [PubMed] [Google Scholar]
- 23.Bellomi M, Petralia G, Sonzogni A, Zampino MG, Rocca A (2007) CT perfusion for the monitoring of neoadjuvant chemotherapy and radiation therapy in rectal carcinoma: initial experience. Radiology 244:486–493 [DOI] [PubMed] [Google Scholar]
- 24.Kiessling F, Boese J, Corvinus C, et al. (2004) Perfusion CT in patients with advanced bronchial carcinomas: a novel chance for characterization and treatment monitoring? Eur Radiol 14:1226–1233 [DOI] [PubMed] [Google Scholar]
- 25.Lissoni P, Fugamalli E, Malugani F, et al. (2000) Chemotherapy and angiogenesis in advanced cancer: vascular endothelial growth factor (VEGF) decline as predictor of disease control during taxol therapy in metastatic breast cancer. Int J Biol Markers 15:308–311 [DOI] [PubMed] [Google Scholar]
- 26.Miles KA, Lee TY, Goh V, et al. (2012) Current status and guidelines for the assessment of tumour vascular support with dynamic contrast-enhanced computed tomography. Eur Radiol 22:1430–1441 [DOI] [PubMed] [Google Scholar]
- 27.Brix G, Griebel J, Kiessling F, Wenz F (2010) Tracer kinetic modelling of tumour angiogenesis based on dynamic contrast-en hanced CT and MRI measurements. Eur J Nucl Med Mol Imaging 37(Suppl 1):S30–S51 [DOI] [PubMed] [Google Scholar]
- 28.Zamboni GA, Bernardin L, Pozzi Mucelli R (2012) Dynamic MDCT of the pancreas: is time-density curve morphology useful for the differential diagnosis of solid lesions? A preliminary report. Eur J Radiol 81:e381–e385 [DOI] [PubMed] [Google Scholar]
- 29.D’Onofrio M, Gallotti A, Mantovani W, et al. (2013) Perfusion CT can predict tumoral grading of pancreatic adenocarcinoma. Eur J Radiol 82:227–233 [DOI] [PubMed] [Google Scholar]
- 30.Nishikawa Y, Tsuji Y, Isoda H, Kodama Y, Chiba T (2014) Perfusion in the tissue surrounding pancreatic cancer and the patient’s prognosis. Biomed Res Int. 10.1155/2014/648021 [DOI] [PMC free article] [PubMed] [Google Scholar]
- 31.Kaza RK, Platt JF, Cohan RH, et al. (2012) Dual-energy CT with single- and dual-source scanners: current applications in evaluating the genitourinary tract. Radiographics 32:353–369 [DOI] [PubMed] [Google Scholar]
- 32.Kim YN, Lee HY, Lee KS, et al. (2012) Dual-energy CT in patients treated with anti-angiogenic agents for non-small cell lung cancer: New method of monitoring tumor response? Korean J Radiol 13:702–710 [DOI] [PMC free article] [PubMed] [Google Scholar]
- 33.Uhrig M, Simons D, Ganten MK, Hassel JC, Schlemmer HP (2015) Histogram analysis of iodine maps from dual energy computed tomography for monitoring targeted therapy of melanoma patients. Future Oncol 11:591–606 [DOI] [PubMed] [Google Scholar]
- 34.Knobloch G, Jost G, Huppertz A, Hamm B, Pietsch H (2014) Dual-energy computed tomography for the assessment of early treatment effects of regorafenib in a preclinical tumor model: comparison with dynamic contrast-enhanced CT and conventional contrast-enhanced single-energy CT. Eur Radiol 24:1896–1905 [DOI] [PubMed] [Google Scholar]
- 35.Jacobsen M, Wood C, Cody D (2016) WE-FG-207B-08: dual-energy CT iodine accuracy across vendors and platforms. Med Phys 43:3835–3836 [Google Scholar]
- 36.Marin D, Pratts-Emanuelli JJ, Mileto A, et al. (2015) Interdependencies of acquisition, detection, and reconstruction techniques on the accuracy of iodine quantification in varying patient sizes employing dual-energy CT. Eur Radiol 25:679–686 [DOI] [PubMed] [Google Scholar]
- 37.Chandarana H, Megibow AJ, Cohen BA, et al. (2011) Iodine quantification with dual-energy CT: phantom study and preliminary experience with renal masses. Am J Roentgenol 196:W693–W700 [DOI] [PubMed] [Google Scholar]
- 38.Mileto A, Marin D, Ramirez-Giraldo JC, et al. (2014) Accuracy of contrast-enhanced dual-energy MDCT for the Assessment of iodine uptake in renal lesions. Am J Roentgenol 202:W466–W474 [DOI] [PubMed] [Google Scholar]
- 39.Herts BR, Coll DM, Novick AC, et al. (2002) Enhancement characteristics of papillary renal neoplasms revealed on triphasic helical CT of the kidneys. Am J Roentgenol 178:367–372 [DOI] [PubMed] [Google Scholar]
- 40.Ruppert-Kohlmayr AJ, Uggowitzer M, Meissnitzer T, Ruppert G (2004) Differentiation of renal clear cell carcinoma and renal papillary carcinoma using quantitative CT enhancement parameters. Am J Roentgenol 183:1387–1391 [DOI] [PubMed] [Google Scholar]


