

Abstract
Current vascular aneurysm treatments often require either highly invasive strategy to surgically occlude an aneurysm or endovascular occlusion via metal coils. While endovascular coils are safer, they have limited efficacy. Endovascular coils that are integrated with shape memory polymer (SMP) foams have the potential to improve occlusion and reduce coil risks; however, the mechanical performance and limited homogeneity of SMP foams can hinder their effective use. To address this issue, SMP foams are synthesized using the monomer diethanolamine (DEA) in place of triethanolamine (TEA) to provide improved mechanical properties for medical device applications. Mechanical testing and micro-fracture analysis were performed on DEA and TEA foams. DEA foams show improved toughness and reduced micro-fractures compared to the control. This work presents the utility of DEA in SMP synthesis to enable the potential production of safer aneurysm treatment.
Keywords: polyurethane, shape memory polymer foam
INTRODUCTION
Approximately 3 to 5 million Americans suffer from cerebral aneurysms.1 An aneurysm occurs when a blood vessel weakens and balloons, which most commonly occurs in the aorta, cerebral arteries, the popliteal artery, the mesenteric artery, and the splenic artery.1 As a cerebral aneurysm expands and the blood vessel wall thins, the vessel may rupture and result in a subarachnoid hemorrhage, which can cause a hemorrhagic stroke.2 Approximately 50% of patients do not survive the first hemorrhage.2 Thus, there is a significant clinical need to provide treatments that effectively prevent aneurysm rupture.
Current treatments aim to prevent blood flow to the aneurysm to reduce rupture risk. These treatments include both invasive surgical methods and minimally invasive endovascular coiling. Endovascular coils were first used clinically in 1990 to reduce the risk associated with invasive aneurysm occlusion.3 This method utilizes a catheter that is inserted into the femoral artery and maneuvered to the aneurysm site. After the catheter is properly positioned, platinum endovascular coils are deployed using a guide wire with a goal of promoting blood stasis within the aneurysm, ultimately resulting in a stable clot and neointima growth across the aneurysm neck.4 Endovascular coils present lower procedural risks as compared to invasive methods, but often have incomplete healing and lower rates of complete aneurysm occlusion, which results in higher retreatment incidences.5
Polymer coated endovascular coils have been developed to improve function and reduce risks. Coils coated with bioactive and biodegradable polymers demonstrate an improved tissue response in comparison to bare metal coils, but are susceptible to recanalization during polymer degradation.6 HydroCoils are coated with a bioinert, porous hydrogel material that swells after implantation to displace blood within the aneurysm volume and increase aneurysm occlusion.7,8 While major aneurysm recurrences are reduced with HydroCoils, their long-term clinical outcomes are still unclear.9 As an alternative approach, an innovative integration of coils with shape memory polymer (SMP) foams is being developed to improve occlusion rates and healing response.10 SMPs are materials that have the ability to transition between a primary and secondary shape after application of an external stimulus, such as heat.11 The new SMP-based aneurysm occlusion device comprises a SMP foam crimped over a nickel-titanium (nitinol) and platinum wire backbone.10,12 These devices are delivered in their low-profile secondary, crimped shape to the aneurysm via a micro-catheter, after which they expand in response to heating at body temperature to space-fill the aneurysm. SMP-coated coils show rapid clotting, improved volumetric filling, and superior healing in comparison to bare metal coils.12
One limitation of the SMP foams is their anisotropic pore geometries, or pores that are elongated in the foaming direction. The elongated pores are more susceptible to mechanical deformation, such as cell collapse and strut fracture.13,14 These deformations reduce the mechanical properties and inhibit total volume recovery (strain recovery) of the material. Additionally, strut fracture increases the risk of particulate release during implantation, which could cause adverse downstream clotting. To address these concerns, we hypothesized that chemical modification of SMP foams with diethanolamine (DEA) could yield more isotropic pores and enhance mechanical properties. The molecular structure of DEA lends itself to the formation of urea linkages through the reaction between the secondary amine and isocyanate groups, Figure 1. These linkages produce a more rigid polymer backbone that may reduce deformation during foam blowing to yield more isotopic pores. Additionally, changing the chemical composition of the polymer provides a new mechanism for tuning the working time of catheter-delivered devices. The working time is related to expansion kinetics and is defined as the time that a clinician has to deliver a compressed foam through a microcatheter before the foam expands to a diameter that is larger than that of the catheter inner diameter. In this work, SMP foams were synthesized with DEA, and their pore geometry, thermal and mechanical properties, volume recovery profiles, and micro-fracture susceptibility were evaluated relative to previously developed triethanolamine (TEA)-based SMP foams.
Figure 1.

Monomers utilized in SMP foam synthesis and schematic representation of idealized resulting polyurethane-urea network, with urethane linkages (result of hydroxyl-isocyanate reactions) designated as green-outlined squares and urea linkages (result of secondary amine-isocyanate reactions) designated as purple pentagons. Schematic does not take urea formation from water addition in foaming into consideration.
EXPERIMENTAL
Materials
The following chemicals were obtained and used as received: DEA (99%; Sigma-Aldrich Inc., St. Louis, MO), TEA (99%; Sigma-Aldrich Inc.), N,N,N',N'-tetrakis(2-hydroxypropyl)ethylene-diamine (HPED, 99%; Sigma-Aldrich Inc.), (trimethyl-1,6-hexamethylene diisocyanate, 2,2,4- and 2,4,4- mixture (TMHDI), 97%; TCI America Inc., Portland, OR), hexamethylene diisocyanate (HDI, 98%; TCI America Inc., Portland, OR), ethanol (95%; Deacon Labs Inc., King of Prussia, PA), DC 198 (Evonik Industries, Essen, Germany), DC 5943 (Evonik Industries), BL-22 (Evonik Industries), T-131 (Evonik Industries), Enovate 245fa (Honeywell International, Inc., Morris Plains, NJ), and deionized (DI) water (Millipore water purifying system, Millipore Inc., Billerica, PA).
Foam synthesis
All foams were synthesized using a two-step protocol.15 The prepolymer mix was made by first reacting HPED with an excess of TMHDI and/or HDI for 24 h. As the HPED and TMHDI/HDI reaction neared completion, DEA or TEA was added, and the reaction vessel was agitated until the mixture became transparent. The prepolymer mix was cured using a heating cycle of 6 h at room temperature, heating at 20 ° C h−1 until the temperature reached 50 °C, and holding at 50 °C for 16 h. In the second step, a hydroxyl premix was made by combining the remaining stoichiometric amounts of DEA or TEA and HPED with surfactants (DC 198 and DC 5943), catalysts (BL-22 and T-131), and DI water. The prepolymer mix, hydroxyl premix, and a physical blowing agent (Enovate 245fa) were combined to produce a foam, which was cured for 20 min at 90 °C. The first series of 32 g foams contained varying amounts of DEA added at 0, 10, 20, and 30 hydroxyl/amine mol %, Table I. The remaining mole percentage of hydroxyl groups came from HPED, and the isocyanate content for all foams was 100% TMHDI. The second series of 32 g foams contained 20 hydroxyl/amine mol % DEA and 80 hydroxyl mol % HPED. The isocyanate content was varied at 0, 30, 50, 70, and 100 isocyanate mol % HDI, with the remaining percent of isocyanate groups from TMHDI. A control foam was synthesized with 100% TMHDI (isocyanate content), and a hydroxyl content of 30 mol % TEA and 70 mol % HPED, Table I. The density, pore size, and mechanical properties of all of the foams were characterized before the cleaning process. To clean, samples were submerged in 1000 mL of isopropyl alcohol (IPA) and sonicated for 2, 15 min cycles, with IPA refreshed between cycles. Reverse osmosis (RO) water was used in a third 15 min wash with sonication. Samples were then dried at 100 °C under vacuum for 12 h. After cleaning, the remaining characterizations were performed.
Table I.
Synthesized foam formulations
| Foam series | Foam ID | Isocyanate mol % |
Hydroxyl/amine mol % |
|||
|---|---|---|---|---|---|---|
| TMDHI (%) | HDI (%) | HPED (%) | TEA | DEA (%) | ||
| 0% HDI | Control | 100 | – | 70 | 30% | – |
| 0% DEA | 100 | – | 100 | – | – | |
| 10% DEA | 100 | – | 90 | – | 10 | |
| 20% DEA | 100 | – | 80 | – | 20 | |
| 30% DEA | 100 | – | 70 | – | 30 | |
| 20% DEA | 0% HDI | 100 | – | 80 | – | 20 |
| 30% HDI | 70 | 30 | 80 | – | 20 | |
| 50% HDI | 50 | 50 | 80 | – | 20 | |
| 70% HDI | 30 | 70 | 80 | – | 20 | |
| 100% HDI | – | 100 | 80 | – | 20 | |
Spectral characterization
A foam slice was taken from each cleaned foams and placed into a Brunker ALPHA Infrared Spectrometer (Bunker, Billerica, MA). Thirty-two backgrounds scans were performed on each sample before 64 sample scans were obtained. The attenuated total reflectance Fourier transform infrared spectrum was collected in absorption mode with a resolution of 4 cm−1. Using OPUS software, the background scan was subtracted from the sample scan, and a baseline correction and atmospheric compensation were applied. This process was repeated three times for each composition. OriginPro software was utilized to perform deconvolution on the three peaks between 1500 and 1750 cm−1 and then to find the areas under the urea (~1647 cm−1) and urethane (~1698 cm−1) peaks. The ratio of the urethane:urea peak area was calculated to quantify relative urea content.
Density
Sample cubes were cut from three different horizontal positions within the foam using a wire cutter. The length, width, and height of the cubes were measured. The measurements were repeated three times for accuracy. The masses of the cubes were taken, and the densities were calculated in g cm−3.
Pore size characterization
Slices were cut from the center of the foam in the axial and transverse directions. The samples were mounted on a stage and sputter-coated with gold using a Cressington Sputter Coater (Ted Pella, Inc., Redding, CA) for 60 s at 20 mA. The samples were then imaged using a Joel NeoScope JCM-5000 Scanning Electron Microscope (SEM) (Nikon Instruments Inc., Melville, NY) at 10–15× magnification at 5 kV under high vacuum. The pore sizes were measured from the images using ImageJ software (National Institute of Health, Bethesda, MD). Pore sizes were calculated as the average of the major axis length of ten pores randomly selected within each image.
Thermal characterization
Dry samples (n = 5) of approximately 10 mg were cut and placed in a TA Tzero aluminum hermetic pan for differential scanning calorimetry (DSC) using a Q200 TA DSC with a TA Refrigerated Cooling System 90 (TA Instruments, New Castle, DE). The pans were sealed and loaded into the test cell at room temperature. The dry samples were equilibrated at −40 °C and then ramped to 120 °C at a rate of 10 °C min−1. The samples were held isothermally at 120 °C for 2 min and then cooled to −40 °C at a rate of 10 °C min−1. The samples were held isothermally at −40 °C for 2 min and then heated back to 120 °C at a rate of 10 °C min−1.
Five additional specimens were prepared from each foam type by adding approximately 1 mg of DI water at 50 °C. The samples were reweighed, sealed in a Tzero pan at room temperature, and vented before being loaded into the Q200 DSC. The wet samples were equilibrated at −40 °C and held isothermally for 5 min, then ramped to 120 °C at a rate of 10 °C min−1. The glass transition temperature (Tg) for both wet and dry samples was identified as the half-height transition point from the last heating cycle using TA Universal Analysis software (TA Instruments).
Shape memory characterization
Volume recovery profiles were determined by expanding crimped samples (n = 3) in a heated water bath. Cylindrical samples were cut to 4 mm in diameter and 1 cm in length. The samples were then threaded onto a nickel-titanium (nitinol) wire with a diameter of 203.20 μm (Nitinol Devices and Components Inc., Fremont, CA) and radially compressed to the smallest possible diameter (~0.75 mm) using an ST 150-42 stent crimper (Machine Solutions, Flagstaff, AZ). The samples were heated to 100 °C using the stent crimper, held isothermally for 15 min, and then cooled to room temperature. An image was taken before and after radial crimping. Once the samples were crimped, they were stored in a dry container for 24 h to ensure complete shape-setting of the foam, and to allow for any relaxation to occur. After 24 h, the samples were submerged in a 37 °C RO water bath, and images were taken at set time points over 30 min. After 30 min, the samples were removed from the water bath, dried with compressed air for approximately 5 min and placed back into a container to dry for 24 h at room temperature. After the samples were dry, they were submerged in a 50 °C RO water bath, and images were taken at set time points over 30 min.
The volume recovery profiles were determined using Matlab (Mathworks Inc., Natick, MA) to find the average sample diameter at each time point. The change in diameter over time was plotted to generate the volume recovery profiles. The working time was defined as the time at which the diameter was larger than the inner diameter of the six French microcatheter used for aneurysm device deployment (1.6 mm), which would prevent further delivery during the implantation process.12
Mechanical characterization
Samples (n = 10) were prepared by cutting 3 mm thick slices of foams into a dog-bone shape (ASTM standard IV). After the samples were cut, they were secured into wooden stubs using epoxy to prevent sample damage from the clamps. The samples were then secured into the Insight 30 Material Tester (MTS Systems Corporation, Eden Prairie, MN), and stretched at a constant strain rate of 5 mm min−1. The resulting stress–strain curve was used to determine Young’s modulus, toughness, tensile strength, and strain at break.
Micro-fracture characterization
A sample cube was cut from the center of each foams. After cleaning, the sample was mechanically compressed at room temperature to 50% of the original width and height measurements using a Carver Press (Carver Inc., Wabash, IN). Slices were taken from the axial and transverse directions of the cube after compression. The slices were imaged using a Leica Microscope (Leica Biosystems, Wetzlar, Germany) with a Jenoptik camera (Jenoptik, Jena, Germany). The resulting images were used to manually count the number of strut fractures or cell collapses per 1 mm2 of foam surface.
RESULTS AND DISCUSSION
Spectral characterization
Selected FTIR spectral regions are identified in Figure 2. The hydrogen-bonded urethane C═O stretch (1698 cm−1) identifies the polyurethane system. The increase in the relative peak height for the hydrogen-bonded urea C═O shoulder (1647 cm−1) with increasing DEA content indicates successful incorporation of DEA via reactions between its amine group and the isocyanate functional groups, providing a polyurethane-urea foam. To quantify this result, the ratio of the areas under the urethane and urea peaks was calculated for each foams. A general decrease in the urethane:urea peak area was found with increasing DEA concentration (0% DEA: 1.46, 10% DEA: 1.38, 20% DEA: 1.40; 30% DEA: 1.30). This quantification confirms increased urea content with increased DEA concentration.
Figure 2.

Attenuated total reflectance Fourier transform infrared (ATR-FTIR) spectra of DEA-containing SMP foams, demonstrating relative increases in the urea peak at 1647 cm−1 with increasing amounts of DEA.
Foam density and pore size
There were minimal changes in foam density with increasing amounts of DEA or with varied isocyanate monomer ratios, Table II. Thus, these materials still display the ultralow density (<0.093 g cm−3) that is characteristic of the crosslinked SMP system.15
Table II.
Effects of increasing DEA content and increasing HDI content on foam density
| Foam series | Foam ID | Density |
|---|---|---|
| 0% HDI | 30% TEA control | 0.015 ± 0.004 |
| 0% DEA | 0.023 ± 0.005 | |
| 10% DEA | 0.020 ± 0.001 | |
| 20% DEA | 0.020 ± 0.001 | |
| 30% DEA | 0.018 ± 0.001 | |
| 20% DEA | 0% HDI | 0.020 ± 0.001 |
| 30% HDI | 0.017 ± 0.001 | |
| 50% HDI | 0.018 ± 0.001 | |
| 70% HDI | 0.015 ± 0.001 | |
| 100% HDI | 0.020 ± 0.001 |
The axial pore size of the foams remained relatively constant with changes in alcohol and isocyanate monomer ratios, as seen in Figure 3(a). In the 0% HDI series, incorporation of DEA resulted in more isotropic pores, or pores that have similar diameters in the axial and transverse directions; this trend can be viewed in Figure 3(b) qualitatively in images and quantitatively in the axial to transverse ratio calculations below images. This observation correlates with previous studies that utilized DEA, which qualitatively show a similar result using SEM images.16 This result can be attributed to the increased reactivity of the amine groups in DEA with isocyanates (relative uncatalyzed reaction rates with isocyanates of secondary aliphatic amine: 20,000–50,000 and of primary hydroxyl: 100),17 thus causing faster/more efficient crosslinking and restricting foam rise.16 In the 20% DEA ratio series, the introduction of HDI led to more anisotropic pores, or pores that have different diameters in the axial and transverse directions, Figure 3(c). Anisotropicity was maximized at 50% HDI (ratio of 1.76), with improved isotropicity in the 70% and 100% HDI foams (1.39 and 1.26, respectively). It is hypothesized that this result is due to different reaction rates between the two isocyanate components and the hydroxyl and amine groups, causing variations in foam rise during the reaction. Namely, increasing steric hindrance by adding bulky substituents (e.g., methyls on THMDI) reduce isocyanate reactivity and catalyst efficacy.17 Bubble formation in foaming is highly dependent upon polymer viscosity, which is increased as isocyanates are consumed.18 Thus, by making the isocyanate species more homogenous, pore isotropicity may be improved by providing a more consistent change in viscosity during foaming. It should also be noted that while all foams had a mixture of open and closed cells, the 100% HDI foam had qualitatively more open pores. This foam would theoretically be the fastest to crosslink, which may have enabled pore opening by providing a high enough viscosity in combination with a low elasticity to prevent bubble growth and promote membrane rupture.19,20 In general, these results demonstrate that DEA can be incorporated into SMP foams while maintaining the low density and high porosity of control formulations, and they indicate that DEA incorporation can be utilized to enhance pore isotropicity during foaming. Furthermore, DEA-containing foams can be synthesized with other monomer variables (e.g., isocyanate content) to provide a tunable SMP system.
Figure 3.

(a) Pore sizes of DEA-containing SMP foams in the axial and transverse foaming directions based off of scanning electron micrographs, N = 10; mean ± standard deviation displayed. (b) Representative SEM images of 0% HDI foam series with isotropicity (axial:transverse ratio) measurements shown below. (c) Representative SEM images of 20% DEA foam series with isotropicity (axial:transverse ratio) measurements shown below. Scale bar applies to all images.
Foam thermal and shape memory properties
A slight increase in Tg occurred with the inclusion of DEA, from 65 ± 1 °C for 0% DEA to 69–70 °C for 10–30% DEA, as seen in Figure 4. This small change could be attributed to the increased stiffness around the substituted urea, but overall, dry Tg’s were maintained with the inclusion of DEA. No discernable trends were observed between DEA content and wet Tg, with all wet Tg measurements between 35 and 37 °C.
Figure 4.

Glass transition temperatures (Tg’s) of DEA-containing SMP foams under wet and dry conditions. N = 6; mean ± standard deviation displayed.
Increasing the amount of HDI in the foam decreased the dry Tg from 70 ± 2 °C for 0% HDI to 55 ± 2 °C for 100% HDI, while the wet Tg was unaffected. The behavior under dry conditions is most likely due to the decreased rigidity of HDI compared with TMHDI, due to the lack of pendent methyl groups, and it correlates with results that our group has seen previously and with the general rule that reduced backbone rigidity lowers polymer Tg.15,21 Based on previous results, it was hypothesized that the wet Tg would also be decreased with increased HDI content due to reduced hydrophobicity with fewer methyl groups.22,23 However, we hypothesize that the lack of methyl groups simultaneously allowed for closer chain arrangement to enable stronger hydrogen bond formation between chains. These conflicting factors resulted in a consistent wet Tg with varied HDI concentration.
The working time is defined as the time until the foam diameter is larger than the inner diameter of a catheter used to deliver it to the treatment site, which would prevent its further delivery. Based upon a 1.45 mm inner diameter catheter previously utilized for delivery of SMP-based devices in a porcine aneurysm model, foam expansion of the 0% HDI series demonstrated a working time of greater than 30 min, as seen in Figure 5(a) (left panel).12 To further characterize the expansion profiles, the temperature was increased to 50 °C after 30 min at 37 °C (Figure 5(a), right panel). Increased foam expansion can be observed in the following 30 min, but diameters reached <50% of the original diameter. The combination of hydrophobic groups on TMHDI and increased steric hindrance around substituted ureas on DEA slows down water plasticization to limit shape recovery. A general trend of slower shape recovery with increased DEA content can be observed. Final diameters of 1.6 ± 0.2, 1.7 ± 0.4, 1.6 ± 0.2, and 1.2 ± 0.1 mm were achieved for 0, 10, 20, and 30%, respectively.
Figure 5.
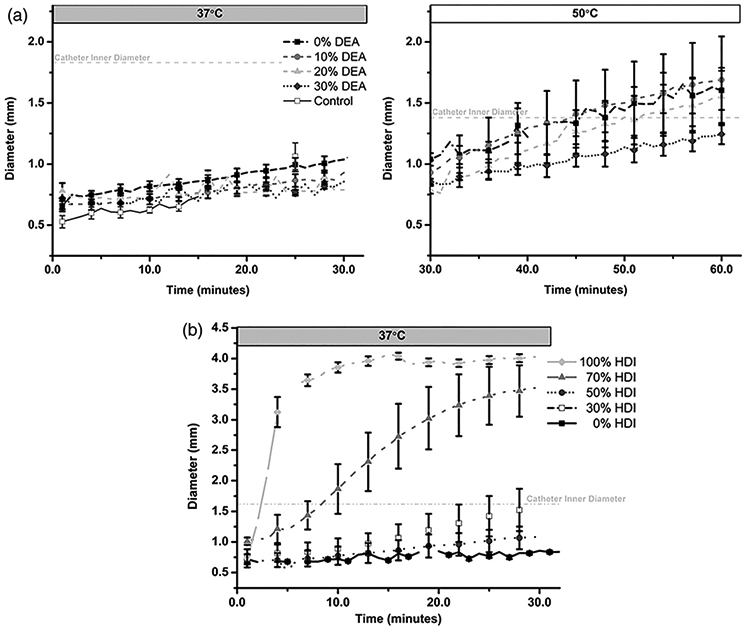
Shape recovery profiles of SMP foams. (a) Expansion of the 0% HDI series of foams with varied DEA content (left panel: 0–30 min at 37 °C; right panel: 30–60 min at 50 °C) and (b) expansion of the 20% DEA series of foams with varied isocyanate content. Catheter inner diameter is designated with dashed line at 1.6 mm. (fully expanded diameter = 4 mm) N = 3; mean ± standard deviation displayed.
Analysis of foam expansion within the 20% DEA series showed that the working time can be tuned with the isocyanate content from >30 min (0 and 30% HDI) to 2.4 ± 0.6 min as HDI concentration was increased to 100%, Figure 5(b). This result is attributed to increased hydrophilicity and reduced backbone stiffness of the isocyanate component, which occurs with the removal of pendent methyls, ultimately providing a network that plasticizes more rapidly in solvent.15 Final diameters of 1.7 ± 0.4, 1.6 ± 0.3, 1.1 ± 0.2, 3.5 ± 0.4, and 4.0 ± 0.7 mm were achieved for 0, 30, 50, 70, and 100% HDI, respectively.
Mechanical characterization
Within the 0% HDI series, Young’s modulus was generally increased with inclusion of DEA, with a large increase in the 30% DEA sample, Figure 6(a). Strain at break was relatively unaffected by DEA content, Figure 6(b). Increasing the amount of DEA in the foam up to 30% increased the ultimate tensile strength to 231 ± 23 kPa (vs. 144 ± 30 kPa for 0% DEA and 84 ± 7 kPa for 30% TEA control formulations), Figure 6(c). These trends were expected due to the more robust mechanical properties imbued by the urea linkages and the more isotropic pore structure.16 In general, increased urea content is associated with increased stiffness, strength, and ultimate elongation in polyurethane urea scaffolds.24,25 Similarly, more regular pore structure imparts increased stiffness, strength, and ultimate elongation in three-dimensional foams.26,27 Correspondingly, increasing the amount of DEA increased the toughness by 3.1–3.6× compared to the control (30% TEA), Figure 6(d). This result is also attributed to the introduction of substituted urea linkages and improved pore structure, both of which contribute to improved ultimate elongation and strength, to enhance toughness.18,24-26
Figure 6.
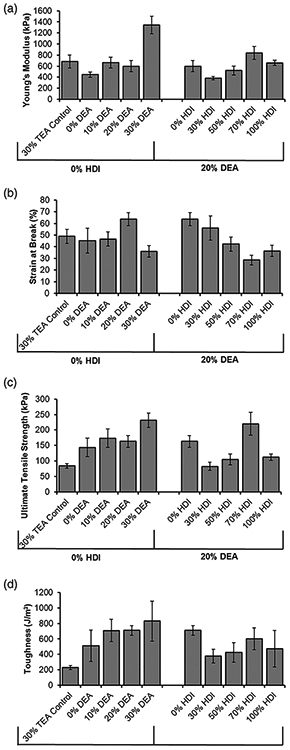
Tensile testing data of SMP foams. (a) Young’s modulus, (b) strain at break, (c) ultimate tensile strength, and (d) toughness. N = 10; mean ± standard deviation displayed.
Within the 20% DEA series, modulus dropped between the 0 and 30% HDI samples and then steadily increased with increased HDI content, Figure 6(a). Strain at break decreased with increased HDI content, Figure 6(b). The opposite effects were hypothesized to occur, as HDI is less stiff than TMHDI due to the lack of bulky pendent methyl groups. This reduced stiffness should translate to increased strain at break in bulk materials28; however, due to the porous structure of the examined materials, it is hypothesized that the relatively anisotropic pores in the HDI-containing foams introduced a more brittle behavior to increase stiffness and reduce strain at break in these samples.27 In general, the addition of HDI in the 20% DEA series decreased the ultimate tensile strength with the exception of the 70% HDI foam [Figure 6(c)] and decreased foam toughness by 1.2–1.9× [Figure 6(d)]. These changes are also attributed to pore anisotropicity in the 20% DEA series. In general, the mechanical properties of foams can be affected by material chemistry (e.g., effects of urea vs. urethane linkages), pore size, and pore structure (e.g., isotropicity). The gas blowing process is complex, resulting in inter-related material variables that are difficult to decouple when discerning trends. However, these results demonstrate that DEA incorporation can be used as a tool to tune scaffold variables and increase overall foam toughness. Additionally, DEA can be used in conjunction with other monomer variables (e.g., hydrophobicity) to further tune scaffold properties.
Micro-fracture characterization
Micro-fractures were manually counted as strut fractures and cell collapses in cross-sectional images of foams after mechanical compression. The DEA foams contained fewer micro-fractures than the TEA foam in the axial and transverse directions, as seen in Figure 7(a). These results can be qualitatively observed in Figure 7(b), where micro-fractures are highlighted in representative images. Reduced micro-fractures correlates with increased toughness in the 30% DEA foam and may be due to the strength of the secondary bonds between urea linkages, as was originally hypothesized.
Figure 7.

Micro-fracture characterization of SMP foams. (a) Quantified number of micro-fractures observed in the axial and transverse foaming directions for DEA versus TEA foams. (b) Representative images utilized to quantify micro-fractures. Visible micro-fractures are highlighted in the axial and transverse directions for the three foams studied. Inset on the control axial image (b) corresponds to the boxed area of the image to highlight a representative strut fracture and inset on the control transverse image (b) corresponds to the boxed area of the image to highlight a representative cell collapse.
Overall, the inclusion of DEA into SMP foams is a feasible method for enhancing pore isotropicity, increasing foam toughness, and reducing micro-fractures. DEA-containing foams have otherwise comparable physical, thermal, and shape memory properties to their controls, and these properties can be tuned by altering the composition of other foaming monomers, such as the isocyanate component. Minimizing particulate generation is essential to the safe use of SMP foams in medical devices, as small pieces of embolic foam that break off could have deleterious downstream effects.10,12,29-31 DEA incorporation provides a tool to retain the desirable properties of SMP foams while enhancing toughness and reducing micro-fractures. This approach has potential to improve the safety of SMP-based medical devices by reducing the chances of particulate generation.
CONCLUSIONS
In this work, DEA was successfully incorporated into SMP foams with the intent of improving the mechanical properties and forming isotropic pores. The incorporation of DEA was confirmed using FTIR. Examination of the foams revealed more isotropic pores as the DEA concentration was increased. The inclusion of DEA increased foam toughness without a substantial impact on the strain at break compared to the control. This method also allows for the tailoring of working time despite the inherent upper threshold of 30% DEA loading. These results indicate that the inclusion of DEA improves the mechanical properties and processing capabilities of SMP foams. The new DEA containing foams are more mechanically robust, which is hypothesized to potentially reduce/prevent SMP foam-based device failures.
ACKNOWLEDGMENTS
We would like to acknowledge support from the National Institutes of Health, National Institute of Neurological Diseases and Stroke Cooperative Program in Translational Research (U01NS089692, DJM).
Footnotes
CONFLICT OF INTEREST
Andrew C. Weems holds stock in Shape Memory Medical, Inc. (SMM), which holds a license for the shape memory polymers in this work. Sayyeda M. Hasan is currently employed by SMM and also holds stock options. Duncan Maitland owns stock and is on the board of directors at SMM.
REFERENCES
- 1.Chalouhi N; Hoh BL; Hasan D Stroke. 2013, 44, 3613. [DOI] [PubMed] [Google Scholar]
- 2.van Gijn J; Kerr RS; Rinkel GJ E. Lancet 2007, 369, 306. [DOI] [PubMed] [Google Scholar]
- 3.Guglielmi G; Vinuela F; Sepetka I; Macellari VJ Neurosurg. 1991, 75, 1. [DOI] [PubMed] [Google Scholar]
- 4.Murayama Y; Nien YL; Duckwiler G; Gobin YP; Jahan R; Frazee J; Martin N; Vinuela F J.Neurosurg 2003, 98, 959. [DOI] [PubMed] [Google Scholar]
- 5.Raymond J; Guilbert F; Weill A; Georganos SA; Juravsky L; Lambert A; Lamoureux J; Chagnon M; Roy D Stroke. 2003, 34, 1398. [DOI] [PubMed] [Google Scholar]
- 6.McDougall CG; Johnston SC; Gholkar A; Barnwell SL; Vazquez Suarez JC; Masso Romero J; Chaloupka JC; Bonafe A; Wakhloo AK; Tampieri D; Dowd CF; Fox AJ; Imm SJ; Carroll K; Turk AS; Investigators M. A. P. S. Am. J. Neuroradiol 2014, 35, 935. [DOI] [PMC free article] [PubMed] [Google Scholar]
- 7.Cloft HJ; Kallmes DF Am. J. Neuroradiol 2004, 25, 60. [PMC free article] [PubMed] [Google Scholar]
- 8.Ding YH; Dai D; Lewis DA; Cloft HJ; Kallmes DF Am. J. Neuroradiol 2005, 26, 1757. [PMC free article] [PubMed] [Google Scholar]
- 9.White PM; Lewis SC; Gholkar A; Sellar RJ; Nahser H; Cognard C; Forrester L; Wardlaw JM; HELPA trial collaborators. Lancet. 2011, 377, 1655.21571149 [Google Scholar]
- 10.Boyle AJ; Landsman TL; Wierzbicki MA; Nash LD; Hwang W; Miller MW; Tuzun E; Hasan SM; Maitland DJJ Biomed. Mater. Res. B: Appl. Biomater 2016, 104, 1407. [DOI] [PMC free article] [PubMed] [Google Scholar]
- 11.Lendlein A; Kelch S Angew. Chem. Int. Ed 2002, 41, 2034. [PubMed] [Google Scholar]
- 12.Horn J; Hwang W; Jessen SL; Keller BK; Miller MW; Tuzun E; Hartman J; Clubb FJ Jr.; Maitland DJJ Biomed. Mater. Res. B: Appl. Biomater 2017, 105, 1892. [DOI] [PMC free article] [PubMed] [Google Scholar]
- 13.Ridha M; Shim VPW; Yang LM Key Eng. Mater 2006, 306–308, 43. [Google Scholar]
- 14.Gong L; Kyriakides S Int. J. Solids Struct 2005, 42, 1381. [Google Scholar]
- 15.Singhal P; Boyle A; Brooks ML; Infanger S; Letts SD; Small WD; Maitland DJ; Wilson TS Macromol. Chem. Phys 2013, 214, 1204. [DOI] [PMC free article] [PubMed] [Google Scholar]
- 16.Dounis DV; Wilkes GL J. Appl. Polym. Sci 1997, 65, 525. [Google Scholar]
- 17.Saunders JH; Frisch KC Kinetics and Catalysis of the Isocyanate Reactions; Interscience Publishers: New York, NY, 1962; p 129. [Google Scholar]
- 18.Saunders JH; Frisch KC Formation of Urethane Foams; Interscience Publishers: New York, NY, 1962; p 219. [Google Scholar]
- 19.Yasunaga K; Neff RA; Zhang XD; Macosko CW J. Cell. Plast 1996, 32, 427. [Google Scholar]
- 20.Neff RA; Macosko CW Rheol. Acta 1996, 35, 656. [Google Scholar]
- 21.Wang R; Zheng S; Zheng Y Matrix Materials; Woodhead Publishing: Cambridge, UK, 2011; p 101. [Google Scholar]
- 22.Hasan SM; Raymond JE; Wilson TS; Keller BK; Maitland DJ Macromol. Chem. Phys 2014, 215, 2420. [DOI] [PMC free article] [PubMed] [Google Scholar]
- 23.Weems AC; Boyle AJ; Maitland DJ Smart Mater. Struct 2017, 26, 035054. [DOI] [PMC free article] [PubMed] [Google Scholar]
- 24.Sheth JP; Aneja A; Wilkes GL; Yilgor E; Atilla GE; Yilgor I; Beyer FL Polymer. 2004, 45, 6919. [Google Scholar]
- 25.Rosthauser JW; Haider KW; Steinlein C; Eisenbach CD J. Appl. Polym. Sci 1997, 64, 957. [Google Scholar]
- 26.Ashby MF; Medalist RFM Metall. Trans 1983, 14, 1755. [Google Scholar]
- 27.Ridha M; Shim VPW Exp. Mech 2008, 48, 763. [Google Scholar]
- 28.Kojio K; Furukawa M; Nonaka Y; Nakamura S Materials. 2010, 3, 5097. [DOI] [PMC free article] [PubMed] [Google Scholar]
- 29.Singhal P; Small W; Cosgriff-Hernandez E; Maitland DJ; Wilson TS Acta Biomater. 2014, 10, 67. [DOI] [PMC free article] [PubMed] [Google Scholar]
- 30.Nathan AL; Fletcher GK; Monroe MBB; Hwang W; Herting SM; Hasan SM; Keller BK; Maitland DJ J. Med. Device 2016, 11, 110091. [DOI] [PMC free article] [PubMed] [Google Scholar]
- 31.Bluestein D; Rambod E; Gharib MJ Biomech. Eng 2000, 122, 125.N = 6; mean ± standard deviation displayed. [DOI] [PubMed] [Google Scholar]