

Abstract
B lymphoma Mo-MLV insertion region 1 (BMI1) has been reported to be an oncoprotein. BMI1 represses tumor suppressors to promote cell proliferation, epithelial-mesenchymal transition (EMT), and cancer progression. Although it is known that the expression of BMI1 is increased in many cancer types, the mechanism of BMI1 upregulation is not yet clear. We performed integrative analysis for 3 sets of prostate cancer (PCa) genomic data, and found that BMI1 and androgen receptor (AR) were positively correlated, suggesting that AR might regulate BMI1. Next, we showed that dihydrotestosterone (DHT) upregulated both mRNA and protein levels of BMI1 and that BMI1 was increased in castration-resistant prostate cancer (CRPC) from both human patients and a mouse xenograph model. We further identified an AR binding site in the promoter/enhancer region of BMI1, and confirmed BMI1 as the direct target of AR using gene-editing technology. We also demonstrated that high expression of BMI1 is critical for the development of castration-resistance. Our data also suggest that BMI1-specific inhibitors could be an effective treatment of CRPC.
Introduction
BMI1 is a core member of Polycomb Repressive Complex 1 (PRC1). BMI1 plays important roles in many pathological progresses, such as cancer stem cell maintenance, differentiation, and EMT [1, 2]. BMI1 interacts with RING1B (also known as RNF2), another PRC1 core protein, to enhance its histone H2A ubiquitin E3 ligase activities and repress downstream targets.
BMI1 is expressed in normal prostate luminal epithelial cells, with an unveiled role in PCa development [3]. BMI1 is enriched in a population of PCa cells that have higher tumor-initiating capacities, and high expression of BMI1 is strongly correlated with PCa, with adverse pathologic and clinical outcomes [4]. Further, the presence of BMI1 in lower-grade PCa specimens is intensely predictive of detectable serum levels of prostate-specific antigen (PSA) (i.e., PSA recurrence) [4]. Also, BMI1 expression was highly correlated with therapy failure and poor survival in five types of epithelial tumors, including PCa [5]. However, the mechanism for dysregulation of BMI1 in PCa is not yet clear.
AR is a critical regulator for PCa development and progression. Blocking AR signaling is the mainstay in PCa therapy. When activated by androgen, AR complexes with DNA at androgen response elements (AREs) in the promoter or enhancer regions of target genes. Although AR and BMI1 are both abundantly expressed in PCa, whether there is a regulatory network between AR and BMI1 has not been determined. Very recently, we have reported that BMI1 directly binds to AR and regulates AR protein stability and signaling [6]. In this study, we investigated if and how AR regulates BMI1 expression and function. We also examined if BMI1 has any functions involved in castration-resistance.
Results
Expression of BMI1 and AR is positively correlated in PCa
We initially analyzed the TCGA prostate adenocarcinoma RNA-Seq dataset and observed that the expression levels of BMI1 and AR were positively correlated, R = 0.615 (Figure 1A, left panel). However, other PRC1 components, including RING1A, RING1B, SCML4, PCGF6, PHC, and CBX genes, were weakly or negatively correlated with AR (Figure 1B, left panel; Supplementary Figure 1A–H, left panel). To further confirm this observation, we analyzed two additional datasets (MSKCC and Michigan) for PCa gene expression profiling [7, 8]. Consistently, BMI1 expression levels were positively correlated with AR levels (R ≥ 0.613), while other PRC1 components were not (Figure 1A and 1B, middle and right panels; Supplementary Figure 1A–H, middle and right panels). In addition, the positive correlation of BMI1 levels with AR activities was statistically significant, which was supported by higher levels of well-known target genes of AR in the BMI1-high expression group compared (all p values < 0.05) with the BMI1-low expression group (Figure 1C–E). This result suggests a regulatory link between BMI1 and AR in PCa.
Figure 1.
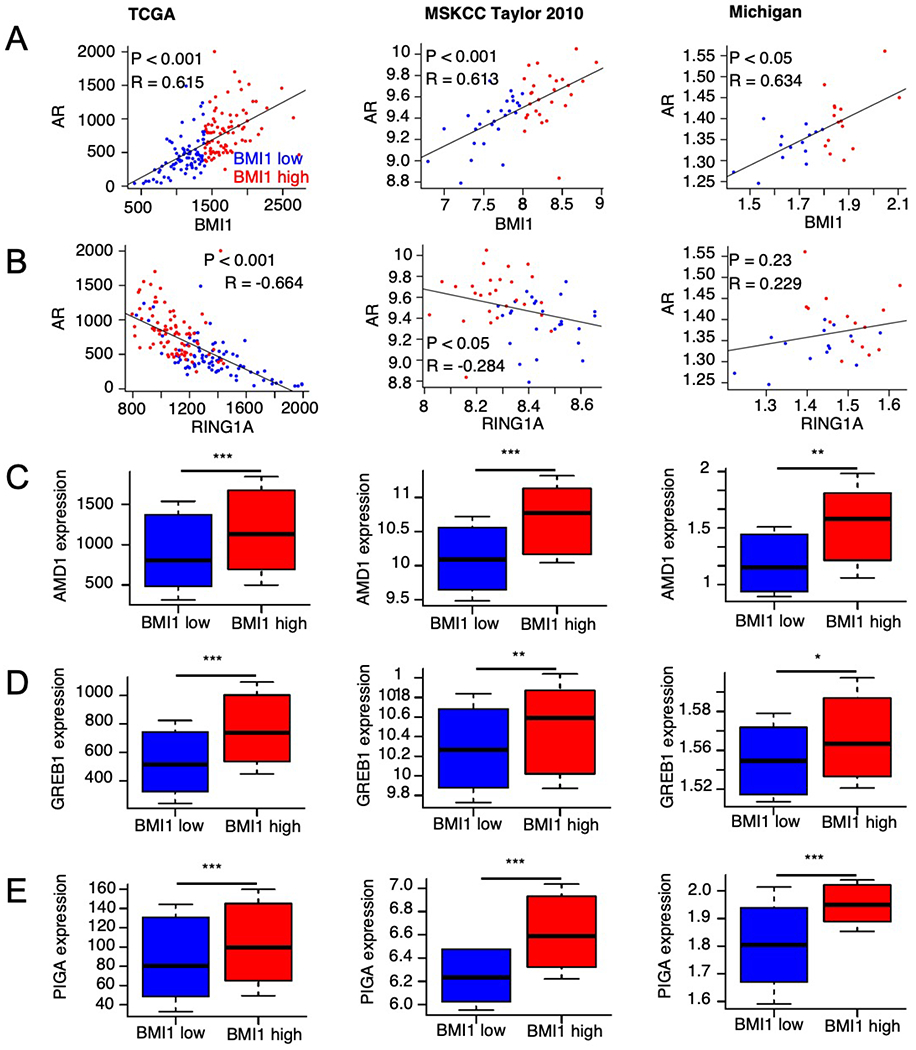
AR and BMI1 are significantly and positively correlated in PCa patients. Scatter plots for expression values of AR against BMI1 (A) and RING1A (B) in patient samples from the TCGA (left panels), MSKCC (middle panels), and Michigan projects (right panels), respectively. Boxplots for expression values of AR target genes AMD1 (C), GREB1 (D), and PIGA (E) in patients that display low or high BMI1 expression levels based on data from the TCGA (left panels), MSKCC (middle panels), and Michigan (right panels) projects, respectively. P values were determined by significance tests of the correlation coefficient (A-B) and Wilcoxon tests (C-E). Correlation coefficient values were determined by the Pearson method (A-B). *p < 0.05, **p < 0.01, ***p < 0.001 vs. BMI1 low.
BMI1 is regulated by AR signaling in PCa cells
Very recently, we reported that AR is regulated by BMI1 at the protein level, but not at the transcript level [6]. To test whether BMI1 is regulated by AR signaling, we first examined the expression levels of BMI1 in castration-resistant prostate cancer (CRPC) cell lines C4-2 and LNCaP-abl, along with its parental androgen-dependent, non-CRPC LNCaP cell line. As shown in Figure 2A and Supplementary Figure 2A, the AR protein levels were much higher in CRPC cell lines C4-2 and LNCaP-abl compared with the non-CRPC cell line LNCaP. Consistent with increased AR expression, both transcript and protein levels of BMI1 were elevated in the CRPC cell lines. To investigate whether AR directly regulates BMI1, we cultured LNCaP, C4-2, and LNCaP-abl cells in androgen-depleted medium (5% charcoal-stripped fetal bovine serum [FBS] in phenol red-free medium) for 2 days, and then stimulated with 5nM dihydrotestosterone (DHT). As expected, BMI1, along with AR and the well-known androgen-induced gene KLK3 (i.e., PSA), were markedly increased by DHT treatment (Figure 2B). To further confirm this finding, we performed time-course analysis. First, LNCaP and C4-2 cells were treated with DHT for different time periods after culturing for 2 days in androgen-depleted medium. As demonstrated in Figure 2C–D and Supplementary Figure 2B–C, PSA and BMI1 decreased substantially in the absence of androgen. Further, DHT treatment, which activated AR signaling (significantly increased PSA levels), restored the expression of BMI1. Furthermore, we examined BMI1 mRNA levels post-DHT treatment at 2, 4, 8, and 16 h, and observed that DHT started to stimulate the BMI1 gene expression by 0.636-fold (p = 0.0018) after 2 h of treatment. However, the proliferation of cells did not increase before 8h post treatment (Figure 2E and Supplementary Figure 2D). These results suggest that AR signaling regulates BMI1 at the transcriptional level, and this regulation is independent of cell proliferation rate.
Figure 2.
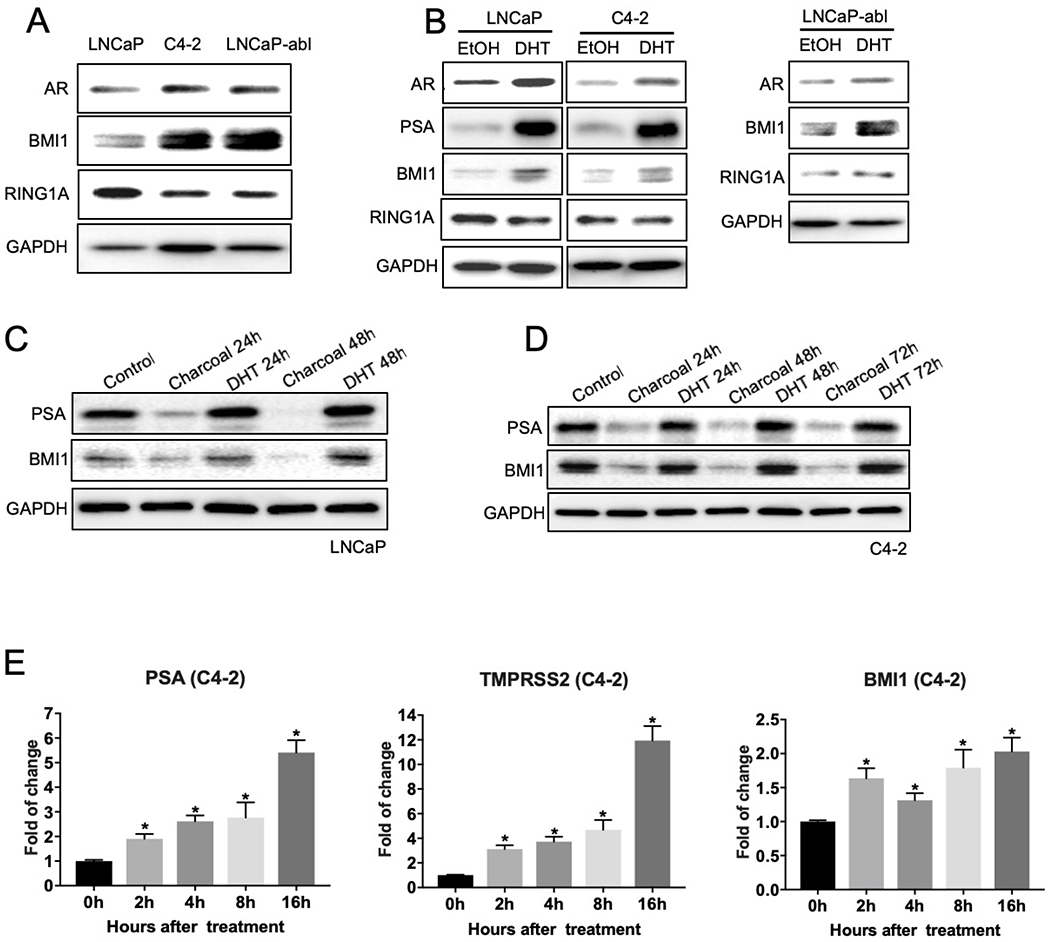
Androgen/AR signaling regulates BMI1 in PCa cells. (A) 2 × 10⁵ LNCaP, C4-2, or LNCaP-abl cells were plated, and after 2 days of culture, total cell lysates were blotted for AR, BMI1, and RING1A, while GAPDH served as a loading control. (B) LNCaP, C4-2, or LNCaP-abl cells were cultured in androgen-depleted culture medium (5% charcoal-stripped FBS in phenol red-free medium) for 48h, and then stimulated with 10 nM DHT for another 48h. Ethanol (EtOH) was used as a control. Total cell lysates were immunoblotted for AR, PSA, BMI1, RING1A, and GAPDH (B). After growing in androgen-depleted culture medium for 48h, LNCaP (C) and C4-2 (D) cells were treated with DHT for the times indicated. The protein levels of PSA, BMI1, and GAPDH were tested. All experiments were biologically repeated at least three times. Representative images are shown. (E) C4-2 cells were allowed to grow in androgen-depleted culture medium for 48h, then treated with DHT for the time indicated, and mRNA levels of PSA, TMPRSS2, and BMI1 were tested by QPCR. *p < 0.05 vs. 0h (normalized to 18S mRNA, mean ± SD).
BMI1 expression corresponds with the activity of AR signaling in VCaP xenografts post castration and after enzalutamide treatment.
Next, we next investigated whether androgen/AR signaling in vivo regulates BMI1. Androgen-dependent PCa VCaP cells were subcutaneously injected into 5-week-old male SCID mice. Three weeks post injection, xenograft tumors formed, and mice were randomly grouped for castration or non-castration. A proportion of mice were sacrificed 1–3 weeks after castration, and tumors were collected. The remaining mice were retained until tumors started to regrow, and then mice were randomly grouped to receive either enzalutamide or vehicle. Tumors were collected at 4 weeks post-enzalutamide treatment (Supplementary Figure 3). The protein levels of AR, PSA, and BMI1 were measured by immunoblot analysis. The PSA levels markedly decreased at 1-week post castration, demonstrating the effectiveness of castration. BMI1 levels were significantly decreased by 0.406-fold (p = 0.0238) in the tumors from mice 1-week post castration compared to non-castrated mice (Figure 3A). However, resistance developed after castration, as indicated by increasing AR and PSA levels. Notably, BMI1 levels were also increasing by 1.408-fold (p = 0.0026) in this process (Figure 3A) 1 week earlier than the rebound of PSA (i.e., PSA recurrence). This indicated that BMI1 plays an important role in castration-resistant tumor growth. Additionally, changes in mRNA levels of AR, PSA, and BMI1 positively correlated with each other, suggesting that AR signaling regulates BMI1 at the transcription level (Figure 3B). Further, enzalutamide treatment in vivo significantly suppressed AR signaling and remarkably downregulated BMI1 expression by 0.645-fold, (p = 0.0345) (Figure 3C). Taken together, these findings indicate that BMI1 is regulated by hormone-depletion and enzalutamide treatment, and is involved in the progression of castration-resistance.
Figure 3.
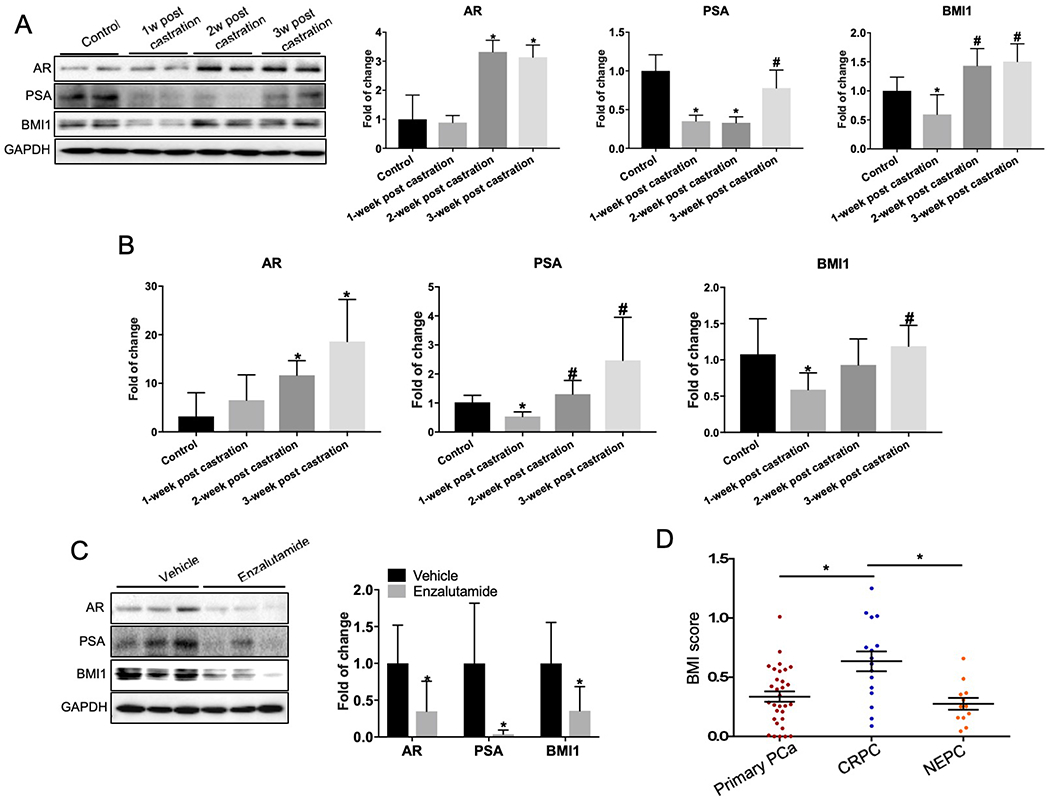
BMI1 protein levels are increased in CRPC and altered during neoadjuvant hormone-depletion treatment. Mice possessing 200-300 mm3 VCaP tumors were sacrificed as control or castrated, and tumors were collected at three time-points as indicated. (A) Protein levels of AR, PSA, and BMI1 were tested by Western blotting, GAPDH served as loading control; *p < 0.05 vs. control, #p < 0.05 vs. 1 week post castration (normalized to GAPDH, mean ± SD, n = 6). (B) Transcript levels of AR, PSA, and BMI1 were quantified by QPCR; *p < 0.05 vs. control, #p < 0.05 vs. 1 week post castration (normalized to 18S mRNA, mean ± SD, n = 6). (C) Castrated mice possessing CRPC xenograft received vehicle or enzalutamide (10 mg/kg per day) for 5 days per week. Tumors were collected 4 weeks later, and AR, PSA, BMI1, and GAPDH were analyzed by Western blot; *p < 0.05 vs. vehicle (normalized to GAPDH, mean ± SD, n = 6). (D) IHC of BMI1 was performed in primary PCa, CRPC, and NEPC. BMI1 scores are expressed as mean ± SD; *p < 0.05.
BMI1 protein levels are increased in human tissues from CRPC patients
To further investigate whether BMI1 protein levels are changed during PCa progression in human patients, we retrieved prostate tumor biopsies from Vancouver Prostate Centre tissue bank (see more details in “Methods” section) and performed tissue microarray analysis using a cohort of prostate tissues (Supplementary Table 1) that included 31 primary PCa tissues (17 patients), 16 CRPC tissues (8 patients), and 12 Neuroendocrine Prostate Prostate Cancer (NEPC) tissues (6 patients). In accordance with BMI1 being a nuclear protein, BMI1 protein staining was mainly found in the nuclei of cells (Supplementary Figure 4) As shown in Figure 3D, CRPC tissues had dramatically higher BMI1 expression levels than primary PCa and NEPC, strongly suggesting that BMI1 is involved in castration-resistance. Since AR expression levels and AR signaling are decreased in NEPC [9], a positive correlation may exist between BMI1 and AR during the transition from CRPC to NEPC. Additionally, we confirmed the increase of BMI1 in CRPC utilizing another batch of human samples (Supplementary Table 2 and Supplementary Figure 5).
BMI1 is the direct target gene of AR
Analysis of PCa cell lines (Figure 2C–E), mouse xenografts (Figure 3A–C), and tissues from human patients (Figure 3D) strongly suggest that AR signaling directly regulates BMI1. Next, we questioned how AR regulates BMI1 in vitro and in vivo. We hypothesized that AR may directly bind to the promoter or enhancer region of BMI1 to regulate the transcription of BMI1. To test this hypothesis, we first performed a de novo-motif search using the MEME tool [10] and found 6 potential AR binding motifs in BMI1 promoter or enhancer regions (Figure 4A and Supplementary Figure 6). We further performed chromatin immunoprecipitation (ChIP) followed by sequencing (Seq) [6]. ChIP-Seq revealed that AR was recruited to 5 distinct genomic loci around BMI1 (Figure 4B). In addition, we analyzed publicly available AR ChIP-Seq using the VCaP cell line [11, 12]. As expected, AR was recruited to the same genomic regions around BMI1 (Figure 4B). Interestingly, H3K27ac, which is known as the enhancer marker[13], is also enriched in loci A, B, and E. Notably, locus A & motif #1 & 2, and locus E & motif #5 are closely located, suggesting that motif #1, 2, and 5 might be AREs. To validate this finding, we designed primer pairs surrounding motif #1, 2, and 5 and primer pairs surrounding motif #3 and 6 as negative controls. As shown in Figure 4C, AR was significantly and remarkably enriched in motif #1 and #2. As expected, AR was not enriched in motif #3 and #6.
Figure 4.
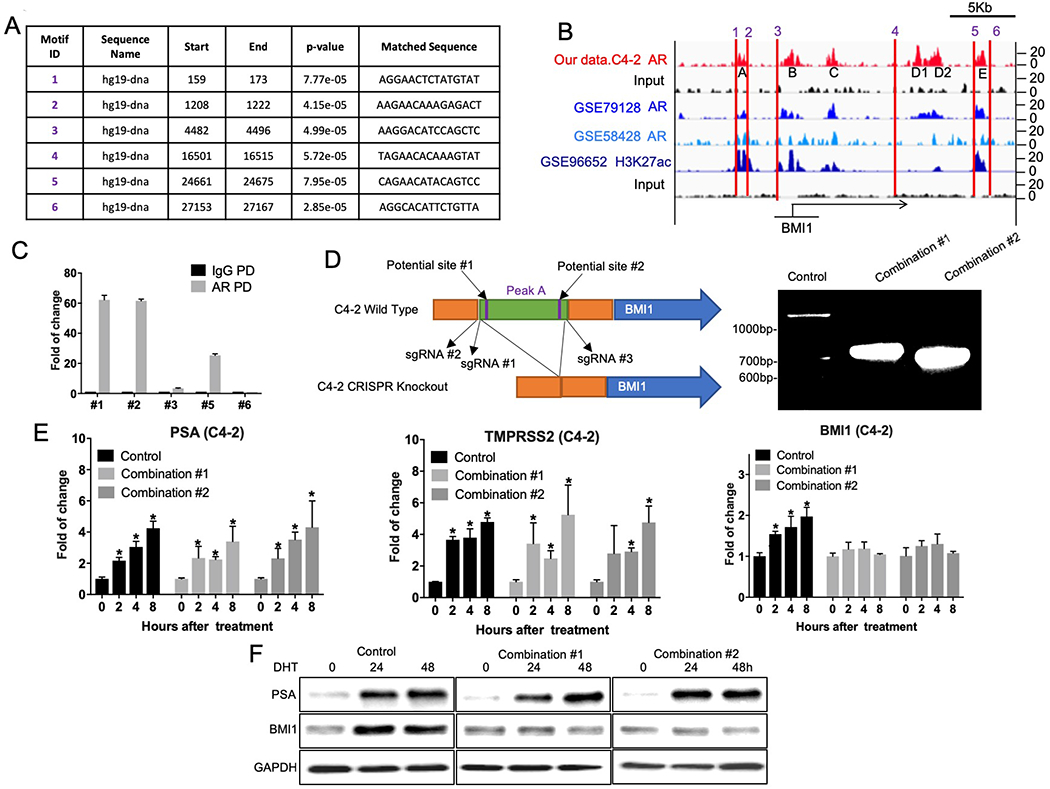
BMI1 is the direct target gene of AR. (A) MEME analysis of highly represented motifs. (B) ChIP-Seq peaks depicting AR and H3K27ac-binding profiles in BMI1 promoter (enhancer) regions. (C) ChIP-qPCR was conducted using specific primers to validate AR enrichment on BMI1 promoter (enhancer) regions. (D) Left panel: Schematic of CRISPR strategy used to cleave the targeted part of genomic DNA. Right panel: C4-2 cells were infected by lentiviral sgRNA #1 + #3 (Combination #1) or lentiviral sgRNA #2 + #3 (Combination #2) followed by puromycin selection, empty lentivirus as control. Genomic DNA were extracted, and the fragments of expected size were amplified by PCR: Control: 1992bp, Combination #1: 710bp, Combination #2: 665bp. Control and knockout cells were cultured in androgen-depleted medium and then treated with DHT. Cells were collected at indicated time points. (E) mRNA levels of PSA, TMPRSS2, and BMI1 at 0, 2, 4, or 8 h after DHT treatment were tested by QPCR. *p < 0.05 vs. 0h (normalized to 18S mRNA, mean ± SD). (F) Protein levels of PSA, TMPRSS2, and BMI1 at 0, 24, or 48 h after DHT treatment were analyzed by Western blot. All experiments were biologically repeated at least three times. Representative images are shown.
To further confirm BMI1 is the direct target gene of AR, we utilized Clustered Regularly Interspaced Short Palindromic Repeats (CRISPR) gene-editing technology to knockout locus A, including motif #1 & 2. We designed several single-guide RNAs (sgRNAs), and found two combinations that could successfully knockout the targeted site, as shown in Figure 4D. The expected sizes of the PCR-amplified products were obtained: 710bp for combination #1 (sgRNA #1 + #3), and 665bp for combination #2 (sgRNA #2 + #3). The sequencing results of these two products further confirmed the success of the knockout (Supplementary Table 3). We treated these knockout cells with DHT for different time periods, and found that BMI1 expression levels were not altered by DHT at either mRNA or protein levels, although AR signaling was significantly activated, as indicated by increased PSA and TMPRSS2 levels. The mRNA levels of PSA at 8h post-DHT treatment changed accordingly: Combination #1 increased by 2.4-fold (p = 0.0129) and Combination #2 increased by 3.313-fold (p = 0.0273). The mRNA levels of TMPRSS2 at 8h post-DHT treatment changed accordingly: Combination #1 increased by 4.246-fold (p = 0.0175), 95% and Combination #2 increased by 3.759-fold (p = 0.0034) (Figure 4 E–F). These results strongly support the concept that BMI1 is a direct target gene of AR.
BMI1 plays a critical role in the development of castration-resistance
Since we showed that BMI1 expression levels were higher in CRPC than those in non-CRPC (Figure 2 and 3), we hypothesized that BMI1 may promote CRPC progression and induce androgen-independent growth. To test our hypothesis, we overexpressed BMI1 by lentivirus transfection in androgen-dependent LNCaP cells and cultured the cells in androgen-depleted growth medium. As expected, we observed that androgen depletion arrested cell growth, and DHT treatment significantly stimulated cell growth, confirming that the growth of LNCaP cells is dependent on androgen (Figure 5A). However, BMI1 overexpression markedly increased LNCaP cell growth by 7.26-fold (8 days post treatment, p < 0.0001) in the absence of DHT (Figure 5A), suggesting that BMI1 alone was sufficient to convert LNCaP cells from androgen-dependent to androgen-independent (castration-resistant). We also utilized an adenovirus system to overexpress BMI1 in LNCaP cells and obtained similar results (Supplementary Figure 7A). Further, as shown in Figure 5B, CRPC cell line C4–2 grew normally in androgen depleted growth medium, but its growth was significantly inhibited by 0.425-fold after BMI1 knockdown (8 days post treatment, p < 0.0001). Notably, this inhibition could be abolished by DHT treatment. We further confirmed this result after siRNA induced knockdown in C4–2 cells (Supplementary Figure 7B). These results suggest that BMI1 depletion could reverse C4–2 cells from a castration-resistant to an androgen-dependent state. Additionally, we observed that BMI1 overexpression in LNCaP cells significantly increased by 0.941-fold the number of colonies formed in the absence of DHT (p = 0.0194) compared to control cells (Figure 5C), and BMI1 depletion in C4–2 cells decreased by 0.56-fold the number of colonies formed (p = 0.0001), which could be rescued by DHT (Figure 5D). These results further indicate that BMI1 plays a critical role in the development of castration resistance.
Figure 5.
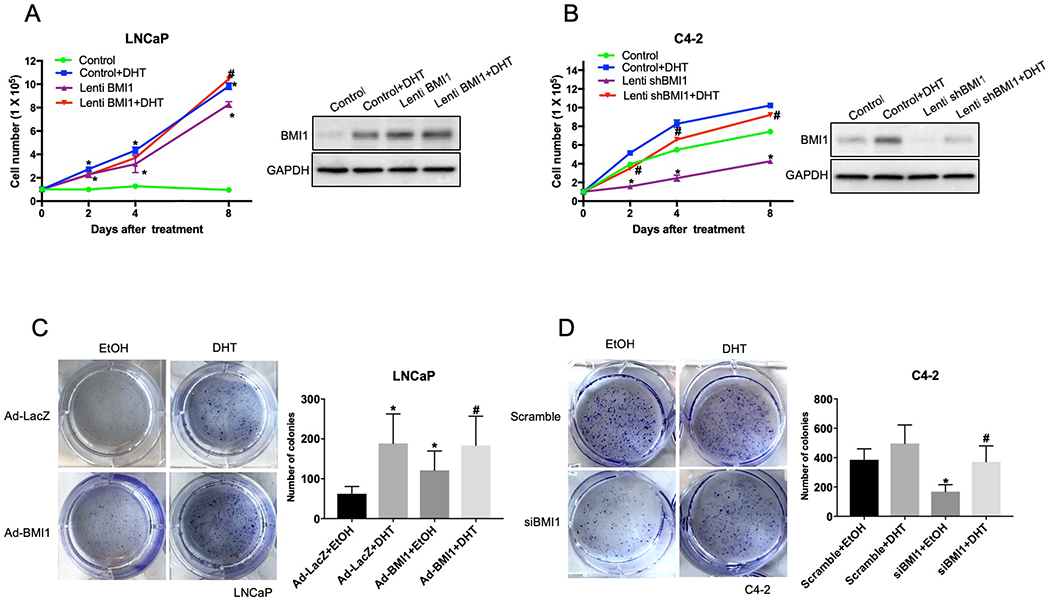
BMI1 plays an important role in regulation of the proliferation and colony formation of PCa cells. (A) Left panel: 1×10⁵ LNCaP cells per well (6-well plate) were infected with lentivirus to overexpress mBMI1, and GFP lentivirus was used as control. Cells were cultured in medium without androgen for 24 h, treated with DHT (5 nM) or EtOH, and cell number was counted at indicated time points; *p < 0.05 vs. Control, #p < 0.05 vs. Lenti BMI1 (mean ± SD). Right panel: cells treated for 8 days were collected, the protein levels of BMI1 and GAPDH were analyzed. BMI1 antibody, purchased from Millipore (05-637-K), was used to detect overexpressed mouse BMI1 and endogenous human BMI1. (B) Left panel: 1×10⁵ C4-2 cells per well (6-well plate) were infected with lentiviral shBMI1 or scrambled shRNA as control. Cells were cultured without androgen for 24h and then treated with DHT (5 nM) or EtOH. Cell number was counted at indicated time-points; *p<0.05 vs. Control, #p<0.05 vs. siBMI1 (mean ± SD). Right panel: cells treated for 8 days were collected, the protein levels of BMI1 and GAPDH were analyzed. (C) LNCaP cells were infected with adenovirus (Ad) to overexpress BMI1. LacZ Ad was used as a control. After 24h, cells were seeded in 6-well plates (200 cells/well, in triplicates), and after another 24 h, the cells were treated with DHT (5 nM) or EtOH. After 12 to 14 days, the plates were gently washed with PBS and stained with 0.1% crystal violet. Upper panel shows representative pictures of the colonies. Lower panel shows colonies with over 50 cells were counted; *p<0.05 vs. LacZ Ad (mean ± SD). (D) C4-2 cells were transfected with siBMI1 or scramble control and 24h later the cells were seeded in 6-well plates (200 cells/well, in triplicates). After another 24h, the cells were treated with DHT (5 nM) or EtOH. After 12 to 14 days, the plates were gently washed with PBS and stained with 0.1% crystal violet. Upper panel shows representative pictures of the colonies. Lower panel shows colonies with over 50 cells were counted; *p < 0.05 vs. scramble, #p < 0.05 vs. siBMI1 (mean ± SD).
BMI1 inhibitor PTC596 delays CRPC progression in vivo
PTC209, a BMI1-specific inhibitor, has been shown to effectively decrease tumor growth mediated by colon, lung, PCa stem cells, and leukemia [14–17]. Recently, we reported that PTC209 significantly inhibited CRPC tumor growth [6]. However, the poor oral bioavailability of PTC209 limits its therapeutic usefulness. PTC596, a recently developed BMI1 inhibitor [18], is an orally active small molecule in contrast to PTC209. Additionally, PTC596 has entered a Phase 1 clinical trial in patients with advanced solid tumors (NCT02404480). PTC596 has been reported to effectively increase apoptosis of acute myeloid leukemia (AML) cells [18]. Combination treatment with PTC596 and the Enhancer Of Zeste 2 Polycomb Repressive Complex 2 Subunit (EZH2) inhibitor EPZ6438 achieved remarkable efficacy in high-BMI1 and high-EZH2 Glioblastoma PDX tumors compared to control Glioblastoma tumors [19]. To test the effects of PTC596 in PCa, we first examined the effects of PTC596 on cell proliferation of VCaP and C4–2 cells, and observed a low IC50 (less than 0.05 μM) (Supplementary Figure 8A and B). We further observed that both PTC209 and PTC596 substantially decreased BMI1 levels as well as androgen/AR signaling (Figure 6A–B), consistent with our recent discovery that depleting BMI1 decreases AR protein levels signaling [6]. To assess the therapeutic efficacy of PTC596 in CRPC in vivo, we used a castration-resistant VCaP xenograft mouse model. PTC596 treatment significantly reduced tumor growth compared to vehicle control treatment (tumor volumes decreased by 0.466-fold 28 days after treatment, p = 0.0001), and its inhibitory effect is superior to that of PTC209 (Figure 6C). Furthermore, Kaplan-Meier survival analysis revealed that PTC596 markedly and significantly prolonged the survival rate of tumor-bearing mice compared to vehicle control treatment (p = 0.006) (Figure 6D) and had no effect on body weight (Supplementary Figure 9). As expected, BMI1 and AR were dramatically decreased in PTC596-treated CRPC tumors compared with control tumors (BMI1 decreased by 0.606-fold, p = 0.0457) (Figure 6E), suggesting PTC596 attained its target in vivo.
Figure 6.
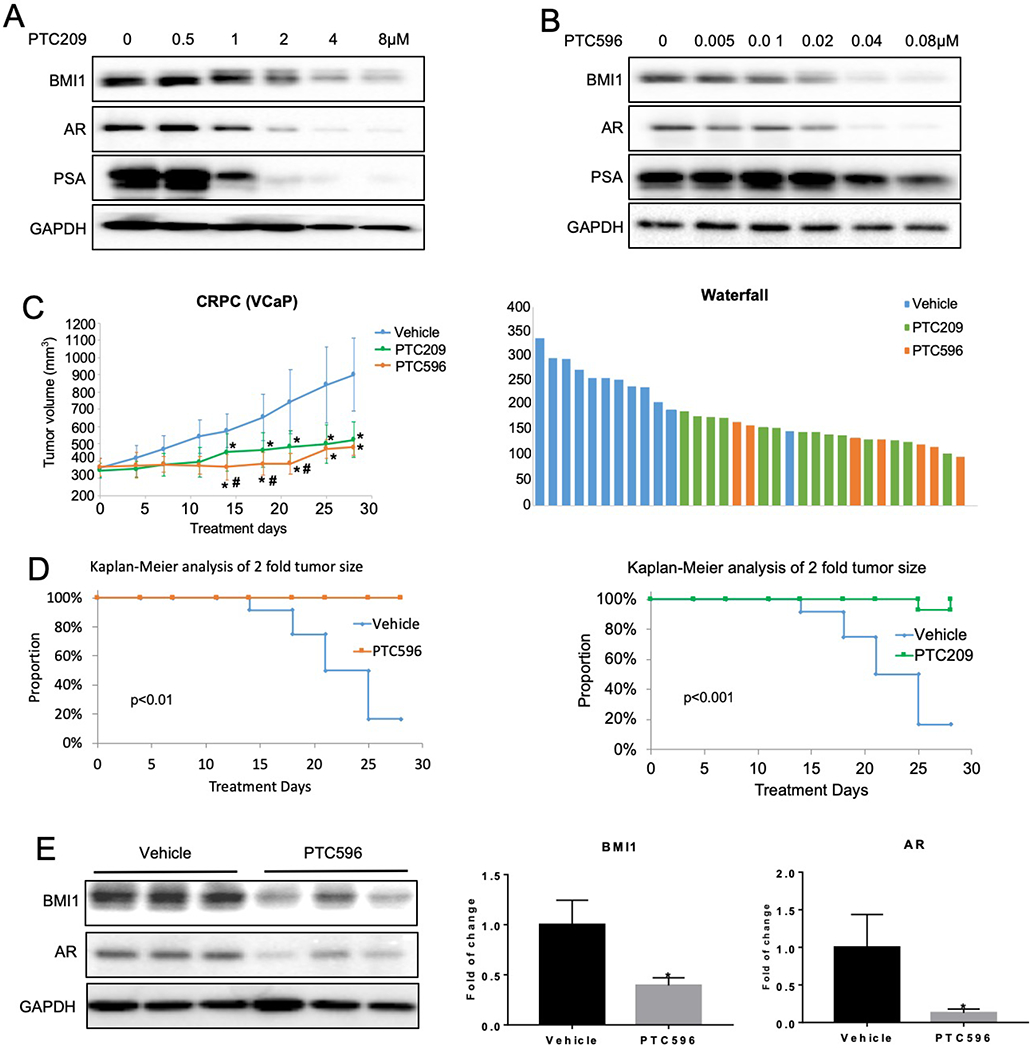
BMI1 inhibitor delays CRPC progression in vivo. C4-2 cells were treated with PTC209 (A) or PTC596 (B) at indicated concentrations for 48h. BMI1, AR, and PSA were analyzed by Western blot, and GAPDH served as loading control. All experiments were biologically repeated at least three times. Representative images are shown. (C) Castrated mice possessing CRPC xenografts received vehicle (n = 12), PTC596 (12 mg/kg per day, 2 days per week, n = 7) or PTC209 (60 mg/kg per day, 5 days per week, n = 13). Caliper measurements were taken every 4 days to obtain tumor volume: Mean tumor volume ± SD, *p < 0.05 vs. vehicle, #p < 0.05 vs. PTC209; right panel shows waterfall plot of tumor volume response. (D) Kaplan-Meier survival plot comparing progression-free survival. (E) Tumor tissues were lysed and analyzed by Western blot for BMI1, AR, and GAPDH. The left panel shows the representative Western blot. Protein levels were quantified and normalized to GAPDH (right panel); *p < 0.05 vs. Vehicle (mean ± SD, n = 6).
Discussion
BMI1 plays an important role in the initiation and development of castration-resistance as well as metastasis of PCa [20, 21]. Recently, a study reported that the presence of BMI1 is a distinguishing attribute between castration-resistant prostate epithelial cells (BMI1-high CRPC) and other castration-resistant prostate epithelial cells (i.e. Nkx3.1-high CRPC) [22]. However, it was not determined how BMI1 was upregulated in CRPC and how BMI1 played its role in castration-resistance.
In this study, we demonstrated that BMI1 expression is positively correlated with AR signaling. Our Tissue Microarrays (TMAs) indicated similar patterns of expression levels of BMI1 and AR at different stages of PCa progression. Further, our investigation revealed that BMI1 and AR protein levels are positively correlated with each other during disease progression. We further demonstrated that AR signaling both in vitro and in vivo regulates BMI1. We also used CRISPR gene editing technology to confirm that BMI1 is an AR direct target gene.
The majority of patients with neoadjuvant hormonal therapy (NHT)-treated PCa will develop CRPC, and treatment options for CRPC remain limited. We demonstrated that CRPC cells express more BMI1 than non-CRPC cells, suggesting that BMI1 contributes to CRPC development. Our mouse xenograft model revealed that the restored expression of BMI1 was associated with the establishment of castration-resistance. More interestingly, enzalutamide treatment, which successfully inhibited AR signaling in CRPC tumors, could significantly decrease BMI1 expression. Furthermore, we demonstrated that overexpression of BMI1 could convert PCa cells from the androgen-sensitive state to the castration-resistant (i.e., androgen-independent) state. In contrast, depleting BMI1 could reverse CRPC cells from their castration-resistant state to an androgen-sensitive state. These results strongly suggest that BMI1 is a major contributor to the development of castration-resistance.
Targeting BMI1 for advanced cancer patients has been proposed for many years. However, targeting BMI1 was not successful until the recent development of PTC209 and PTC596 [14, 18, 23]. PTC596 has entered a Phase-I clinical trial in patients with advanced solid tumors (NCT02404480). Here, we demonstrated that both PTC596 and PTC209 treatment decreased BMI1 and AR in CRPC cell lines and tumors, and significantly inhibited CRPC tumor growth in murine xenograft models. These results strongly support the notion that targeting BMI1 is a potential therapy for CRPC treatment.
In conclusion, BMI1 is directly regulated by androgen/AR signaling in PCa and is upregulated in CRPC along with AR signaling. Increased BMI1 could bind and stabilize AR protein, forming a positive feedback loop. BMI1 and AR together promote PCa cells proliferation independently of androgen and further facilitate CRPC progression (Figure 7). Since elevated BMI1 plays a key role in the castration-resistance, targeting BMI1 may be a potential therapy for CRPC patients. This study sheds new light on the regulation mechanism of BMI1 in PCa and advances our understanding of CRPC development.
Figure 7.
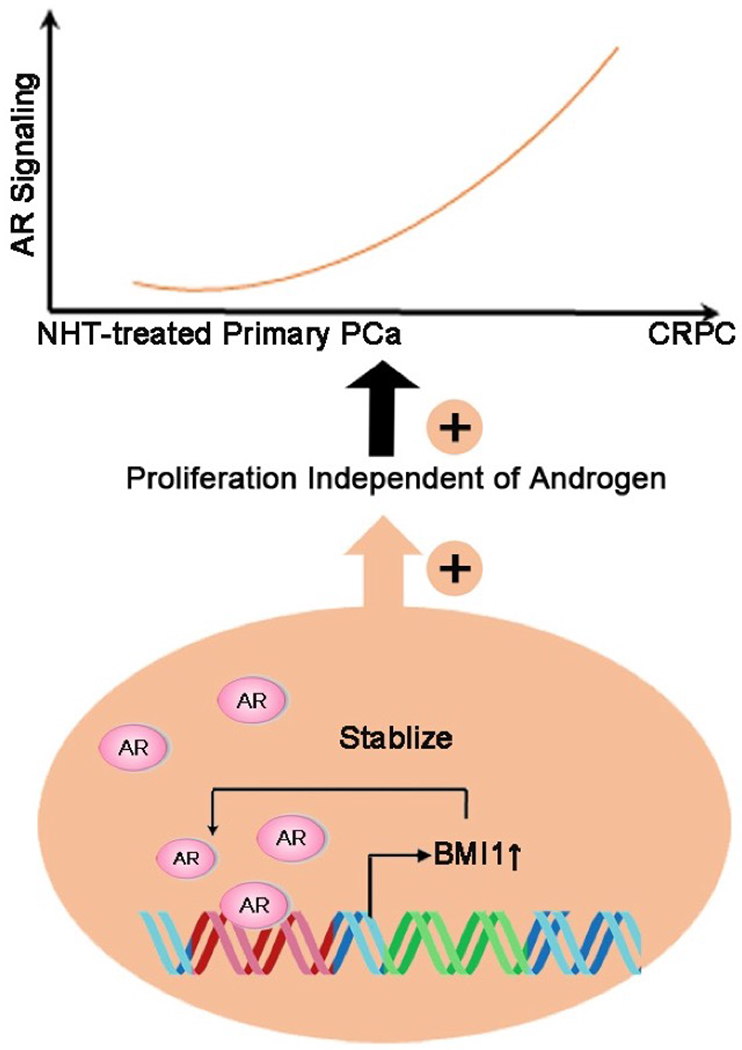
Model for the regulatory mechanism of BMI1 and its role in the development of prostate cancer.
Methods
Drug treatments and antibodies
All drugs were commercially obtained and used at the designated concentrations (unless otherwise indicated): enzalutamide (IN034, Dieckmann), PTC209 (0, 0.5, 1, 2, and 4 μM, HY-15888, MedChem Express), PTC596 (0, 0.005, 0.01, 0.02, 0.04 and 0.08 μM, PTC Therapeutics), and DHT (A8380, Sigma). Enzalutamide were diluted in a vehicle of 0.5% CMC (C9481, Sigma) and 0.25% Tween-80 (P8074, Sigma). PTC209 and PTC596 were diluted in a vehicle of 14% DMSO, 36% polyethylene glycol 400, and 50% polypropylene glycol 400. DHT was dissolved in ethanol and diluted using charcoal-stripped serum medium to 10 nM. Protein lysates were prepared in SDS-sample buffer (4× reducing, BP-110R, Boston BioProducts). The secondary antibodies were Clean-Blot IP Detection Reagent (HRP, 21230, Thermo Scientific), goat antimouse IgG (H+L)-HRP (SA001–500, GenDEPOT), or goat anti-rabbit IgG (H+L)-HRP (SA002-500, GenDEPOT). Antibodies used for immunoblot assays are listed in Supplementary Table 4.
Cell culture
Human prostate cancer LNCaP cells were purchased from ATCC. C4–2 cells were provided by Dr. Arul M. Chinnaiyan. LNCaP-abl were provided by Dr. Zoran Culig. All cells used in this study were within 20 passages after receipt. LNCaP, C4–2, and LNCaP-abl were cultured in 5% CO2 and maintained in vitro in RPMI 1640 medium supplemented with 10% FBS, 2 mmol/L glutamine, 100 units/ml penicillin, and 100 mg/ml streptomycin. These cell lines were recently authenticated by the University of Arizona Genetics Core using short tandem repeat (STR) profiling. Cell lines were mycoplasma negative during routine tests.
Gene expression data analysis
Normalized expression values of individual genes for 497, 160, and 87 patients from the TCGA, MSKCC, and Michigan cohorts, respectively (Figure 1 and Supplementary Figure 1), were downloaded from the Cbioportal website [24, 25].
Murine prostate tumor xenograft model
CB17 SCID mice were purchased from Charles River. Animal care and use conditions were followed in accordance with institutional and National Institutes of Health protocols and guidelines, and all studies were approved by Houston Methodist Institution Animal Care and Use Committee. Xenograft experiments in mice were performed as previously described [6]. Briefly, mice were anesthetized using 2% isoflurane (inhalation), and 2 × 10⁶ VCaP prostate cancer cells suspended in 100 μl of PBS with 50% Matrigel were implanted subcutaneously into the dorsal flank on both sides of the mice. Tumor volumes were measured by length (a), width (b), and calculated as tumor volume = MIN(a)2 × MAX(b)/2. For the VCaP castration-resistant prostate tumor model, VCaP tumor-bearing mice were castrated when the tumors were approximately 200–300 mm3 in size and once tumors started to grow back, mice were randomized and treated with vehicle, enzalutamide (10 mg/kg), PTC209 (60 mg/kg), or PTC596 (12 mg/kg) daily (5 days per week) and terminated approximately 28 days later. Loss of body weight during the course of the study was also monitored.
Western blotting
To denature proteins, lysates were added to 4× reducing buffer and heated to 95 °C for 10 min. Protein levels were assessed by standard SDS–polyacrylamide gel electrophoresis and transferred to PVDF membranes (162-0177, BIO-RAD). Images were captured using the ChemiDoc XRS+ Molecular Imager system (BIO-RAD). Blots were incubated overnight with primary antibodies at 4 °C, followed by detection with secondary antibody.
RNA isolation and QPCR
Total RNA was isolated from cells to generate cDNA using the RNA MiniPrep kit (Direct-zol, R2052, ZYMO Research) and amfiRivert cDNA Synthesis Platinum Master Mix (R5600-100, GenDEPOT). Each cDNA sample was amplified using Power SYBR Green PCR Master Mix (4367659, Applied Biosystem) on the QuantStudio 6 Flex Real-time PCR System (403115082, GE Healthcare). Briefly, the reaction conditions consisted of 2 μl of cDNA and 0.2 μM primers in a 10 μl final volume of super mix. Each cycle consisted of denaturation at 95 °C for 15s, annealing at 58.5 °C for 5s, and extension at 72 °C for 10s, respectively. 18S was used as an endogenous control to normalize each sample. The primers are listed in Supplementary Table 5. The experiment was performed in triplicate with three independent experiments.
Tissue microarrays (TMAs)
Prostate tumor biopsies were retrieved from Vancouver Prostate Centre tissue bank and used to construct several TMAs that had been reported previously [26, 27]. The first batch of a neoadjuvant hormonal therapy (NHT) TMA contained 31 tissue cores from patients who had not received hormonal therapies before radical prostatectomy and 28 tissue cores from patients who had tumor recurrence after receiving hormonal therapies and who had been diagnosed with CRPC. The tumors that had recurred were removed by transurethral resection prostatectomy to relieve obstructive symptoms. This CRPC TMA was also stained with Chromogranin A (CHGA) and N-CAM antibodies to identify any NEPC tissue cores. The second batch of NHT TMAs contained 125 tissue cores from patients who had not received hormonal therapies before radical prostatectomy and 44 tissue cores from patients who had tumor recurrence after receiving hormonal therapies and who had been diagnosed with CRPC.
Immunohistochemistry (IHC) analyses
IHC was performed by Ventana Discovery XT (Ventana) using a DAB MAP kit, as previously reported [26, 27] . All stained slides were scanned by a Leica SCN400 scanner. Digital images were evaluated by a pathologist, Dr. Ladan Fazli. BMI1 histology score (H-score) was calculated by the Aperio ImageScope software based on both intensity and percentage of the IHC signals, according to the manufacturer’s instructions (Leica Biosystems). The H-scores of Chromogranin A and N-CAM were also evaluated based on intensity and percentage of the IHC signals. A NEPC tissue core was defined if either CHGA or N-CAM H-score reached 0.3.
Lentiviral constructs
Lentivirus was packaged by co-transfection of constructs with second-generation packaging plasmids pMD2.G and psPAX2 into HEK293T cells on 6-well plates. After the first 24 h of transfection (250 ng of pMD2.G, 750 ng of psPAX2, 1 μg of target plasmid), the medium was changed to DMEM, and 48 and 72 h after transfection, the supernatants were pooled, filtered through a 0.45-μm filter, and used for infection.
Transfection
BMI1 siRNA (#1 s2015, #2 s2016) sequences were purchased from Thermo Scientific. Lipofectamine 2000 reagent (1815561, Invitrogen) and Opti-Mem (1774114, Gibco) were used in the transfection process. Cells (3×10⁵) were plated in 6-well plates, grown without antibiotics to 80% confluence, and then transfected with siRNA sequences or their corresponding mock sequences using a Lipofectamine 2000 kit with the procedure provided by the manufacturer.
Chromatin immunoprecipitation (ChIP)
Chromatin immunoprecipitation (ChIP) was performed using the ChIP Assay kit (Millipore, Cat. 17-295) with the procedure provided by the manufacturer. For PCR analysis of enrichment of target gene promoters, 2 μl each of input DNA, AR-enriched, or IgG-enriched DNA were subjected to PCR using Platinum PCR Super mix (Invitrogen). Primers specific for target gene promoters or enhancers are listed in Supplementary Table 6.
ChIP-Seq data analysis
All ChIP-Seq reads were mapped to the version hg19 of the human genome using Bowtie (version 1.1.2) [28]. The Dregion function in DANPOS (version 2.2.3) [29] was used to calculate read density and define enrichment peaks. Briefly, we extended each read at the 3′ end to be 200bp long and then calculated read density as the number of reads covering each base pair in the genome. For each sample, the total number of mapped reads was normalized to 25 million. DANPOS subtracted input background signal from the ChIP signal. Wigtobigwig [30] software was employed to convert signal file to bigwig format. The Chip-Seq peaks were visualized from UCSC genome browser [31].
Colony formation assay
Clonogenic growth assay methods are performed as previously described [32]. More details are described in the legend of Figure 5.
CRISPR Single-guide RNA (sgRNA) preparation
Two open-access software programs, Cas-Designer (http://www.rgenome.net/cas-designer/) and CCTop (https://crispr.cos.uni-heidelberg.de) were used to design guide RNAs (gRNA). The sequences of the sgRNAs are: #1 GCAGTTGGCTTTATTTGCAG, #2 TAAAACGGGACCCATAGATG, #3 TTCCAGGGCTAGGCTAGCAA. Target DNA oligos were purchased from IDT (Integrated DNA Technologies) and cloned into the lentiCRISPR v2 plasmid (Addgene plasmid# 52961) via BsmBI restriction enzyme sites upstream of the scaffold sequence of the U6-driven gRNA cassette. All plasmids were sequenced to confirm successful ligation.
Availability
The next-generation sequencing data has been deposited into Gene Expression Omnibus (GEO) under accession GSE97831.
Statistical analysis
Data were analyzed using Prism 6.0 software (GraphPad) and SPSS V.17, and presented as mean ± SD. Pearson’s correlations were conducted to examine the relationships between AR and BMI1/RING1A et al. Two-tailed unpaired Student’s t tests were used to test for statistical significance in in vivo and in vitro experiments when two groups were compared. When the PCa genomic data were not normally distributed, Wilcoxon analysis was used. Statistical analyses comparing different tissue core groups (3 groups) were performed by one-way analysis of variance (ANOVA). Two-way ANOVA (4 groups × 4 time points) was conducted in in vitro experiments, while repeated measures of ANOVA (2 groups × 7 time points) were used in in vivo experiments. Kaplan-Meier analyses were performed to evaluate mouse survival rate of murine xenograft models. A p<0.05 was considered to be significant. No statistical method was used to predetermine sample size. Mice were assigned at random to treatment groups and, where possible, mixed among cages. There were no inclusion or exclusion criteria. Whenever possible, the investigators were blinded to group allocation during the experiments and when assessing outcomes. Experiments were repeated two to three times.
Supplementary Material
Acknowledgements
We thank Marla Weetall, John Baird, Art Branstrom and PTC Therapeutics for providing PTC596 and valuable inputs. We thank The University of Texas MD Anderson Cancer Center Science Park Next-Generation Sequencing (NGS) Facility (supported by CPRIT grants RP120348 and RP170002) for assistance with next-generation sequencing, and the Houston Methodist Comparative Medicine core facility, Jenny Chang, Anthony Kozielski, and Wei Qian for assistance with in vivo work. We thank Johnique Atkins for comments and editing this manuscript.
Funding This work is supported, in part, by grants from Houston Methodist Research Institute, Prostate Cancer Foundation (13YOUN007 to Q.C.), U.S. Department of Defense (W81XWH-15-1-0639 and W81XWH-17-1-0357 to Q.C.), American Cancer Society (TBE-128382 to Q.C.), and NIH/NCI (R01CA208257 to Q.C.); K.C. is supported in part by grants from NIH/NIGMS (R01GM125632 to K.C.) and NIH/NHLBI (R01HL133254 to K.C.); J.Y. is supported by NIH/NCI (R01CA172384), U.S. Department of Defense (W81XWH-17-1-0405, W81XWH-17-1-0362, and W81XWH-17-1-0578). X.D. is supported by Canadian Institute of Health Research (#MOP-137007). W.Z. is supported by the National Natural Science Foundation of China (81572766 and 31771630), Guangdong Innovative and Entrepreneurial Research Team Program (2016ZT06S029), C.L. is supported by the China Scholarship Council (201706370147).
Footnotes
Conflict of interest The authors declare that they have no conflict of interest.
References
- 1.Song LB, Li J, Liao WT, Feng Y, Yu CP, Hu LJ et al. The polycomb group protein Bmi-1 represses the tumor suppressor PTEN and induces epithelial-mesenchymal transition in human nasopharyngeal epithelial cells. J Clin Invest 2009; 119: 3626–3636. [DOI] [PMC free article] [PubMed] [Google Scholar]
- 2.Ren H, Du P, Ge Z, Jin Y, Ding D, Liu X et al. TWIST and BMI1 in Cancer Metastasis and Chemoresistance. J Cancer 2016; 7: 1074–1080. [DOI] [PMC free article] [PubMed] [Google Scholar]
- 3.Glinsky GV, Berezovska O, Glinskii AB. Microarray analysis identifies a death-from-cancer signature predicting therapy failure in patients with multiple types of cancer. J Clin Invest 2005; 115: 1503–1521. [DOI] [PMC free article] [PubMed] [Google Scholar]
- 4.van Leenders GJ, Dukers D, Hessels D, van den Kieboom SW, Hulsbergen CA, Witjes JA et al. Polycomb-group oncogenes EZH2, BMI1, and RING1 are overexpressed in prostate cancer with adverse pathologic and clinical features. Eur Urol 2007; 52: 455–463. [DOI] [PubMed] [Google Scholar]
- 5.Siddique HR, Saleem M. Role of BMI1, a stem cell factor, in cancer recurrence and chemoresistance: preclinical and clinical evidences. Stem Cells 2012; 30: 372–378. [DOI] [PubMed] [Google Scholar]
- 6.Zhu S, Zhao D, Yan L, Jiang W, Kim JS, Gu B et al. BMI1 regulates androgen receptor in prostate cancer independently of the polycomb repressive complex 1. Nat Commun 2018; 9: 500. [DOI] [PMC free article] [PubMed] [Google Scholar]
- 7.Taylor BS, Schultz N, Hieronymus H, Gopalan A, Xiao Y, Carver BS et al. Integrative genomic profiling of human prostate cancer. Cancer Cell 2010; 18: 11–22. [DOI] [PMC free article] [PubMed] [Google Scholar]
- 8.Grasso CS, Wu YM, Robinson DR, Cao X, Dhanasekaran SM, Khan AP et al. The mutational landscape of lethal castration-resistant prostate cancer. Nature 2012; 487: 239–243. [DOI] [PMC free article] [PubMed] [Google Scholar]
- 9.Wang W, Epstein JI. Small cell carcinoma of the prostate. A morphologic and immunohistochemical study of 95 cases. Am J Surg Pathol 2008; 32: 65–71. [DOI] [PubMed] [Google Scholar]
- 10.Grant CE, Bailey TL, Noble WS. FIMO: scanning for occurrences of a given motif. Bioinformatics 2011; 27: 1017–1018. [DOI] [PMC free article] [PubMed] [Google Scholar]
- 11.Mounir Z, Korn JM, Westerling T, Lin F, Kirby CA, Schirle M et al. ERG signaling in prostate cancer is driven through PRMT5-dependent methylation of the Androgen Receptor. Elife 2016; 5. [DOI] [PMC free article] [PubMed] [Google Scholar]
- 12.Takayama K, Suzuki T, Fujimura T, Urano T, Takahashi S, Homma Y et al. CtBP2 modulates the androgen receptor to promote prostate cancer progression. Cancer Res 2014; 74: 6542–6553. [DOI] [PubMed] [Google Scholar]
- 13.Kron KJ, Murison A, Zhou S, Huang V, Yamaguchi TN, Shiah YJ et al. TMPRSS2-ERG fusion co-opts master transcription factors and activates NOTCH signaling in primary prostate cancer. Nat Genet 2017; 49: 1336–1345. [DOI] [PubMed] [Google Scholar]
- 14.Bansal N, Bartucci M, Yusuff S, Davis S, Flaherty K, Huselid E et al. BMI-1 Targeting Interferes with Patient-Derived Tumor-Initiating Cell Survival and Tumor Growth in Prostate Cancer. Clin Cancer Res 2016; 22: 6176–6191. [DOI] [PMC free article] [PubMed] [Google Scholar]
- 15.Yong KJ, Basseres DS, Welner RS, Zhang WC, Yang H, Yan B et al. Targeted BMI1 inhibition impairs tumor growth in lung adenocarcinomas with low CEBPα expression. Sci Transl Med 2016; 8: 350ra104. [DOI] [PMC free article] [PubMed] [Google Scholar]
- 16.Kreso A, van Galen P, Pedley NM, Lima-Fernandes E, Frelin C, Davis T et al. Self-renewal as a therapeutic target in human colorectal cancer. Nat Med 2014; 20: 29–36. [DOI] [PubMed] [Google Scholar]
- 17.Mourgues L, Imbert V, Nebout M, Colosetti P, Neffati Z, Lagadec P et al. The BMI1 polycomb protein represses cyclin G2-induced autophagy to support proliferation in chronic myeloid leukemia cells. Leukemia 2015; 29: 1993–2002. [DOI] [PubMed] [Google Scholar]
- 18.Nishida Y, Maeda A, Kim MJ, Cao L, Kubota Y, Ishizawa J et al. The novel BMI-1 inhibitor PTC596 downregulates MCL-1 and induces p53-independent mitochondrial apoptosis in acute myeloid leukemia progenitor cells. Blood Cancer J 2017; 7: e527. [DOI] [PMC free article] [PubMed] [Google Scholar]
- 19.Jin X, Kim LJY, Wu Q, Wallace LC, Prager BC, Sanvoranart T et al. Targeting glioma stem cells through combined BMI1 and EZH2 inhibition. Nat Med 2017; 23: 1352–1361. [DOI] [PMC free article] [PubMed] [Google Scholar]
- 20.Kassi E, Moutsatsou P. Glucocorticoid receptor signaling and prostate cancer. Cancer Lett 2011; 302: 1–10. [DOI] [PubMed] [Google Scholar]
- 21.Clyne M Prostate cancer: androgen deprivation causes EMT in the prostate. Nat Rev Urol 2011; 9: 4. [DOI] [PubMed] [Google Scholar]
- 22.Yoo YA, Roh M, Naseem AF, Lysy B, Desouki MM, Unno K et al. Bmi1 marks distinct castration-resistant luminal progenitor cells competent for prostate regeneration and tumour initiation. Nat Commun 2016; 7: 12943. [DOI] [PMC free article] [PubMed] [Google Scholar]
- 23.Yong KJ, Basseres DS, Welner RS, Zhang WC, Yang H, Yan B et al. Targeted BMI1 inhibition impairs tumor growth in lung adenocarcinomas with low CEBPalpha expression. Sci Transl Med 2016; 8: 350ra104. [DOI] [PMC free article] [PubMed] [Google Scholar]
- 24.Gao J, Aksoy BA, Dogrusoz U, Dresdner G, Gross B, Sumer SO et al. Integrative analysis of complex cancer genomics and clinical profiles using the cBioPortal. Sci Signal 2013; 6: p l1. [DOI] [PMC free article] [PubMed] [Google Scholar]
- 25.Cerami E, Gao J, Dogrusoz U, Gross BE, Sumer SO, Aksoy BA et al. The cBio cancer genomics portal: an open platform for exploring multidimensional cancer genomics data. Cancer Discov 2012; 2: 401–404. [DOI] [PMC free article] [PubMed] [Google Scholar]
- 26.Yu Y, Yang O, Fazli L, Rennie PS, Gleave ME, Dong X. Progesterone receptor expression during prostate cancer progression suggests a role of this receptor in stromal cell differentiation. Prostate 2015; 75: 1043–1050. [DOI] [PubMed] [Google Scholar]
- 27.Li H, Xie N, Chen R, Verreault M, Fazli L, Gleave ME et al. UGT2B17 Expedites Progression of Castration-Resistant Prostate Cancers by Promoting Ligand-Independent AR Signaling. Cancer Res 2016; 76: 6701–6711. [DOI] [PubMed] [Google Scholar]
- 28.Langmead B, Trapnell C, Pop M, Salzberg SL. Ultrafast and memory-efficient alignment of short DNA sequences to the human genome. Genome Biol 2009; 10: R25. [DOI] [PMC free article] [PubMed] [Google Scholar]
- 29.Chen K, Xi Y, Pan X, Li Z, Kaestner K, Tyler J et al. DANPOS: dynamic analysis of nucleosome position and occupancy by sequencing. Genome Res 2013; 23: 341–351. [DOI] [PMC free article] [PubMed] [Google Scholar]
- 30.Kent WJ, Zweig AS, Barber G, Hinrichs AS, Karolchik D. BigWig and BigBed: enabling browsing of large distributed datasets. Bioinformatics 2010; 26: 2204–2207. [DOI] [PMC free article] [PubMed] [Google Scholar]
- 31.Kent WJ, Sugnet CW, Furey TS, Roskin KM, Pringle TH, Zahler AM et al. The human genome browser at UCSC. Genome Res 2002; 12: 996–1006. [DOI] [PMC free article] [PubMed] [Google Scholar]
- 32.Ji Q, Hao X, Zhang M, Tang W, Yang M, Li L et al. MicroRNA miR-34 inhibits human pancreatic cancer tumor-initiating cells. PLoS One 2009; 4: e6816. [DOI] [PMC free article] [PubMed] [Google Scholar]
Associated Data
This section collects any data citations, data availability statements, or supplementary materials included in this article.