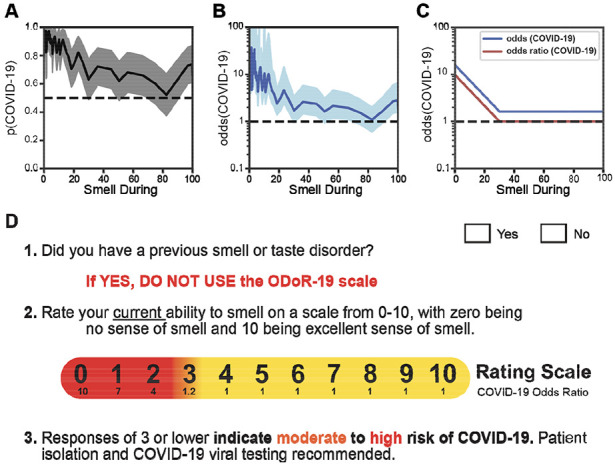
Figure 5.

The odds of a COVID-19 diagnosis as a function of olfactory loss. (A) The solid line indicates the probability of a COVID-19 diagnosis as a function of “Smell during illness” ratings. The shaded region indicates the 95% confidence interval. (B) The solid line expresses the probability of a COVID-19+ diagnosis as a function of “Smell during illness” in odds (p/(1-p)); it is shown on a logarithmic scale. The shaded region indicates the 95% confidence interval. (C) Stylized depiction of change in the odds of a COVID-19 diagnosis and of the odds ratio. (D) The ODoR-19 screening tool. After healthcare providers or contact tracers have excluded previous smell and/or taste disorders such as those resulting from head trauma, chronic rhinosinusitis, or previous viral illness, the patient can be asked to rate their current ability to smell on a scale from 0-10, with 0 being no sense of smell and 10 being excellent sense of smell. If the patient reports a value below or equal to 3, there is a high (red) or moderate (orange) probability that the patient has COVID-19. Values in yellow (ratings above 3) cannot rule out COVID-19.
