

Abstract
Background
Sickle cell disease (SCD) is a genetic chronic haemolytic and pro‐inflammatory disorder. With increased catabolism and deficits in energy and nutrient intake, individuals with SCD suffer multiple macro‐ and micro‐nutritional deficiencies, including vitamin D deficiency. This is an update of a previous review.
Objectives
To investigate the effects of vitamin D supplementation in children and adults with SCD and to compare different dose regimens.
To determine the effects of vitamin D supplementation on general health (e.g. growth status and health‐related quality of life), on musculoskeletal health (including bone mineral density, pain crises, bone fracture and muscle health), on respiratory health (including lung function, acute chest syndrome, acute exacerbation of asthma and respiratory infections) and the safety of vitamin D supplementation.
Search methods
We searched the Cochrane Haemoglobinopathies Trials Register, compiled from electronic database searches and handsearching of journals and conference abstract books. Date of last search: 19 March 2020.
We also searched database such as PubMed, clinical trial registries and the reference lists of relevant articles and reviews. Date of last search: 14 January 2020.
Selection criteria
Randomised controlled trials (RCTs) and quasi‐RCTs comparing oral administration of any form of vitamin D supplementation at any dose and for any duration to another type or dose of vitamin D or placebo or no supplementation in people with SCD, of all ages, gender, and phenotypes.
Data collection and analysis
Two authors independently extracted the data and assessed the risk of bias of the included studies. They used the GRADE guidelines to assess the quality of the evidence.
Main results
Vitamin D versus placebo
One double‐blind RCT (n = 39) compared oral vitamin D3 (cholecalciferol) supplementation (20 participants) to placebo (19 participants) for six weeks. Only 25 participants completed the full six months of follow‐up. The study had a high risk of bias due to incomplete outcome data, but a low risk of bias for randomisation, allocation concealment, blinding (of participants, personnel and outcome assessors) and selective outcome reporting; and an unclear risk of other biases.
Vitamin D supplementation probably led to higher serum 25(OH)D levels at eight weeks, mean difference (MD) 29.79 (95% confidence interval (CI) 26.63 to 32.95); at 16 weeks, MD 12.67 (95% CI 10.43 to 14.90); and at 24 weeks, MD 15.52 (95% CI 13.50 to 17.54) (moderate‐quality evidence). There was little or no difference in adverse events (tingling of lips or hands) between the vitamin D and placebo groups, risk ratio 3.16 (95% CI 0.14 to 72.84) (low‐quality evidence). Vitamin D supplementation probably caused fewer pain days compared to the placebo group at eight weeks, MD ‐10.00 (95% CI ‐16.47 to ‐3.53) (low‐quality evidence), but probably led to a lower (worse) health‐related quality of life score (change from baseline in physical functioning PedsQL scores); at both 16 weeks, MD ‐12.56 (95% CI ‐16.44 to ‐8.69) and 24 weeks, MD ‐12.59 (95% CI ‐17.43 to ‐7.76), although this may not be the case at eight weeks (low‐quality evidence).
Vitamin D supplementation regimens compared
Two double‐blind RCTs (83 participants) compared different regimens of vitamin D. One RCT (n = 62) compared oral vitamin D3 7000 IU/day to 4000 IU/day for 12 weeks, while the second RCT (n = 21) compared oral vitamin D3 100,000 IU/month to 12,000 IU/month for 24 months. Both RCTs had low risk of bias for blinding (of participants, personnel and outcome assessors) and incomplete outcome data, but the risk of selective outcome reporting bias was high. The bias from randomisation and allocation concealment was low in one study but not in the second. There was an unclear risk of other biases.
When comparing oral vitamin D 100,000 IU/month to 12,000 IU/month, the higher dose may have resulted in higher serum 25(OH)D levels at one year, MD 16.40 (95% CI 12.59 to 20.21) and at two years, MD 18.96 (95% CI 15.20 to 22.72) (low‐quality evidence). There was little or no difference in adverse events between doses (low‐quality evidence). There were more episodes of acute chest syndrome in the high‐dose group, at one year, MD 0.27 (95% CI 0.02 to 0.52) but there was little or no difference at two years, MD 0.09 (95% CI ‐0.04 to 0.22) (moderate‐quality evidence). At one year and two years there was also little or no difference between the doses in the presence of pain (moderate‐quality evidence) or forced expiratory volume in one second % predicted. However, the high‐dose group had lower values for % predicted forced vital capacity at both one and two years, MD ‐7.20% predicted (95% CI ‐14.15 to ‐0.25) and MD ‐7.10% predicted (95% CI ‐14.03 to ‐0.17), respectively. There were little or no differences between dose regimens in the muscle health of either hand or the dominant hand.
The study comparing oral vitamin D3 7000 IU/day to 4000 IU/day (21 participants) did not provide data for analysis, but median serum 25(OH)D levels were reported to be lower in the low‐dose group at both six and 12 weeks. At 12 weeks the median serum parathyroid hormone level was lower in the high‐dose group.
Authors' conclusions
We included three RCTs of varying quality. We consider that the current evidence presented in this review is not of sufficient quality to guide clinical practice. Until further evidence becomes available, clinicians should consider the relevant existing guidelines for vitamin D supplementation and dietary reference intakes for calcium and vitamin D. Well‐designed RCTs of parallel design, are required to determine the effects and the safety of vitamin D supplementation as well as to assess the relative benefits of different doses in children and adults with SCD.
Plain language summary
Vitamin D supplementation for sickle cell disease
Review question
We reviewed the evidence about the effect of giving vitamin D supplements to people with sickle cell disease (SCD).
Background
Vitamin D deficiency is common in people with SCD. Vitamin D regulates calcium levels and supports bone health and a lack of it make worse any bone health problems that people with SCD may have. We wanted to discover whether vitamin D supplements for people with SCD were better or worse than either a placebo (substance which contains no medication) or no vitamin D supplements and also if one dose schedule was better than another.
Search date
The evidence is current to: 14 January 2020.
Study characteristics
We looked at three studies where individuals were selected for different treatments at random. In one study, 39 people with SCD took either vitamin D or placebo tablets for six weeks and were then followed up for six months. In a second study, 62 people with SCD took either vitamin D 100,000 international units (IU)/month or 12,000 IU/month for two years. In the third study, 21 people with SCD took either 7000 IU/day or 4000 IU/day for three months.
Key results
Vitamin D versus placebo
People taking a vitamin D supplement had higher levels of vitamin D in their blood when it was measured after eight, 16 and 24 weeks. There were no differences in the number of people reporting side effects (tingling in the lips or hands). The vitamin D group had fewer days of pain. After eight weeks, the vitamin D group had a slightly worse score for health‐related quality of life (physical functioning score); the difference was greater after 16 and 24 weeks. However, the quality of this evidence was low.
Different vitamin D doses compared
Only one of the two included studies which compared different doses of vitamin D supplementation provided any data for analysis. In the study with data, those taking a high‐dose of vitamin D (100,000 IU/month) had higher levels of vitamin D in their blood when it was measured after one and two years. There were no differences in the number of people reporting side effects, respiratory events, lung function (forced expiratory volume in one second) and hand grip strength. But forced vital capacity (another measure of lung function) was lower in high‐dose group.
The study comparing oral vitamin D3 7000 IU/day to 4000 IU/day reported that people taking the low‐dose had lower average levels of vitamin D in the blood at both six and 12 weeks. At 12 weeks average levels of growth hormone were lower in the high‐dose group.
Given the results from three small clinical trials with moderate to low‐quality evidence, we do not think the results of our review are of sufficient quality to guide clinical practice. Until further evidence is available, clinicians should consider relevant existing guidelines for vitamin D supplementation, and recommendations for calcium and vitamin D intake.
Quality of the evidence
Vitamin D versus placebo
The risk of bias resulting from how people were put into the different groups was low. Also, neither those taking part or their doctor could guess which group they were in once the study started. Adverse events were not detailed in the original report, but the author provided the information when asked. More people dropped out of the placebo group (68.4%) than the vitamin D group (5%). The risk of bias from how the study reported results was high. We considered the evidence for vitamin D blood levels to be moderate quality, and for adverse events, days of pain and health‐related quality of life to be low quality.
Different vitamin D doses compared
The risk of bias resulting from how people were put into the different dose groups was low in one study and unclear in the second. Neither those taking part nor their doctor could guess which group they were in once both studies started. The risk of bias from people taking part dropping out was low, but the risk was high for how the study reported results. Tthe quality of the evidence for vitamin D blood levels and side effects was low, and for respiratory events it was moderate.
Summary of findings
Background
Description of the condition
Sickle cell disease (SCD) is an inherited chronic haemolytic and pro‐inflammatory disorder that affects over 100,000 people in the USA and millions around the globe (Ashley‐Koch 2000; CDC 2012b; Weatherall 2008). The disease is most commonly found in sub‐Saharan Africa as well as in the Mediterranean basin, Saudi Arabia, Central America and India. In some African countries, the prevalence of the sickle gene in the population ranges from less than 1% to as high as 45% (WHO 2010). The clinical manifestations of SCD result from the presence of mutations on the beta globin genes that generate an abnormal haemoglobin product (called haemoglobin S) within the red blood cell (WHO 2010). During periods of hypoxaemia and deoxygenation, a conformational change occurs in the sickle haemoglobin that results in the deformation of red blood cells into a 'sickle' shape. Downstream effects of this include increased vascular adhesivity that leads to vaso‐occlusion and exaggerated haemolysis, which in turn leads to a chronic anaemia. There are several genotypic variants that comprise the range of disorders referred to as SCD. The most common and perhaps most clinically severe form, is sickle cell anaemia (homozygous SS disease), which results from the inheritance of two abnormal sickle S genes. The co‐inheritance of two different abnormal beta globin genes (one being the sickle S gene) results in the various subtypes of SCD. Common subtypes of SCD include haemoglobin SC disease (co‐inheritance of one sickle S gene and an abnormal haemoglobin (C) gene) (CDC 2012a) and haemoglobin Sβ+/0 thalassaemia (co‐inheritance of the sickle S genes (S) with an abnormal beta thalassemia gene) (Rees 2010).
Pain and musculoskeletal complications are the most common reason for healthcare utilisation among people with SCD and remains an important cause of acute and chronic morbidity (Almeida 2005). Acute bone complications such as painful vaso‐occlusive crises, osteomyelitis, stress fractures, orbital compression syndrome, vertebral collapse and bone marrow necrosis are common in people with SCD. Chronic bone complications such as osteonecrosis, chronic degenerative arthritis, osteoporosis, compression spine deformities, dental gnathopathy and impaired growth are also common (Almeida 2005). Individuals with SCD suffer acute and chronic end‐organ damage secondary to recurrent episodes of vaso‐occlusion and chronic ongoing haemolysis. Acute complications not related to bones include strokes, splenic and hepatic sequestration, acute chest syndrome, priapism and aplastic crisis. Chronic end‐organ damage in SCD may present as sickle nephropathy, retinopathy, leg ulcers, pulmonary hypertension and chronic endocrinopathies (Kato 2007). In addition, people with SCD are at greater risk of bacterial infection (Ramakrishnan 2010) which contributes to early mortality (Platt 1994).
Individuals with SCD suffer global deficits in energy and nutrients intake (Hyacinth 2010; Kawchak 2007), with increased catabolism that ultimately causes multiple macro‐ and micro‐nutritional deficiencies (Hyacinth 2010). Among the micronutrient deficiencies, vitamin D deficiency has been found to be common in people with SCD, regardless of age and season (Rovner 2008). The prevalence of vitamin D deficiency among individuals with SCD ranges from 33% to 100% (Adewoye 2008; Buison 2004; Goodman 2010; Gorrido 2012; Jackson 2012; Rovner 2008). Since vitamin D regulates the absorption and excretion of calcium and is essential for bone mineralisation (AFMC 2009), its deficiency in people with SCD may contribute to the myriad of musculoskeletal health problems encountered. These include muscle weakness, chronic debilitating bone pain, avascular necrosis, bone fragility and compression fractures (Osunkwo 2011a), which in turn can lead to functional impairment in mobility and interfere in education, employment and psychosocial development (Swanson 2011).
Description of the intervention
Sources of vitamin D include skin exposure to ultraviolet B radiation in sunlight, dietary sources such as oily fish and variably fortified food, and supplementation (Kennel 2010; Pramyothin 2012). There are two important forms of vitamin D: calciferol (ergocalciferol) (vitamin D2); and cholecalciferol (vitamin D3), which are both biologically inert forms (Holick 2007; Kennel 2010; Park 2011). Vitamin D is metabolised in the liver to 25‐hydroxyvitamin D (25(OH)D) which is the major form circulating in the blood stream (Chung 2009; Pramyothin 2012). Subsequently, the 25‐hydroxyvitamin D (25(OH)D) is metabolised into its active form 1,25‐dihydroxyvitamin D (1,25(OH)2D), mainly in the kidney and some other organs such as the colon, prostate and mammary gland, etc by the action of the 1 α‐hydroxylase enzyme.
The primary functions of vitamin D are to maintain calcium homeostasis and support bone health (Gonzalez 2010; Kennel 2010). Vitamin D affects the calcium and phosphorous absorption in the intestine and indirectly affects bone mineralisation by maintaining normal calcium and phosphorous concentration in the blood. Moreover, vitamin D has extra‐skeletal effects on other systems such as the cardiovascular, immune and pancreatic systems, as well as on muscles, on the brain and on the control of cell cycles (Chung 2009; Gonzalez 2010; Holick 2006). The daily requirements of vitamin D recommended by the USA's Institute of Medicine (IOM) (Ross 2011) and the US Endocrine Practice Guidelines Committee (Holick 2011; Pramyothin 2012) are described in the additional tables (Table 3).
1. Daily vitamin D requirements.
| Life‐stage group (both sexes) | IOM | Committee recommendations for people at risk for vitamin D deficiency | |
| EAR | RDA | Daily requirement | |
| 0 to 12 months | 400 to 1000 IU | ||
| 1 to 18 years | 400 IU | 600 IU | 600 to 1000 IU |
| 19 to 70 years | 400 IU | 600 IU | 1500 to 2000 IU |
| over 70 years | 400 IU | 800 IU | 1500 to 2000 IU |
EAR: estimated average requirement; IOM: USA Institute of Medicine; RDA: recommended dietary allowance
Vitamin D supplementation is usually safe and its toxicity is very rare; however, prolonged periods of excessive intake of vitamin D may result in malaise, drowsiness, nausea, vomiting, abdominal pain, thirst, constipation and loss of appetite (Bennett 2003; Park 2011). It can also lead to hypercalcaemia and causes confusion, cardiac arrhythmias, renal failure and coma (Bennett 2003).
How the intervention might work
The role of vitamin D in calcium homeostasis and bone health has been recognised for many years (Holick 2007; Kennel 2010). Recent studies have also shown that vitamin D has a role in the prevention of cancer (e.g. prostate, colorectal, breast, and pancreas), heart disease, fractures and falls, periodontal disease, autoimmune disease, respiratory infections (e.g. tuberculosis, influenza), type 2 diabetes and depression (Bischoff‐Ferrari 2006; Chung 2009; Gonzalez 2010). Moreover, previous studies have shown the effect in people with SCD of vitamin D supplementation on serum 25‐hydroxyvitamin D (25(OH)D), bone health and bone mineral density (Adewoye 2008), chronic pain and quality of life (Osunkwo 2012). Vitamin D is also important for the immune system (Hewison 1992) for fighting infectious diseases (Chung 2009; Gonzalez 2010). Supplementing vitamin D in people with SCD may reduce the respiratory complications that can contribute to early mortality (Ramakrishnan 2010).
Why it is important to do this review
Vitamin D supplementation is relatively simple as both vitamin D2 and D3 supplements are easily available (Kennel 2010). The empirical evidence shows the importance of vitamin D on bone mineralisation and musculoskeletal health. Moreover, numerous studies suggest that vitamin D plays a role in many chronic diseases (Bischoff‐Ferrari 2006; Chung 2009; Gonzalez 2010; Holick 2007) and in supporting the immune system (Hewison 1992). Cochrane Reviews of randomised controlled trials (RCTs) have been carried out on the effect of vitamin D supplementation in other conditions such as prevention of fractures in post‐menopausal women and older men (Avenell 2014), prevention of mortality in adults (Bjelakovic 2014), cystic fibrosis (Ferguson 2014), multiple sclerosis (Jagannath 2010), chronic kidney disease (Palmer 2009a; Palmer 2009b), chronic painful conditions in adults (Straube 2015) and improving bone mineral density (BMD) in children (Winzenberg 2010). However, the effect of vitamin D supplementation in SCD has never been reviewed. It is therefore important to determine the effects of supplementing vitamin D in order to reduce complications that contribute to significant morbidity and mortality in people with SCD and to identify the optimum treatment regimen. This is an update of a previous review (Soe 2017).
Objectives
To investigate the effects of vitamin D supplementation in children and adults with SCD and to compare different dose regimens.
To determine the effects of vitamin D supplementation on general health (e.g. growth status and health‐related quality of life (HRQoL)), on musculoskeletal health (including BMD, pain crises, bone fracture and muscle health), on respiratory health (including lung function, acute chest syndrome, acute exacerbation of asthma and respiratory infections) and the safety of vitamin D supplementation.
Methods
Criteria for considering studies for this review
Types of studies
Randomised controlled trials (RCTs) and quasi‐RCTs (controlled clinical trials).
Types of participants
People with SCD, of all ages, gender, and phenotypes including sickle cell anaemia (HbSS), haemoglobin SC disease (HbSC) and Sβ‐thalassaemia (HbSβ+ and HbSβ0) diseases.
Types of interventions
Oral administration of any form of vitamin D supplementation at any dose and for any duration. A comparison of one type or dose of vitamin D versus another type or dose or versus either placebo or no supplementation.
Types of outcome measures
Primary outcomes
Serum 25‐hydroxyvitamin D (25(OH)D) level (reported as absolute change from baseline)
-
BMD measured by dual energy X‐ray absorptiometry (DEXA) and reported as per cent (%) change from baseline
at lumbar spine
at hips
at forearm
total body
Adverse events (e.g. nausea, drowsiness, vomiting, loss of appetite, constipation, confusion, cardiac arrhthymias, renal failure, coma)
Secondary outcomes
Serum parathyroid hormone (PTH) level
Bone fracture (confirmed by radiology)
Muscle health (assessed by handgrip)
-
Pain
presence of pain
frequency of pain
duration of pain
severity or intensity of pain (measured using a validated scale)
-
Growth status
height
weight
body mass index (BMI)
-
Respiratory outcomes
acute chest syndrome
acute exacerbation of asthma
respiratory infections such as tuberculosis, pneumonia, etc
lung function tests (forced expiratory volume at one second (FEV1), forced vital capacity (FVC))
HRQoL (using a validated scale)
Search methods for identification of studies
Studies will be eligible for inclusion irrespective of language or publication status.
Electronic searches
We identified relevant studies from the Cystic Fibrosis and Genetic Disorders Group's Haemoglobinopathies Trials Register using the terms: (sickle cell OR (haemoglobinopathies AND general)) AND vitamin D.
The Haemoglobinopathies Trials Register is compiled from electronic searches of the Cochrane Central Register of Controlled Trials (CENTRAL) (updated each new issue of the Cochrane Library) and weekly searches of MEDLINE. Unpublished work is identified by searching the abstract books of five major conferences: the European Haematology Association conference; the American Society of Hematology conference; the British Society for Haematology Annual Scientific Meeting; the Caribbean Health Research Council Meetings; and the National Sickle Cell Disease Program Annual Meeting. For full details of all searching activities for the register, please see the relevant sections of the Cochrane Cystic Fibrosis and Genetic Disorders Group's website.
Date of latest search: 19 March 2020.
We applied no language or date restriction in our search methods. We searched the database such as PubMed and clinical trial registries such as ClinicalTrials.gov (www.clinicaltrials.gov/), Pan African Clinical Trials Registry (www.pactr.org/) and Clinical Trials Registry ‐ India (www.ctri.nic.in/). We also searched WHO International Clinical Trials Registry Platform (WHO ICTRP) (www.who.int/ictrp/en/). Please see the appendices for full details (Appendix 1; Appendix 2; Appendix 3; Appendix 4).
Date of latest search: 14 January 2020.
Searching other resources
We checked the reference lists of retrieved relevant articles for additional trials. We also contacted the corresponding author of relevant trials for details of any additional trials.
Data collection and analysis
Selection of studies
Two authors (HHKS, NNT) independently assessed the titles and abstracts of all articles identified from the literature searches to identify potentially relevant reports. We were not blinded to information about articles such as the journal of publication, author names, institution, or the study results. We also retrieved and reviewed the full‐text articles for eligibility in accordance with the specified criteria for the inclusion of studies. There was no disagreement regarding the eligibility of the studies. However, if there are any disagreements in the future, we will resolve these by discussion, and if necessary, we will consult a third review author (ALA). All irrelevant studies were excluded and we presented these with reasons for exclusion in the Characteristics of excluded studies table.
Data extraction and management
Two authors (HHKS, JS) independently extracted the data from included studies using a standard data collection form and check for consistency. We contacted the author of included study in an effort to obtain further details. There were no disagreements, however, if there is any discrepancy in a future update, we aim to resolve this by discussion and if required, we will consult with a third review author (ALA) to reach a consensus. One author (HHKS) entered relevant data into RevMan, and two authors checked for errors (JS, ALA) (RevMan 2014).
The authors extracted the following details.
-
Source
Study identifier (ID) (created by review author)
Report ID (created by review author)
Review author ID (created by review author)
Citation (journal or conference, year of publication, etc)
Contact details
-
Eligibility
Confirm eligibility for review
Reason for exclusion
-
Methods
Study design
Study setting
Time and duration of study
Randomisation
Allocation sequence concealment
Blinding of participants, care providers and outcome assessors
Other concerns about bias
Intention‐to‐treat analysis
-
Participants
Total number
Eligibility criteria (inclusion and exclusion criteria)
Age and sex of participants
-
Interventions
Total number of intervention groups
For each intervention and comparison group of interest
Dose of intervention
Type of administration
Timing of administration
Frequency of administration
Duration of intervention
Co‐interventions (if any)
-
Outcomes (for each outcome of interest)
Outcome definition (diagnostic method, name of scale, definition of threshold)
Units of measurement (if relevant)
For scales, upper and lower limits, and whether a high or low score is favourable
-
Results
Number of participants allocated to each intervention group
-
For each outcome of interest
Sample size
Missing participants
Summary data for each intervention group (mean and standard deviation (SD) for continuous data, 2 x 2 table for dichotomous data, etc)
-
Miscellaneous
Key conclusions of the study authors
References to other relevant studies
Funding source
Correspondence required
We collated information from multiple reports of the included studies. We present data for each comparison separately, i.e. supplementation versus placebo, different supplementation regimens compared. We intended to group the outcome data into those measured at one month, over one month and up to three months, over three months and up to six months, over six months and up to one year and annually thereafter. We also planned to record the outcomes which were measured at other time periods.
Assessment of risk of bias in included studies
Two authors (HHKS and JS) independently assessed the risk of bias of the single included trial using a method described in the Cochrane Handbook of Systematic Reviews of Interventions (Higgins 2011). We assessed the risk of bias in seven domains (sequence generation, allocation concealment, blinding of participants and personnel, blinding of outcome assessment, incomplete outcome data, selective outcome reporting, and other potential sources of bias). In each domain, we assigned a judgment of either low, high or unclear risk of bias, according to the criteria described in the Cochrane Handbook of Systematic Reviews of Interventions (Higgins 2011). We resolved any discrepancies by discussion. If we are not able to reach a consensus by discussion in future, we will consult a third review author (ALA). We reported these assessments in the risk of bias table for the included study (Characteristics of included studies).
Measures of treatment effect
Dichotomous data
We assessed dichotomous data such as adverse events (tingling of hands or lips) using the risk ratio (RR) with 95% confidence intervals (CI).
Continuous data
We analysed continuous data such as serum 25‐hydroxyvitamin D (25(OH)D) level, frequency of pain and HRQOL using he mean difference (MD) and the corresponding 95% CIs. In future, if different scales are used for measuring same outcome, we will use standardised mean difference (SMD) and corresponding 95% CIs.
Count data
For counts of rare events, we intended to present the results using the rate ratio (RR) with 95% CIs.
For counts of common events, we intended to present the results using mean difference (MD) comparing the difference in the mean number of events occurred in participants of intervention group with participants in control group and their corresponding 95% CIs.
Unit of analysis issues
If we identify any cluster‐randomised studies, and if there is little heterogeneity between them, we will combine the results from both individually randomised studies and cluster‐randomised studies. If possible, we will also perform a sensitivity analysis to investigate the effects of the randomisation unit (see below).
If the authors of the cluster‐randomised studies ignored the clustering in their analyses, we will calculate the studies' effective sample sizes using an estimate of the intracluster correlation coefficient (ICC). We will derive the ICC from a study (if available) or from similar studies, and we will calculate the design effect using the formula given in the Cochrane Handbook of Systematic Reviews of Interventions (Higgins 2011). If we use the ICC from other similar studies, we will perform a sensitivity analysis to investigate the effect of variations in the ICC.
For any cross‐over studies identified in the searches, if we believe there is a carryover effect which will outlast any washout period included in the study or where second period data are unavailable, we will include only data from the first arm in the meta‐analysis. If we identify studies with more than two intervention groups, we will combine the groups to create a single pair‐wise comparison.
Dealing with missing data
We investigated the attrition rate including dropouts, withdrawals and losses to follow up in the included study. We contacted the principal investigator of two included study for the data which are missing with no reported reason for dropouts. We attempted to obtain missing data by contacting the study authors. One study author provided summary statistics for use in this review (Osunkwo 2012) and the authors of a second study provided individual patient data (Lee 2018). The authors of the third study in this review did not provide any data, e.g. means or SDs, for our analysis (Dougherty 2015).
In future, if we identify studies published only in abstract form, or presented at meetings or conferences, we will contact the study authors for further details or data as needed. We will investigate the attrition rate including dropouts, withdrawals and losses to follow up in the included studies. If the data are unclear or missing with no reported reason for dropouts, we will contact the study authors to request further information. In order to allow an intention‐to‐treat analysis, we will collect the data by allocated treatment groups (regardless of compliance or whether enrolled participants were later found to be ineligible or excluded from treatment group).
Assessment of heterogeneity
We did not assess heterogeneity as there was only a single included study for each comparison. In future updates of this review if we are able to include and combine data from more studies, we will visually assess the forest plots to determine whether there is heterogeneity. The Chi² test will be used and a P value of less than 0.10 will be considered to demonstrate statistically significant heterogeneity. We will also use the I² statistic to quantify the inconsistency across the studies. We will categorise the I² value of 0% to 40% as not important heterogeneity, 30% to 60% as moderate heterogeneity, 50% to 90% as substantial heterogeneity and 75% to 100% as considerable heterogeneity (Deeks 2011).
Assessment of reporting biases
We compared the 'Methods' section with the 'Results' section of study report to assess whether the study authors reported all the outcomes which were stated as being measured. We were not able to use funnel plots to assess publication bias in this review. In future update of this review, if we include 10 or more studies in a meta‐analysis, we will use funnel plots to assess publication bias. If there is asymmetry, we will investigate the possible causes of this, such as publication bias, true heterogeneity and a high risk of bias.
Data synthesis
We included only one study comparing vitamin D and placebo, therefore we did not perform formal meta‐analyses for this comparison. With regards to the comparison of different vitamin D doses, the variability of interventions in the two included studies meant we did not perform any meta‐analyses. However, we have presented the results from these studies in the Data and analyses section. In future, if we include more studies and if there is no clinical variation (e.g. variability of interventions, participants and diverse outcomes) between the studies, we will pool the results and perform meta‐analyses using RevMan (RevMan 2014). If the studies are sufficiently similar in intervention, participants and outcomes reported, and if there is no significant heterogeneity (I² < 50%), we will use a fixed‐effect model. If there is substantial or considerable heterogeneity identified (I² > 50%), we will use a random‐effects model. If there is considerable heterogeneity, we will check the data entry for accuracy and also investigate the cause of the heterogeneity according to the Cochrane Handbook for Systematic Reviews of Interventions (Higgins 2011).
Subgroup analysis and investigation of heterogeneity
In future updates, if we identify substantial or considerable heterogeneity in the results for the primary outcomes, we will perform the following subgroup analyses:
different forms of vitamin D supplementation (vitamin D₂ versus D₃);
different durations of vitamin D supplementation (less than six months versus six months or greater);
different doses of vitamin D supplementation (up to and including 400 IU versus more than 400 IU daily);
different types of SCD (HbSS, HbSC, HbSβ+ and HbSβ0).
Sensitivity analysis
We did not carry out sensitivity analysis in this review to determine the robustness of the findings. In future updates of this review, if there are a sufficient number of studies included and combined (10 or more), we will perform an additional analysis excluding those studies with a high risk of bias for allocation concealment or incomplete outcome data, or both. We will repeat the meta‐analyses using both the fixed‐effect and the random‐effects models to assess how the findings are robust to this choice of method. We will also repeat the analyses if we include any cluster‐randomised studies to investigate the effects of the randomisation unit. We will perform a further sensitivity analysis if we use the ICC from other similar trials to calculate the studies' effective sample sizes in cluster‐randomised studies. We will produce summary tables reporting on any sensitivity analyses undertaken.
Summary of findings table
We used a GRADEprofiler software (GRADEpro 2015) to prepare a 'Summary of findings' table for each comparison (Table 1; Table 2). We assessed the quality of evidence for the outcomes of the included study by using the GRADE approach. In the 'Summary of findings' tables, we present the primary outcomes serum 25‐hydroxyvitamin D (25(OH)D) level, total body BMD and adverse events; we also present the secondary outcomes pain, respiratory events such as acute chest syndrome and respiratory infections, and HRQoL. We considered the risk of bias (methodological quality), the indirectness of evidence, the inconsistency and imprecision of effect estimates and the risk of publication bias to assess the quality of the body of evidence for each of the included outcomes. The quality of evidence was specified to four levels such as high, moderate, low and very low.
Summary of findings 1. Vitamin D versus placebo for sickle cell disease.
| Vitamin D versus placebo for sickle cell disease | ||||||
| Patient or population: people with sickle cell disease Settings: outpatients, single clinic in USA Intervention: vitamin D Comparison: placebo | ||||||
| Outcomes | Illustrative comparative risks* (95% CI) | Relative effect (95% CI) | No of participants (studies) | Quality of the evidence (GRADE) | Comments | |
| Assumed risk | Corresponding risk | |||||
| Placebo | Vitamin D | |||||
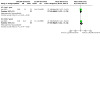
| Serum 25(OH)D level (change from baseline) Follow‐up: 6 months | The mean change in serum 25(OH)D level from baseline in the placebo group was ‐7.23952 nmol/L. | The mean change in serum 25(OH)D level from baseline in the intervention group was 15.52higher (13.50 to 17.54 higher) than in the placebo group. | NA | 37 (1 study) | ⊕⊕⊕⊝ moderatea | There were also higher serum 25(OH)D levels in the vitamin D group than in the placebo group at 8 and 6 weeks. |
| Total body BMD measured by DEXA (% change from baseline) | Not estimable. | Not estimable. | No study assessed this outcome. | |||
| Adverse events Follow‐up: 6 months | 0 out of 19 participants. | 1 out of 18 participants. | RR 3.16 (0.14 to 72.84) | 37 (1 study) | ⊕⊕⊝⊝ lowa,b | No serious adverse events were reported, only tingling of lips or hands. There was no significant difference of these minor adverse events between vitamin D and placebo. |
| Frequency of pain (change from baseline) Follow‐up: 8 weeks | The mean frequency of pain in the placebo group was 4.25 days. | The mean frequency of pain in the intervention group was 10 less (16.47 to 3.53 less) than in the placebo group. | NA | 37 (1 study) | ⊕⊕⊝⊝ lowa,b | Data not available at 16 and 24 weeks, but study report describes "a distinct trend towards fewer pain days between visits over the first 16 weeks of the study in the vitamin D group. Although this change did not reach statistical significance due to the small sample size. It is in contrast to the sporadic fluctuation in the number of pain days seen in the placebo group over the same time period". |
| Acute chest syndrome | Not estimable. | Not estimable. | No study assessed this outcome. | |||
| Respiratory infections | Not estimable. | Not estimable. | No study assessed this outcome. | |||
| HRQoL score (physical functioning) (change from baseline) Follow‐up: 6 months | The mean change in HRQoL score from baseline in the control group was 8.88158. | The mean change in HRQoL score from baseline in the intervention group was 12.59lower (17.43 lower to 7.76 higher) than in the placebo group. | NA | 37 (1 study) | ⊕⊕⊝⊝ lowa,b | There was no significant difference in the change in HRQoL score between vitamin D and placebo at 8 weeks, but at 16 weeks results favoured the placebo group as they did at 24 weeks. |
| *The basis for the assumed risk (e.g. the median control group risk across studies) is provided in footnotes. The corresponding risk (and its 95% CI) is based on the assumed risk in the comparison group and the relative effect of the intervention (and its 95% CI). BMD: bone mineral density;CI: confidence interval; DEXA: dual energy X‐ray absorptiometry; HRQOL: health‐related quality of life; 25(OH)D: 25‐hydroxyvitamin D. | ||||||
| GRADE Working Group grades of evidence High quality: further research is very unlikely to change our confidence in the estimate of effect. Moderate quality: further research is likely to have an important impact on our confidence in the estimate of effect and may change the estimate. Low quality: further research is very likely to have an important impact on our confidence in the estimate of effect and is likely to change the estimate. Very low quality: we are very uncertain about the estimate. | ||||||
a 20 participants were randomised to the vitamin D group and 19 participants were randomised to the placebo group. There was a large proportion of dropouts in the placebo group (13 out of 19 (68.4%)) compared to the vitamin D group (1 out of 20 (5%)). Two participants who were randomised to the drug have missing values of baseline serum 25(OH)D. b Wide CIs.
Summary of findings 2. Vitamin D 100,000 IU/month versus 12,000 IU/month for sickle cell disease.
| Vitamin D 100,000/month versus 12,000/month for sickle cell disease | ||||||
|
Patient or population: people with sickle cell disease
Settings: outpatients, single centre in USA
Intervention: vitamin D 100,000 IU/month Comparison: vitamin D 12,000 IU/month | ||||||
| Outcomes | Illustrative comparative risks* (95% CI) | Relative effect (95% CI) | No of participants (studies) | Quality of the evidence (GRADE) | Comments | |
| Assumed risk | Corresponding risk | |||||
| 12,000 IU/month | 100,000 IU/month | |||||
|
Serum 25‐hydroxyvitamin D (25(OH)D) level (change from baseline) (ng/mL) Follow‐up: 2 years |
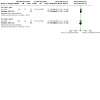
The mean change in serum 25(OH)D level from baseline in the 12,000 IU group was 5.45 ng/mL. | The mean change in serum 25(OH)D level from the baseline in the 100,000 IU group was 18.96 ng/mLhigher (15.20 to 22.72 higher) than 12,000 IU group. | NA | 57 (1 study) | ⊕⊕⊝⊝ lowa,b | There was also significant difference of serum 25(OH)D levels between doses at 1 year follow‐up. |
| Total body BMD measured by DEXA (% change from baseline) | Not estimable. | Not estimable. | No study assessed this outcome. | |||
| Adverse events Follow‐up: 2 years | 62 (1 study) | ⊕⊕⊝⊝ lowa,b | There were no differences in constipation, pain syndrome, fever, increase in bilirubin, anaemia, injury, cholecystitis, surgical procedure, urinary tract infection, viral syndrome, headache and dysmenorrhea between the doses. | |||
|
Presence of pain Follow‐up: 2 years |
16 out of 31 participants. | 16 out of 31 participants. | RR 1 (0.62 to 1.62) | 62 (1 study) | ⊕⊕⊕⊝ moderatea | There was no significant difference of presence of pain between doses. |
|
Acute chest syndrome Follow‐up: 2 years |
The mean episodes of acute chest syndrome in the 12,000 IU group was 0.05. | The mean episodes of acute chest syndrome in the 100,000 IU group was 0.09 higher (0.04 lower to 0.22 higher). | 62 (1 study) | ⊕⊕⊕⊝ moderatea | At 1 year, there was significant difference between the doses as the mean episodes of acute chest syndrome was higher in 100,000 IU group. | |
|
Respiratory infections Follow‐up: 2 years |
The mean episodes of respiratory infections in the 12,000 IU group was 1.47. | The mean episodes of respiratory infections in the 100,000 IU group was 0.21 lower (0.7 lower to 0.28 higher). | 62 (1 study) | ⊕⊕⊕⊝ moderatea | There was also no significant difference of episodes of respiratory infections between doses at 1 year follow‐up. | |
| HRQoL (using a validated scale) | Not estimable. | Not estimable. | No study assessed this outcome. | |||
| *The basis for the assumed risk (e.g. the median control group risk across studies) is provided in footnotes. The corresponding risk (and its 95% confidence interval) is based on the assumed risk in the comparison group and the relative effect of the intervention (and its 95% CI). CI: confidence interval; HRQoL: health‐related quality of life; RR: risk ratio. | ||||||
| GRADE Working Group grades of evidence igh quality: further research is very unlikely to change our confidence in the estimate of effect. Moderate quality: further research is likely to have an important impact on our confidence in the estimate of effect and may change the estimate. Low quality: further research is very likely to have an important impact on our confidence in the estimate of effect and is likely to change the estimate. Very low quality: we are very uncertain about the estimate. | ||||||
a Not all outcomes are reported. b Wide CIs.
Results
Description of studies
Results of the search
We identified 22 records from our searches, five of which were identified through the search of the Cystic Fibrosis and Genetic Disorders Group's Haemoglobinopathies Trials Register, five records were identified through a search of the PubMed database and 12 records were identified through searching online trials registries. After removing duplicates, we screened 18 records and we excluded four records. When we assessed the remaining 14 references to nine studies for eligibility, we included three studies (eight references) (Dougherty 2015; Lee 2018; Osunkwo 2012) and excluded three studies (single reference each) (ACTRN12612000560897; Adewoye 2008; NCT01276587). We have listed three studies as ongoing (single reference each) (NCT03417947; NCT04170348; PACTR201803003160262). Please refer to the study flow diagram which illustrates the selection process (Figure 1).
1.
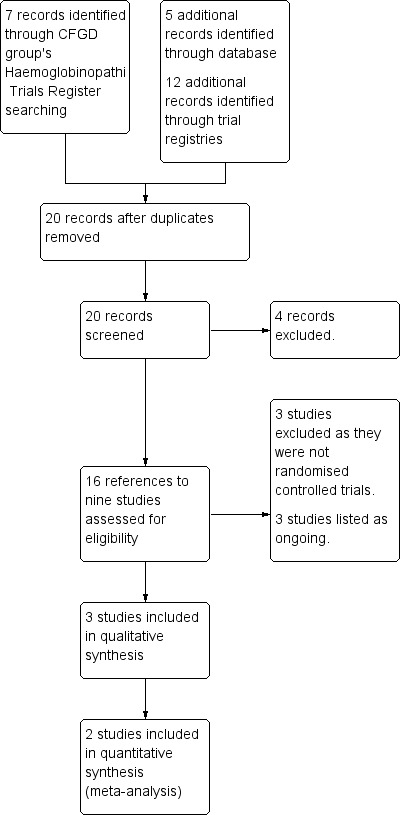
Study flow diagram.
Included studies
One placebo‐controlled study (Osunkwo 2012) and two dose comparison studies were included in this review (Dougherty 2015; Lee 2018).
Vitamin D supplementation versus placebo
Study design
The included placebo‐controlled study was a double‐blind RCT conducted in the USA. It was a pilot study aimed at evaluating the safety and efficacy of high‐dose vitamin D in reducing chronic pain in children with SCD. The duration of the treatment was six weeks with six months of follow‐up. This study was approved by Emory Universiy Institutional Review Board and written informed consent was obtained before the study procedures.
Participants
The RCT enrolled 46 people with SCD (HbSS, HbSC, HbSβ+thal and HbSβ0thal) during a steady state, i.e. 30 days or more since blood transfusion and 14 days or more from any acute sickle complication. Pariticpants were aged between seven and 21 years and the mean age was 13.2 years. The study's exclusion criteria are listed in the tables (Characteristics of included studies). Out of the 46 people with SCD who were enrolled, seven participants withdrew before randomisation ‐ details are provided in the tables (Characteristics of included studies); therefore 39 participants were randomised, but only 25 participants completed the full six months of follow up. There were 20 participants randomised to the vitamin D group and 19 participants randomised to placebo group. In the case of two participants who were randomised to the active drug, the baseline values for serum 25‐hydroxyvitamin D are missing so the number of samples analysed was only 37. The vitamin D and placebo groups had similar baseline characteristics including age, gender, genotypes, laboratory indices (25‐hydroxyvitamin D, calcium and alkaline phosphatase) and complications, such as number of emergency department visits for pain and number of hospitalised days with pain in the preceding 12 months.
Intervention
Participants were stratified by chronic pain status and randomised to receive either oral vitamin D3 (cholecalciferol) dosed according to weight (240,000 to 600,000 international units (IU)) or placebo for a duration of six weeks. Participants were also given an oral daily supplement containing 500 mg calcium and 200 IU vitamin D for six months to ensure no participants developed severe vitamin D deficiency during the study period.
Outcomes
Outcomes included serum 25‐hydroxyvitamin D, HRQOL which was measured using Pediatric Quality of Life Inventory (PedsQL™), pain diaries and the number of pain days. Adverse events, including hypocalcaemia, were also reported. Further details of the outcomes of included study are provided in the tables (Characteristics of included studies).
Vitamin D regimens compared
Study design
Both studies were double‐blind RCTs of parallel design conducted in the USA (Dougherty 2015; Lee 2018). The duration of treatment was 12 weeks in one study (Dougherty 2015) and two years in the second study (Lee 2018).
Participants
One study enrolled 21 participants with HbSS SCD; the mean age of the participants was 10.8 years (Dougherty 2015). The study's exclusion criteria are listed in the tables (Characteristics of included studies). Nine participants were randomized to the vitamin D3 7000 IU group and 12 participants to the vitamin D3 4000 IU group.
The second study recruited 62 participants with SCD (HbSS, HbSC, HbSβ thalassemia) who had 25‐hydroxyvitamin D (OHD) levels of 5 to 60 ng/mL (Lee 2018). The mean age of the participants was 9.9 years. The study's exclusion criteria are listed in the tables (Characteristics of included studies). There were 31 participants randomized to the vitamin D3 100,000 IU group and 31 participants randomized to the vitamin D3 12,000 IU group.
Intervention
In the Dougherty study, participants either received oral vitamin D3 7000 IU per day or oral vitamin D3 4000 IU per day for a duration of 12 weeks (Dougherty 2015). In the Lee study, participants were stratified by age (3 to 9 years and 10 to 20 years), gender, and hydroxyurea therapy, and randomized to receive either oral vitamin D3 100,000 IU or oral vitamin D3 12,000 IU which was give once monthly for a duration of 24 months (Lee 2018).
Outcomes
Both studies reported on serum 25(OH)D (Dougherty 2015; Lee 2018). Serum PTH and HRQoL (which was measured using PROMIS pediatric short forms) were reported in one study (Dougherty 2015). The second study included the annual rate of respiratory events (defined as episodes of respiratory infections), asthma exacerbations, or acute chest syndrome (ACS) measured using a validated respiratory questionnaire, pulmonary function tests, and hand grip which was measured using hand‐held dynamometry (Lee 2018). Further details of the outcomes of included studies are provided in the tables (Characteristics of included studies).
Excluded studies
We excluded three studies from this review as they were not RCTs (ACTRN12612000560897; Adewoye 2008; NCT01276587).
Ongoing studies
All three ongoing RCTs are of parallel design (NCT03417947; NCT04170348; PACTR201803003160262); two of these specify that they are double‐blind (NCT03417947; NCT04170348). One is being undertaken in Canada (NCT03417947), the second in the USA (NCT04170348) and the third in South Africa (PACTR201803003160262). Duration is from six weeks (PACTR201803003160262) to two years (NCT04170348). All three RCTs are recruiting children and adolescents (NCT03417947; NCT04170348; PACTR201803003160262).
One RCT is placebo‐controlled comparing a single liquid bolus of 300,000 IU oral vitamin D3 (cholecalciferol) to placebo (NCT03417947). The remaining two studies compare different doses of vitamin D: one comparing oral vitamin D3 3,333 IU/day to bolus oral vitamin D3 100,000 IU/month (NCT04170348); and the second comparing oral vitamin D3 50,000 IU once a week to oral vitamin D2 50,000 IU once a week (PACTR201803003160262).
Risk of bias in included studies
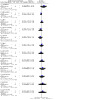
Three studies were eligible for inclusion in this review (Dougherty 2015; Lee 2018; Osunkwo 2012). The risks of bias of the included studies are summarised in Figure 2.
2.
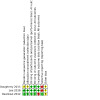
Risk of bias summary: review authors' judgements about each risk of bias item for each included study.
Allocation
Vitamin D supplementation versus placebo
The included study was described as randomised and reported that "the participants were stratified according to chronic pain status and randomised to either vitamin D or placebo" (Osunkwo 2012). Randomisation and allocation concealment were not explicitly described in the study report. The lead investigator has confirmed that the randomisation sequence was computer‐generated using a block randomisation method.
Regarding the prevention of allocation being foreseen in advance of, or during, enrolment, the investigators used white opaque envelopes which were kept at the investigator pharmacy. Once randomised, a clinical research associate (CRA) was given the participant's allocation. We therefore judge these domains to have a low risk of bias.
Vitamin D regimens compared
One study was judged to have an unclear risk of bias for sequence generation since it was described as randomized, but the method of sequence generation was not explicitly described in the study report (Dougherty 2015). The second study was judged to have a low risk of bias for sequence generation as it reported that participants were stratified by age (3 to 9 years and 10 to 20 years), gender and hydroxyurea therapy, and then randomized using computer‐generated randomization with use of randomly permuted blocks of size 2, 4 or 6 (Lee 2018).
One study was judged to have an unclear risk of bias for allocation concealment no details of the process are explicitly described in the study report (Dougherty 2015). The second study was judged to have a low risk of bias as it reported that "Randomization was performed by the research pharmacy; all other research staff and participants were blinded to allocation" (Lee 2018).
Blinding
Vitamin D supplementation versus placebo
The included study was described as being double blind and vitamin D or placebo was dosed by weight and given weekly using a modified Stoss therapy regimen (Osunkwo 2012). From correspondence, all clinicians, CRAs, participants (and their parents or carers) were blinded. Therefore, we judged the study to have a low risk of bias for this domain.
Vitamin D regimens compared
Both studies were described as double‐blind and were judged to have low risk of bias in this domain. (Dougherty 2015; Lee 2018). One study reported that two doses were provided as capsules of identical size, shape and colour (Dougherty 2015). The second study describes two doses of vitamin D which were provided in identical capsules, and all research staff were blinded to allocation; moreover, the investigator who reviewed the questionnaires to determine the respiratory event was blinded (Lee 2018).
Incomplete outcome data
Vitamin D supplementation versus placebo
The study reported that 46 people with SCD were enrolled; however, seven participants withdrew before randomisation for the following reasons: inconvenience (n = 2); inability to swallow pills (n = 1); relocation (n = 3); medical exclusion (n = 1). A total of 39 participants were randomised, but only 25 participants completed the full six months of follow up. Reasons for the 14 withdrawals were provided by the investigators upon request. The dropout in placebo group was high, 13 out of 19 (68.4%), compared to one out of 20 (5%) in the vitamin D group. In the placebo group, the reasons included: inability to swallow pills and exited week 0 (n = 1); did not like calcium chew and revoked consent at week 16 (n = 1); lost to follow up week 16 (n = 6); moved out of state (n = 4); and revoked consent (n = 1). In the vitamin D group, one participant exited the study early at week 20 after a decision made by the principal investigator. Upon correspondence, the lead investigator confirmed that "2 patients were randomized to drug but have missing values of serum 25‐hydroxyvitamin D for their week 0 so the number of samples analysed was 37. Due to the longitudinal nature of the data and presence of missing values, repeated measures analyses were conducted using the MIXED procedure". Due to large proportion of dropouts in the placebo group compared to the vitamin D group, we judged the study to have a high risk of bias in this domain.
Vitamin D regimens compared
In one study a total of 21 participants were randomized, but one participant was not included at 12 weeks and the reasons for the loss to follow‐up were not described; however, the study reported that the analysis was by intention‐to‐treat model and we therefore judged the study to have a low risk of bias from incomplete outcome data (Dougherty 2015). The second study also performed analysis using intention‐to‐treat principle and reported that none of the participants were excluded from analysis; therefore, we judged this study to also have a low risk of bias for this domain (Lee 2018).
Selective reporting
Vitamin D supplementation versus placebo
Even though the study protocol was not available, the review authors compared the methods section with the results section of the main publication for the included study. Adverse event data were not presented in the published report; however, these were provided by the lead investigator upon request. From correspondence, muscle strength was evaluated at baseline, but there were too many cases of missing data at follow up to include these results. We judged the study had a low risk of bias in this domain.
Vitamin D regimens compared
Study protocols were not available for either study in this comparison and after comparing the Methods sections to the Results sections we judged both of the studies to have a high risk of bias for this domain (Dougherty 2015; Lee 2018). One study described anthropometric measurements (skinfold thickness and mid‐arm circumference) and adverse events in the Methods section, but did not report results for these outcomes (Dougherty 2015). Similarly in the second study, immune function, bone function and bone turnover markers were listed in the Methods section but these outcomes were not reported in the Results section (Lee 2018).
Other potential sources of bias
Vitamin D supplementation versus placebo
We do not have sufficient information to assess if any other potential sources of bias exist for the included study; therefore, the judgement for this domain is unclear (Osunkwo 2012).
Vitamin D regimens compared
We do not have sufficient information to assess if any other potential sources of bias exist for the included studies; therefore, the judgement for both studies in this domain is unclear (Dougherty 2015; Lee 2018).
Effects of interventions
Vitamin D supplementation versus placebo
We identified one study which met our inclusion criteria and investigated the effect of vitamin D supplementation in people with SCD (n = 39) (Osunkwo 2012).
Primary outcomes
1. Serum 25(OH)D level
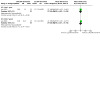
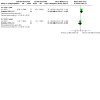
The data for serum 25(OH)D level was provided by study author upon request. This outcome was assessed as absolute change from baseline (subtracting baseline measurement from final measurement) in the included study (Osunkwo 2012). There were significant differences in serum 25(OH)D levels between the vitamin D group and the placebo group at eight weeks, 16 weeks and 24 weeks. At eight weeks, the vitamin D group reported a difference in serum 25(OH)D level 29.79 nmol/L higher compared to the placebo group, MD 29.79 (95% CI 26.63 to 32.95), at 16 weeks MD 12.67 nmol/L higher, MD 12.67 (95% CI 10.43 to 14.90) and at 24 weeks MD 15.52 nmol/L higher, MD 15.52 (95% CI 13.50 to 17.54) (Analysis 1.1). The quality of evidence for this outcome was moderate (Table 1).
1.1. Analysis.
Comparison 1: Vitamin D versus placebo, Outcome 1: Serum 25‐hydroxyvitamin D (25(OH)D) level (change from baseline) (nmol/L)
2. BMD
This outcome was not reported in the included study (Osunkwo 2012).
3. Adverse events
Adverse events (tingling of lips or hands) was measured in the included study and data provided by the study author upon request (Osunkwo 2012). There was no significant difference in reported adverse events between the vitamin D group and the placebo group, RR 3.16 (95% CI 0.14 to 72.84) (Analysis 1.2). The quality of evidence for this outcome was low (Table 1).
1.2. Analysis.
Comparison 1: Vitamin D versus placebo, Outcome 2: Adverse events
Secondary outcome
1. Serum parathyroid hormone level
This outcome was not reported in the included study (Osunkwo 2012).
2. Bone fracture
This outcome was not reported in the included study (Osunkwo 2012).
3. Muscle health
This outcome was not reported in the included study (Osunkwo 2012).
4. Pain
The study author provided this outcome upon request. A 30‐day pain diary was administered after informed consent to measure baseline pain status and was used to calculate the mean (SD) number of pain days for each group in that period. The included study assessed the change in the mean number of pain days between the first 30‐day diary period and the second diary period (60 days) at eight weeks (Osunkwo 2012). There was a significant difference in the frequency of pain between the vitamin D and placebo groups; the vitamin D group had 10 fewer pain days than placebo group, MD ‐10.00 days (95% CI ‐16.47 to ‐3.53) (Analysis 1.3). The quality of the evidence for this outcome to be low (Table 1). The study author did not provide the data of this outcome for 16 and 24 weeks though it was reported in trial report. The study author stated in the trial report that "there was a distinct trend towards fewer pain days between visits over the first 16 weeks of the study in the vitamin D group. Although this change did not reach statistical significance due to the small sample size, it is in contrast to the sporadic fluctuation in the number of pain days seen in the placebo group over the same time period".
1.3. Analysis.
Comparison 1: Vitamin D versus placebo, Outcome 3: Frequency of pain (change from baseline)
5. Growth status
This outcome was not reported in the included study (Osunkwo 2012).
6. Respiratory outcomes
Respiratory outcomes were not reported in the included study (Osunkwo 2012).
7. HRQoL
The included study measured HRQoL using the Pediatric Quality of LIfe Inventory (PedsQL™) (Osunkwo 2012). The original report states that "Two‐way analysis of variance models compared PedsQL scores between treatment groups over time" and upon correspondence, the study author provided that data were analysed as a three‐way interaction between 25OHD, pain and quality of life over time. The original report states "there were no significant differences in mean PedsQL component scores between treatment groups over time for any other subscale measured". Upon request, the study author provided physical functioning PedsQL scores as absolute change from baseline (subtracting baseline measurement from final measurement) where a higher score indicates a better HRQoL. In this review, we calculated the difference in means as summary statistics using the inverse‐variance fixed‐effect method and present data at eight, 16 and 24 weeks (Analysis 1.4). At eight weeks, there was no significant difference in score between the vitamin D and placebo groups, MD ‐2.02 (95% CI ‐6.34 to 2.30) (Analysis 1.4) and we judged the quality of the evidence to be low (Table 1). However, there were significant differences in HRQoL score between the groups at 16 weeks and 24 weeks. At 16 weeks, the vitamin D group had a score 12.56 points lower compared to the placebo group, MD ‐12.56 (95% CI ‐16.44 to ‐8.69) and at 24 weeks the vitamin D group had a score 12.59 points lower than placebo, MD ‐12.59 (95% CI ‐17.43 to ‐7.76) (Analysis 1.4), but we judged the quality of evidence to be low.
1.4. Analysis.
Comparison 1: Vitamin D versus placebo, Outcome 4: Health‐related quality of life (physical functioning score) (change from baseline)
Vitamin D supplementation regimens compared
We identified two studies which met our inclusion criteria and investigated the effect of different regimens of vitamin D supplementation in people with SCD (n = 83) (Dougherty 2015; Lee 2018).
Vitamin D 100,000 IU/month versus 12,000 IU/month
One study (n = 62) presented data on this comparison (Lee 2018).
Primary outcomes
1. Serum 25(OH)D level
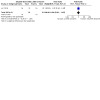
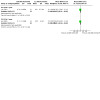
Upon request, the study author provided the individual patient data. This outcome was assessed as absolute change from baseline (subtracting baseline measurement from final measurement). Serum 25(OH)D levels were higher in the vitamin D 100,000 IU group than in the 12,000 IU group at both one year, MD 16.40 ng/mL (95% CI 12.59 to 20.21) and two years, MD 18.96 ng/mL (95% CI 15.20 to 22.72) (Analysis 2.1). We judged the quality of evidence for this outcome to be low.
2.1. Analysis.
Comparison 2: Vitamin D 100,000 IU/month versus 12,000 IU/month, Outcome 1: Serum 25‐hydroxyvitamin D (25(OH)D) level (change from baseline) (ng/mL)
2. BMD
This outcome was not reported in the included study (Lee 2018).
3. Adverse events
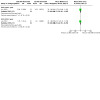
The study author stated in the original report that "a total of 291 adverse events was reported, including 55 serious adverse events in 20 subjects, most of which were expected for sickle cell disease; none were attributed to the study drug". The adverse events in the original report were pain syndrome, fever, blood bilirubin increased, anaemia, injury, cholecystitis, surgical procedure, urinary tract infection, viral syndrome and constipation (Lee 2018). Upon correspondence, the study author confirmed that "none were definitely attributed to the study drug. There were two adverse events that were attributed as possibly related to treatment but neither required dose change or discontinuation of treatment". These two adverse events that study author mentioned in the correspondence were headache and dysmenorrhoea. There were no differences in constipation, RR 9.00 (95% CI 0.51 to 160.39), pain syndrome, RR 1.00 (95% CI 0.62 to 1.62), fever, RR 1.75 (95% CI 0.57 to 5.38), increase in bilirubin, RR 0.75 (95% CI 0.18 to 3.08), anaemia, RR (0.50, 95% CI 0.10 to 2.53), injury, RR 1.50 (95% CI 0.27 to 8.36), cholecystitis, RR 1.00 (95% CI 0.15 to 6.66), surgical procedure, RR 2.00 (95% CI 0.19 to 20.93), urinary tract infection RR 3.00 (95% CI 0.33 to 27.29), viral syndrome RR 2.00 (95% CI 0.19 to 20.93), headache, RR 3.00 (95% CI 0.13 to 70.92) and dysmenorrhoea, RR 3.00 (95% CI 0.13 to 70.92) between the doses (Analysis 2.2). The evidence for this outcome was judged to be low quality.
2.2. Analysis.
Comparison 2: Vitamin D 100,000 IU/month versus 12,000 IU/month, Outcome 2: Adverse events
Secondary outcome
1. Serum parathyroid hormone level
This outcome was not reported in the included study (Lee 2018).
2. Bone fracture
This outcome was not reported in the included study (Lee 2018).
3. Muscle health
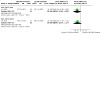
The study reported on handgrip strength for right hand, left hand and by dominant hand (Lee 2018). There were no differences in the muscle health of the right hand between doses either at one year, MD 4.00 pounds force (95% CI ‐3.53 to 11.53) or at two years, MD 6.40 pounds force (95% CI ‐3.44 to 16.24) (Analysis 2.3). This was also true for the left hand at one year, MD 5.40 (95% CI ‐2.76 to 13.56) and two years, MD 3.80 (95% CI ‐5.14 to 12.74) (Analysis 2.4) and for analysis by dominant hand at one year, MD 3.50 (95% CI ‐4.03 to 11.03) and two years, MD 5.70 (95% CI ‐4.37 to 15.77) (Analysis 2.5).
2.3. Analysis.
Comparison 2: Vitamin D 100,000 IU/month versus 12,000 IU/month, Outcome 3: Muscle health (right hand) (pounds force)
2.4. Analysis.
Comparison 2: Vitamin D 100,000 IU/month versus 12,000 IU/month, Outcome 4: Muscle health (left hand) (pounds force)
2.5. Analysis.
Comparison 2: Vitamin D 100,000 IU/month versus 12,000 IU/month, Outcome 5: Muscle health (dominant hand) (pounds force)
4. Pain
This outcome was reported as pain syndrome in the original article (Lee 2018). Upon correspondence, the study author stated that pain syndrome was defined as events of pain complaints (presence of pain) and it was reported only at least grade 2 events, i.e. required some form of treatment with pain medication such as NSAIDs or opioid, occurring in at least three participants. The study author also stated that the pain events were confirmed by review of medical records of the participant's outpatient, emergency room, or inpatient admission visits. There was no difference in presence of pain between the doses, RR 1.00 (95% CI 0.62 to 1.62) (Analysis 2.6). The quality of evidence for this outcome was judged to be moderate.
2.6. Analysis.
Comparison 2: Vitamin D 100,000 IU/month versus 12,000 IU/month, Outcome 6: Presence of pain
5. Growth status
This outcome was not reported in the included study (Lee 2018).
6. Respiratory outcomes
The original report states "Crude estimates of group differences in the change in the annualized event rate from baseline to year 1 and year 2 were analyzed by linear mixed models". The original report also states "The annual rate of respiratory events, predominantly respiratory infections, did not significantly between the groups receiving monthly high‐dose and standard‐dose oral vitamin D3 (P = 0.24), but it decreased significantly during year 2 in both groups (P = 0.0005; Figure 3)". In this review, we calculated the difference in means as summary statistics using the inverse‐variance fixed‐effect method. We found no difference in the number of respiratory events (which included episodes of respiratory infections, asthma exacerbations and acute chest syndrome) between the doses at one year, MD 0.94 (95% CI ‐0.07 to 1.95) and two years, MD ‐0.05 (95% CI ‐1.08 to 0.98) (Analysis 2.7). We judged the quality of evidence of this outcome to be moderate.
2.7. Analysis.
Comparison 2: Vitamin D 100,000 IU/month versus 12,000 IU/month, Outcome 7: Respiratory events (acute chest syndrome, acute exacerbation of asthma, respiratory infections)
Upon request, the study author provided the data about episodes of respiratory infections, asthma exacerbations and acute chest syndrome separately. Regards to acute chest syndrome, the number of episodes was higher in the high‐dose group compared to the standard‐dose group, MD 0.27 (95% CI 0.02 to 0.52) at one year, but there was no difference at two years, MD 0.09 (95% CI ‐0.04 to 0.22) (Analysis 2.8). The quality of evidence of this outcome was judged to be moderate.
2.8. Analysis.
Comparison 2: Vitamin D 100,000 IU/month versus 12,000 IU/month, Outcome 8: Acute chest syndrome
There were no differences in the episodes of acute exacerbation of asthma at one year, MD 0.03 (95% CI ‐0.12 to 0.18) or two years, MD 0.11 (95% CI ‐0.01 to 0.23) (Analysis 2.9). This was also true for the episodes of respiratory infections at one year, MD 0.73 (95% CI ‐0.49 to 1.95) and two years, MD ‐0.21 (95% CI ‐0.70 to 0.28) (Analysis 2.10); and we judged the quality of evidence of these outcomes to be moderate.
2.9. Analysis.

Comparison 2: Vitamin D 100,000 IU/month versus 12,000 IU/month, Outcome 9: Acute exacerbation of asthma
2.10. Analysis.
Comparison 2: Vitamin D 100,000 IU/month versus 12,000 IU/month, Outcome 10: Respiratory infections
There was no difference in FEV1 % predicted between the high‐dose and standard‐dose groups at both one year, MD ‐6.20% predicted (95% CI ‐12.90 to 0.50) and two years, MD ‐5.60% predicted (95% CI ‐12.34 to 1.14) (Analysis 2.11).
2.11. Analysis.
Comparison 2: Vitamin D 100,000 IU/month versus 12,000 IU/month, Outcome 11: FEV1 % predicted
Conversely, with regards to FVC % predicted, the high‐dose group had lower values compared to the standard‐dose group at both one year, MD ‐7.20% predicted (95% CI ‐14.15 to ‐0.25) and two years, MD ‐7.10% predicted (95% CI ‐14.03 to ‐0.17) (Analysis 2.12).
2.12. Analysis.
Comparison 2: Vitamin D 100,000 IU/month versus 12,000 IU/month, Outcome 12: FVC % predicted
7. HRQoL
This outcome was not reported in the included study (Lee 2018).
Vitamin D 7000 IU/day versus 4000 IU/day
We do not currently have sufficient data to enter into the analysis as the means and SDs of outcome measures were not reported in the only included study (n = 21) in this comparison; therefore, we present the results descriptively and have not yet generated a summary of findings table for this comparison (Dougherty 2015). We have contacted the principal investigators to provide further data and we will enter these into RevMan in a future update of the review if we receive them (RevMan 2014).
Primary outcomes
1. Serum 25(OH)D level
Investigators reported that at six weeks the median level of serum 25(OH)D of vitamin D in the 7000 IU/day group was higher (49.6 ng/mL) than in the 4000 IU/day group (38.2 ng/mL) (Dougherty 2015). At 12 weeks, the median level of serum 25 (OH)D in the 7000 IU/day group fell slightly to 48.8 ng/mL, whereas in the 4000 IU/day group levels fell more to 28.9 ng/mL.
2. BMD
This outcome was not reported in the included study (Dougherty 2015).
3. Adverse events
This outcome was not reported in the included study (Dougherty 2015).
Secondary outcome
1. Serum PTH level
Investigators reported that at 12 weeks in the vitamin D 7000 IU/day group the median serum PTH level was 22.8 pg/mL and in the 4000 IU/day group it was 27.6 pg/mL (Dougherty 2015).
2. Bone fracture
This outcome was not reported in the included study (Dougherty 2015).
3. Muscle health
This outcome was not reported in the included study (Dougherty 2015).
4. Pain
This outcome was not reported in the included study (Dougherty 2015).
5. Growth status
This outcome was not reported in the included study (Dougherty 2015).
6. Respiratory outcomes
This outcome was not reported in the included study (Dougherty 2015).
7. HRQoL
The included study measured HRQoL using PROMIS paediatric short forms (Dougherty 2015). The study author reported the mean (SD) of all domains of HRQoL (depressive symptoms, fatigue, pain, mobility, peer relationships and upper‐extremity function) at baseline and 12 weeks for both supplement regimens for all participants with SCD compared to combined supplement regimens in healthy controls. As the study did not present the mean (SD) for vitamin D 7000/day group and vitamin D 4000/day group separately, no data were included for analysis, but we present the available data for the participants with SCD here in a table. We hope to analyse the data for the different regimens if they become available in the future.
| HRQoL domain | Baseline mean (SD) | 12 weeks mean (SD) |
| Pain | 54.4 (13.3) | 48.4 (14.8) |
| Fatigue | 51.7 (11.4) | 46.4 (14.0) |
| Depressive symptoms | 43.1 (8.1) | 39.1 (7.3) |
| Improvement in upper‐extremity function | 45.9 (10.9) | 51.2 (8.7) |
| Mobility | 53.1 (6.2) | 55.7 (5.4) |
| Peer relationships | 56.9 (7.1) | 57.8 (11.0) |
The study author reported that the reductions from baseline were significant for pain, fatigue and depressive symptoms; the improvement in upper‐extremity function was also significant. However, there was no difference in mobility or peer relationships (Dougherty 2015).
Discussion
Summary of main results
Three studies are currently included in the review (Dougherty 2015; Lee 2018; Osunkwo 2012). We have also identified three ongoing trials which may provide valuable evidence in future update of this review (NCT03417947; NCT04170348; PACTR201803003160262).
Vitamin D supplementation versus placebo
Only one RCT (n = 39) met our pre‐defined inclusion criteria for this review (Osunkwo 2012). Regarding the primary outcomes, the vitamin D group had a significantly higher serum 25(OH)D level compared to placebo at eight weeks, MD 29.79 (95% CI 26.63 to 32.95); at 16 weeks, MD 12.67 nmol/L (95% CI 10.43 to 14.90); and at 24 weeks, MD 15.52 (95% CI 13.50 to 17.54) (moderate‐quality evidence). The study also reported the adverse event of tingling in the hands or lips, but there was no difference between vitamin D and placebo groups (low‐quality evidence). BMD was not reported. For our secondary outcomes, the frequency of pain was measured using a pain diary and the difference between the first 30‐day diary and the second diary period (30 to 60 days) presented; during this period the vitamin D group had significantly fewer days of pain compared to the placebo group, MD ‐10 days (95% CI ‐16.47 to ‐3.53). Finally, the study reported that the vitamin D group had a lower HRQoL score compared to placebo over the whole duration of the study; this result was not significant at eight weeks but did reach significance at 16 weeks MD ‐12.56 (95% CI ‐16.44 to ‐8.69) and at 24 weeks, MD ‐12.59 (95% CI ‐17.43 to ‐7.76). The study did not report on serum PTH levels, bone fractures, muscle health, growth status or respiratory outcomes.
Vitamin D supplementation regimens compared
Two RCTs (n = 83) comparing different supplementation regimens met the inclusion criteria for this review (Dougherty 2015; Lee 2018).
One two‐year study (n = 62) compared vitamin D 100,000 IU/month to 12,000 IU/month (Lee 2018). There were significantly higher levels of serum 25(OH)D in the higher dose group at both one year, MD 16.40 (95% CI 12.59 to 20.21) and two years, MD 18.96 (95% CI 15.20 to 22.72) (low‐quality evidence). Regarding adverse events, upon correspondence the investigators stated that headache and dysmenorrhoea were possibly related to treatment. There were no differences between groups for any reported adverse event (low‐quality evidence). There were no differences in the total number of respiratory events (which included episodes of respiratory infections, asthma exacerbations and acute chest syndrome) between the doses at one year, MD 0.94 (95% CI ‐0.07 to 1.95) and two years, MD ‐0.05 (95% CI ‐1.08 to 0.98) (moderate‐quality evidence). While the number of episodes of acute chest syndrome was higher in the high‐dose group compared to the standard‐dose group at one year, MD 0.27 (95% CI 0.02 to 0.52), there was no difference at two years, MD 0.09 (95% CI ‐0.04 to 0.22) (moderate‐quality evidence). At both one year and two years, there were no differences in the number of episodes of acute exacerbation of asthma and in the number of episodes of respiratory infections (moderate‐quality evidence). The study also found no difference between dose levels in presence of pain (moderate‐quality evidence), FEV1 % predicted or in muscle health of either right or left hands or when the dominant hand was analysed. However, the high‐dose group had significantly lower FVC % predicted than the standard‐dose group at both one and two years, MD ‐7.20% predicted (95% CI ‐14.15 to ‐0.25) and MD ‐7.10% predicted (95% CI ‐14.03 to ‐0.17), respectively. The study did not report BMD, serum PTH, bone fracture, growth status or HRQoL (Lee 2018).
The third included study (n = 21) compared vitamin D 7000 IU/day to 4000 IU/day but no data were available for analysis for this comparison, therefore we have contacted the principal investigators to provide further details for inclusion in a future update of this review (Dougherty 2015). Investigators reported that median serum 25(OH)D levels were lower in the 4000 IU/day group at both six and 12 weeks and that at 12 weeks the median serum PTH level was lower in the 7000 IU/day group (Dougherty 2015).
Overall completeness and applicability of evidence
This review analyses the available evidence for vitamin D supplementation in SCD. We included vitamin D comparing to placebo as well as comparisons of varying doses of vitamin D supplementation. The evidence is applicable only to people with SCD in a steady state and not undergoing chronic transfusion therapy. The placebo‐controlled study enrolled both children and adults, but the mean age of participants in the two studies of different doses indicates that the majority of participants were children. The evidence is limited as only one study was included for each individual comparison and all were potentially prone to biases. The scarcity of data with regards to vitamin D supplementation in people with SCD was evident as there were a limited number of studies identified in the searches. The included studies evaluated two of the primary outcomes of this review ‐ serum 25(OH)D level and adverse events, and some of the review's secondary outcomes such as serum PTH, muscle health, frequency of pain, respiratory outcomes and HRQoL. Some of our secondary outcomes and one primary outcome were not evaluated in the included studies.
Quality of the evidence
We evaluated the quality of evidence for the review's outcomes with GRADE methodology (Table 1; Table 2). The quality of evidence for the outcomes of this review ranged from moderate to low. With regards to risk of bias assessment, none of the studies has a high risk of bias for sequence generation or allocation concealment (two have a low risk and one has an unclear risk), one study has a high risk of incomplete outcome data and two have a low risk, two have a high risk of selective reporting and one a low risk (see Risk of bias in included studies).
For the comparison of vitamin D to placebo, we took into consideration that the dropout rate in placebo group was higher (68.4%) compared to the vitamin D group (5%), and not every participant randomised to either group (vitamin D or placebo) was included in the analysis (Osunkwo 2012). We considered that indirectness and inconsistency were unlikely, but the included study had a serious risk of bias. We determined that the quality of evidence for levels of serum 25(OH)D level was moderate. Furthermore, imprecision resulted in low‐quality evidence for frequency of pain, HRQoL and adverse events.
For the comparison of vitamin D 100,000 IU/month versus 12,000 IU/month, not all the outcomes listed as being measured were reported in the study (Lee 2018). We considered that risk of bias, indirectness and inconsistency were unlikely, but publication bias was strongly suspected in the included study. Therefore, we determined that quality of evidence for acute chest syndrome, respiratory infection and presence of pain was moderate. Moreover, imprecision resulted in low‐quality evidence for levels of serum 25(OH)D level and adverse events.
For the comparison of vitamin D 7000 IU/day versus 4000 IU/day, not all the outcomes listed as being measured were reported in the study (Dougherty 2015). We considered that indirectness and inconsistency were unlikely, but this study had an unclear risk of bias for random sequence generation and allocation concealment, and publication bias was strongly suspected. We have reported results for this study narratively and we can not undertake a formal assessment of the quality of the evidence until we have received data from the investigators.
Potential biases in the review process
We undertook a comprehensive search, which included searching clinical trial registries, databases and the abstract books of conferences. Therefore, all relevant studies were likely to be identified. In this review, two review authors independently assessed the studies for eligibility and did not exclude any study due to missing data. Two review authors independently extracted the data from the included studies using a standard data collection form and checked for consistency. The risk of bias in the included studies was also assessed independently by two review authors. When there were discrepancies, they were resolved by discussion until authors reached a consensus. We followed standard methods described in the Cochrane Handbook for Systematic Reviews of Interventions (Higgins 2011). When the SD was not reported, we calculated this as detailed in the Cochrane Handbook for Systematic Reviews of Interventions section 7.7.3.3 and section 16.1.3.2 (Higgins 2011). For studies not included in the meta‐analysis, we presented the descriptive results. Therefore, any potential biases in the review process have been minimised.
Agreements and disagreements with other studies or reviews
We are unaware of any similar reviews on this topic. There are only a few studies demonstrating the effect of vitamin D in SCD and these studies are of low methodological quality. A case study of one individual with SCD showed that treatment with high‐dose vitamin D₃ (cholecalciferol) was associated with increased serum 25(OH)D levels, complete resolution of pain and increased BMD (Osunkwo 2011b). A retrospective study supported treatment with either high‐dose oral vitamin D₃ (cholecalciferol) for four days or single high‐dose intramuscular vitamin D₂ (ergocalciferol) to increase serum 25(OH)D to normal levels in people with SCD (SCA, HbSS) (Wykes 2014). A non‐randomised study demonstrated that serum 25(OH)D level was normalised and BMD significantly improved with vitamin D₂ (ergocalciferol) and calcium supplementation for 12 months in adults with SCD (Adewoye 2008). In a report of four children with SCD and severe vitamin D deficiency showed that treatment with monthly high‐dose oral cholecalciferol for two years (100,000 IU every other week for eight weeks followed by once per month) corrected vitamin D deficiency, normalized PTH and improved BMD without hypervitaminosis D or hypercalcaemia (Williams 2018). In a prospective study, children with SCD and insufficient serum vitamin D levels who were treated for three months showed a significant improvement in serum vitamin D levels and the number of crises (Adly 2019). Evidence from high‐quality studies is needed to confirm these effects.
Authors' conclusions
Implications for practice.
At present, there are three eligible clinical studies assessing the effects of vitamin D supplementation in people with sickle cell disease (SCD). We do not consider the evidence from these studies to be of sufficient quality to guide clinical practice. With regards to the comparison of different dose regimens, this analysis also provides insufficient evidence to conclude whether high‐dose vitamin D is superior to low‐dose supplementation. Therefore, until further evidence becomes available, the relevant existing guidelines for vitamin D supplementation should be considered by clinicians (e.g. the Endocrine Society Clinical Practice Guidelines (Holick 2011), and the USA Institute of Medicine (IOM) (Ross 2011).
Implications for research.
People with SCD are prone to vitamin D deficiency; therefore, evidence of vitamin D supplementation in this population from good quality randomised controlled trials (RCTs) is needed. Well‐designed, placebo‐controlled RCTs, ideally of parallel design, are required to determine the effects and the safety of vitamin D supplementation in children and adults with SCD. Moreover, a large, adequately‐powered, parallel designed RCT is needed to assess the relative benefits of different doses of vitamin D in people with SCD. A number of clinically important outcomes were not reported in the studies included in this review. Adverse events of vitamin D supplementation including long‐term adverse effects, should also be monitored and critically assessed. Moreover, RCTs looking at the different forms of vitamin D supplementation (vitamin D₂, D₃), the appropriate dose and duration are also needed to fully elucidate the efficacy of vitamin D supplementation in people with SCD.
What's new
| Date | Event | Description |
|---|---|---|
| 21 September 2020 | Amended | Contact details updated. |
History
Protocol first published: Issue 11, 2013 Review first published: Issue 1, 2017
| Date | Event | Description |
|---|---|---|
| 22 April 2020 | New search has been performed | A search of the Cystic Fibrosis and Genetic Disorders Review Group's Haemoglobinopathies Trials Register identified three new references to a study previously identified from a trials registry and excluded (Lee 2018). Three new studies were identified from trial registries and these studies were listed as ongoing (NCT03417947; NCT04170348; PACTR201803003160262). Due to the expansion in the scope of the review, we have now included two studies that were previously excluded (Dougherty 2015; Lee 2018). Changes have been made in results of the search and study flow diagram (Figure 1). |
| 22 April 2020 | New citation required and conclusions have changed | The scope of the review has been expanded to include comparisons of different doses of vitamin D supplementation and not just comparisons to placebo or no supplementation. |
Acknowledgements
The authors would like to acknowledge Mrs Nikki Jahnke, Managing Editor, Cochrane Cystic Fibrosis and Genetic Disorder Group for her kind assistance and guidance for the protocol, full review and update; and the editors of the Cochrane Cystic Fibrosis and Genetic Disorders Review Group for their comments on this review. We are very grateful Dr Ifeyinwa Osunkwo and Dr Margaret Lee for providing the necessary data to complete this review.
This project was supported by the National Institute for Health Research, via Cochrane Infrastructure funding to the Cochrane Cystic Fibrosis and Genetic Disorders Group. The views and opinions expressed therein are those of the authors and do not necessarily reflect those of the Systematic Reviews Programme, NIHR, NHS or the Department of Health.
Appendices
Appendix 1. PubMed search strategy
1. Vitamin D[MeSH]
2. Vitamin D[tw]
3. Cholecalciferol[tw]
4. Calciferol[tw]
5. Ergocalciferol[tw]
6. 25‐hydroxyvitamin D[tw]
7. 25(OH)D[tw]
8. Sickle cell[MeSH]
9. Sickle cell[tw]
10. Hemoglobinopathies[tw]
11. Hemoglobin S disease[tw]
12. Hemoglobin S disorder[tw]
13. HbS disease[tw]
14. Randomized controlled trial[pt]
15. Controlled clinical trial[pt]
16. Rrandomized[tiab]
17. Placebo[tiab]
18. Drug therapy[sh]
19. Randomly[tiab]
20. Trial[tiab]
21. Groups[tiab]
22. Animals[mh] NOT humans[mh]
23. 1 OR 2 OR 3 OR 4 OR 5 OR 6 OR 7
24. 8 OR 9 OR 10 OR 11 OR 12 OR 13
25. 14 OR 15 OR 16 OR 17 OR 18 OR 19 OR 20 OR 21
26. 25 NOT 22
27. 23 AND 24 AND 26
Appendix 2. ClinicalTrials.gov search strategy
1. "Sickle cell”
2. “Hemoglobinopathies”
3. “Hemoglobin S disease”
4. “ Hemoglobin S disorder”
5. “HbS disease”
6. “Vitamin D”
7. “Cholecalciferol”
8. “Calciferol”
9. “Ergocalciferol”
10. “25‐hydroxyvitamin D”
11. “25(OH)D”
12. 1 OR 2 OR 3 OR 4 OR 5
13. 6 OR 7 OR 8 OR 9 OR 10 OR 11
14. 12 AND 13
Appendix 3. ICTRP search strategy
1. Sickle cell
2. Vitamin D
3. 1 AND 2
Appendix 4. Pan African Clinical Trials Registery and Clinical Trials Registry ‐ India search strategy
1. Sickle cell
2. Vitamin D
3. 1 AND 2
Data and analyses
Comparison 1. Vitamin D versus placebo.
| Outcome or subgroup title | No. of studies | No. of participants | Statistical method | Effect size |
|---|---|---|---|---|
| 1.1 Serum 25‐hydroxyvitamin D (25(OH)D) level (change from baseline) (nmol/L) | 1 | Mean Difference (IV, Fixed, 95% CI) | Subtotals only | |
| 1.1.1 At 8 weeks | 1 | 37 | Mean Difference (IV, Fixed, 95% CI) | 29.79 [26.63, 32.95] |
| 1.1.2 At 16 weeks | 1 | 37 | Mean Difference (IV, Fixed, 95% CI) | 12.67 [10.43, 14.90] |
| 1.1.3 At 24 weeks | 1 | 37 | Mean Difference (IV, Fixed, 95% CI) | 15.52 [13.50, 17.54] |
| 1.2 Adverse events | 1 | Risk Ratio (M‐H, Fixed, 95% CI) | Subtotals only | |
| 1.2.1 Tingling of lips or hands | 1 | 37 | Risk Ratio (M‐H, Fixed, 95% CI) | 3.16 [0.14, 72.84] |
| 1.3 Frequency of pain (change from baseline) | 1 | Mean Difference (IV, Fixed, 95% CI) | Subtotals only | |
| 1.3.1 At 8 weeks | 1 | 37 | Mean Difference (IV, Fixed, 95% CI) | ‐10.00 [‐16.47, ‐3.53] |
| 1.4 Health‐related quality of life (physical functioning score) (change from baseline) | 1 | Mean Difference (IV, Fixed, 95% CI) | Subtotals only | |
| 1.4.1 At 8 weeks | 1 | 37 | Mean Difference (IV, Fixed, 95% CI) | ‐2.02 [‐6.34, 2.30] |
| 1.4.2 At 16 weeks | 1 | 37 | Mean Difference (IV, Fixed, 95% CI) | ‐12.56 [‐16.44, ‐8.69] |
| 1.4.3 At 24 weeks | 1 | 37 | Mean Difference (IV, Fixed, 95% CI) | ‐12.59 [‐17.43, ‐7.76] |
Comparison 2. Vitamin D 100,000 IU/month versus 12,000 IU/month.
| Outcome or subgroup title | No. of studies | No. of participants | Statistical method | Effect size |
|---|---|---|---|---|
| 2.1 Serum 25‐hydroxyvitamin D (25(OH)D) level (change from baseline) (ng/mL) | 1 | Mean Difference (IV, Fixed, 95% CI) | Subtotals only | |
| 2.1.1 At 1 year | 1 | 60 | Mean Difference (IV, Fixed, 95% CI) | 16.40 [12.59, 20.21] |
| 2.1.2 At 2 years | 1 | 57 | Mean Difference (IV, Fixed, 95% CI) | 18.96 [15.20, 22.72] |
| 2.2 Adverse events | 1 | Risk Ratio (M‐H, Fixed, 95% CI) | Subtotals only | |
| 2.2.1 Constipation | 1 | 62 | Risk Ratio (M‐H, Fixed, 95% CI) | 9.00 [0.51, 160.39] |
| 2.2.2 Pain syndrome | 1 | 62 | Risk Ratio (M‐H, Fixed, 95% CI) | 1.00 [0.62, 1.62] |
| 2.2.3 Fever | 1 | 62 | Risk Ratio (M‐H, Fixed, 95% CI) | 1.75 [0.57, 5.38] |
| 2.2.4 Increase in bilirubin | 1 | 62 | Risk Ratio (M‐H, Fixed, 95% CI) | 0.75 [0.18, 3.08] |
| 2.2.5 Anaemia | 1 | 62 | Risk Ratio (M‐H, Fixed, 95% CI) | 0.50 [0.10, 2.53] |
| 2.2.6 Injury | 1 | 62 | Risk Ratio (M‐H, Fixed, 95% CI) | 1.50 [0.27, 8.36] |
| 2.2.7 Cholecystitis | 1 | 62 | Risk Ratio (M‐H, Fixed, 95% CI) | 1.00 [0.15, 6.66] |
| 2.2.8 Surgical procedure | 1 | 62 | Risk Ratio (M‐H, Fixed, 95% CI) | 2.00 [0.19, 20.93] |
| 2.2.9 Urinary tract infection | 1 | 62 | Risk Ratio (M‐H, Fixed, 95% CI) | 3.00 [0.33, 27.29] |
| 2.2.10 Viral syndrome | 1 | 62 | Risk Ratio (M‐H, Fixed, 95% CI) | 2.00 [0.19, 20.93] |
| 2.2.11 Headache | 1 | 62 | Risk Ratio (M‐H, Fixed, 95% CI) | 3.00 [0.13, 70.92] |
| 2.2.12 Dysmenorrhea | 1 | 62 | Risk Ratio (M‐H, Fixed, 95% CI) | 3.00 [0.13, 70.92] |
| 2.3 Muscle health (right hand) (pounds force) | 1 | Mean Difference (IV, Fixed, 95% CI) | Subtotals only | |
| 2.3.1 At 1 year | 1 | 52 | Mean Difference (IV, Fixed, 95% CI) | 4.00 [‐3.53, 11.53] |
| 2.3.2 At 2 years | 1 | 52 | Mean Difference (IV, Fixed, 95% CI) | 6.40 [‐3.44, 16.24] |
| 2.4 Muscle health (left hand) (pounds force) | 1 | Mean Difference (IV, Fixed, 95% CI) | Subtotals only | |
| 2.4.1 At 1 year | 1 | 52 | Mean Difference (IV, Fixed, 95% CI) | 5.40 [‐2.76, 13.56] |
| 2.4.2 At 2 years | 1 | 52 | Mean Difference (IV, Fixed, 95% CI) | 3.80 [‐5.14, 12.74] |
| 2.5 Muscle health (dominant hand) (pounds force) | 1 | Mean Difference (IV, Fixed, 95% CI) | Subtotals only | |
| 2.5.1 At 1 year | 1 | 52 | Mean Difference (IV, Fixed, 95% CI) | 3.50 [‐4.03, 11.03] |
| 2.5.2 At 2 years | 1 | 52 | Mean Difference (IV, Fixed, 95% CI) | 5.70 [‐4.37, 15.77] |
| 2.6 Presence of pain | 1 | 62 | Risk Ratio (M‐H, Fixed, 95% CI) | 1.00 [0.62, 1.62] |
| 2.7 Respiratory events (acute chest syndrome, acute exacerbation of asthma, respiratory infections) | 1 | Mean Difference (IV, Fixed, 95% CI) | Subtotals only | |
| 2.7.1 At 1 year | 1 | 62 | Mean Difference (IV, Fixed, 95% CI) | 0.94 [‐0.07, 1.95] |
| 2.7.2 At 2 years | 1 | 62 | Mean Difference (IV, Fixed, 95% CI) | ‐0.05 [‐1.08, 0.98] |
| 2.8 Acute chest syndrome | 1 | Mean Difference (IV, Fixed, 95% CI) | Subtotals only | |
| 2.8.1 At 1 year | 1 | 62 | Mean Difference (IV, Fixed, 95% CI) | 0.27 [0.02, 0.52] |
| 2.8.2 At 2 year | 1 | 62 | Mean Difference (IV, Fixed, 95% CI) | 0.09 [‐0.04, 0.22] |
| 2.9 Acute exacerbation of asthma | 1 | Mean Difference (IV, Fixed, 95% CI) | Subtotals only | |
| 2.9.1 At 1 year | 1 | 62 | Mean Difference (IV, Fixed, 95% CI) | 0.03 [‐0.12, 0.18] |
| 2.9.2 At 2 year | 1 | 62 | Mean Difference (IV, Fixed, 95% CI) | 0.11 [‐0.01, 0.23] |
| 2.10 Respiratory infections | 1 | Mean Difference (IV, Fixed, 95% CI) | Subtotals only | |
| 2.10.1 At 1 year | 1 | 62 | Mean Difference (IV, Fixed, 95% CI) | 0.73 [‐0.49, 1.95] |
| 2.10.2 At 2 year | 1 | 62 | Mean Difference (IV, Fixed, 95% CI) | ‐0.21 [‐0.70, 0.28] |
| 2.11 FEV1 % predicted | 1 | Mean Difference (IV, Fixed, 95% CI) | Subtotals only | |
| 2.11.1 At 1 year | 1 | 58 | Mean Difference (IV, Fixed, 95% CI) | ‐6.20 [‐12.90, 0.50] |
| 2.11.2 At 2 years | 1 | 58 | Mean Difference (IV, Fixed, 95% CI) | ‐5.60 [‐12.34, 1.14] |
| 2.12 FVC % predicted | 1 | Mean Difference (IV, Fixed, 95% CI) | Subtotals only | |
| 2.12.1 At 1 year | 1 | 58 | Mean Difference (IV, Fixed, 95% CI) | ‐7.20 [‐14.15, ‐0.25] |
| 2.12.2 At 2 years | 1 | 58 | Mean Difference (IV, Fixed, 95% CI) | ‐7.10 [‐14.03, ‐0.17] |
Characteristics of studies
Characteristics of included studies [ordered by study ID]
Dougherty 2015.
| Study characteristics | ||
| Methods | Study design: parallel RCT. Study duration: 12 weeks. |
|
| Participants | 21 participants were recruited. Inclusion criteria
Exclusion criteria
Total cohort (n = 21) Age, mean (SD): 10.8 (4.0) years Gender, n (%): males 9 (43%), females 12 (57%) Genotype: SS (n = 21) Vitamin D3 7000 IU group (n = 9) Age, mean (SD): 10.2 (4.5) years Vitamin D3 4000 IU group (n = 12) Age, mean (SD): 11.2 (3.7) years |
|
| Interventions |
Intervention: oral vitamin D3 7000 IU per day for 12 weeks Control: oral vitamin D3 4000 IU per day for 12 weeks |
|
| Outcomes |
Outcomes measured at baseline, 6 weeks, and 12 weeks
Outcomes measured at baseline and 12 weeks
|
|
| Notes | This study was approved by the Institutional Review Board at the Children's Hospital of Philadelphia (CHOP) | |
| Risk of bias | ||
| Bias | Authors' judgement | Support for judgement |
| Random sequence generation (selection bias) | Unclear risk | Quote (from report): "Subjects were randomized to 4000 (Vitacost Vitamin D3, Boca Raton, FL) or 7000 (Life Extension Vitamin D3, Ft. Lauderdale, FL) IU vit D3/day for 12 weeks using a double blind design" Comment: Method of sequence generation was not described |
| Allocation concealment (selection bias) | Unclear risk | Quote (from report): "...... using a double blind design" Quote (from report): "Doses were independently verified before and at the conclusion of the study (Tampa Bay Analytical Research Inc., Largo, FL)" Comment: Method of concealment was not described |
| Blinding of participants and personnel (performance bias) All outcomes | Low risk | Quote (from report): "...... using a double blind design" Quote (from report): "The 2 doses, provided as capsules, were identical in size, shape, and color" |
| Blinding of outcome assessors (detection bias) All outcomes | Low risk | Trial reported as double‐blind design |
| Incomplete outcome data (attrition bias) All outcomes | Low risk | Quote (from report): "Intention‐to‐treat model where all subjects are included regardless of adherence to the study protocol" The trial reported that 21 participants were randomised to either vitamin D 7000 IU group (n = 9) or vitamin D 4000 IU group (n = 12). At 12 weeks, 11 participants were included in vitamin D 4000 IU. The reasons of loss to follow‐up were not described |
| Selective reporting (reporting bias) | High risk | Study protocol was not available In published reports, anthropometric measurements, skinfold thickness, mid‐arm circumference, and adverse events were stated in methods section but not reported in results |
| Other bias | Unclear risk | Not reported |
Lee 2018.
| Study characteristics | ||
| Methods | Study design: parallel RCT (stratified by age (3 ‐ 9 years and 10 ‐ 20 years), gender, and hydroxyurea therapy) Study duration: 2 years |
|
| Participants | 62 participants recruited Inclusion criteria
Exclusion criteria
Total cohort (n = 62) Age, mean (SD): 9.9 (4.0) years Gender: 30 males, 32 females Genotype: SS n = 54; SC n = 5; Sβ0‐thal n = 2; Sβ+‐thal n = 1 Vitamin D3 100,000 IU/month group (n = 31) Age, mean (SD): 9.9 (4.0) years Gender: 15 males, 16 females Genotype: SS n = 26; SC n = 3; Sβ0‐thal n = 1; Sβ+‐thal n = 1 Vitamin D3 12,000 IU/month group (n = 31) Age, mean (SD): 9.9 (3.8) years Gender: 15 males, 16 females Genotype: SS n = 28; SC n = 2; Sβ0‐thal n = 1; Sβ+‐thal n = 0 |
|
| Interventions |
Intervention: oral Vitamin D3 100,000 IU once monthly for 24 months (daily equivalent 3333 IU/day) Control: oral vitamin D3 12,000 IU once monthly for 24 months (daily equivalent 400 IU/day) |
|
| Outcomes |
Primary outcomes
Secondary outcomes
|
|
| Notes | The protocol was approved by the Institutional Review Board of Columbia University Medical Centre and by the US Food and Drug Administration (IND Number 107584) | |
| Risk of bias | ||
| Bias | Authors' judgement | Support for judgement |
| Random sequence generation (selection bias) | Low risk | Quote (from report): "Using computer‐generated randomization, participants with 25‐OHD concentrations of 5‐60 ng/mL were randomly assigned using randomly permuted blocks of size 2, 4, or 6 assignments, with separate schema prepared for stratification by age (3‐9 and 10‐20 years), gender, and hydroxyurea therapy" |
| Allocation concealment (selection bias) | Low risk | Quote (from report): "Randomization was performed by the research pharmacy; all other research staff and participants were blinded to allocation" |
| Blinding of participants and personnel (performance bias) All outcomes | Low risk | Quote (from report): "Double‐blind active‐controlled parallel‐group trial with random assignment in a 1:1 ratio to receive treatment once monthly for 24 months under observation with vitamin D3 (100 000 or 12 000 IU) in identical capsules" Quote (from report): "All other research staff and participants were blinded to allocation" |
| Blinding of outcome assessors (detection bias) All outcomes | Low risk | Quote (from report): "All questionnaires were reviewed and adjudicated in a blinded fashion by a principal investigator (M.T.L) to determine whether a respiratory event had occurred" Quote (from report): "All other research staff and participants were blinded to allocation" |
| Incomplete outcome data (attrition bias) All outcomes | Low risk | Quote (from report): "Our primary study analysis was an examination of the annual rate of respiratory events (infections, asthma exacerbations, or ACS) in comparison with the rate of respiratory events over a baseline period of 1 year, using an intention‐to‐treat analysis" Quote (from report): "All primary and secondary outcome analyses will be performed under the intent‐to‐treat principle" The report also described participant flow diagram. 62 participants were randomised, 31 assigned to received vitamin D3 100,000 IU per month and 31 assigned to received vitamin D3 12,000 IU per month. In the intervention group, all 31 participants received the intervention as assigned (2 lost to follow‐up (moved out of area) and 1 discontinued intervention (consent withdrawal)); all 31 participants were included in analysis and 0 excluded from analysis. In the control group, all 31 participants received the intervention as assigned (0 lost to follow‐up but 3 discontinued intervention (2 chronic transfusion and 1 consent withdrawal)); all 31 participants were included in analysis and 0 excluded from analysis Reasons for lost to follow‐up and discontinued intervention were given |
| Selective reporting (reporting bias) | High risk | Study protocol was not available. Immunue function, bone function and bone turnover markers were listed but not report in results Quote (from report): "Other prespecified secondary outcome measures included immune and bone turnover markers, which will be reported elsewhere" |
| Other bias | Unclear risk | Not reported |
Osunkwo 2012.
| Study characteristics | ||
| Methods | Study design: parallel RCT (stratified by chronic pain status at randomisation) Study duration: 6 weeks of treatment; follow‐up to 6 months |
|
| Participants |
Inclusion criteria
Exclusion criteria
Among 46 enrolled participants, 7 participants were not randomised (withdrew consent (n = 2), loss to follow up (n = 4), not eligible due to depot provera use (n = 1)). 25 participants completed the full 6 months of follow‐up Total cohort (n = 46) Age: mean (SD) age 13·2 (3·1) years, range 7 ‐ 21 years Gender: 19 males, 27 females Genotype: SS n = 29; Sβ0‐thal n = 2; Sβ+‐thal n = 10; SC n = 5 20 participants were randomised to the vitamin D group and 19 participants were randomised to the placebo group. 2 participants were randomised to the drug but have missing values of baseline serum 25(OH)D so the number of samples analysed was 37 Vitamin D group (n = 20) Age, mean (SD): 12.9 (0.6) years, range 7 ‐ 21 years Gender: 9 males, 11 females Genotype: SS n = 12; Sβ0‐thal n = 1; Sβ+‐thal n = 4; SC n = 3 Placebo group (n = 19) Age, mean (SD): 13.2 (0.8) years, range 7 ‐ 21 years Gender: 7 males, 12 females Genotype: SS n = 12; Sβ0‐thal n = 1; Sβ+‐thal n = 5; SC n = 1 |
|
| Interventions |
Intervention: oral vitamin D3 (cholecalciferol) dosed according to weight (240,000 ‐ 600,000 IU) Control: placebo Vitamin D or placebo were dosed by weight and given weekly using a modified Stoss therapy regimen. To ensure no participant developed severe vitamin D deficiency during the study period, all participants received an oral daily supplement containing 500 mg calcium and 200 IU vitamin D for 6 months |
|
| Outcomes | Serum 25(OH)D (measured at baseline, weeks 8, 16 and 24) Pain diaries (4 pain diaries were given; diary 1 was collected at 30 days while diary 2, 3 and 4 were collected at every 60 days) and pain days HRQOL (measured using Pediatric Quality of Life Inventory (PedsQL™)) Adverse events including hypocalcaemia |
|
| Notes | This study was funded by Aflac Cencer Center and Blood Disorders Services Research Grant (IO), National Institute of Health grant Re pain: A pain diary was completed daily for 30 days and continued for six‐months (Dampier 2002). Participants had "chronic pain" if baseline pain diary documented scores ≥1 (out of a maximum of 10) on ≥ 50% days irrespective of numerical pain scores on any given day |
|
| Risk of bias | ||
| Bias | Authors' judgement | Support for judgement |
| Random sequence generation (selection bias) | Low risk | Quote (from report): "Subjects were stratified by chronic pain status at randomization to receive either high‐dose vitamin D or placebo, dosed according to weight and given over 6 weeks" Quote (from correspondence): "Computer‐generated using block randomization method" |
| Allocation concealment (selection bias) | Low risk | Quote (from correspondence): "Allocation was in a white envelope (opaque) and kept at investigator pharmacy; once randomized, CRA was given patient's allocation." |
| Blinding of participants and personnel (performance bias) All outcomes | Low risk | Quote (from report): "Randomized double blind pilot study". "Vitamin D/placebo was dosed by weight and given weekly using a modified Stoss therapy regime" Quote (from correspondence): "All clinicians, CRA, patients and parents were blinded" |
| Blinding of outcome assessors (detection bias) All outcomes | Low risk | Quote (from correspondence): "All clinicians, CRA, patients and parents were blinded" |
| Incomplete outcome data (attrition bias) All outcomes | High risk | Quote (from report): "Forty‐six SCD subjects were enrolled during steady state". "7 withdrew before randomization; thirty‐nine randomized subjects were evaluable". "Twenty‐five subjects completed the full six months of follow‐up" Quote (from correspondence): "2 patients were randomized to drug but have missing values of serum 25‐hydroxyvitamin D for their week 0 so the number of samples analyzed was 37. Due to the longitudinal nature of the data and presence of missing values, repeated measures analyses were conducted using the MIXED procedure in SAS. Spearman's rank correlation coefficient was used to quantify the relationship between PedsQL scores with 25OHD concentrations and pain days. Two‐way analysis of variance models compared PedsQL scores between treatment groups over time" Reasons for 14 withdrawals were provided upon request. The dropout in the placebo group was high ‐ 13 out of 19 participants compared to 1 out of 20 participants dropping out in the vitamin D group |
| Selective reporting (reporting bias) | Low risk | Study protocol was not available. In published reports, adverse events were stated in methods section but not reported in results Quote (from correspondence): The study author provided the information on adverse events upon request. "PT evaluation of muscle strength was done at baseline, however too many missing data in follow‐up to include in results" |
| Other bias | Unclear risk | Not reported |
BMI: body mass index CBC: complete blood count HbSS: haemoglobin SS disease HRQoL: health‐related quality of life IU: international units NO: nitric oxide PTH: parathyroid hormone RCT: randomised controlled trial SCD: sickle cell disease SD: standard deviation VDD: vitamin D deficiency 25(OH)D: 25‐hydroxyvitamin D
Characteristics of excluded studies [ordered by study ID]
| Study | Reason for exclusion |
|---|---|
| ACTRN12612000560897 | Not a RCT |
| Adewoye 2008 | Not a RCT |
| NCT01276587 | Not a RCT |
RCT: randomised controlled trial
Characteristics of ongoing studies [ordered by study ID]
NCT03417947.
| Study name | Vitamin D Intervention in Children With Sickle Cell Disease: A Pilot Randomized Controlled Trial |
| Methods | Study design: double‐blind parallel RCT Study duration: 3 months (+/‐ 2 weeks) Location: Canada |
| Participants |
Inclusion criteria
Exclusion criteria
|
| Interventions |
Intervention: a single liquid bolus of 300,000 IU oral vitamin D3 (cholecalciferol) Control: placebo All participants are provided with 1 tablet of vitamin D3 (1,000 IU/tablet) per day for 3 months. To prevent hypocalcaemia in participants who take vitamin D supplements but have a low calcium intake, the calcium intake of the participants is assessed. If it is low, participants will be prescribed calcium supplements |
| Outcomes |
Primary outcome
Secondary outcome
Other outcomes
|
| Starting date | 01 October 2018 |
| Contact information | (1) Genevieve Mailhot (genevieve.mailhot@umontreal.ca) (2) Nathalie Alos (nathalie.alos@umontreal.ca) |
| Notes | This study is sponsored by St. Justine's Hospital and with collaboration from Euro‐Pharm |
NCT04170348.
| Study name | Daily Vitamin D for Sickle‐cell Respiratory Complications (ViDAS‐2) |
| Methods | Study design: double‐blind parallel RCT Study duration: 2 years Location: USA |
| Participants |
Inclusion criteria
Exclusion criteria
|
| Interventions |
Intervention: oral vitamin D3, 3,333 IU/day Control: bolus oral vitamin D3, 100,000 IU/month |
| Outcomes |
Primary outcome
Secondary outcome Change from baseline up to 24 months in:
|
| Starting date | February 2020 |
| Contact information | (1) Gary M Brittenham, MD (gmb31@cumc.columbia.edu) (2) Margaret T Lee, MD (ml653@cumc.columbia.edu) |
| Notes |
PACTR201803003160262.
| Study name | Effectiveness of a six‐week treatment course of vitamin D in steady state sickle cell anaemia children with hypovitaminosis |
| Methods | Study design: parallel RCT Location: South Africa |
| Participants |
Inclusion criteria
Exclusion criteria
|
| Interventions |
Intervention group 1: oral vitamin D3 50,000 IU 1x a week for 6 weeks Intervention group 2: oral vitamin D2 50,000 IU 1x a week for 6 weeks |
| Outcomes | Mean rise in serum 25(OH)D after 6 weeks of treatment Mean rise in serum calcium and alkaline phosphatase after 6 weeks of treatment |
| Starting date | 11 March 2018 |
| Contact information | (1) Motunrayo Adekunle (motunbamm@yahoo.com) (2) Adaobi Solarin (asolar234@yahoo.com) (3) Olisamedua Njokanma (fanconj@yahoo.com) |
| Notes |
25(OH)D: 25‐hydroxyvitamin D BPI: brief pain inventory DLCO: diffusing capacity of the lungs for carbon monoxide FEF25-75: forced expiratory flow at 25%‐75% vital capacity FENO: fractional concentration of exhaled nitric oxide FEV1: forced expiratory volume in 1 second FVC: forced vital capacity H2O: water Hb: haemoglobin HbSS: sickle cell anaemia HRQoL: health‐related quality of life IU: international unit MEP: maximum expiratory pressure MIP: maximum inspiratory pressure RCT: randomised controlled trial RV: residual lung volume SCD: sickle cell disease TLC: total lung capacity TNF: tumor necrosis factor
Contributions of authors
| Roles and responsibilities | |
| TASK | WHO WILL UNDERTAKE THE TASK? |
| Protocol stage: draft the protocol | HHKS, NNT, HN, IO |
| Review stage: select which trials to include (2 + 1 arbiter) | HHKS, NNT + ALA |
| Review stage: extract data from trials (2 people) | HHKS, JS |
| Review stage: enter data into RevMan | HHKS, JS |
| Review stage: carry out the analysis | HHKS, ALA, ARMS |
| Review stage: interpret the analysis | HHKS, ALA, ARMS |
| Review stage: draft the final review | HHKS, NNT, HN, IO |
| Update stage: update the review | HHKS, NNT, ALA |
Sources of support
Internal sources
No sources of support supplied
External sources
-
National Institute for Health Research, UK
This systematic review was supported by the National Institute for Health Research, via Cochrane Infrastructure funding to the Cochrane Cystic Fibrosis and Genetic Disorders Group.
Declarations of interest
Ifeyinwa Osunkwo: Dr Osunkwo served as a consultant for Novartis pharmaceuticals for the purpose of training field representatives on the clinical and practical aspects of managing iron overload in people with sickle cell disease. Dr Osunkwo was also principal investigator on the only included placebo‐controlled study in this review.
All remaining authors: none known.
Edited (no change to conclusions)
References
References to studies included in this review
Dougherty 2015 {published data only}
- Dougherty KA, Bertolaso C, Schall JI, Smith-Whitley K, Stallings VA. Safety and efficacy of high-dose daily vitamin D3 supplementation in children and young adults with sickle cell disease. Journal of Pediatric Hematology/Oncology 2015;37(5):e308-15. [CFGD REGISTER: SC278] [DOI] [PMC free article] [PubMed] [Google Scholar]
- Dougherty KA, Bertolaso C, Schall JI, Smith-Whitley, Stallings VA. Vitamin D supplementation improves health-related quality of life in children with sickle cell disease. Medicine & Science in Sports & Exercise 2018;50:729-30. [DOI: 10.1249/01.mss.0000538405.48824.fb] [DOI] [Google Scholar]
Lee 2018 {published data only}
- Lee MT, Ashrafi A, Hornig M, Boehme A, Green NS, Brittenham GM. Vitamin d and inflammatory markers in children with sickle cell disease. Blood 2019;134(Suppl 1). [CENTRAL: CN-02051124] [CFGD REGISTER: SC347d] [EMBASE: 630320440] [Google Scholar]
- Lee MT, Kattan M, Fennoy I, Arpadi SM, Miller RL, Cremers S, et al. Randomized phase 2 trial of monthly Vitamin D to prevent respiratory complications in children with sickle cell disease. Blood Advances 2018;2(9):969-78. [CFGD REGISTER: SC347a] [DOI: 10.1182/bloodadvances.2017013979] [DOI] [PMC free article] [PubMed] [Google Scholar]
- NCT01443728. Vitamin D for sickle-cell respiratory complications. clinicaltrials.gov/show/NCT01443728 (first received 30 September 2011). [CFGD REGISTER: SC347b]
- Williams KM, Lee MT, Licursi M, Brittenham GM, Fennoy I. Response to long-term vitamin d therapy for bone disease in children with sickle cell disease. Journal of Pediatric Hematology/Oncology 2018 Aug;40(6):458-61. [CENTRAL: CN-02084423] [CFGD REGISTER: SC347c] [PMID: ] [DOI] [PMC free article] [PubMed] [Google Scholar]
Osunkwo 2012 {published data only}
- NCT01331148. Vitamin D for Sickle Cell (SCD Vitamin D). https://clinicaltrials.gov/ct2/show/NCT01331148 (23 June 2014).
- Osunkwo I, Dampier C, Seydafkan S, Cherry K, Ghosh S, Eckman J, et al. Randomized double blind study evaluating response to high dose vitamin D therapy in pediatric sickle cell disease. American Journal of Hematology 2011;86(10):E19. [Google Scholar]
- Osunkwo I, Ziegler T, Avlarez J, George J, Cherry K, Rhodes J, et al. A randomized double blind, placebo controlled study of vitamin D to ameliorate sickle cell chronic pain. Journal of Pain 2012;13(4 Suppl):S73. [Google Scholar]
- Osunkwo I, Ziegler TR, Alvarez J, McCracken C, Cherry K, Osukwo CE, et al. High dose vitamin D therapy for chronic pain in children and adolescents with sickle cell disease: Results of randomized double blind pilot study. British Journal of Haematology 2012;159(2):211-5. [DOI] [PMC free article] [PubMed] [Google Scholar]
References to studies excluded from this review
ACTRN12612000560897 {published data only}
- ACTRN12612000560897. Vitamin D status and vitamin D therapy in adult Bahraini sickle cell patients with chronic pain. apps.who.int/trialsearch/Trial2.aspx?TrialID=ACTRN12612000560897 (accessed 5 October 2016).
Adewoye 2008 {published data only}
- Adewoye AH, Chen TC, Ma Q, McMahon L, Mathieu J, Malabanan A, et al. Sickle cell bone disease: Response to vitamin D and calcium. American Journal of Haematology 2008;83(4):271-4. [DOI] [PubMed] [Google Scholar]
NCT01276587 {published data only}
- NCT01276587. Study of vitamin D in children with sickle cell disease. clinicaltrials.gov/show/NCT01276587 (first posted 13 January 2011).
References to ongoing studies
NCT03417947 {published data only}
- NCT03417947. Vitamin D intervention in children with sickle cell disease: a pilot randomized controlled trial. clinicaltrials.gov/show/NCT03417947 (first posted 31 January 2018).
NCT04170348 {published data only}
- NCT04170348. Daily vitamin D for sickle-cell respiratory complications (ViDAS-2). clinicaltrials.gov/show/NCT04170348 (first posted 20 November 2019).
PACTR201803003160262 {published data only}
- PACTR201803003160262. Effectiveness of a six-week treatment course of vitamin D in steady state sickle cell anaemia children with hypovitaminosis. pactr.samrc.ac.za/TrialDisplay.aspx?TrialID=3160 (first posted 03 March 2018).
Additional references
Adly 2019
- Adly A, Ebeid F, Sallam S, Gohar A. Effect of vitamin D supplementation on clinical outcomes of sickle cell disease. HemaSphere 2019;3:1032-1033. [DOI: 10.1097/01.HS9.0000567732.09524.9b.] [DOI] [Google Scholar]
AFMC 2009
- Armed Force Medical College (AFMC), World Health Organization (WHO). Text book of public health and community medicine. 1st edition. New Delhi: World Health Organization (WHO), 2009. [Google Scholar]
Almeida 2005
- Almeida A, Roberts I. Bone involvement in sickle cell disease. British Journal of Haematology 2005;129(4):482-90. [DOI] [PubMed] [Google Scholar]
Ashley‐Koch 2000
- Ashley-Koch A, Yang Q, Olney RS. Sickle Hemoglobin (HbS) allele and sickle cell disease: A HuGE review. American Journal of Epidemiology 2000;151(9):839-45. [DOI] [PubMed] [Google Scholar]
Avenell 2014
- Avenell A, Mak JCS, O’Connell D. Vitamin D and vitamin D analogues for preventing fractures in post-menopausal women and older men. Cochrane Database of Systematic Reviews 2014, Issue 4. Art. No: CD000227. [DOI: 10.1002/14651858.CD000227.pub4] [DOI] [PMC free article] [PubMed] [Google Scholar]
Bennett 2003
- Bennett PN, Brown MJ. Clinical Pharmacology. 9th edition. Spain: Churchill Livingstone, 2003. [Google Scholar]
Bischoff‐Ferrari 2006
- Bischoff-Ferrari HA, Giovannucci E, Willett WC, Dietrich T, Dawson-Hughes B. Estimation of optimal serum concentrations of 25-hydroxyvitamin D for multiple health outcomes. American Journal of Clinical Nutrition 2006;84(1):18-28. [DOI] [PubMed] [Google Scholar]
Bjelakovic 2014
- Bjelakovic G, Gluud LL, Nikolova D, Whitfield K, Wetterslev J, Simonetti RG et al. Vitamin D supplementation for prevention of mortality in adults. Cochrane Database of Systematic Reviews 2014, Issue 1. Art. No: CD007470. [DOI: 10.1002/14651858.CD007470.pub3] [DOI] [PMC free article] [PubMed] [Google Scholar]
Buison 2004
- Buison AM, Kawchak DA, Schall J, Ohene-Frempong K, Stallings VA, Zemel BS. Low vitamin D status in children with sickle cell disease. Journal of Pediatrics 2004;145(5):622-7. [DOI] [PubMed] [Google Scholar]
CDC 2012a
- Centres for Disease Control and Prevention (CDC). Facts about sickle cell disease. www.cdc.gov/ncbddd/sicklecell/facts.html (accessed 9th May 2012).
CDC 2012b
- Centres for Disease Control and Prevention (CDC). Fact sheet. www.cdc.gov/ncbddd/sicklecell/documents/SCD%20factsheet_What%20is%20SCD.pdf (accessed 10th May 2012).
Chung 2009
- Chung M, Balk EM, Brendel M, Ip S, Lau J, Lee J, et al. Vitamin D and calcium: A systematic review of health outcomes. Evidence Report/Technology Assessment 2009;183:1-420. [PMC free article] [PubMed] [Google Scholar]
Dampier 2002
- Dampier C, Ely E, Brodecki D, O'Neal P. Home management of pain in sickle cell disease: a daily diary study in children and adolescents. Journal of Pediatric Hematology/Oncology 2002;24(8):643-7. [DOI] [PubMed] [Google Scholar]
Deeks 2011
- Deeks JJ, Higgins JP, Altman DG. Chapter 9: Analysing data and undertaking meta-analysis. In: Higgins JP, Green S (editors). Cochrane Handbook for Systematic Reviews of Interventions Version 5.1.0 [updated March 2011]. The Cochrane Collaboration, 2011. Available from www.cochrane-handbook.org.
Ferguson 2014
- Ferguson JH, Chang AB. Vitamin D supplementation for cystic fibrosis. Cochrane Database of Systematic Reviews 2014, Issue 5. Art. No: CD007298. [DOI: 10.1002/14651858.CD007298.pub3] [DOI] [PMC free article] [PubMed] [Google Scholar]
Gonzalez 2010
- Gonzalez C. Vitamin D Supplementation: An Update. US Pharmacist 2010;35(10):58-76. [Google Scholar]
Goodman 2010
- Goodman BM 3rd, Artz N, Radford B, Chen IA. Prevalence of vitamin D deficiency in adults with sickle cell disease. Journal of National Medical Association 2010;102(4):332-5. [DOI] [PubMed] [Google Scholar]
Gorrido 2012
- Gorrido C, Cela E, Bele'ndez C, Mata C, Huerta J. Status of vitamin D in children with sickle cell disease living in Madrid, Spain. European Journal of Pediatrics 2012;171(12):1793-8. [DOI] [PubMed] [Google Scholar]
GRADEpro 2015 [Computer program]
- McMaster University, 2015 (developed by Evidence Prime, Inc.) GRADEpro GDT: GRADEpro Guideline Development Tool [software]. McMaster University, 2015 (developed by Evidence Prime, Inc.), available from gradepro.org.
Hewison 1992
- Hewison M. Vitamin D and the immune system. Journal of Endocrinology 1992;132(2):173-5. [DOI] [PubMed] [Google Scholar]
Higgins 2011
- Higgins JP, Altman DG (editors). Chapter 8: Assessing risk of bias in included studies. In: Higgins JP, Green S (editors). Cochrane Handbook for Systematic Reviews of Interventions Version 5.1.0 [updated March 2011]. The Cochrane Collaboration, 2011. Available from www.cochrane-handbook.org.
Holick 2006
- Holick MF. High prevalence of vitamin D inadequacy and implications for health. Mayo Clinic Proceedings 2006;81(3):353-73. [DOI] [PubMed] [Google Scholar]
Holick 2007
- Holick MF. Vitamin D deficiency. New England Journal of Medicine 2007;357(3):266-81. [DOI] [PubMed] [Google Scholar]
Holick 2011
- Holick MF, Blinkey NC, Bischoff-Ferrari HA, Gordon CM, Hanley DA, Heaney RP, et al. Evaluation, treatment and prevention of vitamin D deficiency: an Endocrine Society Clinical Practice Guideline. Journal of Clinical Endocrinology and Metabolism 2011;96(7):1911-30. [DOI] [PubMed] [Google Scholar]
Hyacinth 2010
- Hyacinth HI, Gee BE, Hibbert JM. The role of nutrition in sickle cell disease. Nutrition and Metabolic Insights 2010;3:57-67. [DOI] [PMC free article] [PubMed] [Google Scholar]
Jackson 2012
- Jackson TC, Krauss MJ, Debaun MR, Strunk RC, Arbela'ez AM. Vitamin D deficiency and comorbidities in children with sickle cell anemia. Pediatric Hematology and Oncology 2012;29(3):261-6. [DOI] [PMC free article] [PubMed] [Google Scholar]
Jagannath 2010
- Jagannath VA, Fedorowicz Z, Asokan GV, Robak EW, Whamond L. Vitamin D for the management of multiple sclerosis. Cochrane Database of Systematic Reviews 2010, Issue 12. Art. No: CD008422. [DOI: 10.1002/14651858.CD008422.pub2] [DOI] [PubMed] [Google Scholar]
Kato 2007
- Kato GJ, Gladwon MT, Steinberg M. Deconstructing sickle cell disease: Reappraisal of the role of hemolysis in the development of clinical subphenotypes. Blood Reviews 2007;21(1):37-47. [DOI] [PMC free article] [PubMed] [Google Scholar]
Kawchak 2007
- Kawchak DA, Schall JI, Zemel BS, Ohene-Frempong K, Stallings VA. Adequacy of dietary intake declines with age in children with sickle cell disease. Journal of the American Dietetic Association 2007;107(5):843-8. [DOI] [PubMed] [Google Scholar]
Kennel 2010
- Kennel KA, Drake MT, Hurley D. Vitamin D deficiency in adults: when to test and how to treat. Mayo Clinic Proceedings 2010;85(8):752-8. [DOI] [PMC free article] [PubMed] [Google Scholar]
Osunkwo 2011a
- Osunkwo I, Hodgman EI, Cherry K, Dampier C, Eckman J. Vitamin D deficiency and chronic pain in sickle cell disease. British Journal of Haematology 2011;153(4):538-40. [DOI] [PubMed] [Google Scholar]
Osunkwo 2011b
- Osunkwo I. Complete resolution of sickle cell chronic pain with high dose vitamin D therapy: A case report and review of the literature. Journal of Pediatric Hematology and Oncology 2011;33(7):549-51. [DOI] [PubMed] [Google Scholar]
Palmer 2009a
- Palmer SC, McGregor DO, Craig JC, Elder G, Macaskill P, Strippoli GF. Vitamin D compounds for people with chronic kidney disease not requiring dialysis. Cochrane Database of Systematic Reviews 2009, Issue 4. Art. No: CD008175. [DOI: 10.1002/14651858.CD008175] [DOI] [PubMed] [Google Scholar]
Palmer 2009b
- Palmer SC, McGregor DO, Craig JC, Elder G, Macaskill P, Strippoli GFM. Vitamin D compounds for people with chronic kidney disease requiring dialysis. Cochrane Database of Systematic Reviews 2009, Issue 4. Art. No: CD005633. [DOI: 10.1002/14651858.CD005633.pub2] [DOI] [PubMed] [Google Scholar]
Park 2011
- Park K. Park’s textbook of Preventive and Social Medicine. 21st edition. Jabalpur: Banarsidas Bhanot Publishers, 2011. [Google Scholar]
Platt 1994
- Platt OS, Brambilla DJ, Rosse WF, Milner PF, Castro O, Steinberg MH, et al. Mortality in sickle cell disease: Life expectancy and risk factors for early death. New England Journal of Medicine 1994;330(23):1639-44. [DOI] [PubMed] [Google Scholar]
Pramyothin 2012
- Pramyothin P, Holick MF. Vitamin D supplementation: guidelines and evidence for subclinical deficiency. Current Opinion Gastroenterology 2012;28(2):139-50. [DOI] [PubMed] [Google Scholar]
Ramakrishnan 2010
- Ramakrishnan M, Moisi JC, Klugman K, Iglesias JM, Grant LR, Mpoudi-Etame M, et al. Increased risk of invasive bacterial infection in African people with sickle-cell disease: a systematic review and meta-analysis. Lancet Infectious Diseases 2010;10(5):329-37. [DOI] [PubMed] [Google Scholar]
Rees 2010
- Rees DC, Williams TN, Gladwin MT. Sickle-cell disease. Lancet 2010;376(9757):2018-31. [DOI] [PubMed] [Google Scholar]
RevMan 2014 [Computer program]
- The Nordic Cochrane Centre, The Cochrane Collaboration Review Manager (RevMan). Version 5.3. Copenhagen: The Nordic Cochrane Centre, The Cochrane Collaboration, 2014.
Ross 2011
- Ross AC, Manson JE, Abrams SA, Brannon PM, Clinton SK, Durazo-Arvizu RA, et al. The 2011 report on dietary reference intakes for calcium and vitamin D from the Institute of Medicine: what clinicians need to know. Journal of Clinical Endocrinology and Metabolism 2011;96(1):53-8. [DOI] [PMC free article] [PubMed] [Google Scholar]
Rovner 2008
- Rovner AJ, Stallings VA, Kawchak DA, Schall JI, Ohene-Frempong K, Zemel BS. High risk of Vitamin D deficiency in children with sickle cell disease. Journal of the American Dietetic Association 2008;108(9):1512-6. [DOI] [PubMed] [Google Scholar]
Straube 2015
- Straube S, Derry S, Straube C, Moore RA. Vitamin D for the treatment of chronic painful conditions in adults. Cochrane Database of Systematic Reviews 2015, Issue 5. Art. No: CD007771. [DOI: 10.1002/14651858.CD007771.pub3] [DOI] [PMC free article] [PubMed] [Google Scholar]
Swanson 2011
- Swanson ME, Grosse SD, Kulkarni R. Disability among individuals with sickle cell disease: Literature review from a public health perspective. American Journal of Preventive Medicine 2011;41(6S4):S390-7. [DOI] [PubMed] [Google Scholar]
Weatherall 2008
- Weatherall DJ. Genetic variation and susceptibility to infection: the red cell and malaria. British Journal of Haematology 2008;141(3):276-86. [DOI] [PubMed] [Google Scholar]
WHO 2010
- World Health Organization (WHO). Sickle cell disease: A strategy for the WHO African Region: Report of the regional director on 22 June 2010. www.afro.who.int/index.php?option=com_docman&task=doc_download&gid=5436 (accessed 10th May 2012).
Williams 2018
- Williams KM, Lee MT, Licursi M, Brittenham GM, Fennoy I. Response to long-term vitamin D therapy for bone disease in children with sickle cell disease. Journal of pediatric hematology/oncology 2018;40(6):458-461. [DOI: 10.1097/MPH.0000000000001155] [DOI] [PMC free article] [PubMed] [Google Scholar]
Winzenberg 2010
- Winzenberg TM, Powell S, Shaw KA, Jones G. Vitamin D supplementation for improving bone mineral density in children. Cochrane Database of Systematic Reviews 2010, Issue 10. Art. No: CD006944. [DOI: 10.1002/14651858.CD006944.pub2] [DOI] [PubMed] [Google Scholar]
Wykes 2014
- Wykes C, Arasaretnam A, O’Driscoll S, Farnham L, Moniz C, Rees DC. Vitamin D deficiency and its correction in children with sickle cell anaemia. Annals of Hematology 2014;93(12):2051-6. [DOI: 10.1007/s00277-014-2144-7] [DOI] [PubMed] [Google Scholar]
References to other published versions of this review
Soe 2017
- Soe HH, Abas AB, Than NN, Ni H, Singh J, Said AR, Osunkwo I. Vitamin D supplementation for sickle cell disease. Cochrane Database of Systematic Reviews 2017, Issue 1. Art. No: CD010858. [DOI: 10.1002/14651858.CD010858.pub2] [DOI] [PMC free article] [PubMed] [Google Scholar]