

Abstract
Background
Consolidation chemotherapy, autologous hematopoietic cell transplantation (HCT) and allogeneic HCT represent potential treatment alternatives for post‐remission therapy in adult acute lymphoblastic leukemia (ALL), but there is genuine uncertainty regarding the optimal approach.
Objectives
To assess the effect of matched sibling donor vs. no donor status for adults with ALL in first complete remission (CR1).
Search methods
We performed a search of CENTRAL, MEDLINE and EMBASE electronic databases in September 2010 along with handsearching of literature cited in relevant primary articles, search of abstracts from American Society of Hematology and American Society of Clinical Oncology meetings, as well as consultation with content experts in the field.
Selection criteria
Review was performed by two authors, and Inclusion criteria included the following: controlled trials with donor vs. no donor comparison with assignment by genetic randomizationin adults with ALL in CR1.
Data collection and analysis
We extracted data on benefits (overall survival, progression‐free survival) and harms (treatment‐related mortality, relapse) of compared treatments. Adverse events were considered, but analysis of individual adverse events was not possible from the reported literature. We pooled summary results from each study using a random‐effects model. We assessed heterogeneity. We performed subgroup analyses for disease risk categories. We performed sensitivity analyses according to methodological quality.
Main results
A total of 14 relevant trials were identified, consisting of a total of 3157 patients. There was a statistically significant overall survival advantage in favor of the donor versus no donor group (HR 0.86; 95% CI 0.77 to 0.97; P = 0.01), as well as significant improvement in disease‐free survival in the donor group(HR 0.82; 95% CI 0.72 to 0.94; P = 0.004). Those in the donor group had significant reduction in primary disease relapse(RR 0.53; 95% CI 0.37 to 0.76; P = 0.0004) and significant increase in non‐relapse mortality(RR 2.8; 95% CI 1.66 to 4.73; P = 0.001). Significant heterogeneity was detected in analysis of relapse (Chi2 40.51, df = 6, P < 0.00001; I2 = 85%). In regard to methodologic quality, the majority of included studies were free of selective reporting, and performed analyses according to intention to treat. Conversely, few reported sample size calculation that informed the study design. While blinding was considered as an important domain of methodological quality, none of the studies reported on whether any of the study personnel were blinded (e.g. subjects, personnel, outcome assessors, data analysts etc). Therefore, we did not consider blinding further in the analysis of methodological quality in this review.
Authors' conclusions
The results of this systematic review and meta‐analysis support matched sibling donor allogeneic hematopoietic cell transplantation as the optimal post‐remission therapy in ALL patients aged 15 years or over. This therapy offers superior overall survival and disease‐free survival, and significantly reduces the risk of disease relapse, but does impose an increased risk of non‐relapse mortality. Importantly these data are based on adult ALL treated with largely total body irradiation‐based myeloablative conditioning and sibling donor transplantation and, therefore, cannot be generalized to pediatric ALL, alternative donors including HLA (human leukocyte antigen) mismatched or unrelated donors, or reduced toxicity or non‐myeloablative conditioning regimens.
Keywords: Adult; Humans; Hematopoietic Stem Cell Transplantation; Hematopoietic Stem Cell Transplantation/methods; Hematopoietic Stem Cell Transplantation/mortality; Histocompatibility; Living Donors; Precursor Cell Lymphoblastic Leukemia‐Lymphoma; Precursor Cell Lymphoblastic Leukemia‐Lymphoma/mortality; Precursor Cell Lymphoblastic Leukemia‐Lymphoma/surgery; Randomized Controlled Trials as Topic; Recurrence; Remission Induction; Siblings; Transplantation Conditioning; Transplantation Conditioning/methods; Transplantation, Homologous; Transplantation, Homologous/mortality
Plain language summary
Donor versus no donor comparison of hematopoietic cell transplantation for adult acute lymphoblastic leukemia in first complete remission
An area of uncertainty in the care of patients with acute lymphoblastic leukemia (ALL) is the choice of treatment that is given after a complete remission is achieved with induction chemotherapy. Therapeutic alternatives include consolidation chemotherapy, autologous transplant (transplantation of a patient's own stem cells) or allogeneic transplant (transplantation utilizing donor stem cells). Clinical trials have come to different conclusions about the best approach. We conducted a systematic review and meta‐analysis to synthesize available clinical research studies that have examined outcome according to donor vs. no donor status, or genetic randomization. This is a method of analysis for assessing the effect of transplantation in this disease condition. Our analysis supports matched sibling donor allogeneic hematopoeitic cell transplantation as the approach which offers the best long‐term outcomes, specifically providing optimal survival and reduced risk for ALL relapse.
Background
Acute lymphoblastic leukemia (ALL) has been successfully treated with aggressive chemotherapy protocols in children with remarkable success, with greater than 90% achieving complete remission of the disease (Stanulla 2009). However, while multi‐agent chemotherapy regimens can induce comparable rates of complete remission in adults, the subsequent intensification/consolidation and maintenance therapy inadequately controls the disease, with the majority suffering treatment failure from disease relapse. Conversely, treatment protocols including allogeneic hematopoietic cell transplantation (stem cell transplantation from a donor) as post‐remission therapy have produced survival of 28% to 48% at five years (Annino 2002; Bassan 2001; Dombret 2002a; Goldstone 2008; Hallbrook 2002; Holowiecki 2008; Hunault 2004; Kantarjian 2004; Labar 2004; Larson 1998; Linker 2002,; Ribera 2005; Sebban 1994; Takeuchi 2002; Thiebaut 2000; Thomas 2004).
However, the optimal strategy for post‐remission therapy, namely chemotherapy versus autologous hematopoietic cell transplantation (transplatation of stem cells from the patient) versus allogeneic HCT (stem cell transplantation from a donor), remains unclear despite intensive investigation to date. Many randomized controlled trials (RCTs) have been conducted with adult ALL patients in first complete remission (CR1) with treatment allocation based on the concept of genetic randomization, wherein patients with a matched sibling donor are assigned to the allogeneic HCT strategy, and those without are assigned to non‐allogeneic HCT treatment (either chemotherapy or autologous HCT) (Dombret 2002a; Goldstone 2008; Hunault 2004; Labar 2004; Ribera 2005; Sebban 1994; Takeuchi 2002; Thomas 2004). These trials have been comprised of relatively small samples, and also suffer from heterogeneity in both the definitions for and relative composition of high‐risk ALL patients. A systematic review published in 2006 with a search date of 2005 concluded an overall survival benefit, which was most pronounced in those with high‐risk disease (hazard ratio (HR) 1.42; 95% confidence interval (CI) 1.06 to 1.90, P = 0.019) (Yanada 2006). Since the conclusion of this meta‐analysis, the largest randomized trial comparing post‐remission therapies in adults with ALL in CR1, the collaborative MRC UKALL XII/ECOG E2993 trial, has been published, which challenges several of the findings from these previous trials and meta‐analyses (Goldstone 2008). Most importantly, the MRC UKALL XII/ECOG E2993 trial demonstrates a significant survival advantage for allogeneic HCT in adults with ALL in CR1 with standard‐risk disease, but does not support this conclusion in high‐risk disease on account of prohibitive treatment‐related mortality that offsets the beneficial reduction in relapse from allogeneic HCT. Further compounding the uncertainty regarding optimal post‐remission therapy in adults with ALL in CR1, this new evidence needs to be incorporated to facilitate informed decision‐making.
Description of the condition
Acute lymphoblastic leukemia is a clonal hematologic malignancy, which constitutes less than 5% of adult lymphoid neoplasms. The disorder consists of both precursor B and precursor T phenotypes. The median age of diagnosis for adult pre‐B ALL is 39, while most with precursor T ALL will present in their teens to 20s. The treatment of this disorder consists of induction therapy to achieve a first remission, with rates of complete remission that approximate the success in childhood ALL induction. However, most will relapse after non‐transplant treatment regimens. Conversely, treatment protocols including allogeneic hematopoietic cell transplantation as post‐remission therapy have resulted in good survival at five years (Annino 2002; Bassan 2001; Dombret 2002a; Goldstone 2008; Hallbrook 2002; Holowiecki 2008; Hunault 2004; Kantarjian 2004; Labar 2004; Larson 1998; Linker 2002; Ribera 2005; Sebban 1994; Takeuchi 2002; Thiebaut 2000; Thomas 2004). However, there is uncertainty regarding the optimal post‐remission therapy.
Description of the intervention
A donor versus no donor comparison in patients with adult ALL in first complete remission is comprised of those with a matched sibling donor (‘donor’) who are allocated to allogeneic HCT, and those without (‘no donor’) who are assigned to non‐allogeneic HCT therapy (consisting of chemotherapy or autologous HCT). Allogeneic HCT offers the potential for increased disease control through both intensive conditioning therapy as well as graft versus leukemia immune response. These beneficial effects of allogeneic HCT on disease control are countered by increased risk of treatment‐related toxicity and mortality (Goldstone 2008).
How the intervention might work
The intervention of allogeneic hematopoietic cell transplantation mediates control of ALL by two mechanisms. First, the high‐dose chemotherapy or radiotherapy (or both) delivered in the conditioning regimen prior to transplantation has anti‐leukemic activity. Second, the ongoing immunologic surveillance provided by the alloreactive donor T cells mediates a 'graft versus malignancy' effect that contributes to disease control after transplantation.
Why it is important to do this review
Adult ALL is a significant threat to affected patients’ lives and there is genuine uncertainty about what constitutes the optimal post‐remission therapy for these patients and their respective risk subcategories.
The uncertainties lie in the conflicting results from the major randomized trials performed to date, which compare post‐remission therapies for ALL in CR1. Based on these trial results, there is uncertainty regarding:
whether or not there is a survival advantage with allogeneic HCT versus other post‐remission therapies for ALL in CR1; and
the benefit of this therapy according to disease‐risk subgroups.
Objectives
We aimed to conduct a systematic review and meta‐analysis of the literature examining a donor versus no donor comparison in adults with acute lymphoblastic leukemia (ALL) in first complete remission (CR1).
Methods
Criteria for considering studies for this review
Types of studies
Adult patients with ALL in CR1.
Controlled trials with assignment based on ‘genetic randomization’ (i.e. treatment assignment based on the availability of matched sibling donor versus no‐donor) (Wheatley 2004). Genetic randomization has been utilized to address selection bias inherent in transplant physicians' evaluations of patient eligibility and fitness to tolerate transplantation.
We imposed no language restrictions.
Types of participants
The study participants are adults, defined in the relevant literature as those aged 15 years or over, with diagnosis of acute lymphoblastic leukemia, who have achieved first complete remission of their disease after induction chemotherapy. Importantly, this broad category of adult ALL patients includes those considered adolescent young adults (AYA). Those studies with pediatric subjects (age < 15) were not considered eligible.
Types of interventions
Those with a matched sibling donor (‘donor’) were allocated to allogeneic HCT, and those without (‘no donor’) were assigned to non‐allogeneic HCT therapy (consisting of chemotherapy or autologous HCT).
Types of outcome measures
Primary outcomes
Overall survival, defined as the time to death from any cause. We examined survival according to donor versus no‐donor categories by genetic randomization. Analyses are reported according to the principle of intention‐to‐treat.
Secondary outcomes
Progression‐free survival, defined as the time from achieving remission to relapse, or death from any cause.
Relapse, defined as recurrence of acute lymphoblastic leukemia after transplantation/chemotherapy.
Non‐relapse mortality (NRM), defined as death in the absence of disease relapse.
Search methods for identification of studies
Electronic searches
We identified relevant studies by a search of the CENTRAL (for search strategy see Appendix 1), MEDLINE (OVID) (for search strategy see Appendix 2) and EMBASE (for search strategy see Appendix 3) electronic databases for the years 1966 to September 2010.
We utilized the search strategy proposed by Haynes 2005 and modified this for the current search. Please see Appendix 2 for additional information.
Searching other resources
Scanning of references
We scanned all the references of relevant articles and retrieved all articles that had the potential to be included in this review.
Manual search
We handsearched the abstract listings from the American Society of Hematology (2007‐2010) and American Society of Clinical Oncology (2008‐2010) meetings to identify potentially relevant studies.
Expert contacts
Additionally, we consulted experts in oncology and hematology around the world about the studies currently ongoing or which have not yet been published.
Data collection and analysis
Selection of studies
We considered only those studies that met the following criteria:
patients were adults with ALL in CR1;
prospective trial with ‘genetic randomization’ (i.e. based on availability of matched sibling donor versus not).
Two review authors independently scanned all the obtained abstracts using the search strategies described earlier for their eligibility according to the inclusion criteria. In the case that a decision on inclusion was not reached on the basis of the abstract, we obtained a full copy of the published article to reach a decision on inclusion. All disagreements between the review authors were resolved by consensus.
Two review authors assessed each trial independently for quality. We extracted data for each trial on the following quality domains: generation of allocation sequence, allocation concealment, blinding, description of drop‐outs and withdrawals, a priori specification of alpha and beta error, sample size calculations, data analysis according to the intention‐to‐treat principle (ITT), and source of funding.
Data extraction and management
Two review authors performed data extraction independently using standardized data extraction forms. From each relevant trial, we extracted data on the following characteristics: time frame of patient enrollment; age of subjects; definition of standard and conversely high‐risk ALL; inclusion of subjects with disease of standard versus high risk versus combined; inclusion of Philadelphia chromosome (Ph (+)) ALL; characteristics of induction chemotherapy; the percentage in complete remission after induction chemotherapy; median time from achievement of first complete remission to allogeneic HCT; eligibility criteria for allogeneic HCT; type of non‐allogeneic HCT therapy received in the ‘no donor’ group, namely chemotherapy versus autologous HCT versus combined; compliance with assigned therapy in both ‘donor’ and ‘no donor’ groups; characteristics of conditioning regimen employed in allogeneic HCT and autologous HCT; and median follow‐up time for each study. We extracted data on benefits (overall survival, progression‐free survival) and harms (treatment‐related mortality, relapse) of compared treatments.
Assessment of risk of bias in included studies
We assessed risk of bias for each study and constructed a 'Risk of bias' table for each. We considered the following factors: blinding, selective reporting, sample size calculation, allocation concealment and reporting per intention‐to‐treat principle (Als‐Nielsen 2004; Boutron 2005; Chan 2005; Higgins 2008; Moher 1999; Jüni 2001; Schulz 2002). We assessed the possibility of publication bias using the Begg and Egger funnel plot method (Begg 1994; Egger 1997).
Measures of treatment effect
Time‐to‐event data (overall survival, progression‐free survival) is summarized as hazard ratios (HR) and dichotomous data (relapse and non‐relapse mortality) as risk ratio (RR).
Unit of analysis issues
There are no relevant unit of analysis issues.
Dealing with missing data
When it was not possible to abstract outcome data from the primary literature, we contacted the contact author for such publications directly to request this information. We did not impute any missing data and therefore assumptions regarding imputed data or sensitivity analyses to explore the effect of imputed data are not provided.
Assessment of heterogeneity
We assessed statistical heterogeneity (Higgins 2002; Higgins 2003) both by visual inspection of the forest plots and by a formal statistical test for heterogeneity using the Chi2 test (DerSimonian 1986) and I2 statistic (Deeks 2008; Higgins 2003). We addressed statistical heterogeneity detected through exploration of both clinical diversity and diversity in methodological quality of the included studies.
Assessment of reporting biases
We assessed the possibility of publication bias using the Begg and Egger funnel plot method (Begg 1994; Egger 1997; Peters 2006; Sterne 2001; Sterne 2008).
Data synthesis
Time‐to‐event data (overall survival, progression‐free survival) are reported as hazard ratios (HR) and dichotomous data (relapse and non‐relapse mortality) are reported as risk ratios (RR). We pooled the summary results from each study using a random‐effects model (DerSimonian 1986). When time‐to‐event data were unavailable for direct extraction, we extracted data according to the method described by Parmar et al (Parmar 1998). This method allows calculation of the hazard ratio from different parameters using indirect calculation of the variance (V) and the number of observed minus expected (O‐E) events.
Subgroup analysis and investigation of heterogeneity
We examined the following as important subgroups:
-
disease risk categories:
high‐risk;
standard‐risk.
Sensitivity analysis
We conducted sensitivity analyses according to the methodological quality domains, including the following.
Sample size calculation performed (we grouped studies as having either reported a priori sample size calculation versus not).
Analysis by intention‐to‐treat (we classified studies as having either performed analyses according to the principle of intention‐to‐treat versus not).
We considered funding source but did not explore this further in sensitivity analysis, as all trials were uniformly funded by public/governmental sources.
We considered the number of testing centers (single institution versus multicenter national or international trial), but did not explore this further in sensitivity analysis, as all trials were conducted as multicenter trials.
Results
Description of studies
Results of the search
As shown in Figure 1, searches of electronic databases and meeting abstracts, and contact with experts resulted in a total of 4810 citations. We examined the abstracts of all citations for relevance to the review inclusion criteria. For all of the abstracts not excluded based on initial review, we reviewed the full article in detail for inclusion. Based on this review process and thorough review of works cited by primary references, we identified a total of 14 original articles which met the inclusion criteria. In total, 14 trials met the a priori defined inclusion criteria and were therefore included in this analysis.
1.
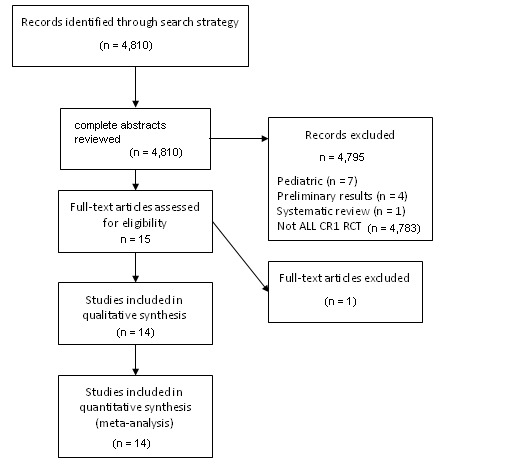
PRISMA flow diagram for study review and inclusion
Included studies
The included studies consist of 14 unique trials which assign adult acute lymphoblastic leukemia (ALL) patients in CR1 according to the presence (donor) or absence (no donor) of a HLA (human leukocyte antigen) matched sibling donor. Those in the donor group were assigned to allogeneic hematopoietic cell transplant, while those in the no donor group were treated with either additional consolidation and maintenance chemotherapy, or rather autologous hematopoietic cell transplantation.
All variables and outcomes abstracted from the included studies are summarized in the table below for reference:
1. Patient and study characteristics of included trials.
| Study | Time frame of enrollment | Age | # donor (ITT) | # no donor (ITT) | Standard‐risk (yes/no) | Standard risk definition | High‐risk (yes/no) | High risk definition | Ph (+) yes/no | % in CR after induction | Median time from CR to allo HCT |
| Goldstone | 1993 to 2006 | Overall: 15 to 64 For allo HCT: 15 to 54 |
443 | 588 | Yes (N = 562) | * | Yes (N = 465) | Age > 35 WBC > 100 (B), or > 30 (T) Philadelphia chromosome positivity (Ph(+)) |
Not included in this report | 90% | n/a |
| Sebban | 1986 to 1991 | Overall: 15 to 40 |
116 | 141 | Yes (N = 161) | * | Yes (N = 96) | Ph+ or undifferentiated leukemia (AUL); common ALL patients with age > 35 years, WBC > 30,000, or time to complete remission (CR) > 4 weeks |
Yes (N = 12) | 69% after induction + additional 7% after salvage (composite total of 76%) | 2.1 months |
| Ribera | 1993 to 2002 | Overall: 27 (15 to 50) Allo HCT: 29 (16 to 49) |
84 | 98 | No | n/a | Only (N = 182) | Age 30 to 50 WBC > 25 t(9:22), t(4:11), 11q23, t(1:19) |
Yes; 37 patients had t(9:22) | 82% | n/a |
| Takeuchi | 1993 to 1997 | Overall: 31 (15 to 59) |
34 | 108 | Yes (N = ?) | * | Yes (N = ?) | Age > 30 WBC > 30 Ph(+) |
Yes; 51 had t(9:22) | 78% | 6.8 months |
| Thomas | 1994 to 2002 | Overall: age 15 to 55; median 33 (15 to 55) | 100 | 159 | No | n/a | Yes (N = 259) | Central nervous system (CNS) disease at diagnosis; failed to achieve CR after the first induction course; B‐lineage ALL patients with 11q23 , t(1;19), WBC > 30,000, or myeloid markers (groups 2,4 of LALA‐94) |
No (non‐Ph(+) high risk patients from LALA‐94) | Group 2: 66% Group 4: 77% (overall 72%) |
2.3 months |
| Hunault | 1994 to 1998 | Overall: median 33 (15 to 59) | 41 | 106 | No | n/a | Yes (N = 147) | Poor‐risk cytogenetics: Ph(+), t(4;11), t(1;19); age > 35, WBC > 30,000; failure to achieve CR after the first induction |
Yes, 37 total (21% of those with cytogenetic information) | 80% | 3 months |
| Labar | 1986 to 1996 | Overall: 15 to 50 Allo: median 29.5 (14 to 48) |
68 | 116 | Yes (N = 47) | * | Yes (N = 137) | WBC > 30; age > 35; AUL phenotype; CR reached > 4 weeks | Yes, 11 total were Ph(+) | After induction: 67% After induction and salvage: 74% |
n/a |
| Fielding | 1993 to 2004 | Median 40 (15 to 60) | 81 | 77 | No | n/a | Yes (N = 158) | All Ph(+) | Yes, (N = 158), all Ph(+) | After induction 1 and 2: 67% Allowing additional therapy beyond this: 82% |
5.3 months |
| Ifrah | 1990 to 1992 | Median 31 (16 to 55) | 18 | 32 | (not defined) | (not defined) | (not defined) | (not defined) | Yes (N = 9) | 78% | Start treatment to allo HCT: median 98 days (range 80 to 121 days) GMCSF: 27 (19 to 53) Placebo: 29.5 (22 to 62) |
| Attal | 1990 to 1992 | Median 31 | 43 | 77 | (not defined) | (not defined) | (not defined) | (not defined) | Yes (N = 12) | 93% | 3.1 months |
| Ueda | 1990 to 1993 | Overall: 43 (15 to 78) Allo HCT group: 23 (15 to 43) |
71 | 109 | Yes (N = 39) | * | Yes (N = 141) | Age > 30 WBC > 30,000 |
Yes (36/130 with information, 28%) | 69% | n/a |
| DeWitte | 1984 to 1992 | Overall: 35 (15 to 50) | 30 | 33 | Yes (N = 22) | * | Yes (N = 47) | Age > 35 WBC > 30 Ph(+) CNS disease Null‐ or B‐cell phenotype Failure to achieve CR after first induction course (by 4 to 5 weeks) |
Yes (6/44 typed) | 84% | 5 months (range 3 to 10) |
| Cornelissen | 1992 to 2005 | Age < 50, age < 55 | 96 | 161 | Yes (N = 50) | * | Yes | Cytogenetics ( t(9:22), t(4:11), t(1:19) Pro‐B immunophenotype WBC (> 30 B, > 100 T cell phenotype) CR achieved > 4 weeks after induction |
Yes (N = 38) | 5.2 months | |
| Bernasconi | 1987 to 1990 | NA | 16 | 29 | Yes (n = 25) | * | Yes (n = 62) | Age > 35 WBC > 35 Ph(+) karyotype time to CR > 4 weeks |
Yes | 77% | n/a |
allo: allogeneic; AUL: undifferentiated leukemia; CNS: central nervous system; CR: complete remission; HCT: hematopoietic cell transplantation; ITT: intention‐to‐treat; MUD: matched unrelated donor; WBC: white blood cell; t: translocation; q: long arm of chromosome; GMCSF: granulocyte‐macrophage colony stimulating factor
2. Criteria for allogeneic transplantation, transplant regimen characteristics, and compliance with intended therapy.
| Study | Allo criteria | Allo tx | Compliance to allo HCT (donor group) | Criteria for non‐allo HCT | Non‐allo tx | Compliance to auto/chemo (no donor) |
| Goldstone | Matched sibling (sib) donor < age 55 |
Etoposide (Etop) 60 mg/kg, total body irradiation (TBI) 1320 cGy | 320/443 | No sib donor Age > 55 |
Chemotherapy (chemo) 2.5 yrs versus autologous (auto) HCT (etoposide 60 mg/kg, 1320 cGy) |
119/588 auto HCT |
| Sebban | Matched sib donor | Cyclophosphamide (Cy) (60 mg/kg x 2 d), TBI (12 Gy) | 92/116 | No matched sib donor | Chemo versus auto HCT (Cy (60 mg/kg x 2 d), TBI (12 Gy)) | 40/141 auto HCT |
| Ribera | Matched sib | Cy (60 mg/kg x 2 d), TBI (12 Gy), or busulfan based | 57/84 | No sib donor | Chemo versus auto HCT | 31/50 auto HCT 36/48 chemo |
| Takeuchi | Matched sib Age < 40 |
n/a | 24/34 | No matched sib Age > 40 |
Intensification chemo versus auto HCT | 10/108 auto HCT |
| Thomas | Sib donor | Cy/Etop/TBI | 96/100 | No sib donor | Auto HCT (Cy/Etop/TBI) | 89/159 auto HCT |
| Hunault | Sib donor Age < 50 |
Cy/Etop/TBI | 39/41 | No sib donor Age > 50 |
Auto HCT (Cy/Etop/TBI) | 86/106 auto HCT |
| Labar | Sib donor (all < age 50) |
Cy (60 mg/kg x 2 d), TBI (12 Gy) | 47/68 | No sib donor (all < age 50) |
Cy (60 mg/kg x 2 d), TBI (12 Gy) auto HCT | 27/116 auto HCT |
| Fielding | Age < 50 (< 55 in UK) Sib donor |
Etop 60 mg/kg, 13.2 Gy TBI | 44/81 (44 had sib allo; 1 MUD, 2 mismatched sib, 3 RIC sib, 31 chemo) | No sib donor Age > 50 (or > 55) |
Chemo versus auto HCT |
6/77 auto HCT 38/77 chemo (29 MUD, 1 mismatched sib, 2 mini‐MUD, 1 mini‐haplo) |
| Ifrah | Age < 45 Matched sib |
Mixed: 1 Bu/Cy (200) 2 TBI/Cy/Etop 4 TBI/Cy 8 TBI/Arac/Mel (all cases TBI 12Gy) |
16/18 | Age > 45 No matched sib |
Auto HCT | 18/32 auto HCT |
| Attal | Matched sib donor | Cy 120 mg/kg TBI 12 Gy |
41/43 | No matched sib | Auto HCT | 64/77 auto HCT |
| Ueda | Age < 45 Matched sib donor |
n/a | 17/71 | Age > 45 No matched sib donor |
Chemo | n/a |
| DeWitte | Matched sib donor | Cy 60 mg/kg x 2 d TBI 12 Gy |
20/30 | No matched sib | Chemo or auto | 8/33 auto HCT 20/33 chemo |
| Cornelissen | Matched related donor | Cy TBI 12 Gy |
91/96 | No matched related donor | Auto HCT | 123/161 auto HCT |
| Bernasconi | Matched related donor | n/a | 11/16 | No matched sibling donor | Auto HCT or chemo | 9/29 auto HCT |
allo: allogeneic; auto: autologous; chemo: chemotherapy; Cy: Cyclophosphamide; Etop: etoposide; HCT: hematopoietic cell transplantation; MUD: matched unrelated donor; sib: sibling; TBI: total body irradiation; tx: treatment; Bu: busulfan; ara‐C: cytarabine; Mel: melphalan; RIC: reduced intensity conditioning
3. Outcomes of therapy.
| Study | Median f/u time | Outcomes (all donor versus no donor) | (OS) | (DFS) | (Relapse) | (NRM) | (Chemo/auto outcomes) |
| Goldstone | 4 years, 11 months | Primary: OS Secondary: EFS Relapse NRM |
(Overall) 5‐year OS: 53% versus 45% (P = 0.01) (High‐risk) 5‐year OS: 41% versus 35% (P = 0.2) (Standard‐risk) 5‐year OS: 62% versus 52% (P = 0.02) |
Standard‐risk 10‐year: 24% versus 49% (P < 0.00005) High‐risk 10‐year: 37% versus 63% (P < 0.00005) |
(High‐risk) 2‐year NRM: 35.8 versus 13.6% (standard risk) 2‐year NRM: 19.5% versus 6.9% |
5‐year OS: chemo (46%), auto (37%; P = 0.03) |
|
| Sebban | 62 months | OS, DFS | (Overall) 5‐year OS: 48% versus 35%, P = 0.08 (High‐risk) 5‐year OS: 44% versus 20%, P = 0.03 |
(Overall) 5‐year DFS: 45% versus 31%, P = 0.1 (High‐risk) 5‐year DFS: 39% versus 14%, P = 0.01 |
|||
| Ribera | 70 months | Primary: DFS Secondary: CR rate OS OS and DFS by tx actually received |
5‐year OS: 35% versus 44% (P = 0.35) |
5‐year: 33% versus 39%, P = 0.47 | 5‐year: 62% versus 51% (P = 0.28) | Allo: 14% | 5‐year OS: auto 37%, chemo 50%, P = 0.17 |
| Takeuchi | 63 months | OS, DFS (not specified as primary/secondary, power calculation) | (Overall) 6‐year OS: 46% versus 40%, P = 0.58 | (Only Ph (+)): 6‐year DFS 44% versus 7%, P = 0.046 | |||
| Thomas | 5.2 years | Primary: DFS Secondary: induction response, OS |
(Group 2/4 pooled) 5‐year DFS: 45% versus 23%, P = 0.007 | (Group 2/4 pooled) 5‐year relapse: 36 versus 62%, P = 0.001 | (Group 2/4 pooled) 5‐year TRM: 18 versus 18% | ||
| Hunault | 5.1 years | Not specified | 6‐year OS: 75% versus 40%, P = 0.0027 | 6‐year: 72% versus 33%, P = 0.0004 | 6‐year: 12% versus 56%, P = 0.0001 | ||
| Labar | 9.5 years | Not specified | 6‐year OS: 41.2% versus 38.8%, P = 0.89 | 6‐year DFS: 38.2% versus 36.8%, P = 0.8 | 6‐year relapse: 38.2% versus 56.3%, P = 0.01 | 6‐year NRM 23.5% versus 6.9%, P = 0.0004 | |
| Fielding | 8 years, 2 months | Primary: OS Secondary: EFS, RFS, NRM |
5‐year OS: 34% versus 25%, P = 0.2 | ||||
| Ifrah | n/a (analysis performed 4 years after study completion) | Not specified | 4‐year OS: Donor: ? No donor: 21% |
4‐year EFS: Donor: 33% No donor: 19% |
|||
| Attal | 32 months | Primary: DFS | 3‐year DFS: Donor: 68% No donor: 26% |
||||
| Ueda | 62 months | Not specified | |
||||
| DeWitte | 65 months | Not specified | 5‐year OS: Overall: Donor = 59% No donor = 41% P = 0.18 High‐risk dz: Donor = 59% No donor = 32% P = 0.04 |
5‐year DFS: Overall: Donor = 61% No donor = 40% P = 0.1 High‐risk dz: Donor = 62% No donor = 29% P < 0.05 |
|||
| Cornelissen | n/a | DFS, NRM, OS, REL | 5‐year OS: donor = 61% No donor = 47% P = 0.08 |
5‐year DFS: donor = 60% No donor = 42% P = 0.01 |
5‐year relapse: donor = 24% No donor = 55% P < 0.001 |
5‐year NRM: Donor = 16% No donor = 3% P = 0.002 |
|
| Bernasconi | n/a | Not specified | Overall DFS at 3 years 35% |
allo: allogeneic; CR: complete remission; DFS: disease‐free survival; f/u: follow up; NRM: non‐relapse mortality; OS: overall survival; tx: treatment; EFS: event‐free survival; RFS: relapse‐free survival; REL: relapse; TRM: treatment‐related mortality; dz: disease
*Table reports patient characteristics, selection criteria for donor versus no‐donor categories and outcome data from the represented 14 trials
Excluded studies
From the search strategy utilizing the above CENTRAL, MEDLINE and EMBASE electronic databases and search of ASH and ASCO abstracts, we excluded a total of 4796 records (Figure 1). Reasons for exclusion are listed in the flow diagram. The most common reason for exclusion was irrelevance to the stated aim of this review, namely not addressing the analysis of donor versus no donor per genetic randomization in adult ALL in first complete remission. One trial (Dombret 2002a) otherwise met criteria, but was excluded based on the inclusion of 14 patients with unrelated donors in the donor group.
Risk of bias in included studies
We assessed risk of bias (see methodological quality domains).
Allocation
Allocation concealment and the description of randomization methods are not applicable in the case of genetic randomization. That is, patients are assigned and not randomized.
Blinding
While blinding was considered as an important domain of methodological quality, none of the studies reported on whether any of the study personnel were blinded (e.g. subjects, personnel, outcome assessors, data analysts etc). Therefore, we did not consider blinding further in the analysis of methodological quality in this review.
Incomplete outcome data
Data were not available from all trials for each major outcome, including overall survival, disease‐free survival, relapse and non‐relapse mortality. We acquired missing data as possible by request to the primary authors of such trials. Data on specific number of studies reporting each outcomes is mentioned under the outcomes section.
Of the 14 included studies, one (Ueda 1998) did not report data according to intention‐to‐treat, but rather reported outcomes according to actual treatment received only. One trial (Bernasconi 1992) only reported data according to treatment received, and did not allow extraction of data relevant to the endpoints of this analysis.
Selective reporting
We assessed included studies for completeness of reporting for both benefits (overall and disease‐free survival) as well as risks (relapse and non‐relapse mortality) associated with donor or no donor group membership.
Other potential sources of bias
Sample size calculation, including expected difference in effect on primary endpoint, pre‐specified alpha level, and pre‐specified beta was clearly described in four of the 14 included studies.
Effects of interventions
From 14 total included trials, a total of 3157 individual patients are represented (Figure 1). Of this total, 1268 patients had a matched sibling donor and conversely 1889 patients did not have a matched sibling donor. For the outcome of overall survival, 10 out of 14 (71%) studies reported abstractable data. For disease‐free survival, nine out of 14 (64%) studies reported data in a way which permitted data abstraction. Data on non‐relapse mortality were extractable from nine out of 14 (64%) studies. Finally, for the outcome of relapse, data were extractable from seven out of 14 (50%) studies.
Efficacy of HLA matched sibling donor (benefits)
1. Overall survival
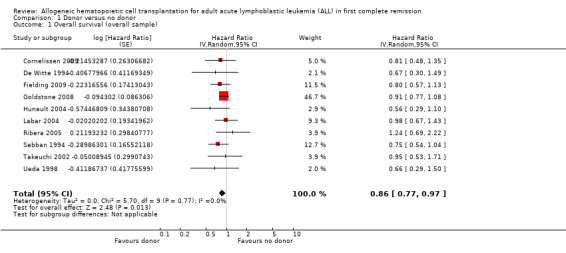
a) Overall sample: data were extractable from 10 out of 14 trials, comprised of a total of 2499 patients. There were 471 deaths from 1013 in the donor group versus 790 deaths from 1486 in the no donor group, resulting in a hazard ratio (HR) of 0.86 (95% confidence interval (CI) 0.77 to 0.97; P = 0.01). There was no significant heterogeneity by Chi2 or I2 testing (Chi2 5.7, df = 9 (P = 0.77); I2 = 0%). These data indicate an overall survival advantage in the donor group as compared to the no donor group (Figure 2).
2.

Forest plot of comparison: 1 Donor versus no donor, outcome: 1.1 Overall survival (overall sample).
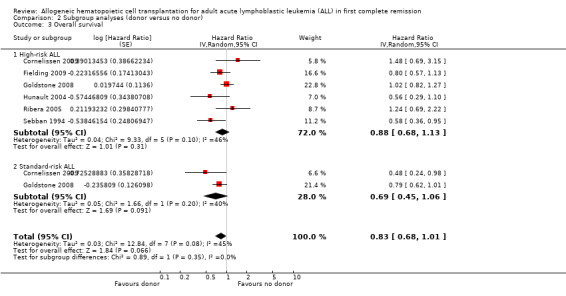
b) High‐risk acute lymphoblastic leukemia (ALL): data were extractable from six out of 14 trials, comprised of a total of 1192 patients. There were 253 deaths from 505 in the donor group versus 377 deaths from 687 in the no donor group, resulting in a HR of 0.88 (95% CI 0.68 to 1.13), P = 0.31. There was no significant heterogeneity by Chi2 or I2 testing (Chi2 9.33, df = 5, P = 0.1; I2 = 46%). These data do not support a significant overall survival advantage for the donor group versus no donor group in high‐risk ALL (Figure 3).
3.
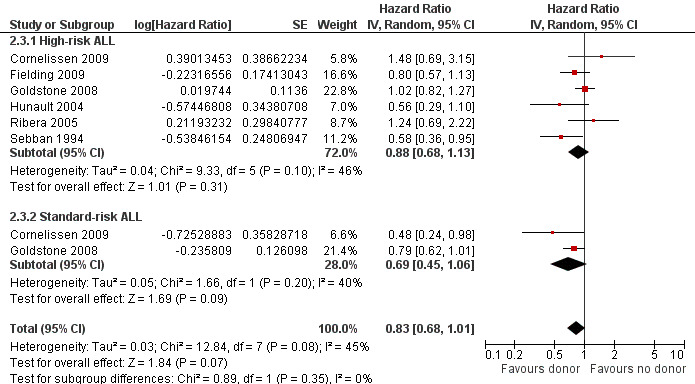
Forest plot of comparison: 2 Subgroup analyses (donor versus no donor), outcome: 2.3 Overall survival.
c) Standard‐risk ALL: only two out 14 trials reported data on standard‐risk ALL, comprised of 712 total patients. There were 109 deaths from 292 in the donor group and 205 deaths from 420 in the no donor group, resulting in a HR of 0.69 (95% CI 0.45 to 1.06), P = 0.09 (Figure 3). No significant heterogeneity was detected: Chi2 1.66, df = 1, P = 0.2; I2 = 40%.
2. Disease‐free survival (DFS)
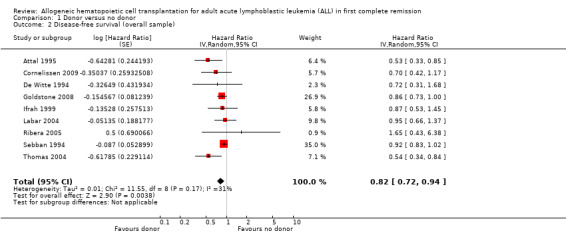
a) Overall sample: data were abstractable from nine out of 14 trials, comprised of a total of 2423 patients. There were 375 events (death or relapse) from 1000 in the donor group, and 678 events (deaths or relapse) from 1423 in the no donor group, resulting in a HR of 0.82 (95% CI 0.72 to 0.94), P = 0.004. There was no significant heterogeneity detected by Chi2 or I2 testing (Chi2 11.55, df = 8, P = 0.17; I2 = 31%). These data demonstrate the significant advantage in terms of DFS in the donor group as compared to the no donor group (Figure 4).
4.
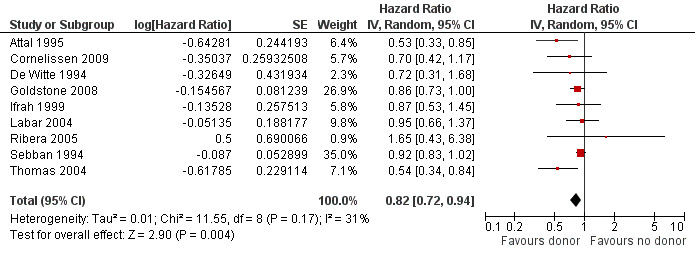
Forest plot of comparison: 1 Donor versus no donor, outcome: 1.2 Disease‐free survival (overall sample).
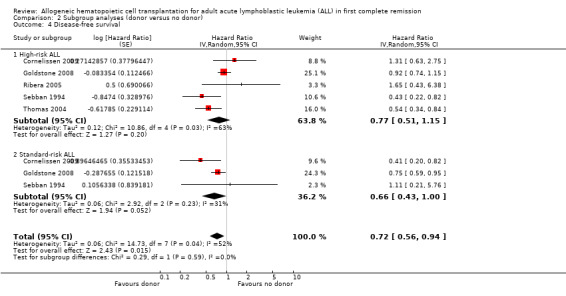
b) High‐risk ALL: data were abstracted from five of 14 trials, comprised of a total of 1145 patients. There were 189 events from 482 in the donor group, and 311 events from 663 in the no donor group, resulting in a HR of 0.77 (95% CI 0.51 to 1.15), P = 0.2. Heterogeneity was detected by Chi2 and I2 testing (Chi2 10.86, df = 4, P = 0.03; I2 = 63%). These data demonstrate a non‐significant DFS advantage in the donor group as compared to no donor group in high‐risk ALL.
c) Standard‐risk ALL: data were abstracted from three of 14 trials, comprised of a total of 873 patients. There were 119 events from 367 in the donor group, and 226 events from 506 in the no donor group, resulting in a HR of 0.66 (95% CI 0.43 to 1.0), P = 0.05. There was no significant heterogeneity detected by Chi2 or I2 testing (Chi2 2.92, df = 2, P = 0.23; I2 = 31%). These data indicate the superior DFS in the donor group in standard‐risk ALL.
3. Relapse
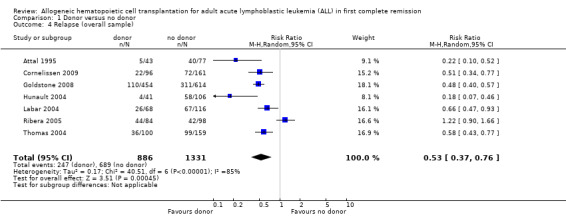
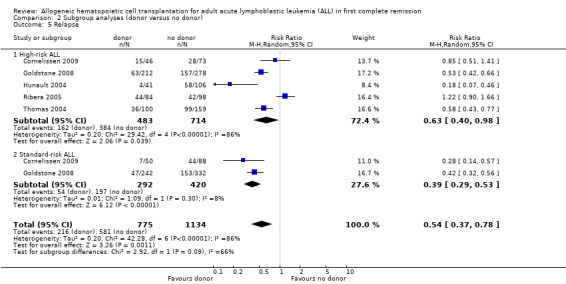
a) Overall sample: data were abstracted from seven of 14 trials, comprised of a total of 2213 patients. There were 253 events from 882 in the donor group, and 697 events from 1331 in the no donor group, resulting in a RR of 0.53 (95% CI 0.37 to 0.76), P = 0.0004. There was statistically significant heterogeneity detected among included trials (Chi2 40.51, df = 6, P < 0.00001; I2 = 85%). These data demonstrate a significant reduction in risk of relapse in the donor group versus the no donor group (Figure 5).
5.
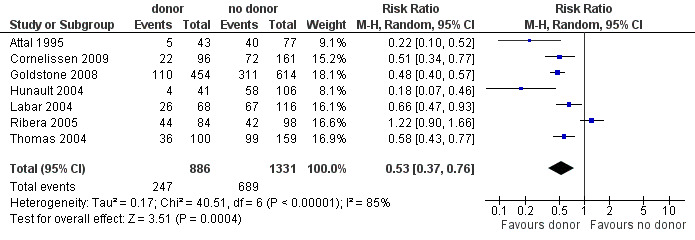
Forest plot of comparison: 1 Donor versus no donor, outcome: 1.4 Relapse (overall sample).
b) High‐risk ALL: data were abstracted from five of 14 trials, comprised of a total of 1296 patients. There were 168 events from 479 in the donor group, and 392 of 714 in the no donor group, resulting in a RR of 0.63 (95% CI 0.4 to 0.98; P = 0.04). There was statistically significant heterogeneity among included studies (Chi2 29.42, df 4, P < 0.00001; I2 of 85%). These data demonstrate a significant reduction in relapse risk in the donor group versus the no donor group.
c) Standard‐risk ALL: data were abstracted from two of 14 trials, comprised of 712 patients. There were 54 events from 292 in the donor group, and 197 events from 420 in the no donor group, resulting in a RR of 0.39 (95% CI 0.29 to 0.53; P < 0.00001). No significant heterogeneity was detected: Chi2 1.09, df = 1, P = 0.3; I2 = 8%.
4. Patient‐reported quality of life
Data on patient‐reported quality of life were not reported in the primary literature and therefore are not assessed in this analysis.
Risks in donor group (harms)
1. Non‐relapse mortality
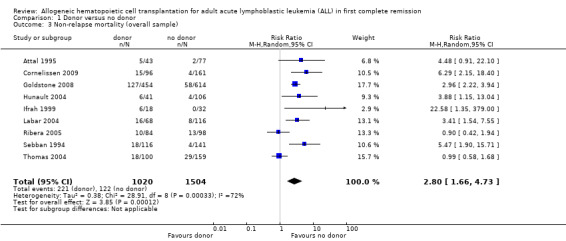
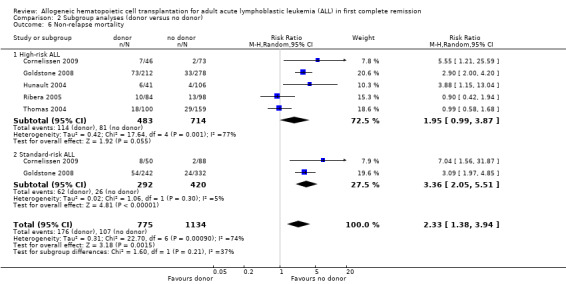
a) Overall sample: data were abstracted from nine of 14 trials, comprised of a total of 2524 patients. There were 220 events from 1020 in the donor group, and 122 events from 1504 in the no donor group, resulting in a RR of 2.8 (95% CI 1.66 to 4.73; P = 0.001). Statistically significant heterogeneity was detected, with Chi2 28.91, df = 8, P = 0.0003; I2 = 72%. These data demonstrate a statistically significant increase in the risk of non‐relapse mortality in the donor group (Figure 6).
6.
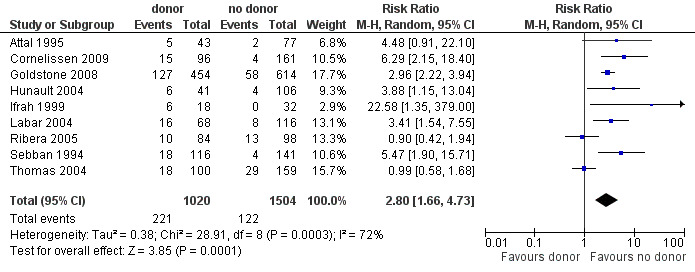
Forest plot of comparison: 1 Donor versus no donor, outcome: 1.3 Non‐relapse mortality (overall sample).
b) High‐risk ALL: data were abstracted from five of 14 trials for a total of 1197 patients. There were 113 events from 483 in the donor group, and 81 events from 714 in the no donor group, resulting in a RR of 1.95 (95% CI 0.99 to 3.87; P = 0.05). There was statistically significant heterogeneity among included studies with Chi2 17.64, df = 4, P = 0.001; I2 = 77%. These data do not support a significant difference in non‐relapse mortality in the donor group compared to the no donor group.
c) Standard‐risk ALL: data were only available from two of 14 trials, comprised of 712 patients. There were 62 events from 292 in the donor group, and 26 events from 420 in the no donor group, resulting in a RR of 3.36 (95% CI 2.05 to 5.51), P < 0.00001. Significant heterogeneity was not detected: Chi2 1.06, df = 1, P = 0.3; I2 = 5%. These data indicate that there is a statistically significant increased risk for non‐relapse mortality in the donor group as compared to the no donor group.
Sensitivity analysis: exploration of heterogeneity
1. Non‐relapse mortality
We have observed statistically significant heterogeneity among trials included in the analysis of non‐relapse mortality. Visual inspection of the forest plot demonstrates that, while other trials included indicate significantly increased NRM in the donor group, both Ribera 2005 and Thomas 2004 do not indicate a significant increase in NRM in the donor group. This reflects the low NRM observed after different conditioning therapy prior to transplant in Ribera 2005; in Thomas 2004 NRM was equivalent in donor and no donor groups. Therefore, we performed sensitivity analysis, wherein these two trials were removed from the analysis. With removal of these two trials from the analysis of NRM, heterogeneity was obviated. In the overall sample, heterogeneity (Chi2 28.91, df = 8, P = 0.0003; I2 = 72%) diminished after the removal of these two trials (Chi2 4.89, df = 6, P = 0.56; I2 = 0%). In the high‐risk sample, heterogeneity (Chi2 17.64, df = 4, P = 0.001; I2 = 77%) was eliminated with the removal of these trials (Chi2 0.81, df = 2, P = 0.67; I2 = 0%).
2. Relapse
There was significant heterogeneity among trials included in the analysis of relapse. Visual inspection of the forest plot demonstrated that, while other trials demonstrated a significantly reduced risk of relapse in the donor group, Ribera 2005 did not. Conditioning therapy differed in this trial, and a greater risk of relapse was observed in the donor versus no donor group; these findings diverge from data in all other trials included in this review. In a sensitivity analysis this trial was removed, leading to a marked reduction in the observed heterogeneity. In the overall sample, heterogeneity (Chi2 40.51, df = 6, P < 0.00001; I2 = 85%) was reduced by the removal of this trial (Chi2 12.36, df = 5, P = 0.03; I2 = 60%).
Sensitivity analysis: assessment of bias
To assess the robustness of our results we performed additional sensitivity analyses according to the methodological quality domains for the outcome of overall survival (Figure 7; Figure 8).
7.
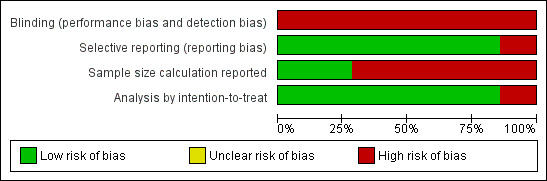
Risk of bias graph: review authors' judgements about each risk of bias item presented as percentages across all included studies.
8.
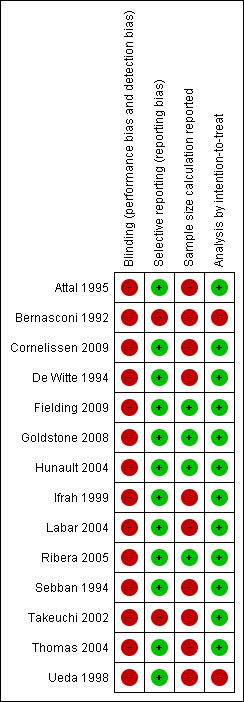
Risk of bias summary: review authors' judgements about each risk of bias item for each included study.
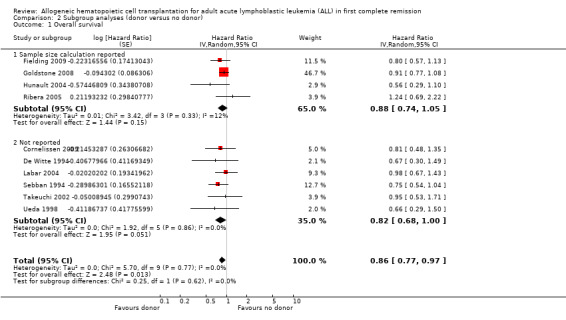
a) Sample size calculation performed: four trials reported a priori sample size calculations, while six did not. No significant heterogeneity was detected (Chi2 5.7, df = 9, P = 0.77; I2 = 0%). No significant subgroup differences were detected (Chi2 0.36, df = 1, P = 0.55; I2 = 0%).
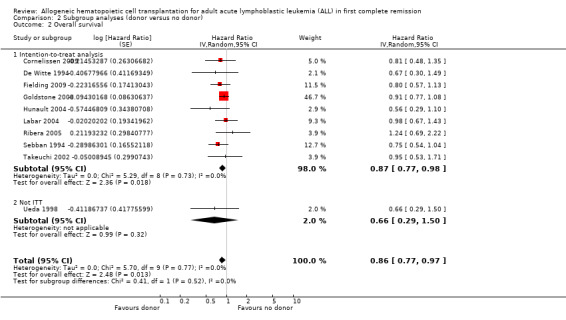
b) Intention‐to‐treat analysis: Of those trials with data extractable for overall survival, nine trials reported results according to intention‐to‐treat, while one did not. No significant heterogeneity was detected (Chi2 5.7, df = 9, P = 0.77; I2 = 0%). No significant subgroup differences were detected (Chi2 0.41, df = 1, P = 0.52; I2 = 0%).
Assessment of publication bias
We performed a funnel plot analysis to assess for the risk of publication bias in these results. As demonstrated in this figure, there is no asymmetry, which suggests that publication bias is unlikely to explain the results reported here (Figure 9).
9.
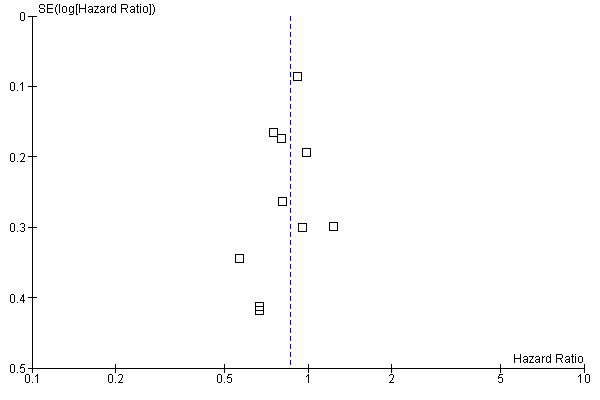
Funnel plot of comparison: 1 Donor versus no donor, outcome: 1.1 Overall survival (overall sample).
Discussion
Summary of main results
We have performed a systematic review and meta‐analysis with the aim of synthesizing the totality of evidence regarding post‐remission therapy for adult acute lymphoblastic leukemia (ALL), with a specific comparison of outcomes for those with an HLA (human leukocyte antigen) matched sibling (donor group) versus those without (no donor group). This form of genetic randomization has been utilized in randomized controlled trials of post‐remission therapy for ALL as a means of reducing selection bias. This systematic review of 14 trials enrolling a total of 3157 patients represents the largest meta‐analysis on the subject to date, and demonstrates the superiority of the donor versus no donor group. These conclusions address earlier uncertainty regarding the optimal post‐remission therapy in adult ALL and provide evidence to support treatment guidelines.
The primary endpoint of our analysis was overall survival. There was a significant improvement in overall survival in the donor versus no donor group, and no significant heterogeneity was observed in these analyses. Importantly, while this conclusion held true in the overall sample, we did not detect significant improvement in overall survival among subgroups of standard and high‐risk ALL. In the analysis of disease‐free survival (DFS), there again was a significant advantage observed in the donor group. There was a significant advantage in DFS for the donor group for the overall sample and the standard‐risk group; this benefit did not reach statistical significance in the high‐risk group. These results support the superiority of the donor versus no donor group in DFS. In the analysis of relapse, significant reduction in the risk of relapse is observed in the donor group versus the no donor group, both for the overall sample, as well as for high‐risk and standard‐risk ALL. Significant heterogeneity was observed in both the overall analysis, as well as in the high‐risk ALL analysis. This heterogeneity appears to be driven by the discordant results from Ribera 2005, where the risk of relapse is greater in the donor group. Visual inspection of the forest plot demonstrates this, and removal of these results from the analysis results in a decrease in the calculated heterogeneity by Chi2 and I2 methods. Finally, in the analysis of non‐relapse mortality, the following is observed: there is a significant increase in risk of non‐relapse mortality in the overall results, as well as in the standard‐risk group for the donor group. The magnitude of increased risk of non‐relapse mortality in the high‐risk group is smaller than the overall sample and the standard‐risk group, and does not reach statistical significance. In the case of both the overall results and the high‐risk patients, there is significant heterogeneity detected, again largely driven by data from Ribera 2005. Again, the direction of effect is reversed in this trial, as there is a greater risk for non‐relapse mortality in the no donor group.
Several important characteristics of the trial reported by Ribera 2005 may explain these discordant results, which largely accounted for the heterogeneity observed in the above analyses of relapse and non‐relapse mortality. In this trial, 182 exclusively high‐risk ALL patients were randomized according to matched sibling donor availability to allogeneic hematopoietic cell transplantation (HCT) in the donor group versus either autologous HCT or consolidation chemotherapy in the no donor group. Induction chemotherapy consisted of a multi‐agent regimen comparable to other included trials, and 82% achieved complete remission (CR), indicating the effectiveness of this induction regimen. The median time from CR to allogeneic HCT was not available. Those in the donor arm were assigned to allogeneic HCT and moderate (68%) compliance to this treatment was observed. Importantly, of these patients 64% received total body irradiation (TBI) containing conditioning therapy (cyclophosphamide 60 mg/kg x 2 d, 12 Gy TBI), and the remaining 36% were treated with busulfan containing conditioning; the five‐year relapse rate in those in the TBI group was 39% (95% CI 25% to 53%), and rather 60% (95% CI 42% to 78%) in the busulfan group, P = non‐significant. In contrast, all other trials represented in this meta‐analysis utilized TBI‐containing conditioning therapy, with the only other exception of Ifrah 1999, where one of 16 total treated with allogeneic HCT did not receive a TBI‐containing regimen. This difference in conditioning regimen in Ribera 2005 may in part explain the increased risk of relapse in the donor versus no donor group in this trial of high‐risk patients. Similarly, non‐relapse mortality was decreased in the donor versus no donor group in this trial, which is discordant with the data from the other trials included in this analysis. The non‐relapse mortality reported here of 12% in the donor group is much less than that expected after TBI‐based myeloablative conditioning with allogeneic HCT for ALL, and is inconsistent with results from the other trials in this meta‐analysis; non‐relapse mortality otherwise ranges from 23% to 36%. Conversely, the non‐relapse mortality observed in the no donor group of Ribera 2005 is greater than expected at 13% toxic deaths attributed to consolidation chemotherapy or autologous HCT.
Additionally, while other trials ‐ excepting Ribera 2005 as described above ‐ demonstrated increased risk for non‐relapse mortality in the donor group, non‐relapse mortality was actually equivalent between the donor and no donor groups in Thomas 2004. In this trial, 259 exclusively high‐risk patients were randomized based on matched sibling donor availability to either allogeneic HCT in the donor group versus autologous HCT after cyclophosphamide/total body irradiation conditioning (same regimen employed for conditioning before both allogeneic and autologous HCT; included also etoposide 50 mg/kg on day one for those with Ph‐positive ALL). Induction therapy was comparable to that utilized in other trials included here and 72% achieved CR. Median time from achievement of CR to allogeneic HCT was 2.3 months. There was a high level of compliance to assigned therapy in both arms, with 96% of those in the donor arm receiving allogeneic HCT, and 56% in the no donor arm receiving autologous HCT. In contrast to the increase in non‐relapse mortality (NRM) seen in the donor group in other studies, by five years NRM was actually identical at 18% in both the donor and no donor arms in Thomas 2004. This NRM is certainly lower than that reported in the donor arm of other studies included here, ranging from 23% to 36%. Additionally, the NRM realized in the no donor arm in this trial is greater than what is expected with either consolidation chemotherapy or autologous HCT. While the underlying reasons for this discrepancy are not evident, these discordant findings contribute to the heterogeneity observed in the analysis of non‐relapse mortality.
We have extensively examined domains of methodological quality in these trials to assess the impact of variation in these domains on the observed outcome. While we aimed to study blinding as a domain of methodological quality, we could not perform these analyses as none of the included studies provided adequate information on blinding of subjects, study personnel, outcome assessors or data analysts. Therefore, it was not possible to determine the impact of blinding in the interpretation of outcomes. Generation of allocation sequence and allocation concealment are not applicable as these trials have utilized treatment assignment according to the availability of a matched sibling donor. The number of testing centers was also considered, but not possible as all were uniformly conducted as multicenter trials. Also, there were no differences in sponsorship, and this was therefore not considered a quality domain. We have, however, assessed sample size calculation, and analysis by intention‐to‐treat (ITT) as quality domains. The pooled results from trials reporting sample size calculation showed no difference for the outcome of survival (donor versus no donor). However, pooled results from trials not reporting sample size calculations favored the donor group. However, it is important to note that these findings may be coincidental as analysis according to the reporting of ITT analysis did not discern any significant subgroup differences or heterogeneity. Another important issue to consider is the selective reporting of outcomes in this cohort of studies. While the majority of the studies reported balanced data on benefits and risks associated with donor versus no donor groups; two did not report data on a minimum of both overall survival and non‐relapse mortality. Informed decision‐making by patients and physicians requires balanced information in benefits and harms associated with each treatment. Future trials should avoid this selective reporting of outcomes.
Furthermore, one must consider the relative strengths and weaknesses of donor versus no donor analyses based on genetic, or 'Mendelian', randomization. This approach has been utilized for many trials investigating the competing therapeutic options of matched sibling allogeneic hematopoietic cell transplantation (HCT) versus autologous transplantation or chemotherapy. In distinction to true randomized controlled trials, these analyses utilize an alternative approach based on whether a potential transplantation candidate has a matched sibling donor or not. When investigators then analyze results in an intention‐to‐treat fashion based on donor or no donor group membership (rather than treatment actually received), this method may provide an unbiased assessment of the efficacy of allogeneic transplantation. We acknowledge a number of potential threats to the integrity of this approach, as reviewed by Wheatley 2004. First, failure to adhere strictly to analysis according to intention‐to‐treat can introduce bias into the analysis. Conversely, it is understood that actual compliance with the intended therapy (i.e. matched sibling allogeneic transplantation for those in the donor group) is often poor, and that the intention‐to‐treat analysis may lead to an underestimation of the actual benefit and harm associated with the intended therapy. Another particular concern is the completeness and accuracy of sibling HLA typing; as this information (i.e. number of siblings available, number approached and successfully typed, actual results of HLA typing, duration of time elapsed for identification and typing of available siblings) is not reported in any of the included studies in this systematic review; we are not able to assess further the impact of adequacy of typing on our conclusions. Also, there is inadequate information reported on how patients with no siblings available were assigned. As reviewed by Wheatley 2004, differential time required to identify a suitable donor may introduce significant bias, but the absence of detailed information on HLA typing process in the published data makes appropriate analysis (e.g. Mantel‐Byar analysis) not possible. Acknowledging these challenges in the conduct and interpretation of donor versus no donor analyses, the major benefit in this approach is avoidance of major selection biases at work in an analysis according to treatment received in transplantation studies.
These results in total demonstrate the superior outcomes in those with a matched sibling donor versus those without in the setting of adult ALL in first complete remission, and thereby support matched sibling donor allogeneic hematopoietic cell transplantation as the optimal post‐remission therapy. This systematic review and meta‐analysis provides the most robust and complete data on this concern to date by synthesizing the current totality of evidence.
Overall completeness and applicability of evidence
The conclusions reached in this analysis have direct application to clinical practice for adult ALL in first complete remission, demonstrating the superiority of donor versus no‐donor status in intention‐to‐treat analysis.
Quality of the evidence
We assessed the quality of the included trials according to the previously described quality domains, and these are represented in Figure 10 and Figure 11. While the majority of included trials were free of selective reporting and reported analyses according to the principle of intention‐to‐treat, the minority of studies explicitly described sample size calculation in the published work.
Potential biases in the review process
We did not find any methodological issues in the preparation of the review which could put it at risk for bias.
Agreements and disagreements with other studies or reviews
This systematic review and meta‐analysis provides a synthesis of available clinical trial evidence on the topic of interest. The overall conclusion is in keeping with a prior meta‐analysis performed by Yanada 2006. We have found a comparable benefit in overall survival. However, these investigators found a more pronounced advantage in those with high‐risk disease as compared to standard‐risk disease, which contradicts our findings. Our review also reports on relapse and non‐relapse mortality. Additionally, it includes relevant primary studies which were not included in the analysis performed by Yanada 2006. In these ways, our analysis provides a more complete synthesis of the current literature. Furthermore, our analysis reaches similar conclusions to those reported by Ram 2010. There are some differences in reported outcomes, as these investigators focused on all‐cause mortality as the primary endpoint. Also, analyses were performed (and trials specifically included) to address the comparison of autologous HCT versus chemotherapy, while our analysis only examined outcome according to 'donor' versus 'no donor' status. Similar to our findings, these investigators have demonstrated greater benefit for those with standard‐risk versus high‐risk ALL.
Authors' conclusions
Implications for practice.
The results of this systematic review and meta‐analysis support matched sibling donor allogeneic hematopoietic cell transplantation as the optimal post‐remission therapy in ALL patients aged 15 years or over. This therapy offers superior overall survival and disease‐free survival, and significantly reduces the risk of disease relapse, but does impose an increased risk of non‐relapse mortality. These data importantly are based on adult ALL treated with largely TBI‐based myeloablative conditioning and sibling donor transplantation and, therefore, cannot be generalized to pediatric ALL, alternate donors including HLA mismatched or unrelated donors, or reduced toxicity or non‐myeloablative conditioning regimens. Furthermore, this review is a comprehensive synthesis of literature in which investigators have not employed pediatric induction chemotherapy programs for those now considered adolescent and young adults (AYA). Importantly, while retrospective analyses of outcomes achieved with this pediatric approach compared to adult chemotherapy regimens suggest superior outcome, definitive evidence is not yet available. Additionally, we could not examine the impact of age on outcomes in this current analysis; this will rather require an individual patient data meta‐analysis.
Implications for research.
Further work is needed to define the optimal therapeutic approach in the setting of unrelated donors, as well as reduced toxicity regimens.
Acknowledgements
We acknowledge the support of Ina Monsef and Roberta Scherer in the conduct of the EMBASE search. We also acknowledge Susan Richards for sharing unpublished data.
Appendices
Appendix 1. Appendix 1
CENTRAL search strategy
| ID | Search |
| #1 | MeSH descriptor Bone Marrow Transplantation explode all trees |
| #2 | (bone marrow NEAR/2 transplant*) or (bone marrow NEAR/2 trasplant*) or (bone marrow NEAR/2 graft*) |
| #3 | MeSH descriptor Stem Cell Transplantation explode all trees |
| #4 | (stem cell or stem‐cell) |
| #5 | "progenitor cell*" |
| #6 | MeSH descriptor Hematopoietic Stem Cell Transplantation explode all trees |
| #7 | MeSH descriptor Peripheral Blood Stem Cell Transplantation explode all trees |
| #8 | (ASCT or ABMT or PBPC or PBSCT or PSCT or BMT or SCT) |
| #9 | (#1 OR #2 OR #3 OR #4 OR #5 OR #6 OR #7 OR #8) |
| #10 | MeSH descriptor Transplantation Conditioning explode all trees |
| #11 | (myeloablat*) |
| #12 | (nonmyeloablat* or non‐myeloablat*) |
| #13 | (reduced intens*) |
| #14 | (#10 OR #11 OR #12 OR #13) |
| #15 | MeSH descriptor Transplantation, Homologous explode all trees |
| #16 | (allograft* or allo‐graft*) |
| #17 | (allotransplant* or allo‐transplant*) |
| #18 | (allotrasplant* or allo‐trasplant*) |
| #19 | (allogen* or allo‐gen*) |
| #20 | (allogen* NEAR/5 transplant*) or (allogen* NEAR/5 trasplant*) or (allo‐gen* NEAR/5 transplant*) or (allo‐gen* NEAR/5 trasplant*) |
| #21 | (homograft* or homo‐graft*) |
| #22 | (homotransplant* or homo‐transplant*) |
| #23 | (homotrasplant* or homo‐trasplant*) |
| #24 | (#15 OR #16 OR #17 OR #18 OR #19 OR #20 OR #21 OR #22 OR #23) |
| #25 | (#9 OR #14 OR #24) |
| #26 | MeSH descriptor Leukemia, Lymphoid explode all trees |
| #27 | MeSH descriptor Precursor Cell Lymphoblastic Leukemia‐Lymphoma explode all trees |
| #28 | (lymph* NEAR/3 lymphoblast*) |
| #29 | (leukem* or leukaem* or leuc*m*) |
| #30 | (lymphoblast* or lymphoid* or lymphocyt* or lymphat* or linfoc*tic* or linf*id* or linfoblastic*) |
| #31 | (acut* or akut* or aguda* or aigu*) |
| #32 | (#29 AND #30 AND #31) |
| #33 | (philadelphia NEAR/3 positiv*) |
| #34 | (#26 OR #27 OR #28 OR #32 OR #33) |
| #35 | (#25 AND #34) |
Appendix 2. Appendix 2
MEDLINE search strategy
| # | Searches |
| 1 | BONE MARROW TRANSPLANTATION/ |
| 2 | (bone marrow adj2 (transplant$ or graft$ or trasplant$)).tw,kf,ot. |
| 3 | STEM CELL TRANSPLANTATION/ |
| 4 | (stem cell or stem‐cell).tw,kf,ot. |
| 5 | "progenitor cell$".tw,kf,ot. |
| 6 | HEMATOPOIETIC STEM CELL TRANSPLANTATION/ |
| 7 | PERIPHERAL BLOOD STEM CELL TRANSPLANTATION/ |
| 8 | (ASCT or ABMT or PBPC or PBSCT or PSCT or BMT or SCT).tw,kf,ot. |
| 9 | or/1‐8 |
| 10 | TRANSPLANTATION CONDITIONING/ |
| 11 | myeloablat$.tw,kf,ot. |
| 12 | (nonmyeloablat$ or non‐myeloablat$).tw,kf,ot. |
| 13 | reduced intens$.tw,kf,ot. |
| 14 | or/10‐13 |
| 15 | exp TRANSPLANTATION, HOMOLOGOUS/ |
| 16 | (allograft$ or allo‐graft$).tw,kf,ot. |
| 17 | (allotransplant$ or allo‐transplant$).tw,kf,ot. |
| 18 | (allotrasplant$ or allo‐trasplant$).tw,kf,ot. |
| 19 | (allogen$ or allo‐gen$).tw,kf,ot. |
| 20 | ((allogen$ or allo‐gen$) adj5 (transplant$ or trasplant$)).tw,kf,ot. |
| 21 | (homograft$ or homo‐graft$).tw,kf,ot. |
| 22 | (homotransplant$ or homo‐transplant$).tw,kf,ot. |
| 23 | (homotrasplant$ or homo‐trasplant$).tw,kf,ot. |
| 24 | or/15‐23 |
| 25 | 9 or 14 or 24 |
| 26 | exp LEUKEMIA, LYMPHOID/ |
| 27 | exp PRECURSOR CELL LYMPHOBLASTIC LEUKEMIA‐LYMPHOMA/ |
| 28 | (lymph$ adj3 lymphoblast$).tw,kf,ot. |
| 29 | (leuk?em$ or leuc?m$).tw,kf,ot. |
| 30 | (lymphoblast$ or lymphoid$ or lymphocyt$ or lymphat$ or linfoc?tic$ or linf?id$ or linfoblastic$).tw,kf,ot. |
| 31 | (acut$ or akut$ or aguda$ or aigu$).tw,kf,ot. |
| 32 | 29 and 30 and 31 |
| 33 | (philadelphia adj3 positiv$).tw,kf,ot. |
| 34 | or/26‐28 |
| 35 | or/32‐34 |
| 36 | 25 and 35 |
| 37 | randomized controlled trial.pt. |
| 38 | controlled clinical trial.pt. |
| 39 | randomized.ab. |
| 40 | placebo.ab. |
| 41 | drug therapy.fs. |
| 42 | randomly.ab. |
| 43 | trial.ab. |
| 44 | groups.ab. |
| 45 | or/37‐44 |
| 46 | humans.sh. |
| 47 | 45 and 46 |
| 48 | 36 and 47 |
Appendix 3. Appendix 3
EMBASE search strategy
| # | Searches |
| 1 | ‘BONE MARROW TRANSPLANTATION’:de |
| 2 | (‘bone marrow’ NEAR/2 (‘transplant*’ OR ‘graft*’ OR ‘trasplant*’)):ab,ti,tt |
| 3 | ‘STEM CELL TRANSPLANTATION’:de |
| 4 | (‘stem cell’ OR ‘stem‐cell’):ab,ti,tt |
| 5 | ‘progenitor’ NEXT/1 ‘cell*’‘:ab,ti,tt |
| 6 | ‘HEMATOPOIETIC STEM CELL TRANSPLANTATION’:de |
| 7 | ‘PERIPHERAL BLOOD STEM CELL TRANSPLANTATION’:de |
| 8 | (‘ASCT’ OR ‘ABMT’ OR ‘PBPC’ OR ‘PBSCT’ OR ‘PSCT’ OR ‘BMT’ OR ‘SCT’) :ab,ti,tt |
| 9 | #1 OR #2 OR #3 OR #4 OR #5 OR #6 OR #7 OR #8 |
| 10 | ‘MYELOABLATIVE CONDITIONING’:de OR ‘NONMYELOABLATIVE CONDITIONING’:de |
| 11 | ‘myeloablat*’:ab,ti,tt |
| 12 | (‘nonmyeloablat*’ OR ‘non‐myeloablat*’):ab,ti,tt |
| 13 | ‘reduced intens*’:ab,ti,tt |
| 14 | #10 OR #11 OR #12 OR #13 |
| 15 | ‘ALLOTRANSPLANTATION’/exp/de |
| 16 | (‘allograft*’ OR ‘allo‐graft*’):ab,ti,tt |
| 17 | (‘allotransplant*’ OR ‘allo‐transplant*’):ab,ti,tt |
| 18 | (‘allotrasplant*’ OR ‘allo‐trasplant*’):ab,ti,tt |
| 19 | (‘allogen*’ OR ‘allo‐gen*’):ab,ti,tt |
| 20 | ((‘allogen*’ OR ‘allo‐gen*’) NEAR/5 (‘transplant*’ OR ‘trasplant*’)):ab,ti,tt |
| 21 | (‘homograft*’ OR ‘homo‐graft*’):ab,ti,tt |
| 22 | (‘homotransplant*’ OR ‘homo‐transplant*’):ab,ti,tt |
| 23 | (‘homotrasplant*’ OR ‘homo‐trasplant*’):ab,ti,tt |
| 24 | #15 OR #16 OR #17 OR #18 OR #19 OR #20 OR #21 OR #22 OR #23 |
| 25 | #9 OR #14 OR #24 |
| 26 | ‘LYMPHATIC LEUKEMIA’:de/exp |
| 27 | ‘ACUTE LYMPHOBLASTIC LEUK EMIA’:de/exp |
| 28 | (‘lymph*’ NEAR/3 ‘lymphoblast*’):ab,ti,tt |
| 29 | (‘leukem*’ OR ‘leukaem*’ OR ‘leuc?m*’):ab,ti,tt |
| 30 | (‘lymphoblast*’ OR ‘lymphoid*’ OR ‘lymphocyt*’ OR ‘lymphat*’ OR ‘linfoc?tic*’ OR ‘linf?id*’ OR ‘linfoblastic*’):ab,ti,tt |
| 31 | (‘acut*’ OR ‘akut*’ OR ‘aguda*’ OR ‘aigu*’):ab,ti,tt |
| 32 | #29 AND #30 AND #31 |
| 33 | (‘Philadelphia’ NEAR/3 ‘positiv*’). |
| 34 | #26 OR #27 OR #28 |
| 35 | #32 OR #33 OR #34 |
| 36 | #25 AND #35 |
| 37 | (‘random*’ OR ‘placebo*’):ab,ti |
| 38 | ((‘single*’ OR ‘double*’ OR ‘triple*’ OR ‘treble*’) AND (‘blind*’ OR ‘mask*’)):ab,ti |
| 39 | ‘Controlled clinical trial*’:ab,ti |
| 40 | ‘RETRACTED ARTICLE’:de |
| 41 | #37 OR #38 OR #39 OR #40 |
| 42 | (‘animal*’ NOT ‘human*’):de |
| 43 | #41 NOT #42 |
| 44 | #36 AND #43 |
| 45 | #44 AND [embase]/lim NOT [medline]/lim. |
Data and analyses
Comparison 1. Donor versus no donor.
| Outcome or subgroup title | No. of studies | No. of participants | Statistical method | Effect size |
|---|---|---|---|---|
| 1 Overall survival (overall sample) | 10 | Hazard Ratio (Random, 95% CI) | 0.86 [0.77, 0.97] | |
| 2 Disease‐free survival (overall sample) | 9 | Hazard Ratio (Random, 95% CI) | 0.82 [0.72, 0.94] | |
| 3 Non‐relapse mortality (overall sample) | 9 | 2524 | Risk Ratio (M‐H, Random, 95% CI) | 2.80 [1.66, 4.73] |
| 4 Relapse (overall sample) | 7 | 2217 | Risk Ratio (M‐H, Random, 95% CI) | 0.53 [0.37, 0.76] |
1.1. Analysis.
Comparison 1 Donor versus no donor, Outcome 1 Overall survival (overall sample).
1.2. Analysis.
Comparison 1 Donor versus no donor, Outcome 2 Disease‐free survival (overall sample).
1.3. Analysis.
Comparison 1 Donor versus no donor, Outcome 3 Non‐relapse mortality (overall sample).
1.4. Analysis.
Comparison 1 Donor versus no donor, Outcome 4 Relapse (overall sample).
Comparison 2. Subgroup analyses (donor versus no donor).
| Outcome or subgroup title | No. of studies | No. of participants | Statistical method | Effect size |
|---|---|---|---|---|
| 1 Overall survival | 10 | Hazard Ratio (Random, 95% CI) | 0.86 [0.77, 0.97] | |
| 1.1 Sample size calculation reported | 4 | Hazard Ratio (Random, 95% CI) | 0.88 [0.74, 1.05] | |
| 1.2 Not reported | 6 | Hazard Ratio (Random, 95% CI) | 0.82 [0.68, 1.00] | |
| 2 Overall survival | 10 | Hazard Ratio (Random, 95% CI) | 0.86 [0.77, 0.97] | |
| 2.1 Intention‐to‐treat analysis | 9 | Hazard Ratio (Random, 95% CI) | 0.87 [0.77, 0.98] | |
| 2.2 Not ITT | 1 | Hazard Ratio (Random, 95% CI) | 0.66 [0.29, 1.50] | |
| 3 Overall survival | 6 | Hazard Ratio (Random, 95% CI) | 0.83 [0.68, 1.01] | |
| 3.1 High‐risk ALL | 6 | Hazard Ratio (Random, 95% CI) | 0.88 [0.68, 1.13] | |
| 3.2 Standard‐risk ALL | 2 | Hazard Ratio (Random, 95% CI) | 0.69 [0.45, 1.06] | |
| 4 Disease‐free survival | 5 | Hazard Ratio (Random, 95% CI) | 0.72 [0.56, 0.94] | |
| 4.1 High‐risk ALL | 5 | Hazard Ratio (Random, 95% CI) | 0.77 [0.51, 1.15] | |
| 4.2 Standard‐risk ALL | 3 | Hazard Ratio (Random, 95% CI) | 0.66 [0.43, 1.00] | |
| 5 Relapse | 5 | 1909 | Risk Ratio (M‐H, Random, 95% CI) | 0.54 [0.37, 0.78] |
| 5.1 High‐risk ALL | 5 | 1197 | Risk Ratio (M‐H, Random, 95% CI) | 0.63 [0.40, 0.98] |
| 5.2 Standard‐risk ALL | 2 | 712 | Risk Ratio (M‐H, Random, 95% CI) | 0.39 [0.29, 0.53] |
| 6 Non‐relapse mortality | 5 | 1909 | Risk Ratio (M‐H, Random, 95% CI) | 2.33 [1.38, 3.94] |
| 6.1 High‐risk ALL | 5 | 1197 | Risk Ratio (M‐H, Random, 95% CI) | 1.95 [0.99, 3.87] |
| 6.2 Standard‐risk ALL | 2 | 712 | Risk Ratio (M‐H, Random, 95% CI) | 3.36 [2.05, 5.51] |
2.1. Analysis.
Comparison 2 Subgroup analyses (donor versus no donor), Outcome 1 Overall survival.
2.2. Analysis.
Comparison 2 Subgroup analyses (donor versus no donor), Outcome 2 Overall survival.
2.3. Analysis.
Comparison 2 Subgroup analyses (donor versus no donor), Outcome 3 Overall survival.
2.4. Analysis.
Comparison 2 Subgroup analyses (donor versus no donor), Outcome 4 Disease‐free survival.
2.5. Analysis.
Comparison 2 Subgroup analyses (donor versus no donor), Outcome 5 Relapse.
2.6. Analysis.
Comparison 2 Subgroup analyses (donor versus no donor), Outcome 6 Non‐relapse mortality.
Characteristics of studies
Characteristics of included studies [ordered by study ID]
Attal 1995.
| Methods | Randomized controlled trial | |
| Participants | Donor: 43 No donor: 77 |
|
| Interventions | Intervention: allogeneic hematopoietic cell transplant Control: autologous HCT |
|
| Outcomes | DFS | |
| Notes | ||
| Risk of bias | ||
| Bias | Authors' judgement | Support for judgement |
| Blinding (performance bias and detection bias) All outcomes | High risk | Not adequately reported |
| Selective reporting (reporting bias) | Low risk | Reported on both benefits and harms |
| Sample size calculation reported | High risk | Not adequately reported |
| Analysis by intention‐to‐treat | Low risk | Performed analysis in keeping with principle of intention‐to‐treat |
Bernasconi 1992.
| Methods | Randomized controlled trial | |
| Participants | Donor: 16 No donor: 26 |
|
| Interventions | Intervention: allogeneic hematopoietic cell transplant Control: autologous HCT, chemotherapy |
|
| Outcomes | Remission duration, DFS | |
| Notes | ||
| Risk of bias | ||
| Bias | Authors' judgement | Support for judgement |
| Blinding (performance bias and detection bias) All outcomes | High risk | Not adequately reported |
| Selective reporting (reporting bias) | High risk | Not adequately reported |
| Sample size calculation reported | High risk | Not adequately reported |
| Analysis by intention‐to‐treat | High risk | Only reported per treatment received |
Cornelissen 2009.
| Methods | Randomized controlled trial | |
| Participants | Donor: 96 No donor: 161 |
|
| Interventions | Intervention: allogeneic hematopoietic cell transplant Control: autologous HCT |
|
| Outcomes | OS, DFS, NRM, REL | |
| Notes | ||
| Risk of bias | ||
| Bias | Authors' judgement | Support for judgement |
| Blinding (performance bias and detection bias) All outcomes | High risk | Not adequately reported |
| Selective reporting (reporting bias) | Low risk | Reported on both benefits and harms |
| Sample size calculation reported | High risk | Not adequately reported |
| Analysis by intention‐to‐treat | Low risk | Performed analysis in keeping with principle of intention‐to‐treat |
De Witte 1994.
| Methods | Randomized controlled trial | |
| Participants | Donor: 30 No donor: 33 |
|
| Interventions | Intervention: allogeneic hematopoietic cell transplant Control: autologous HCT or consolidation chemotherapy |
|
| Outcomes | OS, DFS | |
| Notes | ||
| Risk of bias | ||
| Bias | Authors' judgement | Support for judgement |
| Blinding (performance bias and detection bias) All outcomes | High risk | Not adequately reported |
| Selective reporting (reporting bias) | Low risk | Reported on both benefits and harms |
| Sample size calculation reported | High risk | Not adequately reported |
| Analysis by intention‐to‐treat | Low risk | Performed analysis in keeping with principle of intention‐to‐treat |
Fielding 2009.
| Methods | Randomized controlled trial | |
| Participants | Donor: 81 No donor: 77 |
|
| Interventions | Intervention: allogeneic hematopoietic cell transplant Control: autologous HCT or consolidation chemotherapy |
|
| Outcomes | OS | |
| Notes | ||
| Risk of bias | ||
| Bias | Authors' judgement | Support for judgement |
| Blinding (performance bias and detection bias) All outcomes | High risk | Not adequately reported |
| Selective reporting (reporting bias) | Low risk | Reported data on both benefits and harms |
| Sample size calculation reported | Low risk | Adequately reported |
| Analysis by intention‐to‐treat | Low risk | Performed analysis in keeping with principle of intention‐to‐treat |
Goldstone 2008.
| Methods | Randomized controlled trial | |
| Participants | Donor: 443 No donor: 588 |
|
| Interventions | Intervention: allogeneic hematopoietic cell transplant Control: autologous HCT or consolidation chemotherapy |
|
| Outcomes | OS, relapse, non‐relapse mortality | |
| Notes | ||
| Risk of bias | ||
| Bias | Authors' judgement | Support for judgement |
| Blinding (performance bias and detection bias) All outcomes | High risk | Not adequately reported |
| Selective reporting (reporting bias) | Low risk | Adequately reported |
| Sample size calculation reported | Low risk | Adequately reported |
| Analysis by intention‐to‐treat | Low risk | Performed analysis in keeping with principle of intention‐to‐treat |
Hunault 2004.
| Methods | Randomized controlled trial | |
| Participants | Donor: 41 No donor: 106 |
|
| Interventions | Intervention: allogeneic hematopoietic cell transplant Control: autologous HCT |
|
| Outcomes | OS, relapse | |
| Notes | ||
| Risk of bias | ||
| Bias | Authors' judgement | Support for judgement |
| Blinding (performance bias and detection bias) All outcomes | High risk | Not adequately reported |
| Selective reporting (reporting bias) | Low risk | Adequately reported |
| Sample size calculation reported | Low risk | Adequately reported |
| Analysis by intention‐to‐treat | Low risk | Performed analysis in keeping with principle of intention‐to‐treat |
Ifrah 1999.
| Methods | Randomized controlled trial | |
| Participants | Donor: 18 No donor: 32 |
|
| Interventions | Intervention: allogeneic hematopoietic cell transplant Control: autologous HCT |
|
| Outcomes | OS, DFS, non‐relapse mortality | |
| Notes | ||
| Risk of bias | ||
| Bias | Authors' judgement | Support for judgement |
| Blinding (performance bias and detection bias) All outcomes | High risk | Not adequately reported |
| Selective reporting (reporting bias) | Low risk | Adequately reported |
| Sample size calculation reported | High risk | Not adequately reported |
| Analysis by intention‐to‐treat | Low risk | Performed analysis in keeping with principle of intention‐to‐treat |
Labar 2004.
| Methods | Randomized controlled trial | |
| Participants | Donor: 68 No donor: 116 |
|
| Interventions | Intervention: allogeneic hematopoietic cell transplant Control: autologous HCT |
|
| Outcomes | OS, DFS, relapse, non‐relapse mortality | |
| Notes | ||
| Risk of bias | ||
| Bias | Authors' judgement | Support for judgement |
| Blinding (performance bias and detection bias) All outcomes | High risk | Not adequately reported |
| Selective reporting (reporting bias) | Low risk | Adequately reported |
| Sample size calculation reported | High risk | Not adequately reported |
| Analysis by intention‐to‐treat | Low risk | Performed analysis in keeping with principle of intention‐to‐treat |
Ribera 2005.
| Methods | Randomized controlled trial | |
| Participants | Donor: 84 No donor: 98 |
|
| Interventions | Intervention: allogeneic hematopoietic cell transplant Control: autologous HCT or consolidation chemotherapy |
|
| Outcomes | OS, DFS, relapse, non‐relapse mortality | |
| Notes | ||
| Risk of bias | ||
| Bias | Authors' judgement | Support for judgement |
| Blinding (performance bias and detection bias) All outcomes | High risk | Not adequately reported |
| Selective reporting (reporting bias) | Low risk | Adequately reported |
| Sample size calculation reported | Low risk | Adequately reported |
| Analysis by intention‐to‐treat | Low risk | Performed analysis in keeping with principle of intention‐to‐treat |
Sebban 1994.
| Methods | Randomized controlled trial | |
| Participants | Donor: 116 No donor: 141 |
|
| Interventions | Intervention: allogeneic hematopoietic cell transplant Control: autologous HCT or consolidation chemotherapy |
|
| Outcomes | OS, DFS, non‐relapse mortality | |
| Notes | ||
| Risk of bias | ||
| Bias | Authors' judgement | Support for judgement |
| Blinding (performance bias and detection bias) All outcomes | High risk | Not adequately reported |
| Selective reporting (reporting bias) | Low risk | Adequately reported |
| Sample size calculation reported | High risk | Not adequately reported |
| Analysis by intention‐to‐treat | Low risk | Performed analysis in keeping with principle of intention‐to‐treat |
Takeuchi 2002.
| Methods | Randomized controlled trial | |
| Participants | Donor: 34 No donor: 108 |
|
| Interventions | Intervention: allogeneic hematopoietic cell transplant Control: autologous HCT or consolidation chemotherapy |
|
| Outcomes | OS | |
| Notes | ||
| Risk of bias | ||
| Bias | Authors' judgement | Support for judgement |
| Blinding (performance bias and detection bias) All outcomes | High risk | Not adequately reported |
| Selective reporting (reporting bias) | High risk | Not adequately reported |
| Sample size calculation reported | High risk | Not adequately reported |
| Analysis by intention‐to‐treat | Low risk | Performed analysis in keeping with principle of intention‐to‐treat |
Thomas 2004.
| Methods | Randomized controlled trial | |
| Participants | Donor: 100 No donor: 159 |
|
| Interventions | Intervention: allogeneic hematopoietic cell transplant Control: autologous HCT |
|
| Outcomes | DFS, relapse, non‐relapse mortality | |
| Notes | ||
| Risk of bias | ||
| Bias | Authors' judgement | Support for judgement |
| Blinding (performance bias and detection bias) All outcomes | High risk | Not adequately reported |
| Selective reporting (reporting bias) | Low risk | Adequately reported |
| Sample size calculation reported | High risk | Not adequately reported |
| Analysis by intention‐to‐treat | Low risk | Performed analysis in keeping with principle of intention‐to‐treat |
Ueda 1998.
| Methods | Randomized controlled trial | |
| Participants | Donor: 71 No donor: 109 |
|
| Interventions | Intervention: allogeneic hematopoietic cell transplant Control: consolidation chemotherapy |
|
| Outcomes | OS | |
| Notes | Not ITT analysis; only reported outcomes per treatment received | |
| Risk of bias | ||
| Bias | Authors' judgement | Support for judgement |
| Blinding (performance bias and detection bias) All outcomes | High risk | Not adequately reported |
| Selective reporting (reporting bias) | Low risk | Adequately reported |
| Sample size calculation reported | High risk | Not adequately reported |
| Analysis by intention‐to‐treat | High risk | Did not perform analysis in keeping with principle of intention‐to‐treat |
DFS: disease‐free survival; HCT: hematopoietic cell transplantation; ITT: intention‐to‐treat; NRM: non‐relapse mortality; OS: overall survival; REL: relapse.
Differences between protocol and review
Quality of life was described, but not possible to analyze due to lack of reporting in the primary literature examined.
Analysis of adverse events was considered, but not reported in sufficient detail in primary references. However, we provide a comprehensive analysis of both competing positive and negative transplantation outcomes to this end, including survival, disease‐free survival, non‐relapse mortality, and relapse.
Subgroup analyses remaining in the review stage were those that were possible based on the available data; others previously listed in the protocol stage were not possible according to the primary literature examined. Specifically, the subgroup analyses according to patient age, compliance with the assigned therapy, and treatment received in the non‐donor arm were not possible, as these would require individual patient data, rather than summary data (for example median age of study participants) from the included trials.
Sensitivity analyses remaining in the review stage were those that were possible based on the available data; others previously listed in the protocol stage were not possible according to the primary literature examined. Specifically, the proposed examination of methodological quality domains including blinding, generation of allocation sequence and allocation concealment were not possible, as these data were not adequately reported in any of the included studies. Also, we planned analyses based on number of testing centers, and sponsorship, but these characteristics did not vary across the included studies, and therefore we did not perform these analyses.
Contributions of authors
Joseph Pidala: proposed and developed the concept for review, developed the protocol, conducted the literature and handsearches, reviewed all studies for inclusion or exclusion, abstracted all data, performed all analyses, and produced this manuscript.
Benjamin Djulbegovic: contributed to development of the concept and review protocol, and critically reviewed the analyses and manuscript.
Claudio Anasetti: contributed to development of the concept and review protocol, and critically reviewed the analyses and manuscript.
Mohamed Kharfan‐Dabaja: contributed to development of the concept and review protocol, and critically reviewed the analyses and manuscript.
Ambuj Kumar: contributed to development of the concept and review protocol, independently reviewed studies and abstracted data, and critically reviewed the analyses and manuscript.
Sources of support
Internal sources
-
Moffitt Cancer Center, USA.
Institutional support
External sources
No sources of support supplied
Declarations of interest
Dr. Kharfan‐Dabaja has received payment for lectures from Genzyme and Bristol Myers Squibb. He has also received consultancy fees from Vical. These financial activities are not relevant to the submitted work. All other authors report no conflict of interest.
New
References
References to studies included in this review
Attal 1995 {published data only}
- Attal M, Blaise D, Marit G, Payen C, Michallet M, Vernant JP, et al. Consolidation treatment of adult acute lymphoblastic leukemia: a prospective, randomized trial comparing allogeneic versus autologous bone marrow transplantation and testing the impact of recombinant interleukin‐2 after autologous bone marrow transplantation. BGMT Group. Blood 1995;86(4):1619‐28. [PubMed] [Google Scholar]
Bernasconi 1992 {published data only}
- Bernasconi C, Lazzarino M, Morra E, Alessandrino EP, Pagnucco G, Resegotti L, et al. Early intensification followed by allo‐BMT or auto‐BMT or a second intensification in adult ALL: a randomized multicenter study. Leukemia 1992;6:204‐8. [PubMed] [Google Scholar]
Cornelissen 2009 {published data only}
- Cornelissen JJ, Holt B, Verhoef GE, van't Veer MB, Oers MH, Schouten HC, et al. Myeloablative allogeneic versus autologous stem cell transplantation in adult patients with acute lymphoblastic leukemia in first remission: a prospective sibling donor versus no‐donor comparison. Blood 2009;113(6):1375‐82. [DOI] [PubMed] [Google Scholar]
De Witte 1994 {published data only}
- Witte T, Awwad B, Boezeman J, Schattenberg A, Muus P, Raemaekers J, et al. Role of allogenic bone marrow transplantation in adolescent or adult patients with acute lymphoblastic leukaemia or lymphoblastic lymphoma in first remission. Bone Marrow Transplant 1994;14(5):767‐74. [PubMed] [Google Scholar]
Fielding 2009 {published data only}
- Fielding AK, Rowe JM, Richards SM, Buck G, Moorman AV, Durrant IJ, et al. Prospective outcome data on 267 unselected adult patients with Philadelphia chromosome‐positive acute lymphoblastic leukemia confirms superiority of allogeneic transplantation over chemotherapy in the pre‐imatinib era: results from the International ALL Trial MRC UKALLXI /ECOG2993. Blood 2009;113(19):4489‐96. [DOI] [PMC free article] [PubMed] [Google Scholar]
Goldstone 2008 {published data only}
- Goldstone AH, Richards SM, Lazarus HM, Tallman MS, Buck G, Fielding AK, et al. In adults with standard‐risk acute lymphoblastic leukemia, the greatest benefit is achieved from a matched sibling allogeneic transplantation in first complete remission, and an autologous transplantation is less effective than conventional consolidation/maintenance chemotherapy in all patients: final results of the International ALL Trial (MRC UKALL XII/ECOG E2993). Blood 2008;111(4):1827‐33. [PUBMED: 18048644] [DOI] [PubMed] [Google Scholar]
Hunault 2004 {published data only}
- Hunault M, Harousseau JL, Delain M, Truchan‐Graczyk M, Cahn JY, Witz F, et al. Better outcome of adult acute lymphoblastic leukemia after early genoidentical allogeneic bone marrow transplantation (BMT) than after late high‐dose therapy and autologous BMT: a GOELAMS trial. Blood 2004;104(10):3028‐37. [PUBMED: 15256423] [DOI] [PubMed] [Google Scholar]
Ifrah 1999 {published data only}
- Ifrah N, Witz F, Jouet JP, François S, Lamy T, Linassier C, et al. Intensive short term therapy with granulocyte‐macrophage‐colony stimulating factor support, similar to therapy for acute myeloblastic leukemia, does not improve overall results for adults with acute lymphoblastic leukemia. GOELAMS Group. Cancer 1999;86((8)):1496‐505. [DOI] [PubMed] [Google Scholar]
Labar 2004 {published data only}
- Labar B, Suciu S, Zittoun R, Muus P, Marie JP, Fillet G, et al. Allogeneic stem cell transplantation in acute lymphoblastic leukemia and non‐Hodgkin's lymphoma for patients < or = 50 years old in first complete remission: results of the EORTC ALL‐3 trial. Haematologica 2004;89(7):809‐17. [PubMed] [Google Scholar]
Ribera 2005 {published data only}
- Ribera JM, Oriol A, Bethencourt C, Parody R, Hernandez‐Rivas JM, Moreno MJ, et al. Comparison of intensive chemotherapy, allogeneic or autologous stem cell transplantation as post‐remission treatment for adult patients with high‐risk acute lymphoblastic leukemia. Results of the PETHEMA ALL‐93 trial. Haematologica 2005;90(10):1346‐56. [PubMed] [Google Scholar]
Sebban 1994 {published data only}
- Sebban C, Lepage E, Vernant JP, Gluckman E, Attal M, Reiffers J, et al. Allogeneic bone marrow transplantation in adult acute lymphoblastic leukemia in first complete remission: a comparative study. French Group of Therapy of Adult Acute Lymphoblastic Leukemia. Journal of Clinical Oncology 1994;12(12):2580‐7. [DOI] [PubMed] [Google Scholar]
Takeuchi 2002 {published data only}
- Takeuchi J, Kyo T, Naito K, Sao H, Takahashi M, Miyawaki S, et al. Induction therapy by frequent administration of doxorubicin with four other drugs, followed by intensive consolidation and maintenance therapy for adult acute lymphoblastic leukemia: the JALSG‐ALL93 study. Leukemia 2002;16(7):1259‐66. [DOI] [PubMed] [Google Scholar]
Thomas 2004 {published data only}
- Thomas X, Boiron JM, Huguet F, Dombret H, Bradstock K, Vey N, et al. Outcome of treatment in adults with acute lymphoblastic leukemia: analysis of the LALA‐94 trial. Journal of Clinical Oncology 2004;22(20):4075‐86. [DOI] [PubMed] [Google Scholar]
Ueda 1998 {published data only}
- Ueda T, Miyawaki S, Asou N, Kuraishi Y, Hiraoka A, Kuriyama K, et al. Response‐oriented individualized induction therapy with six drugs followed by four courses of intensive consolidation, 1 year maintenance and intensification therapy: the ALL90 study of the Japan Adult Leukemia Study Group. International Journal of Hematology 1998;68(3):279‐89. [DOI] [PubMed] [Google Scholar]
Additional references
Als‐Nielsen 2004
- Als‐Nielsen B, Gluud LL, Gluud C. Methodological quality and treatment effects in randomized trials: a review of six empirical studies. 12th Cochrane Colloquium. 2004.
Annino 2002
- Annino L, Vegna ML, Camera A, Specchia G, Visani G, Fioritoni G, et al. Treatment of adult acute lymphoblastic leukemia (ALL): long‐term follow‐up of the GIMEMA ALL 0288 randomized study. Blood 2002;99:863‐71. [DOI] [PubMed] [Google Scholar]
Bassan 2001
- Bassan R, Pogliani E, Casula P, Rossi G, Fabris P, Morandi S, et al. Risk‐oriented post‐remission strategies in adult acute lymphoblastic leukemia: prospective confirmation of anthracycline activity in standard‐risk class and role of hematopoietic stem cell transplants in high‐risk groups. Hematology Journal 2001;2:117‐26. [DOI] [PubMed] [Google Scholar]
Begg 1994
- Begg CB, Mazumdar M. Operating characteristics of a rank correlation test for publication bias. Biometrics 1994;315:1088‐101. [PubMed] [Google Scholar]
Boutron 2005
- Boutron I, Estellat C, Ravaud P. A review of blinding in randomized controlled trials found results inconsistent and questionable. Journal of Clinical Epidemiology 2005;58:1220‐6. [DOI] [PubMed] [Google Scholar]
Chan 2005
- Chan AW, Altman DG. Identifying outcome reporting bias in randomised trials on PubMed: review of publications and survey of authors. BMJ 2005;330:753. [DOI] [PMC free article] [PubMed] [Google Scholar]
Deeks 2008
- Deeks JJ, Higgins JPT, Altman DG (editors). Chapter 9: Analysing data and undertaking meta‐analyses. In: Higgins JPT, Green S (editors). Cochrane Handbook for Systematic Reviews of Interventions Version 5.0.1 (updated September 2008). The Cochrane Collaboration, 2008. Available from www.cochrane‐handbook.org. John Wiley & Sons, Ltd, 2008. [Google Scholar]
DerSimonian 1986
- DerSimonian R, Laird N. Meta‐analysis in clinical trials. Controlled Clinical Trials 1986;7:177‐88. [DOI] [PubMed] [Google Scholar]
Dombret 2002a
- Dombret H, Gabert J, Boiron JM, Rigal‐Huguet F, Blaise D, Thomas X, et al. Outcome of treatment in adults with Philadelphia chromosome‐positive acute lymphoblastic leukemia: results of the prospective multicenter LALA‐94 trial. Blood 2002;100(7):2357‐66. [DOI] [PubMed] [Google Scholar]
Egger 1997
- Egger M, Davey Smith G, Schneider M, Minder C. Bias in meta‐analysis detected by a simple, graphical test. BMJ 1997;315:629‐34. [DOI] [PMC free article] [PubMed] [Google Scholar]
Hallbrook 2002
- Hallbrook H, Simonsson B, Ahlgren T, Bjorkholm M, Carneskog J, Grimfors G, et al. High‐dose cytarabine in upfront therapy for adult patients with acute lymphoblastic leukaemia. British Journal of Haematology 2002;118:748‐54. [DOI] [PubMed] [Google Scholar]
Haynes 2005
- Haynes RB, McKibbon KA, Wilczynski NL, Walter SD, Werre SR. Optimal search strategies for retrieving scientifically strong studies of treatment from MEDLINE: analytical survey. BMJ 2005;330:1179. [DOI] [PMC free article] [PubMed] [Google Scholar]
Higgins 2002
- Higgins JPT, Thompson SG. Quantifying heterogeneity in a meta‐analysis. Statistics in Medicine 2002;21:1539‐58. [DOI] [PubMed] [Google Scholar]
Higgins 2003
- Higgins JP, Thompson SG, Deeks JJ, Altman DG. Measuring inconsistency in meta‐analyses. BMJ 2003;327:557‐60. [DOI] [PMC free article] [PubMed] [Google Scholar]
Higgins 2008
- Higgins JPT, Altman DG (editors). Chapter 8: Assessing risk of bias in included studies. In: Higgins JPT, Green S (editors). Cochrane Handbook for Systematic Reviews of Interventions Version 5.0.1 (updated September 2008). The Cochrane Collaboration, 2008. Available from www.cochrane‐handbook.org. John Wiley & Sons, Ltd, 2008. [Google Scholar]
Holowiecki 2008
- Holowiecki J, Krawczyk‐Kulis M, Giebel S, Jagoda K, Stella‐Holowiecka B, Piatkowska‐Jakubas B, et al. Status of minimal residual disease after induction predicts outcome in both standard and high‐risk Ph‐negative adult acute lymphoblastic leukaemia. The Polish Adult Leukemia Group ALL 4‐2002 MRD Study. British Journal of Haematology 2008;142(2):227‐37. [DOI] [PubMed] [Google Scholar]
Jüni 2001
- Jüni P, Altman DG, Egger M. Systematic reviews in health care: assessing the quality of controlled clinical trials. BMJ 2001;323:42‐6. [DOI] [PMC free article] [PubMed] [Google Scholar]
Kantarjian 2004
- Kantarjian H, Thomas D, O'Brien S, Cortes J, Giles F, Jeha S, et al. Long‐term follow‐up results of hyperfractionated cyclophosphamide, vincristine, doxorubicin, and dexamethasone (Hyper‐CVAD), a dose‐intensive regimen, in adult acute lymphocytic leukemia. Cancer 2004;101:2788‐801. [DOI] [PubMed] [Google Scholar]
Larson 1998
- Larson RA, Dodge RK, Linker CA, Stone RM, Powell BL, Lee EJ, et al. A randomized controlled trial of filgrastim during remission induction and consolidation chemotherapy for adults with acute lymphoblastic leukemia: CALGB study 9111. Blood 1998;92:1556‐64. [PubMed] [Google Scholar]
Linker 2002
- Linker C, Damon L, Ries C, Navarro W. Intensified and shortened cyclical chemotherapy for adult acute lymphoblastic leukemia. Journal of Clinical Oncology 2002;20:2464‐71. [DOI] [PubMed] [Google Scholar]
Moher 1999
- Moher D, Cook DJ, Eastwood S, Olkin I, Rennie D, Stroup DF. Improving the quality of reports of meta‐analyses of randomised controlled trials: the QUOROM statement. Quality of Reporting of Meta‐analyses. Lancet 1999;354:1896‐900. [DOI] [PubMed] [Google Scholar]
Parmar 1998
- Parmar MK, Torri V, Stewart L. Extracting summary statistics to perform meta‐analyses of the published literature for survival endpoints. Statistics in Medicine 1998;17:2815‐34. [DOI] [PubMed] [Google Scholar]
Peters 2006
- Peters JL, Sutton AJ, Jones DR, Abrams KR, Rushton L. Comparison of two methods to detect publication bias in meta‐analysis. JAMA 2006;95:676‐80. [DOI] [PubMed] [Google Scholar]
Ram 2010
- Ram R, Gafter‐Gvili A, Vidal L, Paul M, Ben‐Bassat I, Shpilberg O, et al. Management of adult patients with acute lymphoblastic leukemia in first complete remission: systematic review and meta‐analysis. Cancer 2010;116:3447‐57. [DOI] [PubMed] [Google Scholar]
Schulz 2002
- Schulz KF, Grimes DA. Unequal group sizes in randomised trials: guarding against guessing. Lancet 2002;359:966‐70. [DOI] [PubMed] [Google Scholar]
Stanulla 2009
- Stanulla M, Schrappe M. Treatment of childhood acute lymphoblastic leukemia. Seminars in Hematology 2009;46:52‐63. [DOI] [PubMed] [Google Scholar]
Sterne 2001
- Sterne JAC, Egger M. Funnel plots for detecting bias in meta‐analysis: guidelines on choice of axis. Journal of Clinical Epidemiology 2001;54:1046‐55. [DOI] [PubMed] [Google Scholar]
Sterne 2008
- Sterne JAC, Egger M, Moher D (editors). Chapter 10: Addressing reporting biases. In: Higgins JPT, Green S (editors). Cochrane Handbook for Systematic Reviews of Intervention. Version 5.0.1 (updated September 2008). The Cochrane Collaboration, 2008. Available from www.cochrane‐handbook.org. John Wiley & Sons, Ltd, 2008. [Google Scholar]
Thiebaut 2000
- Thiebaut A, Vernant JP, Degos L, Huguet FR, Reiffers J, Sebban C, et al. Adult acute lymphocytic leukemia study testing chemotherapy and autologous and allogeneic transplantation. A follow‐up report of the French protocol LALA‐87. Hematology Oncology Clinics of North America 2000;14:1353‐66. [DOI] [PubMed] [Google Scholar]
Wheatley 2004
- Wheatley K, Gray R. Commentary: Mendelian randomization? An update on its use to evaluate allogeneic stem cell transplantation in leukaemia. International Journal of Epidemiology 2004;33:15‐7. [DOI] [PubMed] [Google Scholar]
Yanada 2006
- Yanada M, Matsuo K, Suzuki T, Naoe T. Allogeneic hematopoietic stem cell transplantation as part of post‐remission therapy improves survival for adult patients with high‐risk acute lymphoblastic leukemia: a meta‐analysis. Cancer 2006;106:2657‐63. [DOI] [PubMed] [Google Scholar]