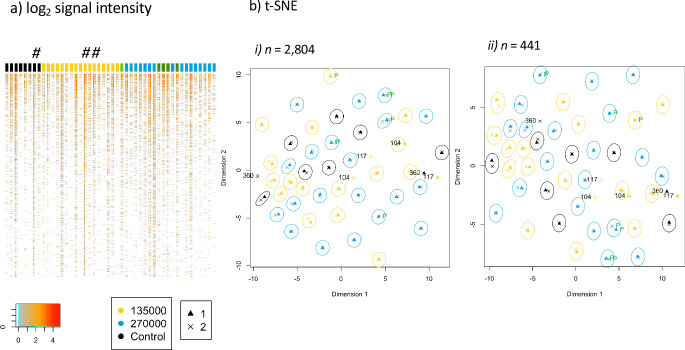
Figure 2. Antibody immune profile of Tanzanian healthy male adult volunteers is personalized.
The heatmap of the normalized signal intensities of each sample per subject is shown in (a), with the signal intensity of each protein or fragment (rows) displayed for the samples before and after immunization of each volunteer (columns). The colored column headers represent volunteers ordered according to treatment allocation. 8 subjects of the control group (black), CHMI unprotected subjects of group 2 (n = 17, yellow), unprotected subjects of group 3 (n = 16, blue), CHMI protected subjects (n = 5, green). The first and second columns for each subject display the results obtained from baseline and after immunization samples, respectively. The # indicates volunteers BSPZV1-360, BSPZV1-104 and BSPZV1-117. (b) A t-SNE projected dimensionality reduction of normalized signal intensities across the microarray spots measured at baseline (triangles) and after PfSPZ vaccination (crosses) is shown. In (b-i) data are shown for the total 2804 reactive spots and in (b-ii) for the subset of 441 reactive proteins fragments predicted to be expressed at the sporozoite stage (Florens et al., 2002), with the signals obtained for each subject at the two bleeding time points grouped in circles. For 3 out of 46 subjects, namely BSPZV1-360, BSPZV1-104 and BSPZV1-117, the signals do not cluster in this t-SNE analysis.

