Abstract
A large number of healthcare workers have been infected with coronavirus disease-2019 (COVID-19). We aimed to investigate their clinical and chest computed tomography (CT) characteristics.
The clinical, laboratory test and CT features of 43 medical and hospital staff with confirmed COVID-19 (MP group, 26–70 years old) were retrospectively analyzed, and compared to 43 non-medical related patients (non-MP group, 26–71 years old). Follow-up CT characteristics were analyzed to assess the disease progression in the period of hospitalization.
At admission, the main complaints of the MP group, including fever (81.4%), fatigue (48.8%) and cough (41.9%), were similar to the non-MP group. The C-reactive protein, erythrocyte sedimentation rate, and lactate dehydrogenase levels were higher in the non-MP group than the MP group (17.5 ± 22.4 mg/L, 20.2 ± 23.4 mm/H and 219 ± 66U/L, respectively, P < .05). Ground-grass opacities, consolidation, interstitial thickening were common CT features of both groups. The severity of opacities on initial CT were less in the MP group (5.3 ± 3.9 scores) than in the non-MP group (9.1 ± 4.8 scores, P < .05). Before regular treatments, the sum score of the opacities showed weak to moderate correlations with duration, C-reactive protein, erythrocyte sedimentation rate and lactate dehydrogenase levels (R ranged from 0.341–0.651, P < .05). In the study time window, the duration from illness onset to when the most obvious pulmonary opacities were observed, according to CT findings, were similar in the MP group (13.3 ± 6.6 days) and the non-MP group (13.8 ± 5.1 days, P = .69). Mild to moderate anxiety and depression were observed in both groups.
Despite greater knowledge of how to protect themselves than the general population, healthcare workers are also susceptible to COVID-19 infection. Occupational exposure is a very important factor. Healthcare workers have a higher vigilance about the infection in the early stage of the disease.
Keywords: coronavirus disease-2019, computed tomography, follow-up, healthcare workers
1. Introduction
In late December, 2019, Wuhan, China, has become the first center of an outbreak of pneumonia caused by a novel coronavirus,[1,2] the severe acute respiratory syndrome coronavirus 2 (SARS-CoV-2). The disease is spreading at a striking speed. Between when the first case was discovered in December, 2019, until April 20, 2020, the confirmed cases have exceeded 2,300,000 worldwide.[3] Healthcare workers, particularly those worked in the outbreak centers, have fought on the front lines against COVID-19, putting themselves at risk of infection. Information about this infected group is limited.
The SARS-CoV-2 is highly infectious and can spread very rapidly in human populations, according to the epidemiological investigation.[4,5] The main route of transmission is via respiratory droplets, as well as physical contact. In the institution we studied, all healthcare workers were trained on how to protect themselves since the beginning of the epidemic. In the process of treating and caring for patients, healthcare workers wore N95 masks, in addition to wearing goggles and protective clothing when necessary. However, despite these precautions, an increase in the number of cases of COVID-19 in healthcare workers had been noticed. In January, a young doctor from the emergency department was diagnosed with the COVID-19 infection. He was among the first medical professionals at our institution who get infected, after swabbing a patient's throat for an inspection sample.
After the outbreak of the disease, numerus patients poured into hospitals in Wuhan, especially the public hospitals. On February 14, 2020, the data was disclosed from China's State Council that 1716 healthcare workers had been confirmed infected with SARS-CoV-2 pneumonia and 10 healthcare workers had sacrificed their lives. In early March, more than 3300 healthcare workers in China had been infected. In a published paper of Zhongnan Hospital of Wuhan University, presumed hospital-related transmission of 2019-nCoV was suspected in 41% of patients, including medical and hospital staff.[6] Due to the rapidly unfurling repercussions of the Coronavirus epidemics worldwide, around April 6, 2020, it was reported by the local media that 19,400 healthcare workers in Spain and 11,200 healthcare workers in Italy had been infected.
Healthcare workers are more knowledgeable about how to protect themselves from infection spread and tend to pay more attention to their health status, both at home and at work. In this retrospective study, we aim to investigate the clinical and CT characteristics (including the initial and follow-up CT), as well as psychosocial status, of healthcare workers infected with COVID-19, and identify whether there are differences in the clinical symptoms and signs, laboratory tests and CT features compared to the non-medical related patients.
2. Materials and methods
2.1. Patients
This retrospective study was approved by the institutional review board of Tongji Hospital, Tongji Medical College, Huazhong University of Science and Technology. Informed consent was waived as this retrospective study involved no potential risk. Data of 43 patients with COVID-19 pneumonia, who were also medical and hospital staff (MP group, 26–70 years, 22 males), and 43 non-medical related subjects from general patients group (non-MP group, 26–71 years, 21 males) were collected in two isolated wards of the institution (as generally most of the infected medical and hospital staff would be admitted to these wards; patients in the MP group were admitted consecutively). All the subjects were admitted in Tongji Hospital from January 12, 2020. The end of review date was March 28, 2020. Their diagnosis of COVID-19 were confirmed with a positive result to real-time fluorescence polymerase chain reaction assay for SARS-CoV-2 nucleic acid, with nasopharyngeal or oropharyngeal swab specimens. Cases with lung surgery, tumors history, and other types of pneumonia caused by common bacterial and viral pathogens were excluded. All these patients underwent chest CT exams at admission and subsequent several reexaminations during the treatment (range 11–55 days).
Healthcare workers, including professionals and other staff, were clinical doctors (n = 17), nurses (n = 14), radiology technicians (n = 2), sonography technicians (n = 2), laboratory technicians (n = 2), dialysis technician (n = 1) and other hospital staff (n = 4) and postgraduate (n = 1). They worked in clinic or service for clinical work directly. Retirees and administrative officials were not included. Out of 43, 25 of them admitted a close contact with several confirmed or highly suspected COVID-19 cases. All the patients in the MP group denied any exposure history of Huanan Seafood Wholesale Market.[7]
We retrospectively collected the clinical and laboratory data, specifically including signs and symptoms, blood routine, erythrocyte sedimentation rate (ESR), D-dimer, biochemical examinations including C-reactive protein (CRP), lactate dehydrogenase (LDH), glutamic oxaloacetylase, procalcitonin. In addition, the Hamilton anxiety scale (HAMA) and Hamilton depression scale (HAMD) were used to evaluate the psychosocial status in a portion of patients in each group.
2.2. Review of CT images
All CT images were reviewed by 2 radiologists (Sun and Xiong, with 3 and 11 years of clinical experience, respectively) using a special viewing console. Decisions were reached by consensus. For each patient, the initial and follow-up CT images were evaluated for:
-
1.
Presence of ground-glass opacities, consolidation, interstitial thickening or reticulation, fibrous stripes and air bronchograms, pleural effusion, mediastinal lymph node changes (enlargement or increased number of lymph nodes), etc, as these manifestations were reported common features in COVID-19[8–10];
-
2.
Changes in size, distributions and degree of lobes involvement of the opacities. ground-glass opacities was defined as increased lung attenuation with preservation of bronchial and vascular margins and consolidation was defined as opacification in which the underlying vasculature was obscured.[11,12]
To measure the alterations in changes in size and distribution of the lesions, a semi-quantitative analyze were applied.[12] On each patient's CT images, each lobe of the lungs was assessed and the lesion size was classified as none (0 score), small (1 score, diameter < 1 cm), medium (2 score, diameter 1 to 3 cm), large (3 score, diameter 3 cm to <50% of the lobe), or very large (4 score, 50%–100% of the lobe). The CT images for each patient in the 2 groups were evaluated by summing the scores of 5 lobes (range of possible scores, 0–20), naming sum score of the opacities.
The initial CT and all the follow-up CT exams (during the study time window: January 12 to March 28, 2020) were reviewed retrospectively. For every patient, the CT which exhibited the most obvious opacities (CTpeak) were noted. The duration from illness onset to the date of CTpeak, as well as sum score of CTpeak were recorded. Furthermore, the CT which exhibited the beginning of the opacities decrement or absorption (CTdecrease) were also noted. The duration from illness onset to CTdecrease, as well as sum score of CTdecrease were recorded.
2.3. Statistical analysis
All statistical analyses were conducted using SPSS 22.0 software (IBM, Armonk, NY). Continuous data are presented as mean ± standard deviation and categorical data are presented as percentage (%), when appropriate. Inter-group differences were compared by Student t test or Pearson χ2 test. A P < .05 was considered statistically significantly different. Correlation analyses were performed to study the relationship between sum score and disease duration, and between sum score and lab test parameters at admission. The correlation coefficient R and P-values were calculated with a statistical significance level set at P < .05.
3. Results
3.1. Clinical and laboratory test findings
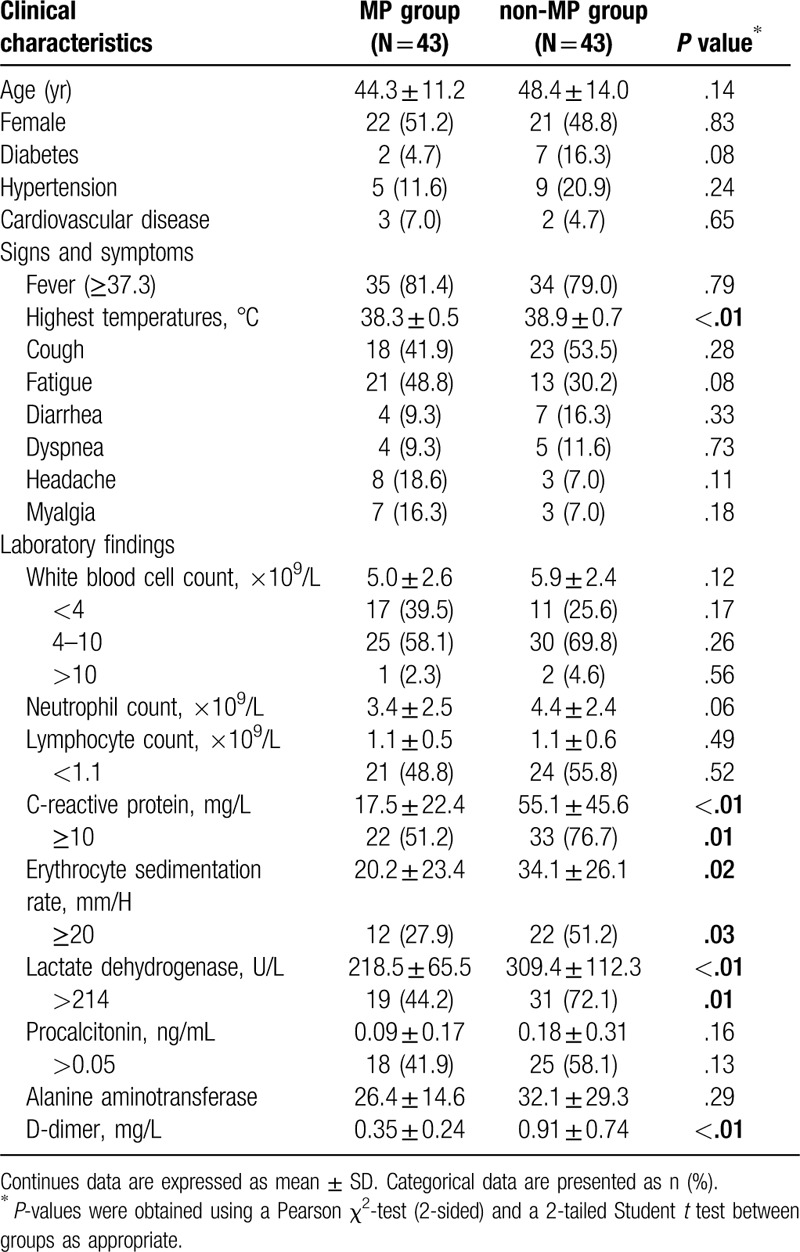
The average age of the MP and non-MP groups were 44.3 ± 11.2 years and 48.4 ± 14.0 years respectively (P = .140). All the patients of the MP group lived in Wuhan. At admission, they were diagnosed as moderate (n = 42) and mild (n = 1) cases, according to the Guidance for Corona Virus Disease 2019 (6th edition) released by the National Health Commission of China.[13] The most common complaints were fever (35/43, 81.4%), fatigue (21/43, 48.8%) and cough (18/43, 41.9%). Other complaints included diarrhea (4/43 cases), dyspnea (4/43 cases), headache (8/43 cases), and muscle soreness (7/43 cases). Some patients of MP group had reduced white blood cell count (17/43, 39.5%) and reduced lymphocyte count (21/43, 48.8%), increased CRP (22/43, 51.2%), increased ESR (12/43, 27.9%), and increased LDH (19/43, 44.2%). However, the CRP, ESR and LDH levels were lower than those of the non-MP group (P < .05). More demographic data, laboratory tests and symptoms of the MP and non-MP groups are listed in Table 1.
Table 1.
Patients characteristics and lab test results at admission.
3.2. Initial CT features
Data of the initial and follow-up chest high-resolution CT findings of the MP group were listed in Table 2. In the first CT exams from onset of illness, opacities were 1-lobe involved (16/43, 37.2%), or multiple and bilaterally (26/43, 60.5%) distributed (1 patient had no obvious opacities in her first CT), and commonly located in the subpleural (18/43, 41.9%), peribronchial (11/43, 25.6%), and diffuse area (13/43, 30.2%). In 33/43 cases (76.7%), the right and/or left lower lobes were involved. In some cases, consolidation (16/43), interstitial thickening or reticulation (14/43), air bronchograms signs (8/43) and pleural effusion (2/43) could also be seen (Fig. 1). These features were also observed in the non-MP group and there were no significant difference (detailed in Table 2).
Table 2.
Comparison of initial and follow-up CT findings between the MP and non-MP groups.
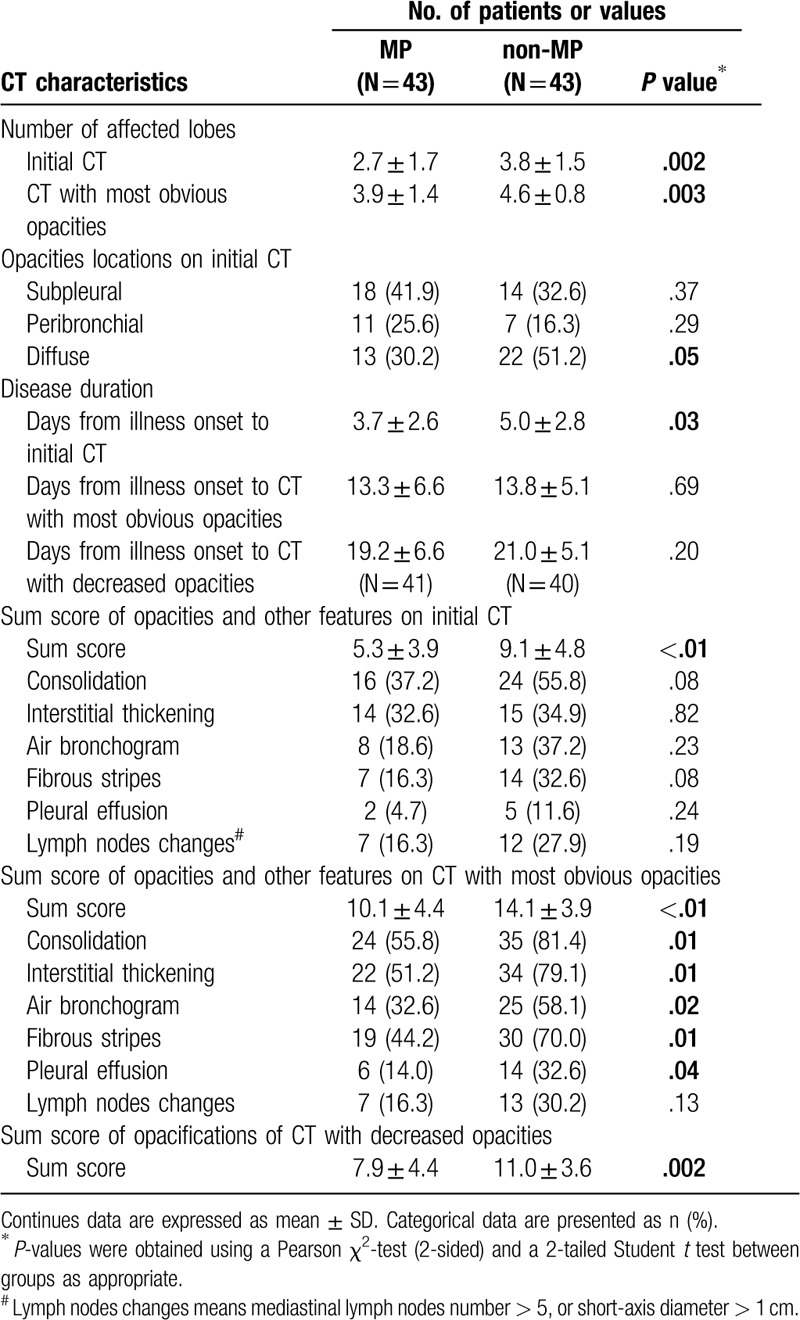
Figure 1.
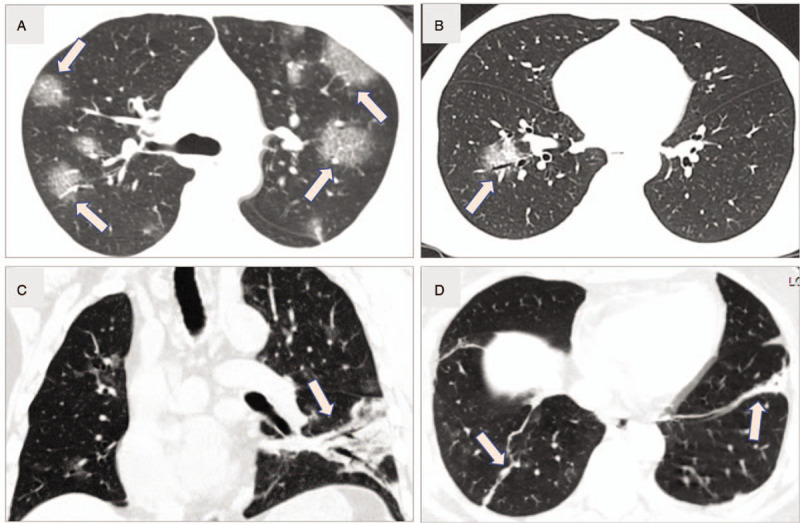
Common computed tomography imaging features. A: Multiple patchy ground-glass opacities (GGO), and GGO with interlobular septal thickening (arrows, like reticulation or “paving stone sign”) of a 44 years old male common patient (5 days from onset). B: Single GGO in peribronchial area (arrow) of the right lower lobe of a 44 years old male patient (a physician, 2 days from onset). C: Diffuse opacities and consolidation, as well as air bronchograms (arrow) in a 54 years old patient (a surgeon, 6 days from onset). D: Fibrous stripes (arrows) are shown in bilateral lower lobes in a 51 years old female patient (a radiology technician, 20 days from onset).
In the MP group, the days from illness onset to first CT exam ranged from 1 to 11 days (3.7 ± 2.6 days), less than the non-MP group (1–11 days, 5.0 ± 2.8 days, P = .032). The sum score of opacities ranged from 0 to 16 (5.3 ± 3.9) scores, less than that of the non-MP group (1–20 scores, 9.1 ± 4.8 scores, P < .01). Before admission in hospital and regular treatments, the sum score of the opacities was positively correlated with the days from illness onset to initial CT, in both the MP and non-MP groups (with age and gender as covariates, R = 0.651 and 0.630, P < .01, respectively). After regular and individualized treatments, the correlations were not all significant (Fig. 2A, B). At admission, the sum score of initial CT was also positively correlated with CRP (R = 0.433, P < .01), ESR (R = 0.341, P = .01) and LDH (R = 0.410, P < .01) levels overall. Correlations between sum score and lymphocyte count (R = 0.216, P = .16), procalcitonin (R = 0.270, P = .06) or D-dimer (R = 0.209, P = .19) were not statistically significant.
Figure 2.
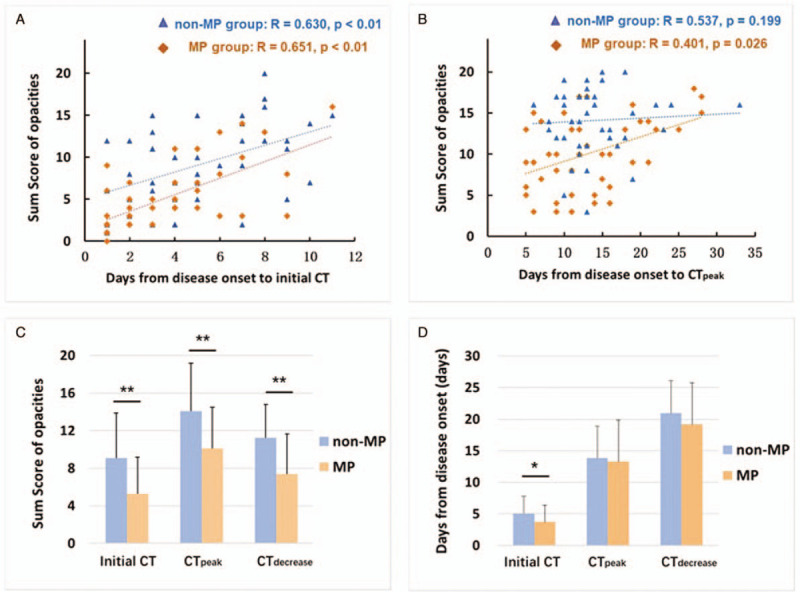
A-B: Correlation between sum score and days from illness onset to initial CT; and days from illness onset to the most obvious pulmonary opacities were observed (CTpeak). (R denotes Pearson correlation coefficient with age and gender as covariates). C-D: Differences in mean values of sum score and disease duration to initial CT, CTpeak and the CT began to show decreased extent/density of the opacities (CTdecrease), between the MP and non-MP groups. Note that at the timepoint of CTdecrease, 41 patients in MP group and 40 patients in non-MP group were included. The bar height indicates the mean, and the line on top of the bar represents the standard deviation. Asterisk indicates a significant difference (∗P < .05, ∗∗P < .01).
3.3. Changes on follow-up CT
All the patients in both MP and non-MP groups underwent 2 to 4 follow-up CT exams. Follow-up CT exams in both MP and non-MP patients usually demonstrated mild, moderate, or severe progression of disease in approximate 13.5 ± 5.8 days, as measured by sum score of the total dataset, which represent an increased extent of pulmonary opacities. As disease progressed, severe cases could have more consolidation and air bronchograms in the relevant lobes (Figs. 3–5). The diffuse lesions, showed as “white lungs” were seen in the most severe patients. The days from illness onset to the date when the CT showed most obvious pulmonary opacities, were similar in the MP group (13.3 ± 6.6 days) and the non-MP group (13.8 ± 5.1 days, P = .69). However, at this “peak stage of opacities”, the average sum score of the MP group (10.1 ± 4.4 scores) was less than the non-MP group (14.1 ± 3.9 scores, P < .01) (Table 2 and Fig. 2C, D). It suggested that although the disease duration, from illness onset to CTpeak, were similar at group level, the extent of severity was a bit less in the MP group.
Figure 3.
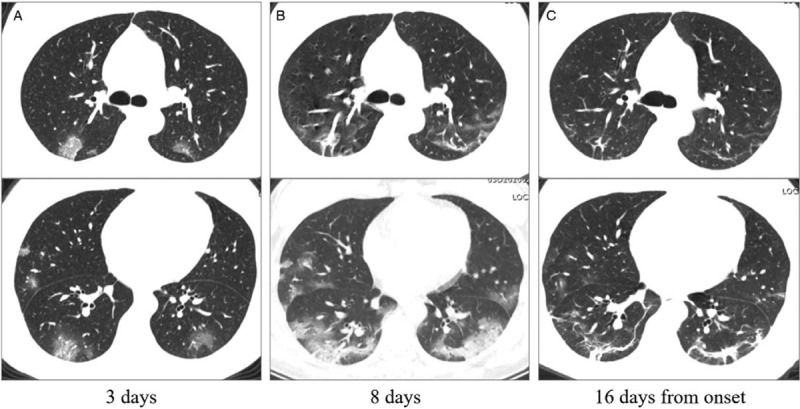
The initial computed tomography (CT), CT with most obvious opacities, and CT with decreased opacities of a 38 years old nurse. A: Patchy ground-glass opacities distributed bilaterally on the initial CT (3 days from onset). B: In the follow-up CT, ground-glass opacities progressed to multiple ground-glass infiltration in the lungs. C: Fibrous stripes could be a common sign during the remission stage. Images in the first and second lines represent different cross sections.
Figure 5.
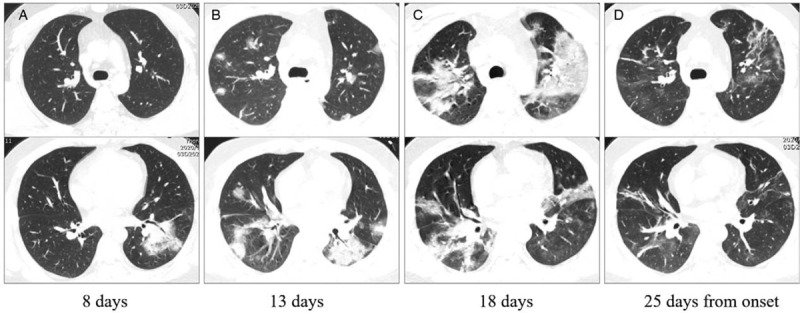
The initial computed tomography (CT), follow-up CT, CT with most obvious opacities, and CT with decreased opacities of a 28 years old common patient admitted in our institution. A: Patchy ground-glass opacities in the left lower lobe on the initial CT (8 days from onset). B, C: In the follow-up CT, ground-glass opacities progressed to multiple ground-glass infiltration and consolidation bilaterally. D: After absorption of some opacities, fibrous stripes and interstitial thickening could be seen. Images in the first and second lines represent different cross sections.
Figure 4.

The initial and follow-up computed tomography of a 54 years old patient (a surgeon). A: Focal ground-glass opacities in the right upper lobe (3 days from onset). B: Ground-glass opacities progressed to multiple ground-glass infiltration and consolidation bilaterally. C: The disease progressed very fast. He was admitted in intense care unit and received ECMO treatment. Fibrous stripes, interstitial thickening, pneumonocele and bronchiectasia could be seen.
Six patients in the MP group then turned to severe cases. Three of them were transferred to ICU and 1 patient received invasive ventilation and extracorporeal membrane (ECMO). Until March 28, 2020, we observed 41 patients (41/43, 95.3%) in the MP group got better in CT manifestations with decreasing extent and/or density of the opacities. Forty patients (40/43, 93.0%) in the non-MP group also exhibited less extent and/or density of the opacities in the follow-up CT exams. Three patients were transferred to ICU and took bedside chest radiography as reexaminations, including a very seriously ill female patient, who died 18 days after the onset of illness. Among the patients who got better in CT manifestations, the days from onset to the date when CT began to show decreased extent and density of the opacities, was similar in the MP group (19.2 ± 6.6 days) and in the non-MP group (21.0 ± 5.1 days, P = .20) (Table 2 and Fig. 2C, D). Fibrous stripes could be a common sign on CT images during the remission stage (31/41 cases in MP group and 29/45 cases in the non-MP group).
3.4. Anxiety and depression assessments
The Hamilton anxiety scale (HAMA) and Hamilton depression scale (HAMD)[14] were applied in a portion of moderate patients (16/43 cases in the MP group and 16/43 cases in the non-MP group). The HAMA scores were 13.6 ± 2.7 and 14.1 ± 3.0 in the MP and non-MP groups; the HAMD scores were 13.2 ± 2.7 and 13.6 ± 2.6, respectively (P = .76 and 0.69). In this limited study group, mild to moderate anxiety and depression were observed in both MP and non-MP patients.
4. Discussion
Healthcare workers are also susceptible to COVID-19. Their main complaints and laboratory tests results were similar to common, non-medical related patients,[5–7] such as fever, fatigue and cough, and increased CRP, ESR and LDH. Decreased white blood cells and lymphocytes count were observed in some cases. The characteristics in CT images, for instance the ground-glass opacities and consolidation, and their distribution manner, which usually located in the posterior and peripheral part, were similar as the non-MP patients.[8–10]
However, there were some differences that should be noted. First, the severity of opacities on initial CT were observed less in the MP group, which possibly owning to lower viral load and extent of the viral infection, as the healthcare workers wore N95 masks, face screen and other protective equipment carefully at worktime. Even been infected, the protective equipment could likely reduce the virus intrusions. It may also be related with a higher vigilance. In an atmosphere surrounded by highly contagious viruses, healthcare workers are always more sensitive to their minor and concealed symptoms. They are willing to carry a CT scan and laboratory blood tests, as early as possible. The SARS-CoV-2 invade into pulmonary epithelium by binding to the angiotensin-converting enzyme 2 (ACE 2) receptor and quickly duplicate, causing exudation and pneumonedema. As a result, the earlier to take radiological examinations, the less pulmonary opacifications were observed. Meanwhile, some laboratory parameters, for example the elevated CRP, ESR and LDH, were also not as that high as the non-MP patients (all P < .05). Before clinical treatments, the sum score of opacification size was positively correlated with the days from illness onset to initial CT for both groups. Therefore, cautious attention to symptoms and application of CT examination are helpful for early diagnosis of COVID-19, facilitating standardized treatments and isolation. We noticed there was a nurse in the MP group, whose first CT showed no obvious abnormalities. However, several days later her follow-up CT exhibited significantly increased opacities.
Second, albeit the disease was detected earlier and the initial symptoms were mild, in the current study cohort, the duration from onset to the date when the most obvious opacities were seen on CT (CTpeak), was similar in the two groups (P = .69). This may be related to the immunopathological basis of the coronaviruses induced pneumonia. Majority of studies attributed a dysregulated/exuberant innate response as a leading contributor to coronavirus- mediated pathology.[15] Many cytokines or chemokines are involved in the immune storm post coronavirus infection.[16] We speculate that though with active treatments, it takes a time for the specific immune response to establish and generate antibodies to suppress virus replication. As a result, it is of great importance to control the progression in the first 2 weeks from illness onset with utmost effort, for preventing extensive expansion of the pulmonary opacities.
Psychological support for healthcare workers are also necessary. Alongside concerns for their personal safety and illness condition, healthcare workers are anxious about passing the infection to their families. Those who care for elderly parents or young children in their families will also be drastically affected by school closures, social distancing policies, and disruption in the availability of food and other essentials,[17] since the Wuhan city has been sealed off from outside contact for more than 2 months. Despite the psychological pressure from work, family, and self-health condition, we observed that once get infected, healthcare workers were typically more compliant with clinical treatment, including the oxygen therapy and noninvasive ventilators.
This study has some limitations. First, this is a modest-sized retrospective study in a single-center. Collection for a larger cohort would help to better define the clinical and imaging characteristics. Second, the subjects in the MP and non-MP groups were not strictly age-matched. As the MP group were defined as doctors, nurses and technicians who worked in the clinical front, while in general patients with COVID-19, the middle-aged and elderly were the majority. Third, the status of viral pneumonia are changing all the time. However, CT cannot be performed every day, due to the danger of exposure to radiation. Meanwhile in some cases the pneumonia was too severe to move the patients, specifically the patients transferred to ICU. So in our study, CT manifestations would not be so efficient and timely for reflecting the alterations in lungs.
Although with more professional knowledge and equipment about protection from being infected, the medical and hospital staff are also susceptible groups of the COVID-19 infection. Occupational exposure is a very important factor. As the pandemic accelerates, access to personal protective equipment for healthcare workers when they treating and caring patients, is of paramount importance. Furthermore, provision of needed break away from intensive work and a psychological support are also essential.
Author contributions
Conceptualization: Ying Xiong, Qiang Zhang.
Data curation: Ying Xiong.
Formal analysis: Dong Sun.
Funding acquisition: Ying Xiong.
Investigation: Ying Xiong, Qiang Zhang, Dong Sun, Wenzhen Zhu.
Methodology: Ying Xiong, Qiang Zhang, Dong Sun.
Project administration: Qiang Zhang, Wenzhen Zhu.
Supervision: Qiang Zhang, Wenzhen Zhu.
Validation: Qiang Zhang.
Writing – original draft: Ying Xiong.
Writing – review & editing: Qiang Zhang.
Footnotes
Abbreviations: COVID-19 = coronavirus disease-2019, CRP = C-reactive protein, CT = computed tomography, ESR = erythrocyte sedimentation rate, LDH = lactate dehydrogenase.
How to cite this article: Xiong Y, Zhang Q, Sun D, Zhu W. Clinical and CT characteristics of healthcare workers with COVID-19: a single-centered, retrospective study. Medicine. 2020;99:30(e21396).
This work was supported by the National Natural Science Foundation of China (grant number 81601480).
The authors have no conflicts of interest to disclose.
The datasets generated during and/or analyzed during the current study are available from the corresponding author on reasonable request.
References
- [1].World Health Organization. WHO Statement regarding cluster of pneumonia cases in Wuhan, China. World Health Organization, Geneva. Available via https://www.who.int/china/news/detail/09-01-2020-who-statement-regarding-cluster-of-pneumonia-cases-in-wuhan-china. Accessed 9 January 2020. [Google Scholar]
- [2].Velavan TP, Meyer CG. The COVID-19 epidemic. Trop Med Int Health 2020;25:278–80. [DOI] [PMC free article] [PubMed] [Google Scholar]
- [3].World Health Organization. Novel coronavirus(2019-nCoV): situation report - 91. Available at: https://www.who.int/docs/default-source/coronaviruse/situation-reports/20200420-sitrep-91-covid-19.pdf?sfvrsn=fcf0670b_4. Accessed April 20, 2020. [Google Scholar]
- [4].Chan JF, Yuan S, Kok KH, et al. A familial cluster of pneumonia associated with the 2019 novel coronavirus indicating person-to-person transmission: a study of a family cluster. Lancet 2020;395:514–23. [DOI] [PMC free article] [PubMed] [Google Scholar]
- [5].Li Q, Guan X, Wu P, et al. Early transmission dynamics in Wuhan, China, of novel coronavirus-infected pneumonia. N Engl J Med 2020;382:1199–207. [DOI] [PMC free article] [PubMed] [Google Scholar]
- [6].Wang D, Hu B, Hu C, et al. Clinical Characteristics of 138 hospitalized patients with 2019 novel coronavirus-infected pneumonia in Wuhan, China. JAMA 2020;323:1061–9. [DOI] [PMC free article] [PubMed] [Google Scholar]
- [7].Huang C, Wang Y, Li X, et al. Clinical features of patients infected with 2019 novel coronavirus in Wuhan, China. Lancet 2020;395:497–506. [DOI] [PMC free article] [PubMed] [Google Scholar]
- [8].Song F, Shi N, Shan F, et al. Emerging coronavirus 2019-nCoV pneumonia. Radiology 2020;295:210–7. [DOI] [PMC free article] [PubMed] [Google Scholar]
- [9].Shi H, Han X, Jiang N, et al. Radiological findings from 81 patients with COVID-19 pneumonia in Wuhan, China: a descriptive study. Lancet Infect Dis 2020;20:425–34. [DOI] [PMC free article] [PubMed] [Google Scholar]
- [10].Xiong Y, Sun D, Liu Y, et al. Clinical and high-resolution CT features of the COVID-19 infection: comparison of the initial and follow-up changes. Invest Radiol 2020;55:332–9. [DOI] [PMC free article] [PubMed] [Google Scholar]
- [11].Hansell DM, Bankier AA, MacMahon H, et al. Fleischner society: glossary of terms for thoracic imaging. Radiology 2008;246:697–722. [DOI] [PubMed] [Google Scholar]
- [12].Wong KT, Antonio GE, Hui DS, et al. Thin-section CT of severe acute respiratory syndrome: evaluation of 73 patients exposed to or with the disease. Radiology 2003;228:395–400. [DOI] [PubMed] [Google Scholar]
- [13].New coronavirus pneumonia prevention and control program (6th ed) (in Chinese). 2020. http://www.nhc.gov.cn/yzygj/s7653p/202002/8334a8326dd94d329df351d7da8aefc2/files/b218cfeb1bc54639af227f922bf6b817.pdf. Accessed 7 March 2020. [Google Scholar]
- [14].Rodriguez-Seijas C, Thompson JS, Diehl JM, et al. A comparison of the dimensionality of the Hamilton rating scale for anxiety and the DSM-5 anxious-distress specifier interview. Psychiatry Res 2020;284:112788. [DOI] [PubMed] [Google Scholar]
- [15].Channappanavar R, Zhao J, Perlman S. T cell-mediated immune response to respiratory coronaviruses. Immunol Res 2014;59:118–28. [DOI] [PMC free article] [PubMed] [Google Scholar]
- [16].Huang KJ, Su IJ, Theron M, et al. An interferon-gamma-related cytokine storm in SARS patients. J Med Virol 2005;75:185–94. [DOI] [PMC free article] [PubMed] [Google Scholar]
- [17].The Lancet. COVID-19: protecting health-care workers. Lancet 2020;395:922. [DOI] [PMC free article] [PubMed] [Google Scholar]


