Abstract
Objective
To determine factors (including the role of specific disease modulatory treatments [DMTs]) associated with (1) baseline, (2) on-treatment, and (3) change (from treatment start to on-treatment assessment) in plasma neurofilament light chain (pNfL) concentrations in relapsing-remitting multiple sclerosis (RRMS).
Methods
Data including blood samples analyses and long-term clinical follow-up information for 1,261 Swedish patients with RRMS starting novel DMTs were analyzed using linear regressions to model pNfL and changes in pNfL concentrations as a function of clinical variables and DMTs (alemtuzumab, dimethyl fumarate, fingolimod, natalizumab, rituximab, and teriflunomide).
Results
The baseline pNfL concentration was positively associated with relapse rate, Expanded Disability Status Scale score, Age-Related MS Severity Score, and MS Impact Score (MSIS-29), and negatively associated with Symbol Digit Modalities Test performance and the number of previously used DMTs. All analyses, which used inverse propensity score weighting to correct for differences in baseline factors at DMT start, highlighted that both the reduction in pNfL concentration from baseline to on-treatment measurement and the on-treatment pNfL level differed across DMTs. Patients starting alemtuzumab displayed the highest reduction in pNfL concentration and lowest on-treatment pNfL concentrations, while those starting teriflunomide had the smallest decrease and highest on-treatment levels, but also starting from lower values. Both on-treatment pNfL and decrease in pNfL concentrations were highly dependent on baseline concentrations.
Conclusion
Choice of DMT in RRMS is significantly associated with degree of reduction in pNfL, which supports a role for pNfL as a drug response marker.
Accumulating evidence supports the notion that permanent loss of neurologic functions in multiple sclerosis (MS) is primarily correlated with the degree of damage to nerve tracts rather than degree of demyelination.1–3 However, due to the reserve capacity of the CNS, critical levels of nerve damage may take years to appear as clinical disability. The observation that disease-modifying therapies (DMT) used in relapsing-remitting MS (RRMS) differently affect important long-term clinical outcomes underscores a need for more sensitive measures of core disease pathologic mechanisms.4 MRI is the only acknowledged biomarker for disease progression and different volumetric atrophy measures have been associated with risk of developing increasing disability.5–7 However, such measures are insensitive to changes over shorter time periods in individual patients. Moreover, spinal cord pathology, a major driver of clinical disability, is not routinely assessed. Among different soluble markers for neuroaxonal damage, neurofilaments have emerged as promising candidates in a range of diseases.8 Although not specific for disease processes operating solely in MS, the potential value in this condition is especially high since it may be used to monitor treatment effects. Most published studies on neurofilament light (NfL) and effects of DMTs have measured concentrations of NfL in CSF focusing on a single or a few DMTs.9–12 More recently, improvements in assay sensitivity have made it possible to reliably determine NfL in serum (sNfL) or plasma (pNfL) at concentrations seen in healthy controls. Such studies have reported a correlation between baseline levels of pNfL/sNfL and measures of clinical disease activity including development of sustained disability, brain atrophy, signs of nerve tissue damage, and long-term clinical disability outcomes.13–15 Treatment effects have been reported by several authors.14,16 Disanto et al.14 studied 2 Swiss cohorts of patients with MS in which the effects of a limited number of DMTs on NfL were reported. In this study, the decrease in sNfL after initiation of DMT was of similar magnitude across all DMTs, but confidence intervals (CIs) were large due to the small size of the study population. Similarly, Novakova et al.16 reported a Swedish MS cohort in which start of DMT resulted in lowered sNfL levels, also correlating with CSF NfL concentrations, across all different DMTs, but with low power to address effect size of specific DMTs. Thus so far there is a relative paucity of well-powered studies specifically addressing treatment effects across multiple DMTs in real-world cohorts of patients. The aim of this study was to address treatment effects across multiple DMTs through the measurement of blood NfL at 2 time points in patients selected within a large cohort of patients with RRMS initiating DMT in context of a nationwide, population-based follow-up program for all newer MS DMTs.
Methods
Patient selection and sample collection
The Immunomodulation and Multiple Sclerosis Epidemiology study (IMSE) is a comprehensive nationwide Swedish postapproval program of patients starting newer MS DMTs, coupled with sampling of blood at initiation of therapy and at follow-up. Samples were collected from patients included in IMSE as well as in the Epidemiologic Investigation of MS and Stockholm Prospective Assessment of MS. We analyzed data for 1,139 patients with RRMS initiating alemtuzumab (ALM, n = 89), dimethyl fumarate (DMF, n = 339), fingolimod (FGL, n = 275), natalizumab (NTZ, n = 284), or teriflunomide (TFL, n = 152). Inclusion criteria comprised a baseline sample within a month prior to day of initiation of DMT and a subsequent treatment duration of >4 months. Most patients (1,052) provided 2 samples (at treatment start and on treatment [absolute range 4–24 months]). Seventeen patients (4%) contributed samples for more than 1 DMT. A follow-up program similar to IMSE was recently started for rituximab (RTX); however, only 11 of 122 analyzed patients had a sample before starting therapy. The total number of patients included in this study is thus 1,261. A total of 1,026 population-based controls included in the study by Manouchehrinia et al.15 was used to calculate age-adjusted pNfL reference curves.
NfL analyses
pNfL concentrations were determined using antibodies from UmanDiagnostics (Umeå, Sweden) and the SIMOA Immunoassay using the Quanterix Kit (Quanterix, Lexington, MA). All samples from different DMTs were analyzed with blinding for treatment or clinical information. The lower limit of quantification (LLoQ) was 1.95 pg/mL. All measurements were duplicated and were above the LLoQ, with interassay and intra-assay coefficients of variation of ≤10%.
Clinical variables collection
All IMSE patients attend regular medical visits where clinical assessments are carried out and recorded through the Swedish MS registry. In addition to general demographics (age at DMT start, age at MS onset, and sex), we had access to the dates of relapses (if any) before DMT start, the type of previous DMTs (if any) with start and stop dates and the reason for stopping, as well as clinical assessments: Expanded Disability Status Scale (EDSS), further transformed into the Age-Related MS Severity Score (ARMSS; an alternative to the Multiple Sclerosis Severity Score [MSSS] based on the patient’s age at the time of assessment17); the MS Impact Score (MSIS-29), divided into its physical and psychological domains; and the Symbol Digit Modalities Test (SDMT) score.
Standard protocol approvals, registrations, and patient consents
The study was approved by the regional vetting board of Stockholm under permits 2006/845-31/1 2011/641-31/4, 2009/2017-31/2, and 04-252/1-4, with written informed consent from all participants.
Statistical analyses
Variables preparation
For all analyses, we log-transformed pNfL levels to increase the normality of the distribution. We also normalized the log-pNfL values to age 40 (log-pNfLN40), by using the linear relationship between increasing log-pNfL and age in a large population-based control sample (i.e., log-pNfLN40 = log[pNfL] − 0.02115 [age at DMT start − 40]).15 This normalization implies that a difference between 2 pNfLN40 measures cannot be attributable to a difference in ages. We calculated the number of relapses in the year preceding DMT start and the number of previous DMTs (β-interferons/glatiramer acetate [IFN/GA], ALM, DMF, FGL, NTZ, RTX, and TFL) since disease onset for each patient and these 2 variables were considered as numerical. We also created a 3-category variable denoting treatment status at start of the new DMT by including a washout period (time span between stop date of previous DMT and start of new DMT) of at least 1 month for IFN/GA, DMF, and TFL, at least 3 months for FGL and NTZ, and 6 months or more for RTX (none of the patients had switched from ALM). Patients were dichotomized as being treated with IFN/GA or with one of the other DMTs if washout periods had been shorter.
Baseline log-pNfL levels analysis
We analyzed the log-pNfL levels at baseline (without age normalization) with linear models. Initially, we used univariable linear models with log-pNfL levels as the dependent variables and each of the variables measured at baseline (i.e., DMT start) as the independent variables to explore the correlation among log-pNfL levels, clinical variables, and patient characteristics. In a second step, we used a best subset selection approach to determine which subset of the baseline variables contributed most to explaining the variability of the pNfL levels.18 The tested variables included the number of previous DMTs, treatment status just before DMT start, sex, age at disease onset, disease duration, age at DMT start, number of relapses during the year before DMT start, EDSS, ARMSS, MSIS-29 (physical and psychological scales), and SDMT, all these being measured at DMT start.
Propensity score estimation
In order to balance the DMT groups, we calculated individual DMT propensity scores (PS), i.e., the probability to be treated with a specific DMT.19,20 We used a multinomial logistic model with ALM, DMF, FGL, NTZ, and TFL as the dependent variable, while the independent variables included all variables measured at DMT start, including log-pNfLN40. Several combinations of these variables were tested including interaction terms or transformed scales of variables. The ability of the inverse of the PS in reducing differences between DMT groups in baseline log-pNfLN40 values, assessed by measuring the standardized differences between the mean log-pNfLN40 values of each DMT group and the overall mean, depended on the input variables. Among different models tested, the one resulting in the smallest average of the standardized differences was selected.19–21 In the subsequent analyses, we used weights that were calculated by using the inverse of the PS. However, individual weights were limited to the 0.995th percentile of their distribution in order to prevent disproportionate effects on the analytical model.20 We excluded RTX from PS analyses since baseline pNfL values were available only for a small minority.
Changes in log-pNfLN40 levels analysis
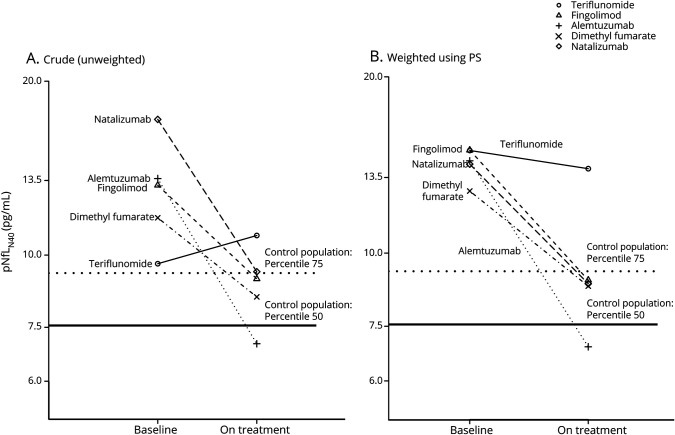
We used a graphical approach to describe changes in log-pNfLN40 levels from DMT start to follow up (4–24 months later) using unweighted means of the log-pNfLN40 across different DMTs, and subsequently, values weighted by the inverse of the PS. As the main question was to assess if different DMTs were significantly associated with degree of reduction of pNfLN40 concentrations, we calculated the delta pNfLN40 (i.e., change in log-pNfLN40 levels). We used a weighted linear model with delta as the dependent variable and the DMTs as the independent variable, using weights obtained by inversing the PS, and further adjusted for other baseline covariates to remove potential residual confounding.22 Criteria to retain a variable included percentage of the explained variance, and how much the additional variable modified the estimates for the DMTs. In an additional sensitivity analysis, we stratified on the quintiles of the PS instead of using weights. We also analyzed how the changes in log-pNfLN40 correlated with the changes in EDSS, ARMSS, MSIS-29, and SDMT using univariable models.
Additional supporting analyses
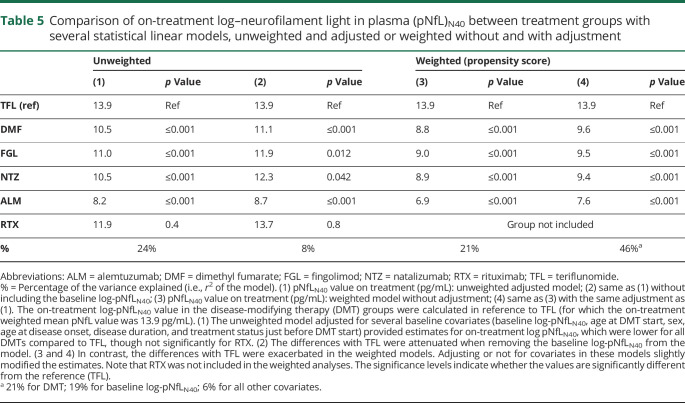
As RTX was excluded from the analyses using PS, we also modeled the log-pNfLN40 on treatment, without using PS but adjusting the analyses for patient characteristics using linear models. In parallel, the log-pNfLN40 on treatment without RTX but using PS was also modeled.
Data availability
Data related to the current article are available from Tomas Olsson, Karolinska Institutet. To share data from the Swedish MS registry, a data transfer agreement needs to be completed between Karolinska Institutet and the institution requesting data access. This is in accordance with data protection legislation in Europe (General Data Protection Regulation). Persons interested in obtaining access to the data should contact Tomas Olsson at tomas.olsson@ki.se.
Results
Baseline characteristics
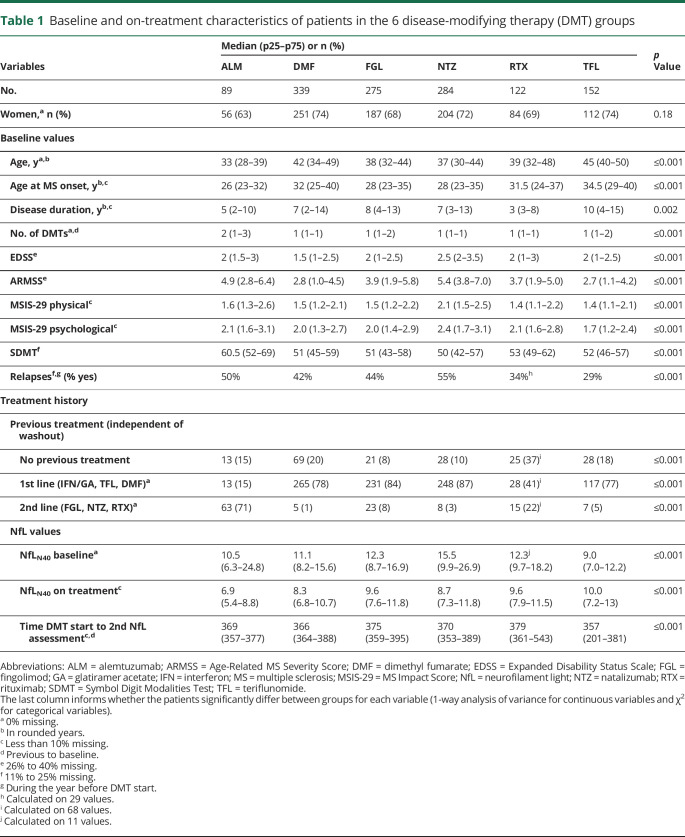
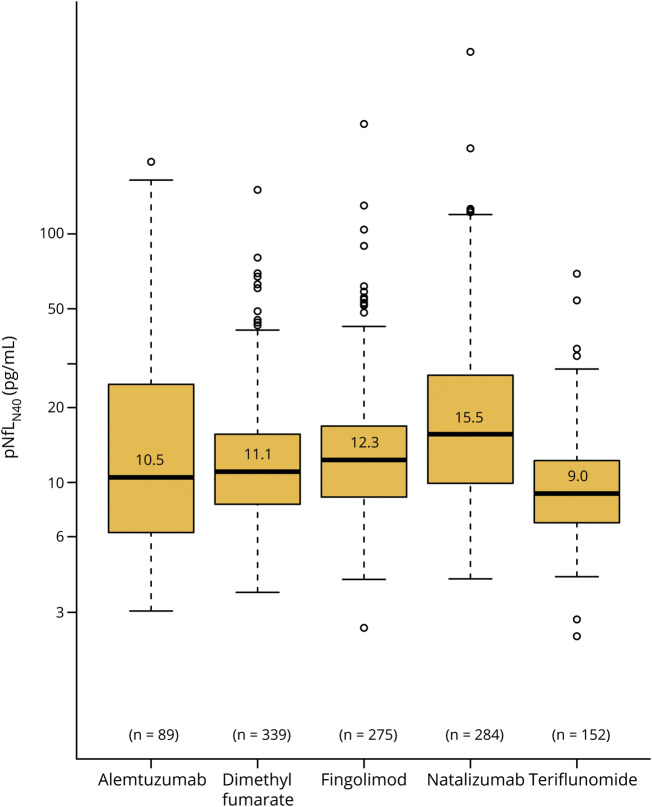
Data on baseline patient characteristics at therapy initiation are presented in table 1. There were large differences between DMT groups, where for example those starting TFL were older both at disease onset and at therapy initiation, had lower MSIS-29 and ARMSS values, and had a longer disease duration compared to other DMT groups (table 1). From a disease severity perspective, NTZ starters were characterized by both higher EDSS and MSIS-29 scores as well as higher relapse activity compared to other groups. These differences were mirrored in both baseline pNfL (data not shown) and baseline pNfLN40 concentrations (table 1 and figure 1).
Table 1.
Baseline and on-treatment characteristics of patients in the 6 disease-modifying therapy (DMT) groups
Figure 1. Baseline log–neurofilament light in plasma (pNfL)N40 levels in groups starting different disease-modifying therapies (DMTs) (with median and 25th and 75th percentiles).
Box and whisker plots show the distributions of the log-pNfLN40 concentrations in each group of patients at DMT start.
Modeling baseline log pNfL
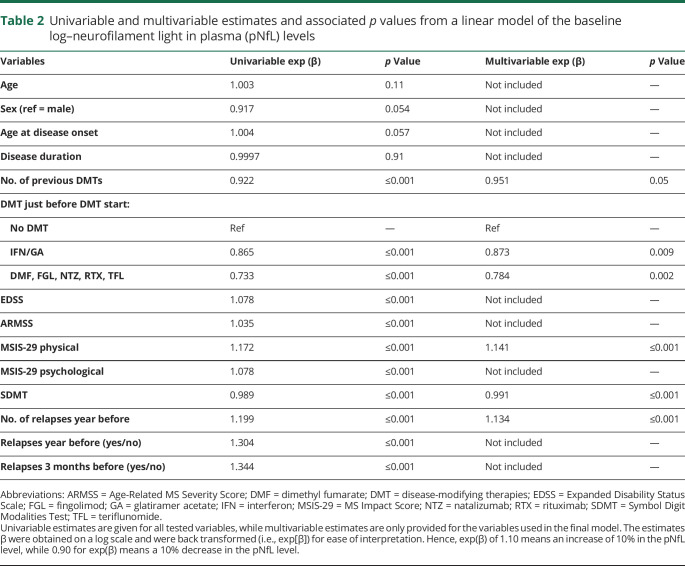
The pNfL values displayed a skewed distribution and were log transformed. We then modeled log-pNfL levels at baseline (without age normalization) with a linear model. As most of the variables displayed a fluctuating degree of association with the pNfL values and also interacted, we used a best subset selection to model pNfL variability across groups. The back transformed estimates (exp[β]) are given in table 2 for both the univariable and multivariable models. The pNfL levels increased with EDSS, ARMSS, MSIS-29 (physical and psychological scales), and number of relapses before DMT start, and decreased with SDMT scores and number of previous DMTs.
Table 2.
Univariable and multivariable estimates and associated p values from a linear model of the baseline log–neurofilament light in plasma (pNfL) levels
Propensity scores
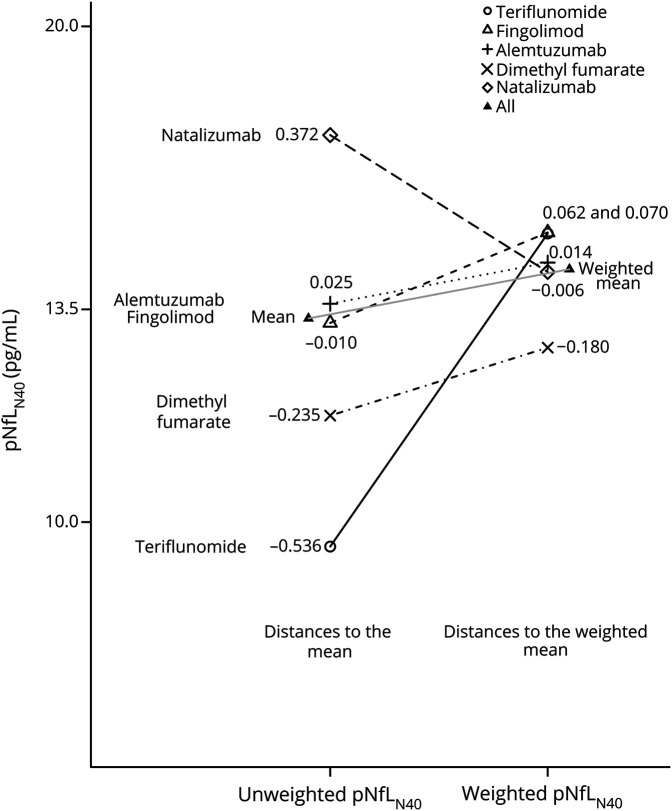
The variables retained for modeling the PS through the multinomial logistic model of the 5 DMTs, excluding RTX, were selected after testing several combinations of the baseline variables, retaining the model with the smallest average standardized difference. This model included the baseline pNfLN40 level, ARMSS, EDSS, SDMT, age at disease onset, the number of previous DMTs, the treatment status just before starting the new DMT, and the number of relapses during the year before DMT start. With these variables, the average of the standardized absolute distances for log-pNfLN40 dropped from 0.24 before weighting to 0.05 after weighting (figure 2).
Figure 2. Unweighted and weighted baseline log–neurofilament light in plasma (pNfL)N40.
The ability of the propensity scores to correct the imbalance between disease-modifying therapy groups is shown graphically and numerically for log-pNfLN40 levels. The distances are standardized (i.e., they do not depend on the unit in which the variable was measured). The effect of the propensity score is to decrease the standardized distances, where a standardized distance larger than 0.20 can be considered as evidence of imbalance and a potential source of bias.21 Here, there is some small residual imbalance for dimethyl fumarate. The average of the absolute standardized distances was 0.24 before weighting and 0.05 after weighting.
Changes in log-pNfLN40 levels analysis
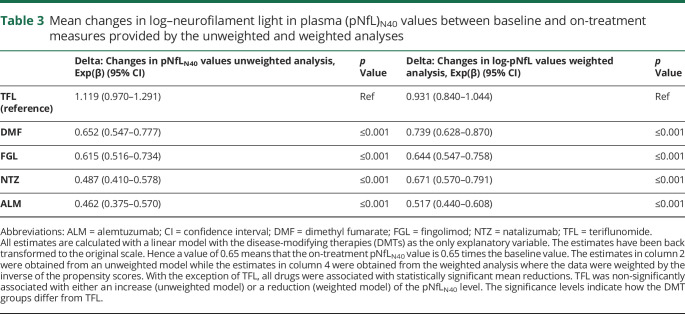
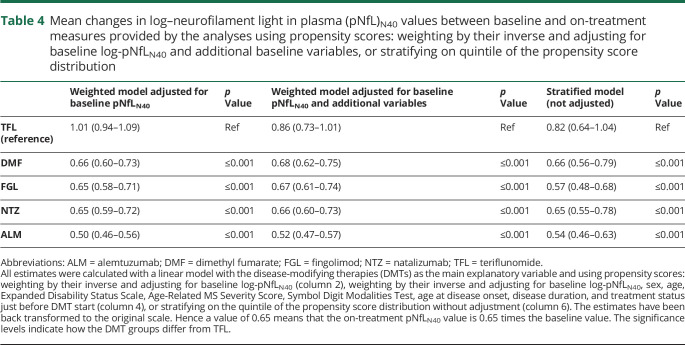
The changes in log-pNfLN40 levels between baseline and on treatment are presented in figure 3, both for the unweighted values (figure 3A) and the values weighted with the inverse of the PS (figure 3B). Despite PS weighting, some differences between DMTs remained, suggesting residual effects of factors not accounted for. The estimates from both the unweighted and weighted linear regression models with delta (i.e., change in log-pNfLN40) as the dependent variable and the DMTs as explanatory variables are presented in table 3. The estimates (β) were back-transformed to the original scale (exp[β]), so that, for example, a value of 0.80 translates into a 20% reduction of the baseline pNfLN40 level. The mean change was affected by the type of DMT, with the largest mean reduction for ALM in both analyses (54% reduction [95% CI 43%–62% reduction] and 48% reduction [49%–56% reduction] respectively for the unweighted and weighted analyses) and the smallest change for TFL, for which the significance level of 0.05 was not reached (12% increase [3% reduction to 29% increase] and 7% reduction [16% reduction to 4% increase] respectively for the unweighted and weighted analyses). A post hoc analysis highlighted similarities and differences between DMT groups; the mean delta between DMF and FGL and between NTZ and ALM were not statistically different for the unweighted model. In the weighted model, the mean delta of NTZ did not differ significantly from DMF and FGL (data not shown). To remove any residual confounding, we further adjusted our model with several baseline covariates. While this dramatically increased the percentage of the variance explained, it did not change the pattern observed with our first (weighted) model. The estimates were only slightly modified when including the log-pNfLN40 at baseline in the model (table 4). Similar limited changes also occurred with inclusion of additional baseline covariates or stratification on PS quintiles (instead of weighting) (table 4). In order to explore the effect of previous DMTs, we further stratified on previous treatment and on baseline pNfLN40 level (data not shown). This provided additional insights without modifying our previous observations. Finally, we also observed that the changes in log-pNfLN40 values, EDSS, ARMSS, and MSIS-29 were all significantly correlated to each other, though often with low correlation coefficients (i.e., around 0.3 or below).
Figure 3. Baseline and on-treatment mean neurofilament light in plasma (pNfL)N40 levels in the disease-modifying therapy groups.
(A) Crude mean pNfL levels at baseline and on treatment. (B) Weighted mean pNfL levels at baseline and on treatment. The weights are the inverse of the propensity scores.
Table 3.
Mean changes in log–neurofilament light in plasma (pNfL)N40 values between baseline and on-treatment measures provided by the unweighted and weighted analyses
Table 4.
Mean changes in log–neurofilament light in plasma (pNfL)N40 values between baseline and on-treatment measures provided by the analyses using propensity scores: weighting by their inverse and adjusting for baseline log-pNfLN40 and additional baseline variables, or stratifying on quintile of the propensity score distribution
On-treatment log-pNfLN40 levels
The analysis of the log-pNfLN40 on treatment with either a weighted linear model (without RTX group) or with an unweighted model showed that all DMT groups had on average lower values than TFL (table 5). Adjusting for the baseline log-pNfLN40 improved the model substantially, increasing the percentage of the explained variance from 21% to 40%, but did not affect overall estimates. Additional adjustments did not substantially modify these estimates further. Treatment duration was tested but did not have a significant contribution.
Table 5.
Comparison of on-treatment log–neurofilament light in plasma (pNfL)N40 between treatment groups with several statistical linear models, unweighted and adjusted or weighted without and with adjustment
Discussion
Disease pathogenesis in RRMS evolves over years and the availability of a growing number of treatment options creates a need for additional means to assess disease activity and response to treatment, including body fluid biomarkers.8,23 In addition, real-world studies conducted in unselected patient populations can provide important information on questions that cannot be addressed with existing data from randomized controlled trials.24 Along these lines, we explored how pNfL concentrations were distributed in patients with RRMS starting newer DMTs, how this distribution was associated with clinical measures and patient characteristics, and how pNfL concentrations evolved under treatment. Strengths of the study include the possibility to simultaneously compare across multiple treatments in nonrestricted patient groups, but this approach also entails major challenges in balancing out differences in baseline characteristics, since DMT selection is heavily influenced by clinical disease characteristics. Nevertheless, by modeling on relevant variables, we demonstrate that the reduction in pNfL concentrations differs across DMTs, with the largest reduction for ALM and the smallest for TFL. This result is largely in agreement with the perceived effectiveness of the studied DMTs. Still, reductions in pNfL with DMF, FGL, and NTZ were similar even if NTZ generally is considered to have a superior effect on relapses and focal MRI lesions of the 3. This observation may be partly explained by indication bias (i.e., patients with more active disease are started on highly effective drugs); however, an interesting feature with pNfL is that it reflects both diffuse and focal neuroaxonal damage, where it may be speculated whether different DMTs affect these 2 aspects differently, for example based on their capacity to penetrate into the CNS. This will need longer follow-up studies that also integrate quantitative MRI measures. Also, the kinetics of how pNfL is affected might differ across DMTs, necessitating longer follow-up with repeated sampling. Finally, comorbidities affecting the peripheral nervous system or CNS may act as confounders. For example, leflunomide, which is related to TFL, has been shown to affect the peripheral nervous system.25 An additional important finding is that we show how essential the baseline pNfL concentration is for correctly predicting the pNfL concentration on treatment. In fact, the percentage of the variance explained by the baseline concentration (>20%) outsized all other factors. Accordingly, inclusion of the baseline pNfL value affected estimates, increasing the differences in pNfL concentrations between the DMTs. We also find that reductions in pNfL concentrations correlated with improvements in clinical variables, such as EDSS, MSSS, and MSIS-29, though correlation coefficients were low (between 0.10 and 0.30), replicating earlier findings.13,14 Importantly, as shown by recent studies, pNfL concentrations at diagnosis also predict important long-term outcomes, such as brain atrophy and risk to achieve clinical disability milestones.15,26
Whereas our data reveal differences in pNfL dynamics across the studied DMTs, we cannot rule out that differences had been achieved with a more complete model for the PS, even if our additional adjustments did not lead to major changes in the estimates. Notably, however, we did not have access to sufficiently precise MRI data, which are known to affect pNfL.13 A further weakness is imprecise information on some measures, e.g., the lack of coding for switching from NTZ due to positive JC virus serology in the Swedish MS registry. On the other hand, the high general validity of data entered into the Swedish MS registry regarding treatment episodes and relapses was recently confirmed by a large-scale national validation against medical records.27 Furthermore, most patients in the RTX group lacked a baseline sample, which meant that this group was excluded from analyses involving PS and that other analyses including baseline log-pNfLN40 became less precise. Also the proportion of patients missing information for some variables that were used in the adjustment (or in the PS estimation) could also have hampered the power of our study. The observational design of the study implies that patients were not randomized to treatment, nor were they randomly selected within the IMSE cohorts, and therefore some selection bias could have occurred. It is therefore important to relate these findings to studies exploring pNfL concentrations in the context of randomized control trials, even if such studies rarely include more than 2 DMTs.28 As a final note, the extent different DMTs affected pNfL largely mimic their effect on the long-term risk to convert to a secondary progressive disease course, as observed in a large recent real-world study.4 The implementation of soluble but also novel imaging biomarkers that can complement current clinical and imaging monitoring likely will lead to an increased use of more effective DMTs and reduce the risks for patients to be exposed to insufficient treatment responses, in turn improving important long-term clinical outcomes.12,29
We demonstrate that dynamics of pNfL are significantly influenced by specific DMTs and that the degree of pNfL reduction is correlated to clinical and patient-reported outcomes, but also that the baseline pNfL concentration exerts an unproportioned effect on on-treatment values in the medium term. In order to understand if pNfL can be used as a drug response biomarker at the individual level, further studies are needed to address the correlation of pNfL changes to long-term clinical outcomes with different DMTs, as well as if modeling of pNfL dynamics can be improved further by including additional variables such as MRI data or more frequent measurements.
Glossary
- ALM
alemtuzumab
- ARMSS
Age-Related MS Severity Score
- CI
confidence interval
- DMF
dimethyl fumarate
- DMT
disease-modifying therapies
- EDSS
Expanded Disability Status Scale
- FGL
fingolimod
- GA
glatiramer acetate
- IFN
interferon
- IMSE
Immunomodulation and Multiple Sclerosis Epidemiology
- LLoQ
lower limit of quantification
- MS
multiple sclerosis
- MSIS-29
MS Impact Score
- MSSS
Multiple Sclerosis Severity Score
- NfL
neurofilament light
- NTZ
natalizumab
- pNfL
neurofilament light in plasma
- PS
propensity scores
- RRMS
relapsing-remitting multiple sclerosis
- RTX
rituximab
- SDMT
Symbol Digit Modalities Test
- sNfL
neurofilament light in serum
- TFL
teriflunomide
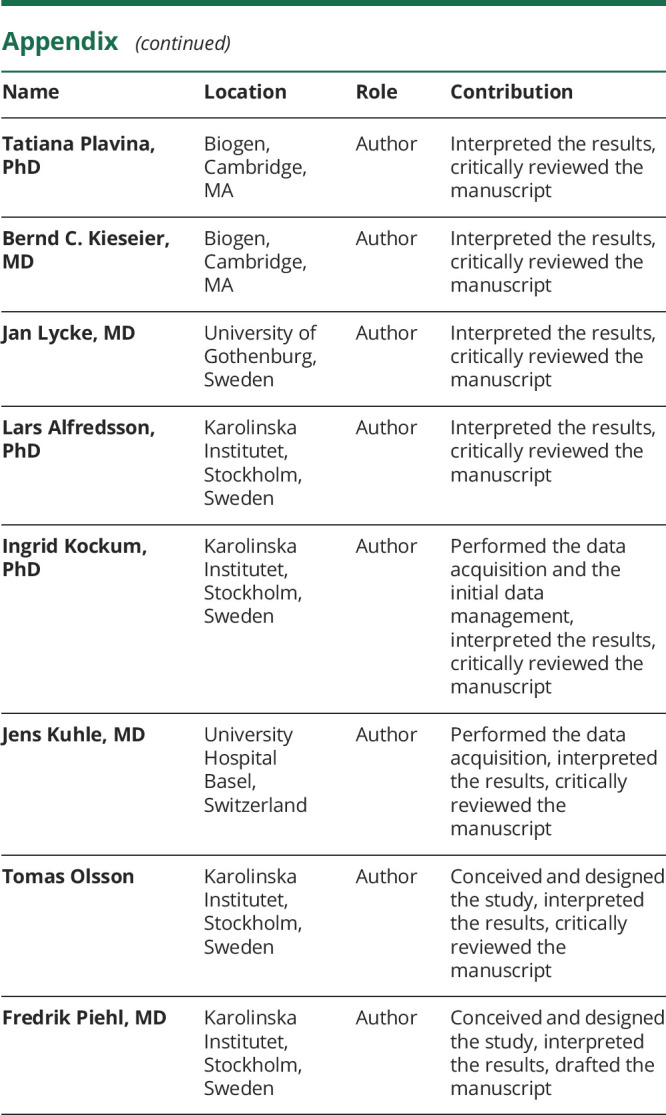
Appendix. Authors

Footnotes
Editorial, page 465
Podcast: NPub.org/8nky7e
Study funding
The IMSE cohorts received grant support from Biogen (IMSE natalizumab and dimethyl fumarate), Genzyme (IMSE teriflunomide and alemtuzumab), and Novartis (IMSE fingolimod). Research grants with partial support to IMSE projects have been received from the Swedish Research Council, the Swedish Research Council for Health, Working Live and Welfare, the AFA Foundation, the Swedish Brain Foundation, and the Knut and Alice Wallenberg Foundation. The cost for NfL analysis of the Epidemiologic Investigation of MS cohort was supported by a grant from EU Horizon 2020 (MultipleMS grant 733161). The costs for analysis of baseline samples from the IMSE projects were defrayed by unrestricted MS research grants from Biogen, Novartis, and Sanofi.
Disclosure
B. Delcoigne reports no disclosures. A. Manouchehrinia has received speaker honoraria from Biogen. C. Barro received conference travel grant from Novartis and Teva. P. Benkert and Z. Michalak report no disclosures. L. Kappos has served in the last 24 months as international or local principal investigator for the following drug studies: BOLD EXT, EXPAND (Siponimod, Novartis), DECIDE, DECIDE EXT (Daclizumab HYP, Biogen), ENDORSE (DMF, Biogen), FINGORETT, FTY-UMBRELLA, INFORMS, INFORMS EXT LONGTERMS (Fingolimod, Novartis), MOMENTUM (Amiselimod, Mitsubishi), OCRELIZUMAB PHASE II EXT, OPERA, ORATORIO and extensions (Ocrelizumab, Roche), REFLEXION (IFN β-1a, Merck), STRATA EXT, TOP (Natalizumab, Biogen), TERIFLUNOMIDE EXT, TERRIKIDS (Teriflunomide, Sanofi-Aventis), and ASCLEPIOS I/II (Ofatumumab, Novartis). The Research of MS Center in Basel has been supported by grants from Bayer, Biogen, Novartis, the Swiss MS Society, the Swiss National Research Foundation, and the European Union. In the last 24 months, the institution also received grants for patient services from Bayer, Merck, and CSL-Behring. L. Kappos is a member of the editorial boards of Journal of Neurology, Multiple Sclerosis Journal, Neurology and Clinical Neuroscience, Multiple Sclerosis and Related Disorders, and Clinical and Translational Neuroscience. Honoraria and other payments for all these activities have been exclusively used for funding of research at the department. L. Kappos’ institution (University Hospital Basel) received the following in the last 3 years, used exclusively for research support at the Department: steering committee, advisory board, and consultancy fees from Actelion, Almirall, Bayer, Biogen, Celgene/Receptos, df-mp, Excemed, Genzyme, Japan Tobacco, Merck, Minoryx, Mitsubishi Pharma, Novartis, Roche, sanofi-aventis, Santhera, Teva, and Vianex and royalties for Neurostatus-UHB products. For educational activities, the institution received payments and honoraria from Allergan, Almirall, Baxalta, Bayer, Biogen, CSL-Behring, Desitin, Excemed, Genzyme, Merck, Novartis, Pfizer, Roche, Sanofi-Aventis, and Teva. D. Leppert reports no disclosures. J.A. Tsai is an employee of Sanofi Genzyme. T. Plavina is an employee of and holds stock/stock options in Biogen. B.C. Kieseier is an employee of and holds stock/stock options in Biogen. J. Lycke has received travel support and/or lecture honoraria from Biogen, Novartis, Teva, and Genzyme/Sanofi-Aventis; has served on scientific advisory boards for Almirall, Teva, Biogen, Novartis, and Genzyme/Sanofi-Aventis; serves on the editorial board of Acta Neurologica Scandinavica; and has received unconditional research grants from Biogen, Novartis, and Teva. L. Alfredsson has received lecture honoraria from Biogen and TEVA. I. Kockum reports no disclosures. J. Kuhle served on scientific advisory boards for Novartis Pharmaceuticals, Merck, Biogen, Sanofi Genzyme, Roche, and Bayer; has received funding for travel and/or speaker honoraria from Biogen, Sanofi Genzyme, Novartis, Merck Serono, Roche, Teva, and the Swiss MS Society; and has received research support from Bayer, Celgene, Biogen, Merck, Sanofi Genzyme, Novartis, Roche, ECTRIMS Research Fellowship Programme, University of Basel, Swiss MS Society, and Swiss National Research Foundation (320030_160221). T. Olsson has received unrestricted MS research grants, advisory board, and/or lecture honoraria from Biogen, Novartis, Sanofi, Roche, Merck, TEVA, and Allmiral. F. Piehl has received research grants from Biogen, Novartis, and Genzyme, and fees for serving as Chair of DMC in clinical trials with Parexel. Go to Neurology.org/N for full disclosures.
References
- 1.Filippi M, Bar-Or A, Piehl F, et al. Multiple sclerosis. Nat Rev Dis Primers 2018;4:43. [DOI] [PubMed] [Google Scholar]
- 2.Tallantyre EC, Bo L, Al-Rawashdeh O, et al. Clinico-pathological evidence that axonal loss underlies disability in progressive multiple sclerosis. Mult Scler 2010;16:406–411. [DOI] [PubMed] [Google Scholar]
- 3.Trapp BD, Stys PK. Virtual hypoxia and chronic necrosis of demyelinated axons in multiple sclerosis. Lancet Neurol 2009;8:280–291. [DOI] [PubMed] [Google Scholar]
- 4.Brown JWL, Coles A, Horakova D, et al. Association of initial disease-modifying therapy with later conversion to secondary progressive multiple sclerosis. JAMA 2019;321:175–187. [DOI] [PMC free article] [PubMed] [Google Scholar]
- 5.Steenwijk MD, Geurts JJ, Daams M, et al. Cortical atrophy patterns in multiple sclerosis are non-random and clinically relevant. Brain 2016;139:115–126. [DOI] [PubMed] [Google Scholar]
- 6.Sormani MP, Arnold DL, De Stefano N. Treatment effect on brain atrophy correlates with treatment effect on disability in multiple sclerosis. Ann Neurol 2014;75:43–49. [DOI] [PubMed] [Google Scholar]
- 7.Eshaghi A, Prados F, Brownlee WJ, et al. Deep gray matter volume loss drives disability worsening in multiple sclerosis. Ann Neurol 2018;83:210–222. [DOI] [PMC free article] [PubMed] [Google Scholar]
- 8.Khalil M, Teunissen CE, Otto M, et al. Neurofilaments as biomarkers in neurological disorders. Nat Rev Neurol 2018;14:577–589. [DOI] [PubMed] [Google Scholar]
- 9.Gunnarsson M, Malmestrom C, Axelsson M, et al. Axonal damage in relapsing multiple sclerosis is markedly reduced by natalizumab. Ann Neurol 2011;69:83–89. [DOI] [PubMed] [Google Scholar]
- 10.Kuhle J, Disanto G, Lorscheider J, et al. Fingolimod and CSF neurofilament light chain levels in relapsing-remitting multiple sclerosis. Neurology 2015;84:1639–1643. [DOI] [PMC free article] [PubMed] [Google Scholar]
- 11.Novakova L, Axelsson M, Khademi M, et al. Cerebrospinal fluid biomarkers as a measure of disease activity and treatment efficacy in relapsing-remitting multiple sclerosis. J Neurochem 2017;141:296–304. [DOI] [PubMed] [Google Scholar]
- 12.de Flon P, Gunnarsson M, Laurell K, et al. Reduced inflammation in relapsing-remitting multiple sclerosis after therapy switch to rituximab. Neurology 2016;87:141–147. [DOI] [PubMed] [Google Scholar]
- 13.Barro C, Benkert P, Disanto G, et al. Serum neurofilament as a predictor of disease worsening and brain and spinal cord atrophy in multiple sclerosis. Brain 2018;141:2382–2391. [DOI] [PubMed] [Google Scholar]
- 14.Disanto G, Barro C, Benkert P, et al. Serum neurofilament light: a biomarker of neuronal damage in multiple sclerosis. Ann Neurol 2017;81:857–870. [DOI] [PMC free article] [PubMed] [Google Scholar]
- 15.Manouchehrinia A, Stridh P, Khademi M, et al. Plasma neurofilament light levels are associated with risk of developing sustained disability in multiple sclerosis. ECTRIMS Online 2018;228223:P378. [DOI] [PMC free article] [PubMed] [Google Scholar]
- 16.Novakova L, Zetterberg H, Sundstrom P, et al. Monitoring disease activity in multiple sclerosis using serum neurofilament light protein. Neurology 2017;89:2230–2237. [DOI] [PMC free article] [PubMed] [Google Scholar]
- 17.Manouchehrinia A, Westerlind H, Kingwell E, et al. Age related multiple sclerosis severity score: disability ranked by age. Mult Scler 2017;23:1938–1946. [DOI] [PMC free article] [PubMed] [Google Scholar]
- 18.Zhang Z. Variable selection with stepwise and best subset approaches. Ann Transl Med 2016;4:136. [DOI] [PMC free article] [PubMed] [Google Scholar]
- 19.Austin PC. An introduction to propensity score methods for reducing the effects of confounding in observational studies. Multivariate Behav Res 2011;46:399–424. [DOI] [PMC free article] [PubMed] [Google Scholar]
- 20.Austin PC, Stuart EA. Moving towards best practice when using inverse probability of treatment weighting (IPTW) using the propensity score to estimate causal treatment effects in observational studies. Stat Med 2015;34:3661–3679. [DOI] [PMC free article] [PubMed] [Google Scholar]
- 21.McCaffrey DF, Griffin BA, Almirall D, Slaughter ME, Ramchand R, Burgette LF. A tutorial on propensity score estimation for multiple treatments using generalized boosted models. Stat Med 2013;32:3388–3414. [DOI] [PMC free article] [PubMed] [Google Scholar]
- 22.Nguyen TL, Collins GS, Spence J, et al. Double-adjustment in propensity score matching analysis: choosing a threshold for considering residual imbalance. BMC Med Res Methodol 2017;17:78. [DOI] [PMC free article] [PubMed] [Google Scholar]
- 23.Comabella M, Montalban X. Body fluid biomarkers in multiple sclerosis. Lancet Neurol 2014;13:113–126. [DOI] [PubMed] [Google Scholar]
- 24.Trojano M, Tintore M, Montalban X, et al. Treatment decisions in multiple sclerosis: insights from real-world observational studies. Nat Rev Neurol 2017;13:105–118. [DOI] [PubMed] [Google Scholar]
- 25.Kim HK, Park SB, Park JW, et al. The effect of leflunomide on cold and vibratory sensation in patients with rheumatoid arthritis. Ann Rehabil Med 2012;36:207–212. [DOI] [PMC free article] [PubMed] [Google Scholar]
- 26.Cantó E, Barro C, Zhao C, et al. Association between serum neurofilament light chain levels and long-term disease course among patients with multiple sclerosis followed up for 12 years. JAMA Neurol Epub 2019 Aug 12. [DOI] [PMC free article] [PubMed]
- 27.Alping P, Piehl F, Langer-Gould A; on behalf of the COMBAT-MS Study Group, et al. Validation of the Swedish multiple sclerosis register: further improving a resource for pharmacoepidemiologic evaluations. Epidemiology 2019;30:230–233. [DOI] [PMC free article] [PubMed] [Google Scholar]
- 28.Kuhle J, Kropshofer H, Haering DA, et al. Blood neurofilament light chain as a biomarker of MS disease activity and treatment response. Neurology 2019;92:e1007–e1015. [DOI] [PMC free article] [PubMed] [Google Scholar]
- 29.Granqvist M, Boremalm M, Poorghobad A, et al. Comparative effectiveness of rituximab and other initial treatment choices for multiple sclerosis. JAMA Neurol 2018;75:320–327. [DOI] [PMC free article] [PubMed] [Google Scholar]
Associated Data
This section collects any data citations, data availability statements, or supplementary materials included in this article.
Data Availability Statement
Data related to the current article are available from Tomas Olsson, Karolinska Institutet. To share data from the Swedish MS registry, a data transfer agreement needs to be completed between Karolinska Institutet and the institution requesting data access. This is in accordance with data protection legislation in Europe (General Data Protection Regulation). Persons interested in obtaining access to the data should contact Tomas Olsson at tomas.olsson@ki.se.


