Abstract
This work introduces a new Lagrangian strain-based model to predict the shear-induced hemolysis in biomedical devices. Current computational models for device-induced hemolysis usually utilize empirical fitting of the released free hemoglobin (Hb) in plasma from damaged red blood cells (RBCs). These empirical correlations contain parameters that depend on specific device and operating conditions, thus cannot be used to predict hemolysis in a general device. The proposed algorithm does not have any empirical parameters, thus can presumably be used for hemolysis prediction in various blood-wetting medical devices. In contrast to empirical correlations in which the Hb release is related to shear stress and exposure time without considering the physical processes, the proposed model links flow-induced deformation of the RBC membrane to membrane permeabilization and hemoglobin release. In this approach, once the steady-state numerical solution of blood flow in the device is obtained under a prescribed operating condition, sample pathlines are traced from the inlet of the device to the outlet to calculate the history of the shear stress tensor. In solving the fluid flow, it is assumed that RBCs does not have any influence on the flow pattern. Along each pathline, shear stress tensor will be input into a coarse-grained (CG) RBC model to calculate the RBC deformation. Then the correlations obtained from molecular dynamics (MD) simulations are applied to relate the local areal RBC deformation to the perforated area on the RBC membrane. Finally, Hb released out of transient pores is calculated over each pathline via a diffusion equation considering the effects of steric hinderance and increased hydrodynamic drag due to the size of the hemoglobin molecule. The total index of hemolysis (IH) is calculated by integration of released hemoglobin over all the pathlines in the computational domain. Hemolysis generated in the Food and Drug Administration (FDA) nozzle and two blood pumps, i.e. a CentriMag blood pump (a centrifugal pump) and HeartMate II (an axial pump), for different flow regimes including laminar and turbulent flows are calculated via the proposed algorithm. In all the simulations, the numerical predicted IH is close to the range of experimental data. The results promisingly indicate that this multiscale approach can be used as a tool for predicting hemolysis and optimizing the hematologic design of other types of blood-wetting devices.
Keywords: Mechanical hemolysis, Lagrangian strain-based model, multiscale modeling, FDA nozzle, CentriMag, HeartMate II
1. Introduction
Hemolysis is recognized by transient or permanent damage to red blood cells (RBCs) that causes hemoglobin (Hb) diffusion/leakage from RBCs. Mechanical, thermal, chemical, and biological factors can all cause blood damage in blood-contacting devices. Mechanical hemolysis occurs when RBCs are transported in flow by various medical devices such as syringe pumps [1], artificial hearts [2], heart valves [3], and bio-printers [4]. The damage is caused by prolonged contact and collision between blood cells and device surfaces as well as regions of high shear stress. Once a RBC is damaged, Hb is released into plasma which in severe cases may lead to renal failure, anemia, arrhythmias, and death. Furthermore, the nitric oxide depletion due to damage can lead to pulmonary hypertension, abdominal pain, and some other physiological dysfunctions [5]. Therefore, it is important to evaluate the blood damage to design safe and optimal medical devices.
In experimental studies, to quantify the RBC damage, the amount of plasma-free Hb (pfHb) is measured by circulating the blood in a loop containing the perfused artificial devices. In this respect, Giersiepen et al. [6] measured shear-induced blood damage in 25 heart valve prostheses. Zhang et al. [7] also utilized new Couette-type blood-shearing devices to study hemolysis. In these studies, some empirical correlations are presented to estimate hemolysis by resorting to curve fitting on experiment data. These correlations were functions of shear stress and exposure time. Due to complicated geometries and operating conditions in different devices, the correlations derived based on these tests are only applicable to that specific device.
Computational fluid dynamics (CFD) is a crucial tool for blood damage evaluation. In medical devices, blood is usually modeled as either homogeneous non-Newtonian [8] or a homogeneous Newtonian fluid [9], [10], instead of being simulated as a dense multiphase suspension [11]. The primary aim of this assumption is to simplify the problem and reduce the computational cost in terms of time and memory. It should be mentioned that non-Newtonian behavior can be neglected either at higher shear rates or in devices at the scale of above few mm [9], [10]. In order to calculate the hemolysis, the CFD results should be related to Hb release. CFD practitioners implement the hemolysis models via one-way coupling in the CFD solvers. In this approach, the shear stress tensor (velocity gradients) obtained from solving the fluid flow inside the device are linked to the RBCs dynamics, while the RBCs have no influence on the variables obtained by CFD simulations [9]. However, there are few studies in which advanced numerical simulation such as immersed boundary method (IBM) [12]–[18] and dissipative particle dynamics (DPD) [19]–[22] are used to model the RBC deformation in a two-way coupling manner. Due to considerably higher computational cost of these methods, they can be used only for microscale configurations rather than actual medical devices.
Hemolysis models can be classified in two ways [9]: 1) stress-based [6], [7], [23], [24] or strain-based [18], [25]–[31] and 2) Eulerian [28], [32]–[35] or Lagrangian [31], [36]–[38]. In stress-based models, instantaneous hemolysis is a direct function of local instantaneous shear stress, while in strain-based models, the calculation of instantaneous hemolysis is related to the deformation of the RBC as a consequence of the shear stress. In Eulerian models, to calculate the hemolysis, an equation is solved on each control volume (CV) or element in the computational domain along with continuity, Navier–Stokes, and probably turbulence equations. On the other hand, Lagrangian approaches calculate the hemolysis over different pathlines obtained from steady-state solution of flow field. It should be mentioned that stress-based model can be used in both Eulerian and Lagrangian context, whereas strain-based model usually does not have the capability of being implemented in Eulerian format [9]. Different methods can result in different amount of index of hemolysis (IH) [10]. More details about different hemolysis models can be found in [9], [10]. Most of the stress-based models are called “empirical models” because they often use a power-law relationship containing empirical parameters dependent on the device and operating conditions. In most of these correlations, the IH is assumed a function of shear stress and exposure time (IH = Aταtβ). It should be mentioned that because simple stress-based models do not have accurate linkage with RBC membrane mechanics, they cannot calculate the IH in the complex flows that often occur in medical devices [39]. On the other hand, the strain-based models should not have any ad-hoc parameters and can be utilized as a predictive tool for hemolysis evaluation. Introducing a truly physical strain-based model is a complex task. Therefore, only few strain-based models can be found in the literature.
Underlying premise in strain-based models is that RBCs are axisymmetric, biconcave, disk-shaped bodies under normal/rest conditions. The shear modulus, bending modulus and elastic compressibility modulus are 6×10⁻³ mNm−1, 2×10⁻¹⁹ Nm and 400 mNm−1 respectively [40]. Therefore, RBCs are yielding to shearing and bending but considerably resistant to areal stretching. In blood flow, RBC membrane deforms due to fluid-induced viscous forces and increasing tension. At lower tension, the membrane can deform without areal dilation, because RBCs have nearly 40% extra surface area as compared to a sphere encompassing the same volume [40]. As tension rises and area strain goes up, the formation of membrane pores becomes energetically favorable. Pores can relax the membrane tension and quickly reach a stable configuration. Higher deformation and pore nucleation can happen up to the critical area strain for membrane rupture. Transient permeabilization of biological membranes under the action of strong flows was demonstrated by the uptake of molecules with the diameter in the range of nanometer [41]. Also AFM observations [42] of unbroken/un-ruptured RBCs after shearing showed altered membrane morphology along with an increase in pfHb concentration.
The first Lagrangian strain-based model was proposed by Arora [25], [29], [30]. In this model, the RBC is considered as a deformable droplet in the flow. A symmetric, positive-definite second order morphology tensor is defined to represent the shape and orientation of the droplet. The arrays of this tensor are functions of strain tensor and vorticity tensor of the flow field over the pathlines. This model is not completely physical because the IH is calculated using a power-law correlation containing some empirical coefficients [25], [29], [30]. After Arora, three groups tried to introduce more physical strain-based models. In 2014, a more comprehensive multiscale strain-based model was proposed by Vitale et al. [31] where they assumed the nucleation of pores is dictated by the membrane energy landscape of the perturbation. Assuming pores relieve the tension and minimize the total free energy, they derived analytical expression for pore radius and density under shear rates ranging from 4000 s−1 to 42,000 s−1. The model was used to calculate IH in a pure shear flow as well as the IH over a few pathlines for flow inside a curved pipe grafted to a straight channel. In another study, instead of using a droplet model for the RBC, Ezzeldin et al [43] proposed a coarse-grained (CG) model of the RBC to model the lipid membrane and the spectrin cytoskeleton. This model allowed computing more complicated shape change and not only the symmetric elongation of a droplet in Arora and Vitale’s models. The performance of the model was tested by calculating the IH in pure shear flow as well as flow on some pathlines inside a heart valve. More recently, Sohrabi and Liu [18] presented a multiscale strained-based model to calculate the hemolysis in simple shear flows. In contrast to other strain-based models, the model proposed in our previous study [18] does not have any empirical/ad-hoc parameters dependent on the device and operating conditions. In this model, RBC transient pore was a function of the local strain of the RBC membrane. To calculate the pore radius, molecular dynamic (MD) correlations were used. Hb transferred through the pores was calculated by introducing a diffusion equation. The IH obtained by this model was in the range of Vitale et al. model [31] for pure shear flow.
In this paper, we extend the strain-based model proposed in our previous study [18] to calculate the hemolysis for complex flows in three medical devices. To the best of our knowledge, Lagrangian strain-based models have rarely been used in full-scale CFD studies of real medical devices until now. In the following sections, we will first present different components of the numerical algorithm. Afterwards, we predict the IH generated in the Food and Drug Administration (FDA) nozzle, a CentriMag blood pump, and HeartMate (HM) II for different flow regimes using the developed model.
2. Numerical Algorithm
An overview of the numerical algorithm is shown in Figure 1. In this algorithm, after getting the geometry, a proper computational grid is generated. Then, the steady-state solution of the flow filed is obtained via a CFD solver. In solving the blood flow, we assume that the RBC does not have any effects on the flow field. Following solving the flow field, a number of pathlines (npathlines) from inlet (at t = 0) to the outlet (at t = texit) of the device is chosen and the history of the shear rate tensor is recorded over these pathlines. The shear rate tensor is then applied on a CG model of the RBC to obtain the equilibrium strain distribution over the pathline (t ≤ texit). Afterwards, the strain distribution is related to the size of temporary pores on the RBC membrane using a damage model derived by MD simulations. The Hb released out of the pore is consequently calculated using a diffusion equation. CFD solver, RBC model, damage model, and Hb release model are four main components of the numerical algorithm. In the following subsections, these components are explained in detail. It is worth mentioning that because of using CFD solver at the device scale, CG for the RBC modeling and a MD-based damage model at the cell scale, the proposed approach can be considered as a multiscale algorithm (Figure 2).
Figure 1:
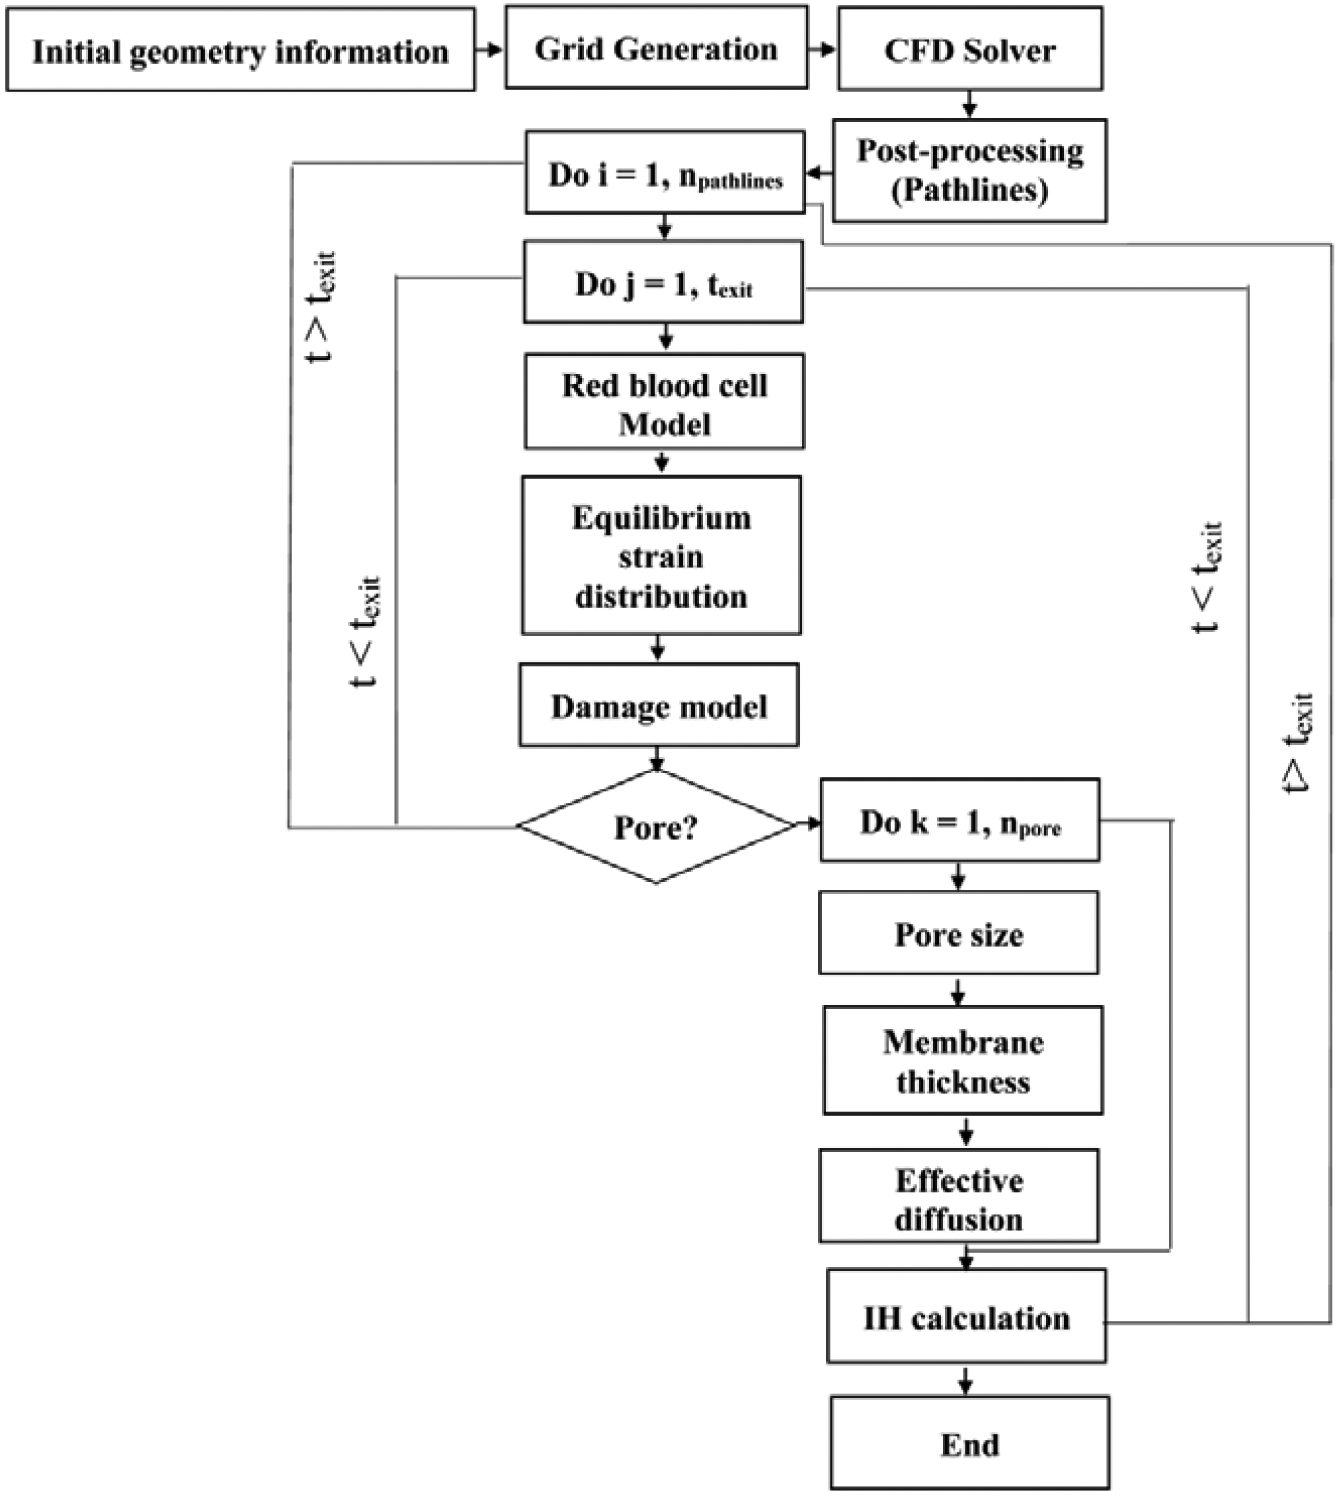
Flowchart of the numerical algorithm.
Figure 2:
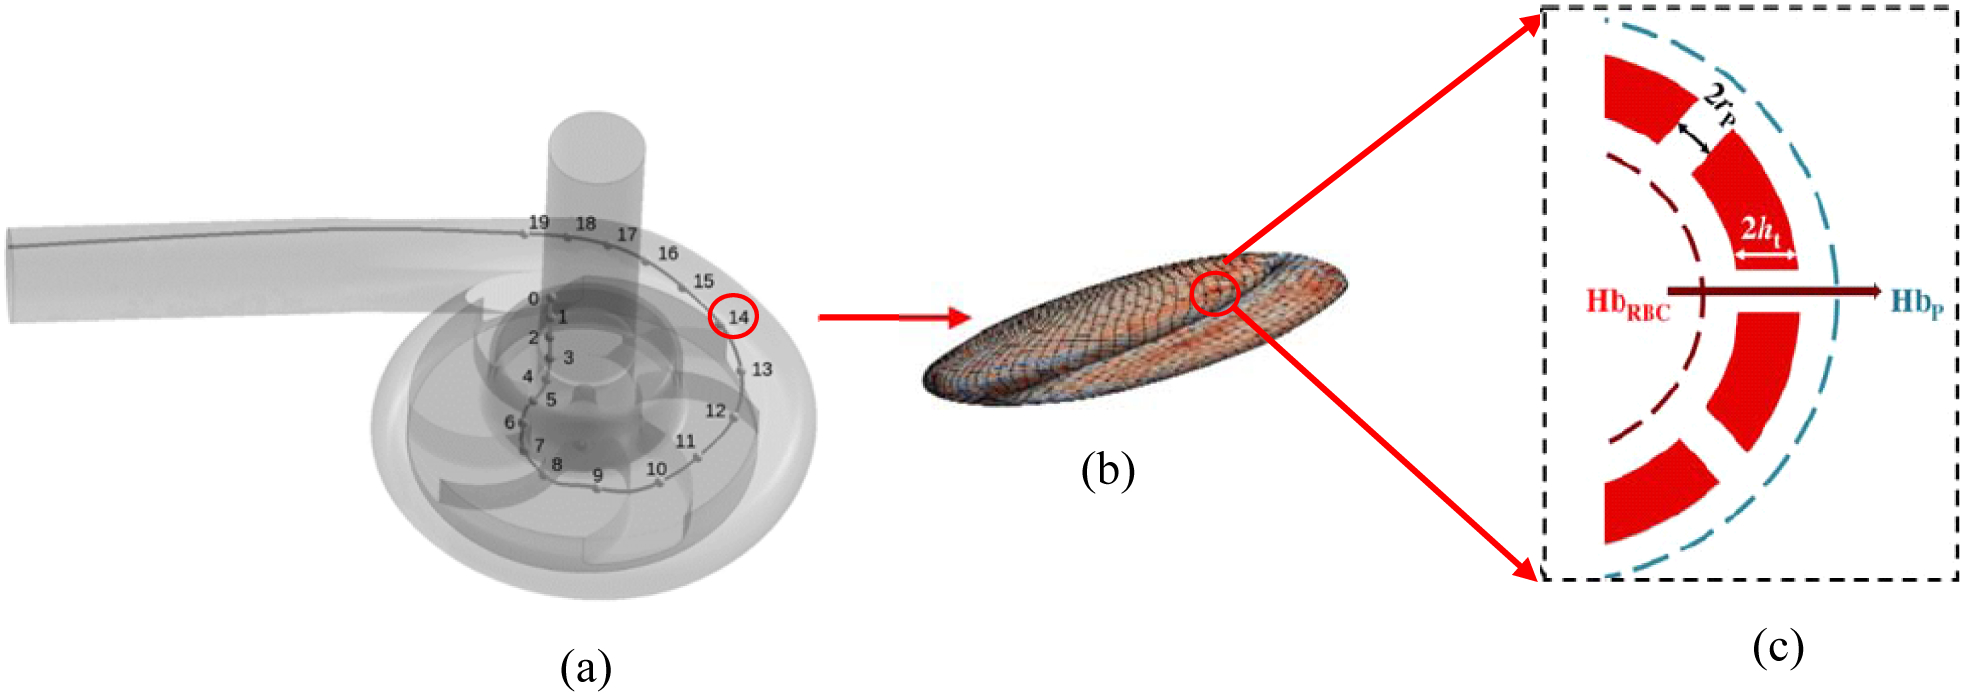
The summary of multiscale cell damage model: (a) A sample pathline obtained from solving blood flow in a medical device without considering the RBCs, (b) local strain distribution and nanopore formation on the RBC surface as a result of applying blood flow forces, (c) Hb diffusion out of porated regions.
2.1. CFD Solver
In this study, finite volume software ANSYS-Fluent 19.2 is used as the CFD solver. In all the simulations, blood is considered as an incompressible Newtonian fluid with a viscosity of 3.6 cP (kinematic viscosity of 3.43 cSt) and a density of 1050 kg/m3 [10], [33], [44]–[46]. Newtonian assumption is reasonable since hemolysis usually happens when shear rates is relatively high (> 100 s−1) [44]. Shear stress transport (SST) k-Ω turbulence model is used since it has good performance when we have adverse pressure gradients and separating flow [44]. The semi-implicit method for pressure-linked (SIMPLE) algorithm is used for pressure-velocity coupling [10]. Moreover, second order upwind scheme is used to discretize convective terms in all the equations. In this study, the RBCs do not have any influence on the flow field. Flow fields are considered convergent when the residuals of the continuity, momentum and turbulence equations are below 10−3, the difference between the flow rates at the inlet and outlet is less than 5%. For the complexity of the flow inside pumps with rotating impellers, it sometimes is difficult to achieve much smaller residuals. In all the test cases, after obtaining the steady-state flow field solution, the stress tensor over the pathline is calculated and used as the input for the CG model of the RBC at each point on the corresponding pathline. It should be noticed that after solving the flow field in the device, it is impossible to predict how many sample pathlines are required for calculating the hemolysis in the device. This process is carried out by trial and error. To do this, first based on the volume of the device, value of Hematocrit (0.3–0.4) and the volume of the RBC (95 μm3), the total number of RBCs available in the device are calculated. Then, we release a number of sample particles with uniform distribution from the inlet and record the shear stress history along the corresponding pathlines. Using the recorded data, the hemolysis of a single RBC is calculated on each pathline. Because RBCs inclined to move in high velocity areas, the total number of RBCs assigned to each pathline is determined based on the initial/inlet velocity of the sample pathline. In our simulation, to calculate the total Hb release in the device, the Hb release calculated for each pathline are multiplied by the number of RBCs on that pathline and added together. We perform this procedure for different number of sample pathlines/particles till our results become independent of the number of pathlines.
2.2. CG RBC Model
In this study, we consider RBC as a biconcave membrane [12]–[18] (Figure 3). The RBC membrane is discretized using vertices which are connected by edges to form surface triangles. It should be mentioned that we have tried the RBC with 1280, 5120 and 20480 triangulated meshes for calculating the IH in all the test cases. We observed that refining the grid more than 5120 generates less than 5% difference in the final results. Therefore, Nt = 5120 faces was chosen for all the simulation in this study. The RBC responses to the deformations induced by external forces are formulated using a set of forces including area force, volume force, link force, and bending force [21]. These forces are defined as follows [21]:
| (1) |
| (2) |
| (3) |
| (4) |
where L, θ, A and V are the edge length of surface element, angle between two neighboring surface elements, triangulated patch area and RBC volume respectively. The 0 index stands for the equilibrium value for each variable which are obtained right after generating an equilibrate state for the RBC when we do not have any external force. It should be noted that for small deformations, these forces are all linearly dependent on different RBC deformation modes via independent coefficients (kl, kb, ka, kv), however in enough large deformations, the cytoskeleton effect (τl, τb, τa, τv) is considered in calculating these forces [21]. The link force acts along segments between surface points and represents the response to stretching and compression of the underlying spectrin-network beneath the representative link. The bending force acts between two neighboring surface elements representing the bending response of the membrane arising primarily from the non-zero thickness of the spectrin network. The local areal force acts locally on surface elements (i.e., triangles) and has the same form. It represents the combined surface response of the supporting spectrin network and the lipid bilayer of the membrane to stretching and compression. The volume conservation force is the only global term. It is used to maintain quasi-incompressibility of the cell. It is applied at each node of each surface element and it points toward the normal of the surface. The kinematics for stretching and bending of the spring network is shown in Figure 3 (b). The properties of the RBC as well as the values of different parameters used in CG model (Eqs. (1)–(4)) are listed in Table 1. It should be mentioned that independent coefficients (kl, kb, ka, kv) must be set in a way to reproduce the RBC with realistic mechanical properties (Young’s modulus, shear modulus and Poisson’s ratio). These parameters are dependent on the RBC computational grid. The parameters related to cytoskeleton effect (τl, τb, τa, τv) should also be set such that they can prevent the RBC model from unphysical changes. More details about these forces can be found in [21].
Figure 3:

(a) computational grid and sample local normal vectors for triangular patches, (b) 2D illustration of kinematics for stretching and bending in spring connected network.
Table 1:
RBC properties and different parameters used in the CG RBC model.
| Parameter | Value |
|---|---|
| RBC area | 135.00 μm2 |
| RBC volume (V0) | 95.00 μm3 |
| Equilibrium length (L0) | 0.247 μm |
| Persistence length (p) | 7.5 nm |
| kBT | 4.100531391×10⁻²¹ m2kg/s2 |
| kl | 9.00 kBT |
| kb | 50.00 kBT |
| ka | 5.00 kBT |
| kv | 20.0 kBT |
| τl | 3.00 |
| τb | 0.523 (π/6) |
| τa | 0.3 |
| τv | 0.01 |
The forces transmitted from fluid to the RBC membrane can be obtained by dot product of the shear stress tensor (τ) recorded over each pathline at a specific point and unit normal vector to each triangular plaquette of the RBC membrane (Figure 3) as follows:
| (5) |
in which u, v, and w are mean velocities in x, y and z directions respectively. μ is the blood dynamic viscosity. In this study, we considered only mean shear stress and did not include the turbulence effect in our model. The turbulence effects have been shown to contribute to hemolysis [47]–[50]. It has been shown that energy dissipation is a more appropriate metric than Reynold stress for evaluating hemolysis in turbulent flows [47]–[50]. Improperly modeling the turbulence effect leads to either overpredict or underpredict the hemolysis [47]–[50]. Incorporation of the turbulence effect on the RBC deformation is challenging and will be invested in the future. To the best knowledge of the authors, the turbulence effects have not been analyzed in Lagrangian strain-based models yet [25], [29]–[31], [43]. Fflow is applied on the centers of the triangular elements. Afterwards, they are distributed equally across the participating nodes of each element to compute the nodal forces (Figure 4) [43]. It is worth mentioning that Fflow is applied on each triangle, and the direction of the force is determined based on the direction of unit vector of each plaquette (Figure 4). Therefore, each vertex point will be influenced by the forces applied on the triangular plates in which those points are common. The force distribution on the RBC surface is uneven because the resultant force on each nodal point is different. In this strategy, the local areal strain of the RBC does not depend on the RBC orientation and hence it does not affect the hemolysis calculation.
Figure 4:
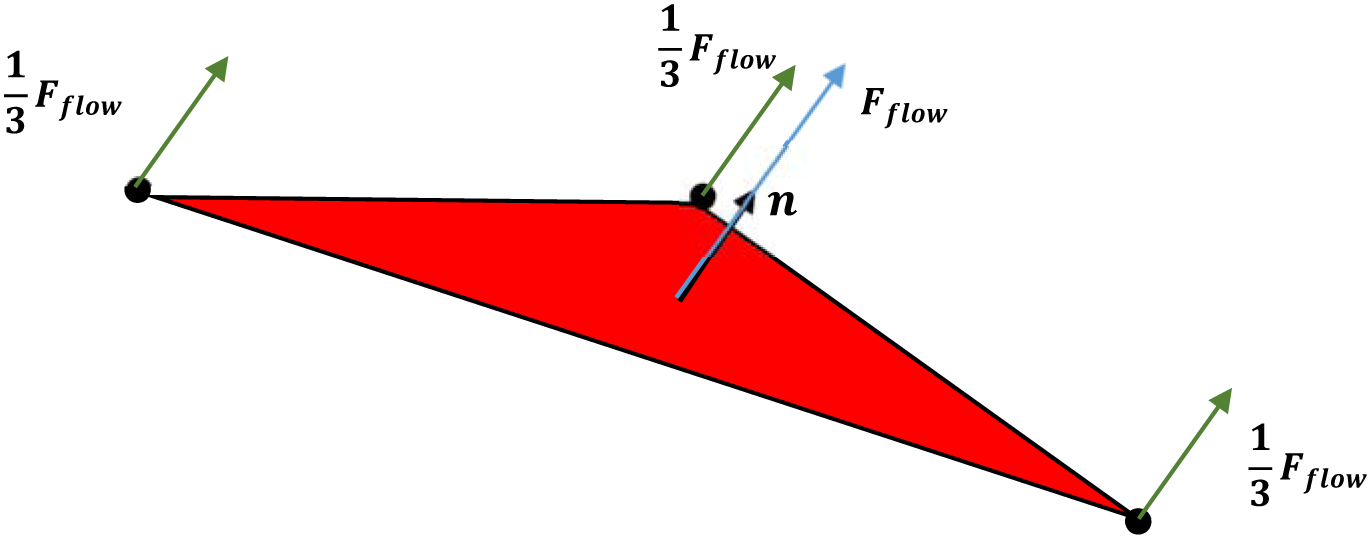
Distribution of fluid froce on the pathline at a specific point on a triangluated element in the RBC model.
The above forces generate the complete force frame under which the RBC model can deform obeying Newton’s equations of motion as below:
| (6) |
| (7) |
Where fi is all the forces acting on a single vertex. The evolution of the vertex points is modeled by numerically integration of Eqs (6) and (7). There are some techniques to carry out these integration process. The modified Verlet scheme [51] are used in this paper. In this integration scheme, the velocities of the particles (vi(t)) are updated twice each time step, while the forces, which are more time-consuming parts, are only calculated once. This scheme can be formulated as follows:
| (8) |
| (9) |
| (10) |
| (11) |
where λ is a weighting factor that specify the step at which the intermediate velocity correction should be taken into account. In this paper, usually λ is taken equal to 0.5 to update the velocities at half the time step which is usually 10−7 s ≤ Δt ≤ 10−6 s. The integration process is kept continuing until the spring network reaches the equilibrium. The integration process is carried out for all the (time) points on the pathline and CPU time for solving this system depends on the external force field applied to the CG model. More complex and higher shear stress need more CPU time. To evaluate the accuracy of the CG model, we simulate RBC stretching and relaxation experiments. In the stretching experiment, a pair of force ranging from 0 to 200 pN is applied to 5% of the total nodes on each side of the cell membrane. The stretch response of the RBC is measured by calculating the axial (DA) and transverse (DT) diameters of the stretched RBC. Figure 5 (a) shows that our selected parameters for CG model listed in Table 1 can reproduce the stretching behavior of a single RBC with good accuracy in agreement with the experimental data [52]. For the recovery test, we measure how the RBC structure changes from a deformed state by 7 pN to an equilibrium discocyte shape. In this case, the RBC relaxation behavior is evaluated by calculating the elongation index which is defined as follows [43]:
| (12) |
where D is the instantaneous axial diameter of the RBC at a given time t, D0 is the diameter of the RBC at the instant of removing the load, and Dinf is the un-deformed diameter of the RBC. As Figure 5 (b) shows, the numerical results are quite close to the experimental data [53].
Figure 5:
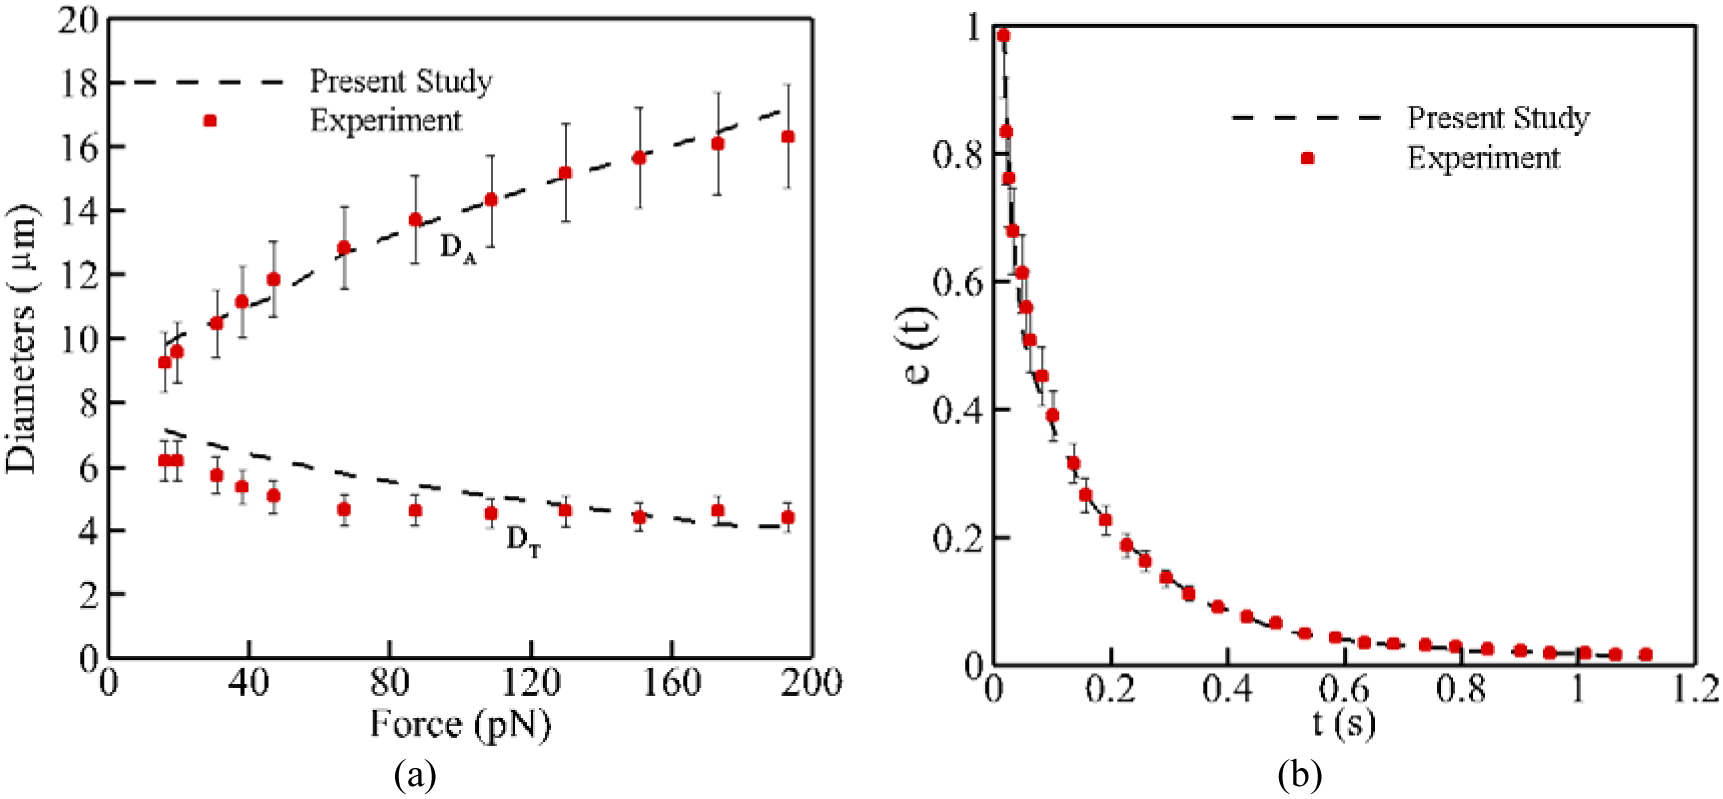
RBC model validation: (a) stretch test, (b) relaxation test at 7 pN.
2.3. Damage Model
Having obtained the equilibrium strain distribution on the RBC membrane, we need to relate the local areal strain to the pore size on the RBC membrane. To the best of our knowledge, all previous strain-based hemolysis studies are based on global areal strain [25], [29]–[31], [43]. Our sublytic damage model is based on hindered Hb release out of pores formed in critical regions. We also assume that pores do not grow bigger than spectrin length [18]. Pore formation at the molecular level is a statistical phenomenon [54]. Many researchers have performed MD simulations to analyze the pore structure in the lipid bilayers [55]–[58]. Among them, Koshiyama and Wada [54] modeled pore formation dynamics under various stretching speeds. Similar to our previous study [18], we assume that the membrane stretch can be considered as quasistatic (QS) in extreme cases of sublytic hemolysis. Therefore, the average chance of pore formation as a function of areal strain can be presented using an error function to demonstrate the ratio of patches containing pores to total number of patches [54]:
| (13) |
where and σ = 0.07 are mean and variance of critical areal strain respectively [18]. The next part of the damage model is to link the RBC areal strain to pore size. Tolpekina et al [56] used CGMD to stretch a lipid bilayer patch up to 1.7 of its equilibrium area. They presented the phase diagram of pores and identified regions where pores are stable. Based on these findings, the below theoretical model is used to correlate pore radius, Rpore, and areal strain:
| (14) |
in which A0 is the area of the tensionless membrane without a pore; KA = 250 mJ/m2, is the compressibility modulus of membrane; and kc = 3.5 × 10⁻¹¹ J/m is the line tension coefficient.
2.4. Hemoglobin Release
Once the pore radius is large enough, Hb can be released. The Hb flux out of pores on each triangulated mesh can be calculated as follows [18]:
| (15) |
where L is RBC membrane thickness, HbRBC and Hbp are the intrxxxxacellular and plasma Hb concentrations, respectively; Vp is the volume of plasma; Deff is the effective diffusion coefficient of Hb out of nanopores; and Apore is the pore opening area. Vp, HbRBC, and index of hemolysis (IH) are expressed as follows:
| (16) |
in which HbB is the total Hb blood. Using Eq. (16), Eq. (15) can be rewritten as follows:
| (17) |
It can be assumed that initially there is no Hb in the plasma, i.e. , so Eq. (17) can be simplified as follows:
| (18) |
where IH is hemolysis index, Hct is the blood hematocrit varies between 0.3 and 0.4 in this study, and VRBC is the RBC volume. Here Δt is the time step on the pathline which is set by the CFD solver automatically such that the particles cannot skip any of the elements along the pathline. Deff and L are Hb diffusion coefficient and RBC membrane thickness which can be determined based on the local areal strain (εA). More details in this respect can be found in our previous paper [18]. Koshiyama and Wada [54] demonstrated how membrane thickness at porated regions changes by areal strain, which is directly implemented into our model [18]. Also, due to Hb high concentration inside RBC, its self-diffusion coefficient is six times smaller compared to that in dilute solution. Doster and Longeville [59] experimentally showed the self-diffusion coefficient of Hb in RBC as 1.75×10⁻⁷ cm2/s, while its diffusion coefficient in dilute solution is reported as 8.61×10⁻⁷ cm2/s. Moreover, during sublytic hemolysis, Hb diffuses out of temporary small nanopores. The effective diffusion coefficient of these macromolecules through pores of comparable size is usually much lower than their value in bulk solution. Hb transverse diffusion, known as “hindered” or “restricted” diffusion, is caused in two ways. First, steric and long-range interactions between Hb and pore wall in lipid bilayer tend to exclude Hb from some radial positions within the pores. Second, hydrodynamic drag on Hb molecule rises due to confined space of the pore. The details of calculating the effective diffusion for our model can be found in [18]. Finally, the total index of hemolysis (IH) is obtained by integration IH (t) over all the pathlines in computational domains. The value of Hb released over each pathline is multiplied by RBC number on the corresponding pathline and add together to obtain the total IH in the device.
3. Results and Discussion
In order to assess the performance of the proposed algorithm, two types of test cases are solved in this section and the numerical results are compared with experimental studies. The first test case is to model the hemolysis inside the FDA nozzle for different flow regimes which is a stationary device without moving parts. In the second type, the hemolysis in two clinical blood pumps (a centrifugal blood pump - CentriMag and an axial blood pump - HeartMate (HM) II) is computed. In all test cases studied, computations were performed using a PC computer with a 3.2 GHz Intel Core-i7 CPU and 16.0 GB RAM.
3.1. FDA Nozzle
FDA has made tremendous efforts to benchmark and establish standards to evaluate blood damage in medical devices [60]–[63]. The FDA nozzle is a benchmark device issued in the context of “Critical Path Initiative program” [63]. The geometry of this nozzle is depicted in Figure 6 (a). While FDA geometry is simple, it contains all the features often happen in medical devices including flow contraction and expansion, recirculation zones etc. The computational grid (Figure 6 (b)) used for this test case is comprised of 1,393,562 hexahedral elements which has been refined near the nozzle walls such that they can meet y+ condition (y+ < 1) for the turbulent model and capture the high velocity gradient in this region. To evaluate the capability of the algorithm at different flow regimes, four different flow conditions have been tested, as listed in Table 2. For the boundary conditions, a parabolic velocity profile is applied at the inlet for each flow rate. No-slip boundary condition is applied for the walls and outflow boundary condition for the outlet. The velocity profile on the nozzle centerline of the blood flow with the Reynolds number (Re) of 6500 is shown in Figure 7 for different numbers of elements. As this figure shows, increasing the mesh density more than 1,393,562 does not change the results considerably (less than 2%).
Figure 6:
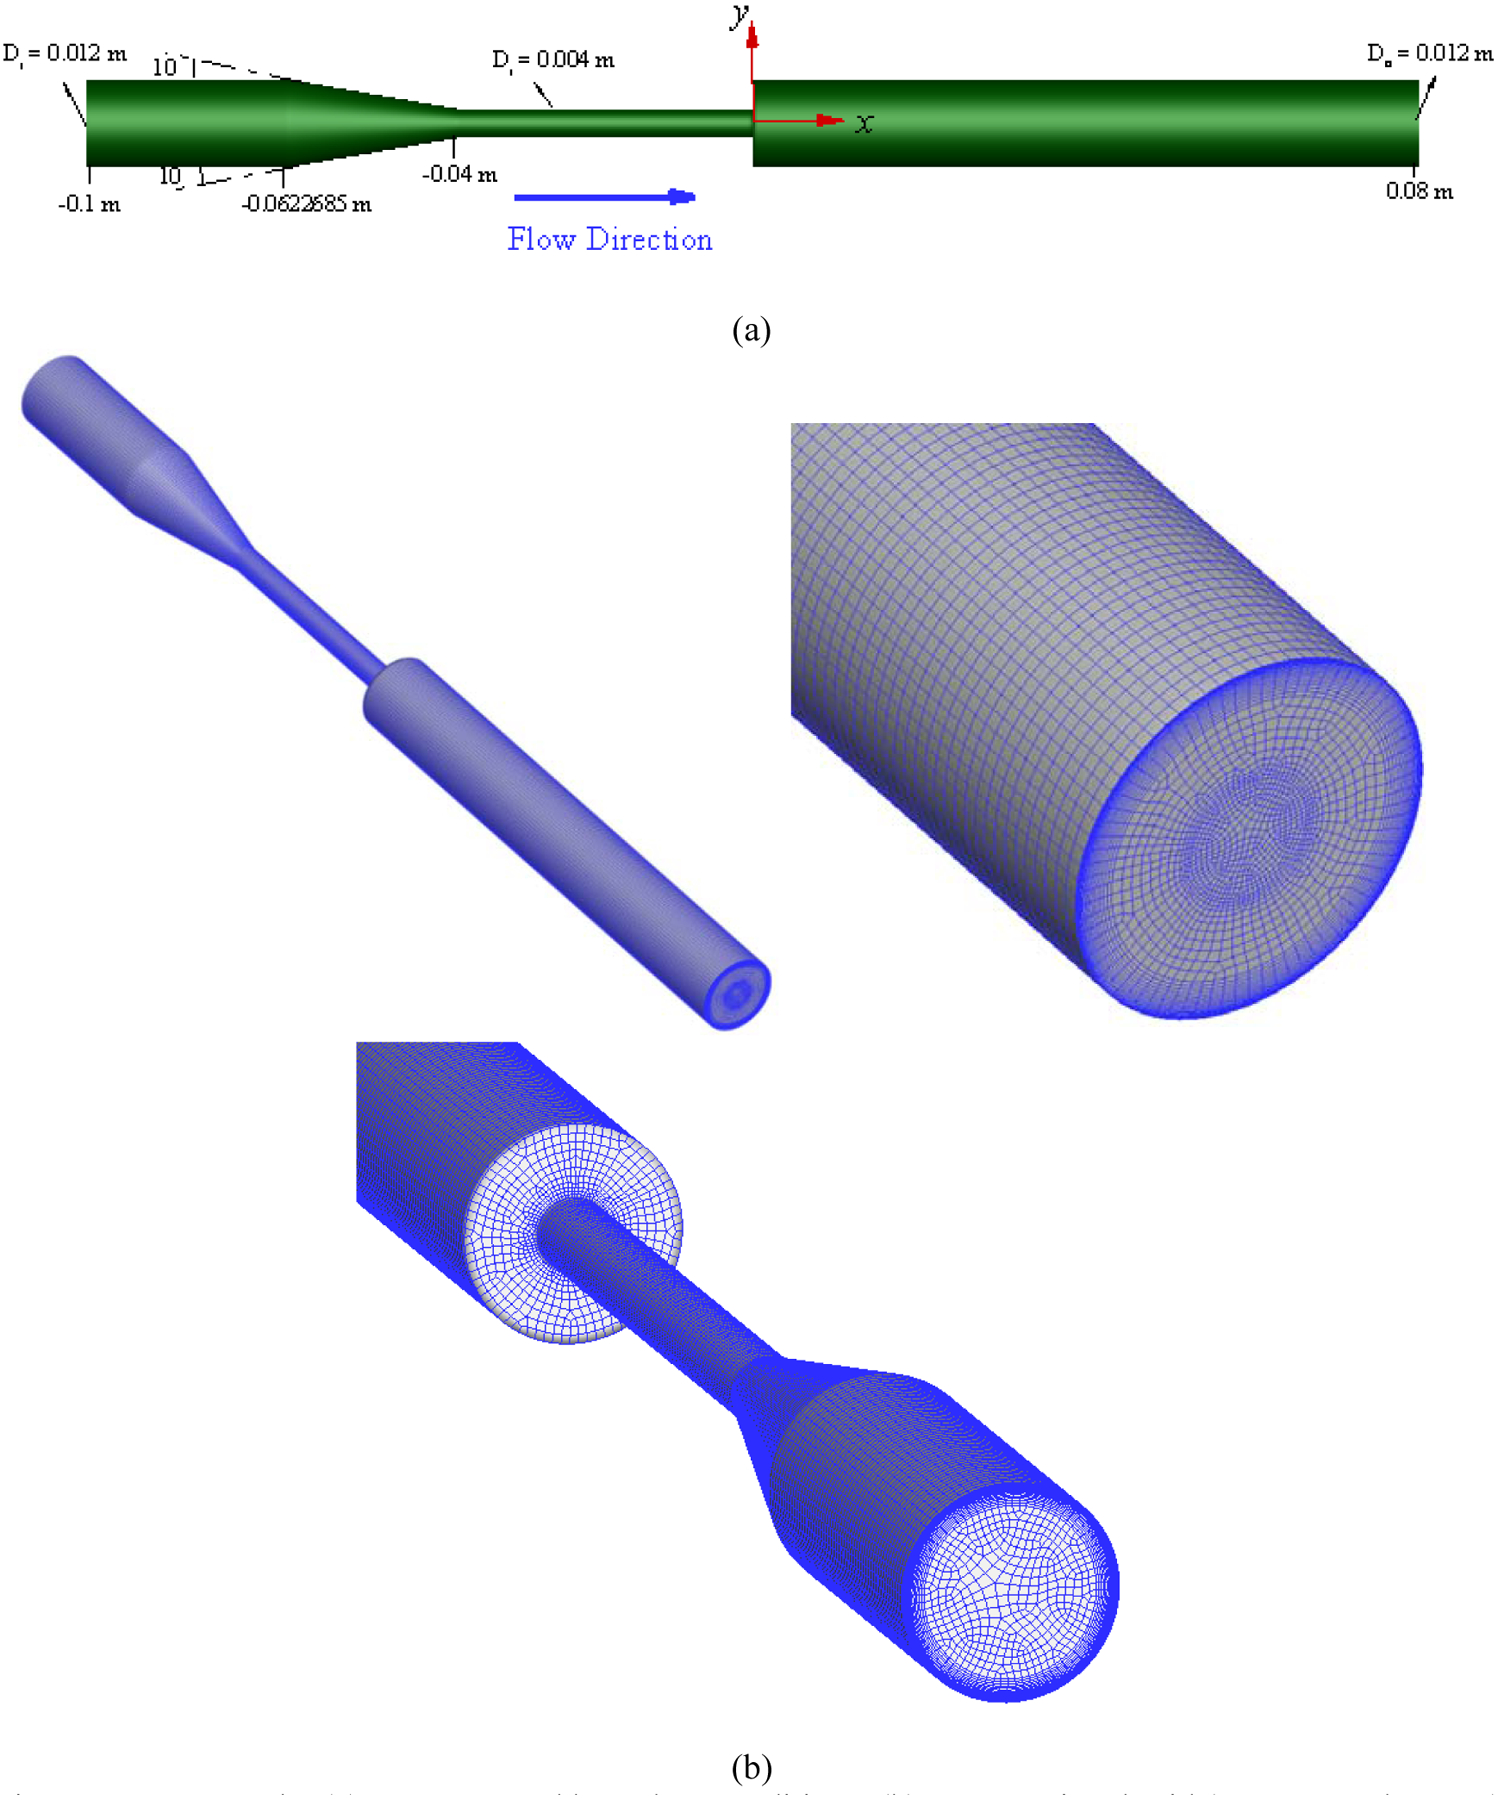
FDA nozzle: (a) geometry and boundary conditions, (b) computational grid (1,393,562 elements).
Table 2:
Flow regimes considered in FDA nozzle.
| Throat Reynolds Number (Re = 4ρQ/πdμ) | Re = 500 | Re = 3500 | Re = 5000 | Re = 6500 |
|---|---|---|---|---|
| Flow rate (m3/s) (Q) | 5.21×10⁻⁶ | 3.64×10⁻⁵ | 5.21×10⁻⁵ | 6.77×10⁻⁵ |
| Flow regime | Laminar | Turbulent | Turbulent | Turbulent |
Figure 7:
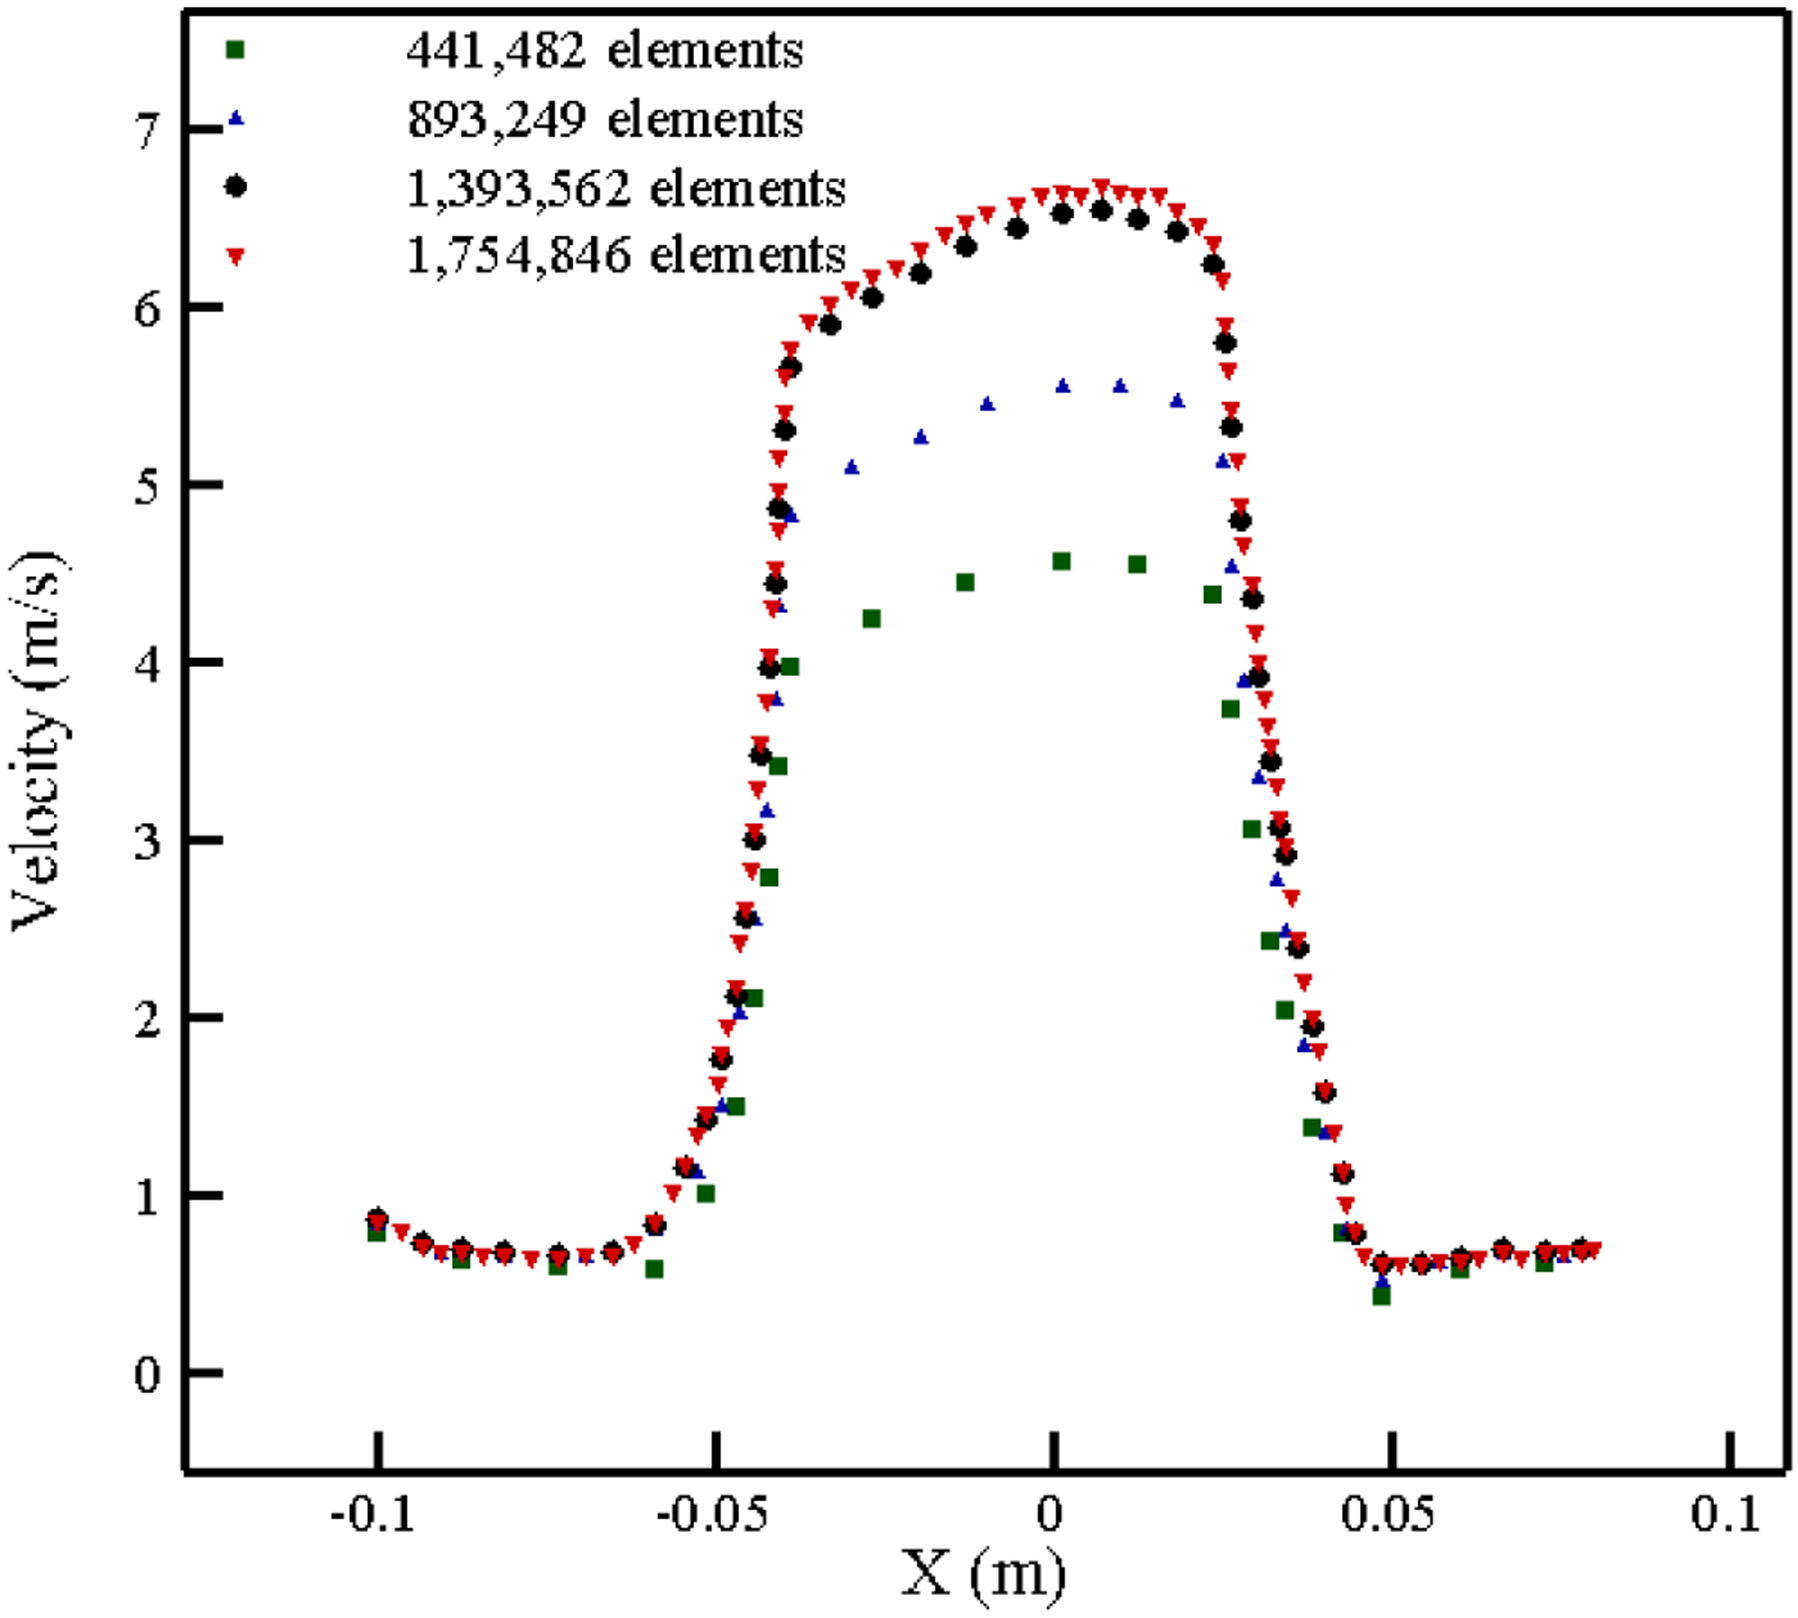
Grid independency study for the FDA nozzle at Re = 6500.
As explained previously, the deformation of the RBCs is computed along pathlines extracted after convergence of the steady-state CFD simulation. Figure 8 shows 1635 pathlines equally spaced along the inflow surface for each configuration listed in Table 2. As Figure 8 shows, the recirculation area due to sudden expansion becomes larger by increasing Reynolds number which is in agreement with the results in [64]. Comparison between our CFD results and two series of experimental results [65], [66] in the form of the velocity profile along the centerline is illustrated in Figure 9. Fairly good agreement is observed between our CFD simulation and experimental results. It should be noted that the vertical scale widely differs for each subfigure.
Figure 8:
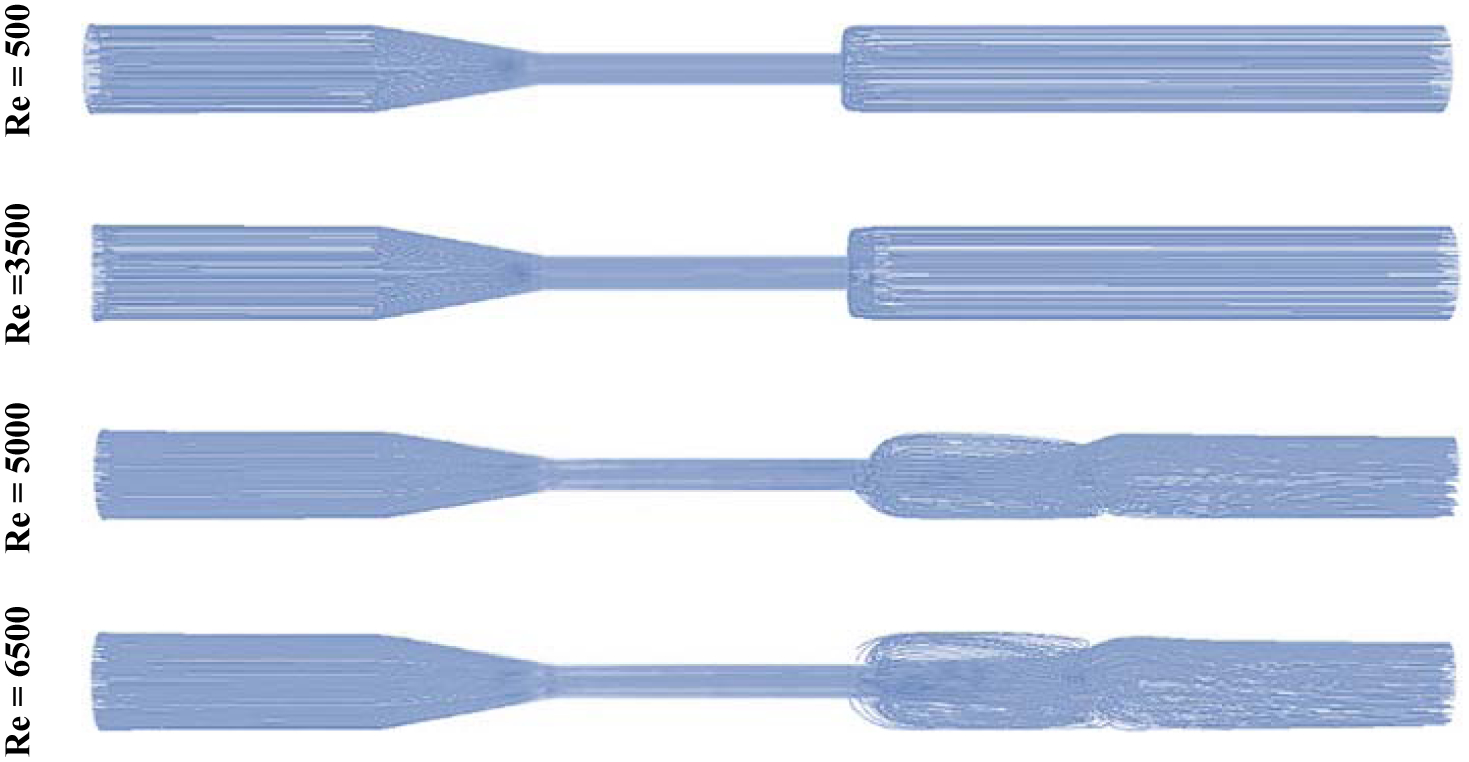
1635 pathlines in FDA nozzle for different flow regimes.
Figure 9:
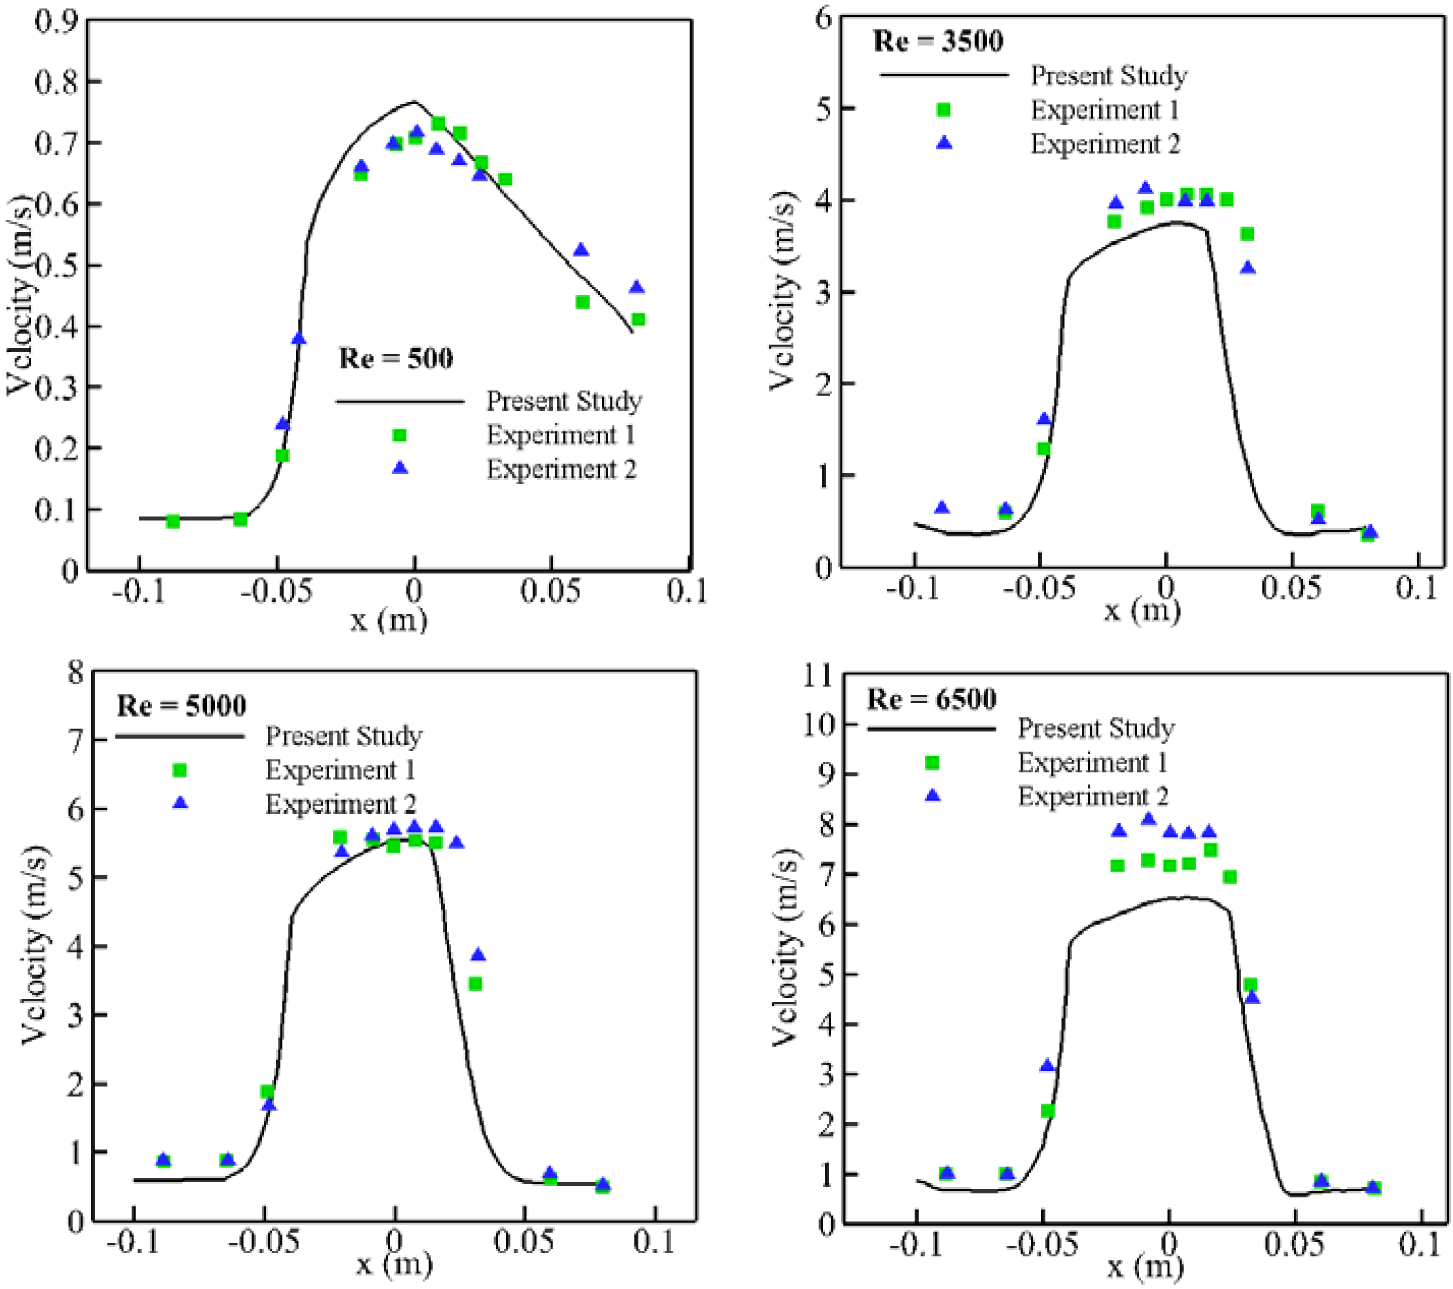
Comparison between CFD simulation and experimental studies for FDA nozzle at different throat Reynolds number.
Also, it should be mentioned that steady CFD simulation (our model for FDA nozzle) are not able to precisely solve the flow fields in the sudden expansion or contraction regions (flow separation) under highly turbulent conditions. Therefore, we observe greater difference at higher Re number. Moreover, observed discrepancies between numerical and experimental results particularly for Re = 6500 are similar to the differences between two experimental measurements.
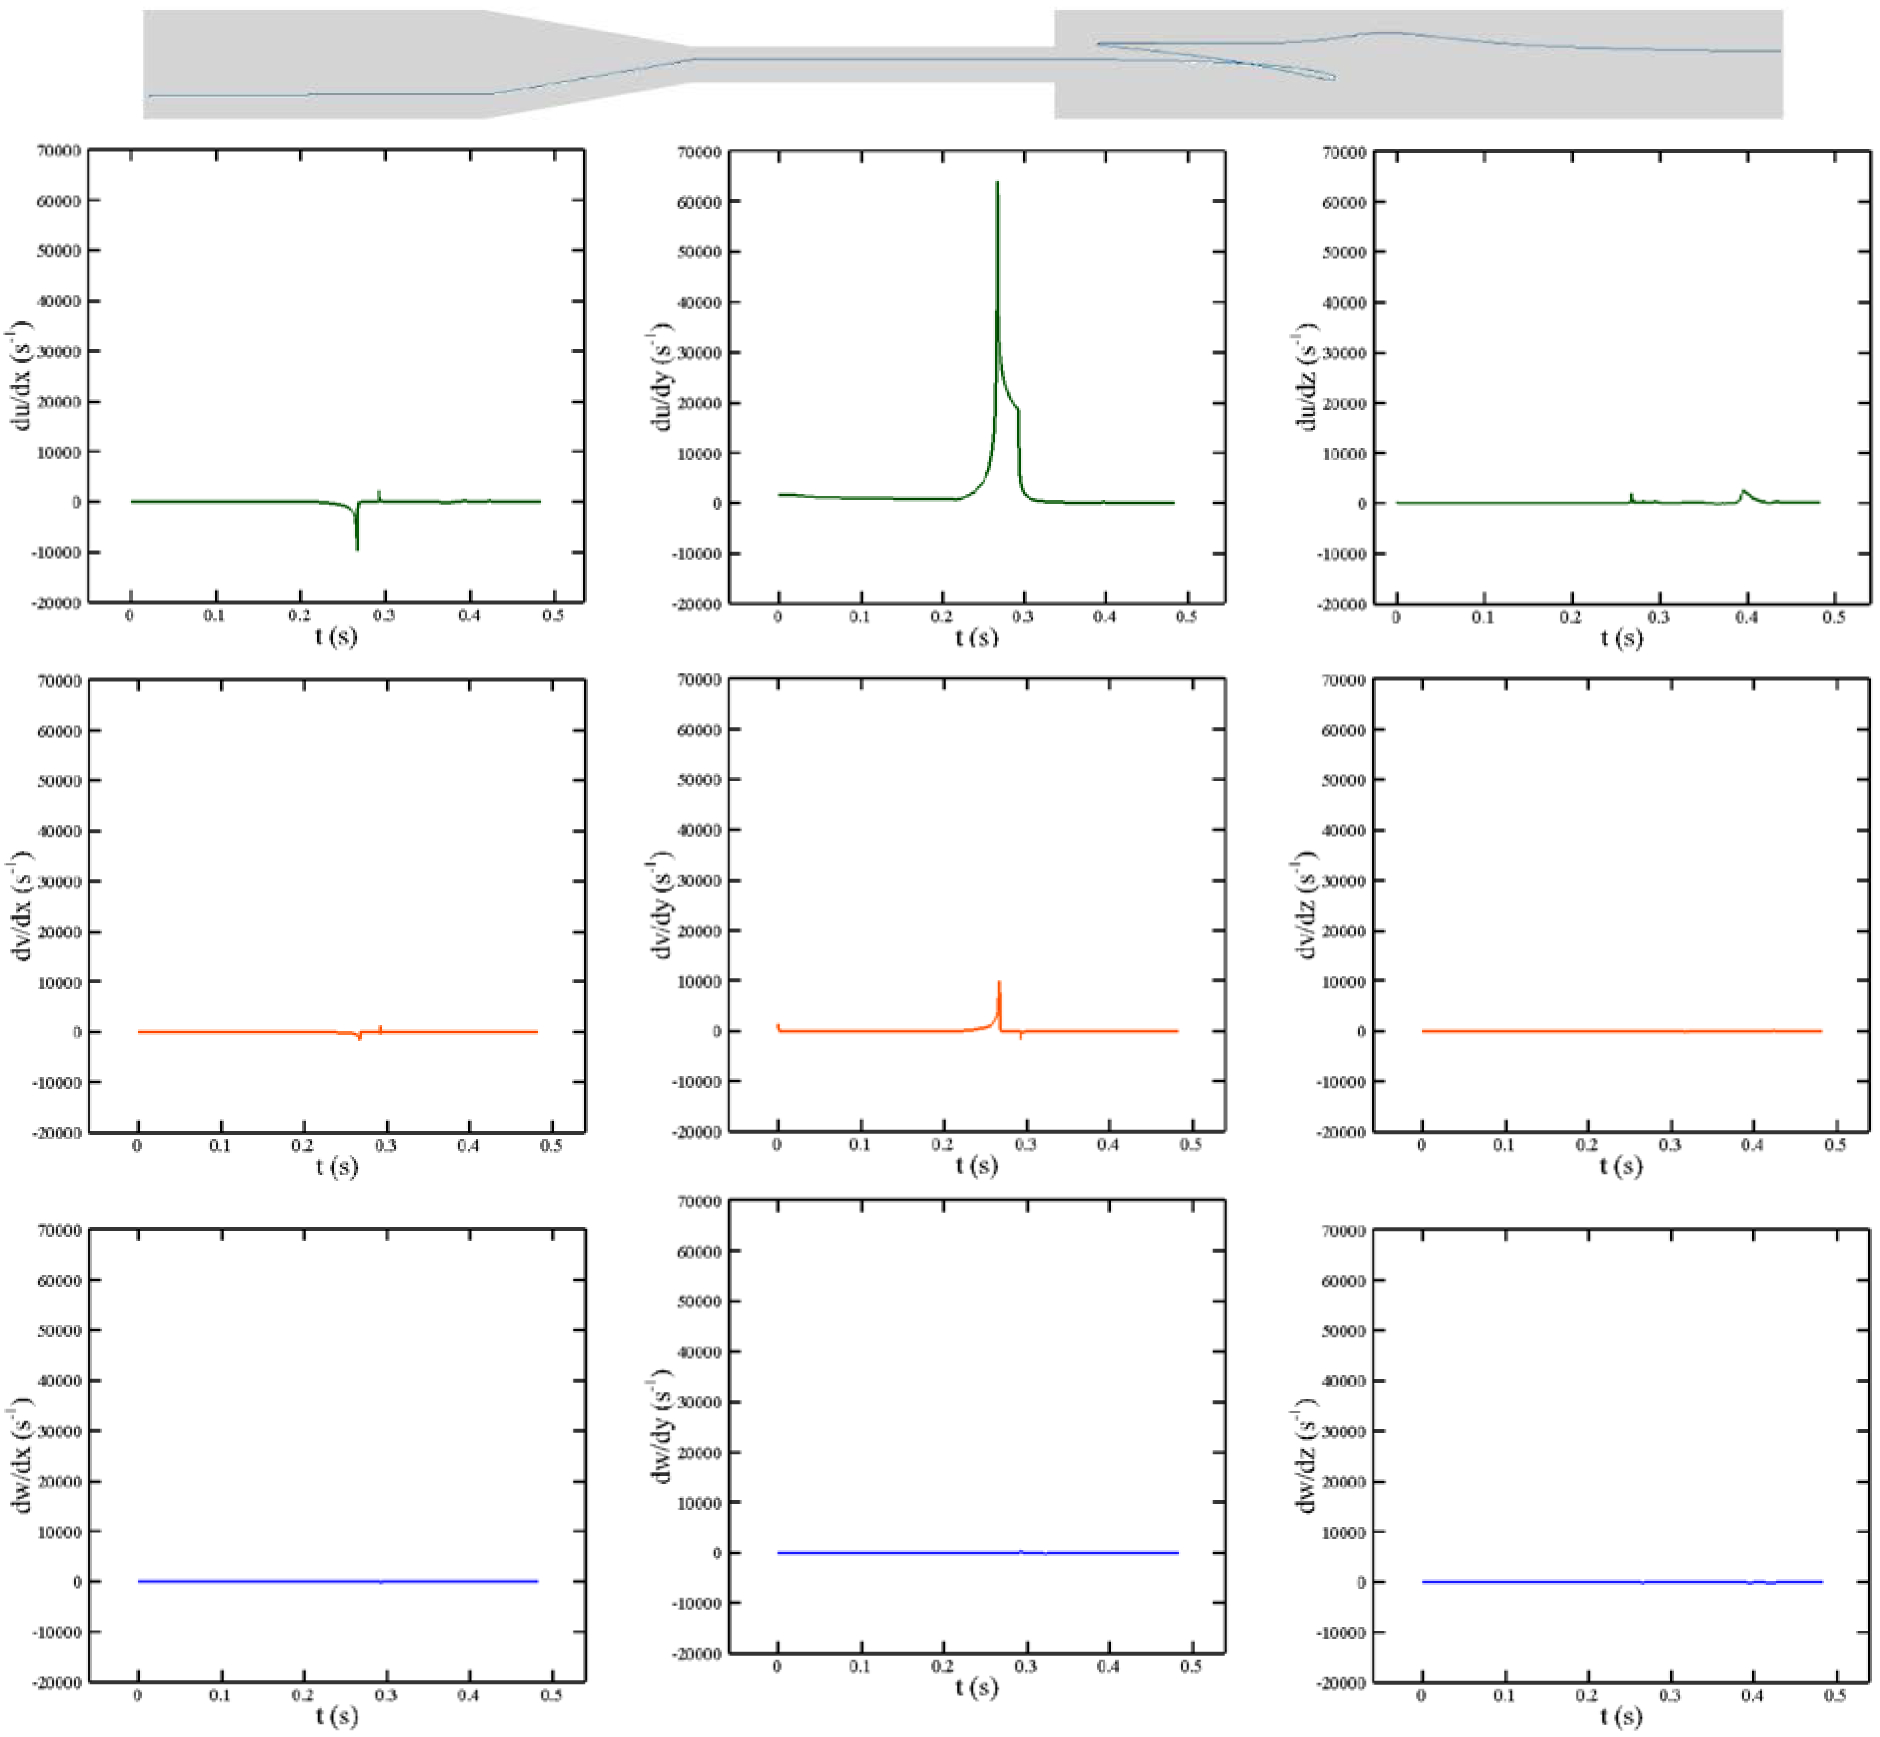
As it was discussed earlier, to calculate the IH, the history of the shear stress needs to be computed over pathlines. To show how the proposed algorithm works, different velocity gradients over the shown pathline at Re = 6500 are portrayed in Figure 10. As the figure indicates, the RBCs over the given pathline need nearly 0.48 sec to pass from the inlet to the outlet of the nozzle. Furthermore, because all the subfigures have the same vertical-scale, it is clear that except for du/dy, other velocity gradients have negligible values. Therefore, in this problem, the RBC shape should be dictated by du/dy. Also, Maximum du/dy occurs at t = 0.26 sec close to the entrance of contraction and it declines as the RBC moves toward the sudden expansion. A sharp reduction in du/dy at t = 0.3 sec is due to entering the sudden expansion area.
Figure 10:
Different velocity gradients over the shown pathline in FDA nozzle at Re = 6500.
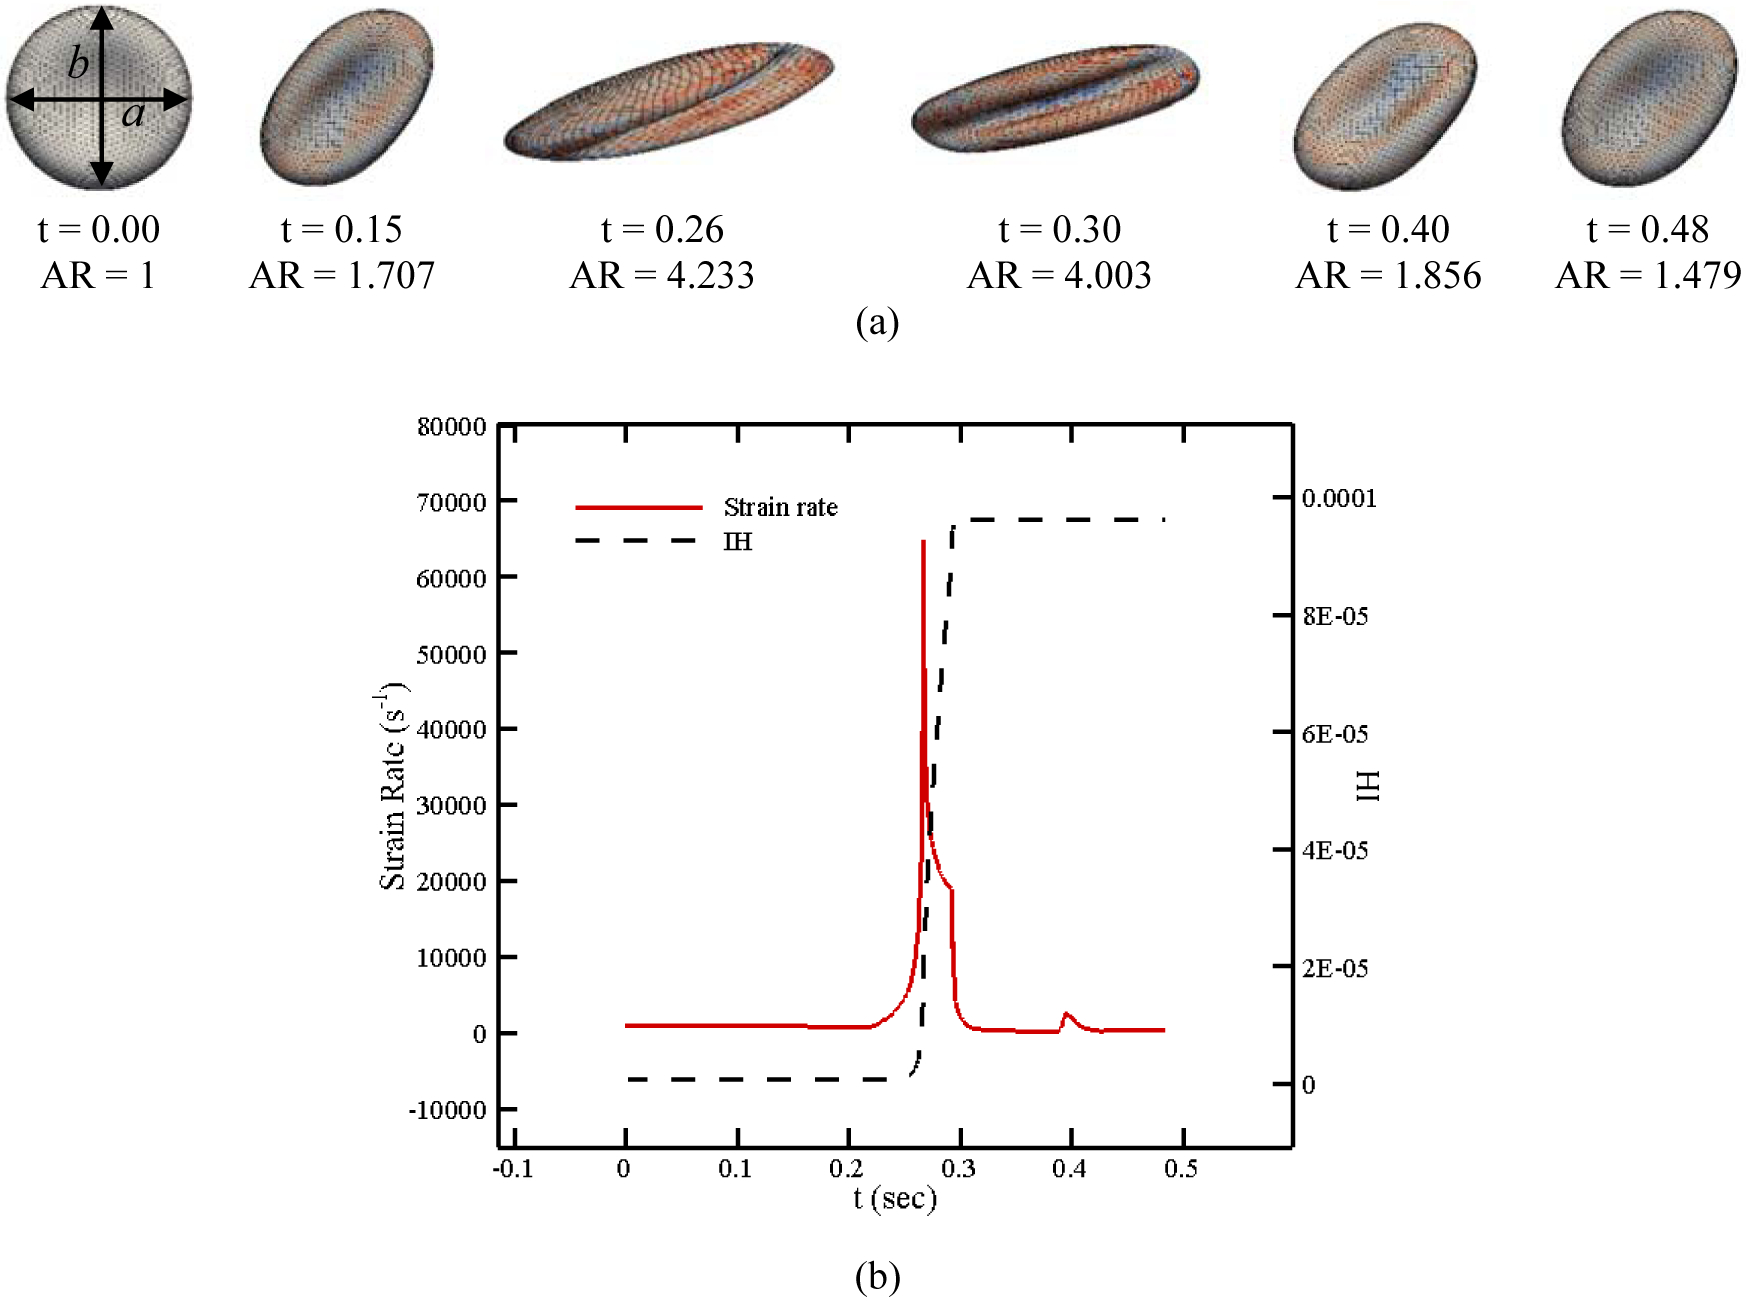
As the RBC membrane moves along the specified pathline in Figure 10, each patch on the CG RBC model senses different loading conditions in accordance with their orientation with respect to the flow field. Pore is induced on the RBC membrane once the local areal strain exceeds the specific critical threshold (above 20%). The pore size and length can be calculated using areal strain as described in previous sections. It should be noted that the areal strain and accordingly pore size and effective diffusion also change as the RBC experience different force along the pathline (see Figure 1). The pores in damaged patches are considered closed as areal strain reaches below 20% when pore size is smaller than the Hb molecule (less than 10 nm) [18]. Figure 11 (a) shows the RBC deformation and its strain distribution along the pathline shown in Figure 10 at 6 different time instances. As it can be observed, the maximum deformation occurs between t = 0.26 sec to t = 0.3 sec. Also, the RBC shape is recovered as it moves toward the outlet since the strain rate approaches to a negligible value in this direction. The RBC shape is different from what is seen in pure shear flow since the loading condition is different. Also, RBC shape is different from a droplet shape reported in [25], [29], [30], [43] due to using CG model which is more realistic. The magnitude of the strain rate tensor as well as instantaneous IH are shown in Figure 11 (b). The trend of strain magnitude is quite similar to du/dy in Figure 10 since du/dy is the dominant component of the strain rate tensor on this pathline. It is clear that Hb release initiates near 10000 s−1 and increases sharply until t = 0.3 sec. IH remains constant after t = 0.3 sec. It can be concluded that the trend of the instantaneous IH is dictated by the strain rate tensor magnitude. The required CPU time for computing hemolysis along this pathline is 40.745 secs. To quantify the RBC deformation over the specified pathline, the RBC aspect ratio (the ratio of axial diameter to transversal diameter, b/a) at different time instances are also listed in Figure 11. As the graph shows, the maximum aspect ratio occurs at the highest strain rate (t = 0.26). Therefore, it can be claimed that extensional deformations of RBCs near the walls as a result of shear stress (du/dy) is a substantial cause of hemolysis.
Figure 11:
(a) RBC shapes along a pathline in FDA nozzle, (b) instantaneous IH and strain rate magnitude.
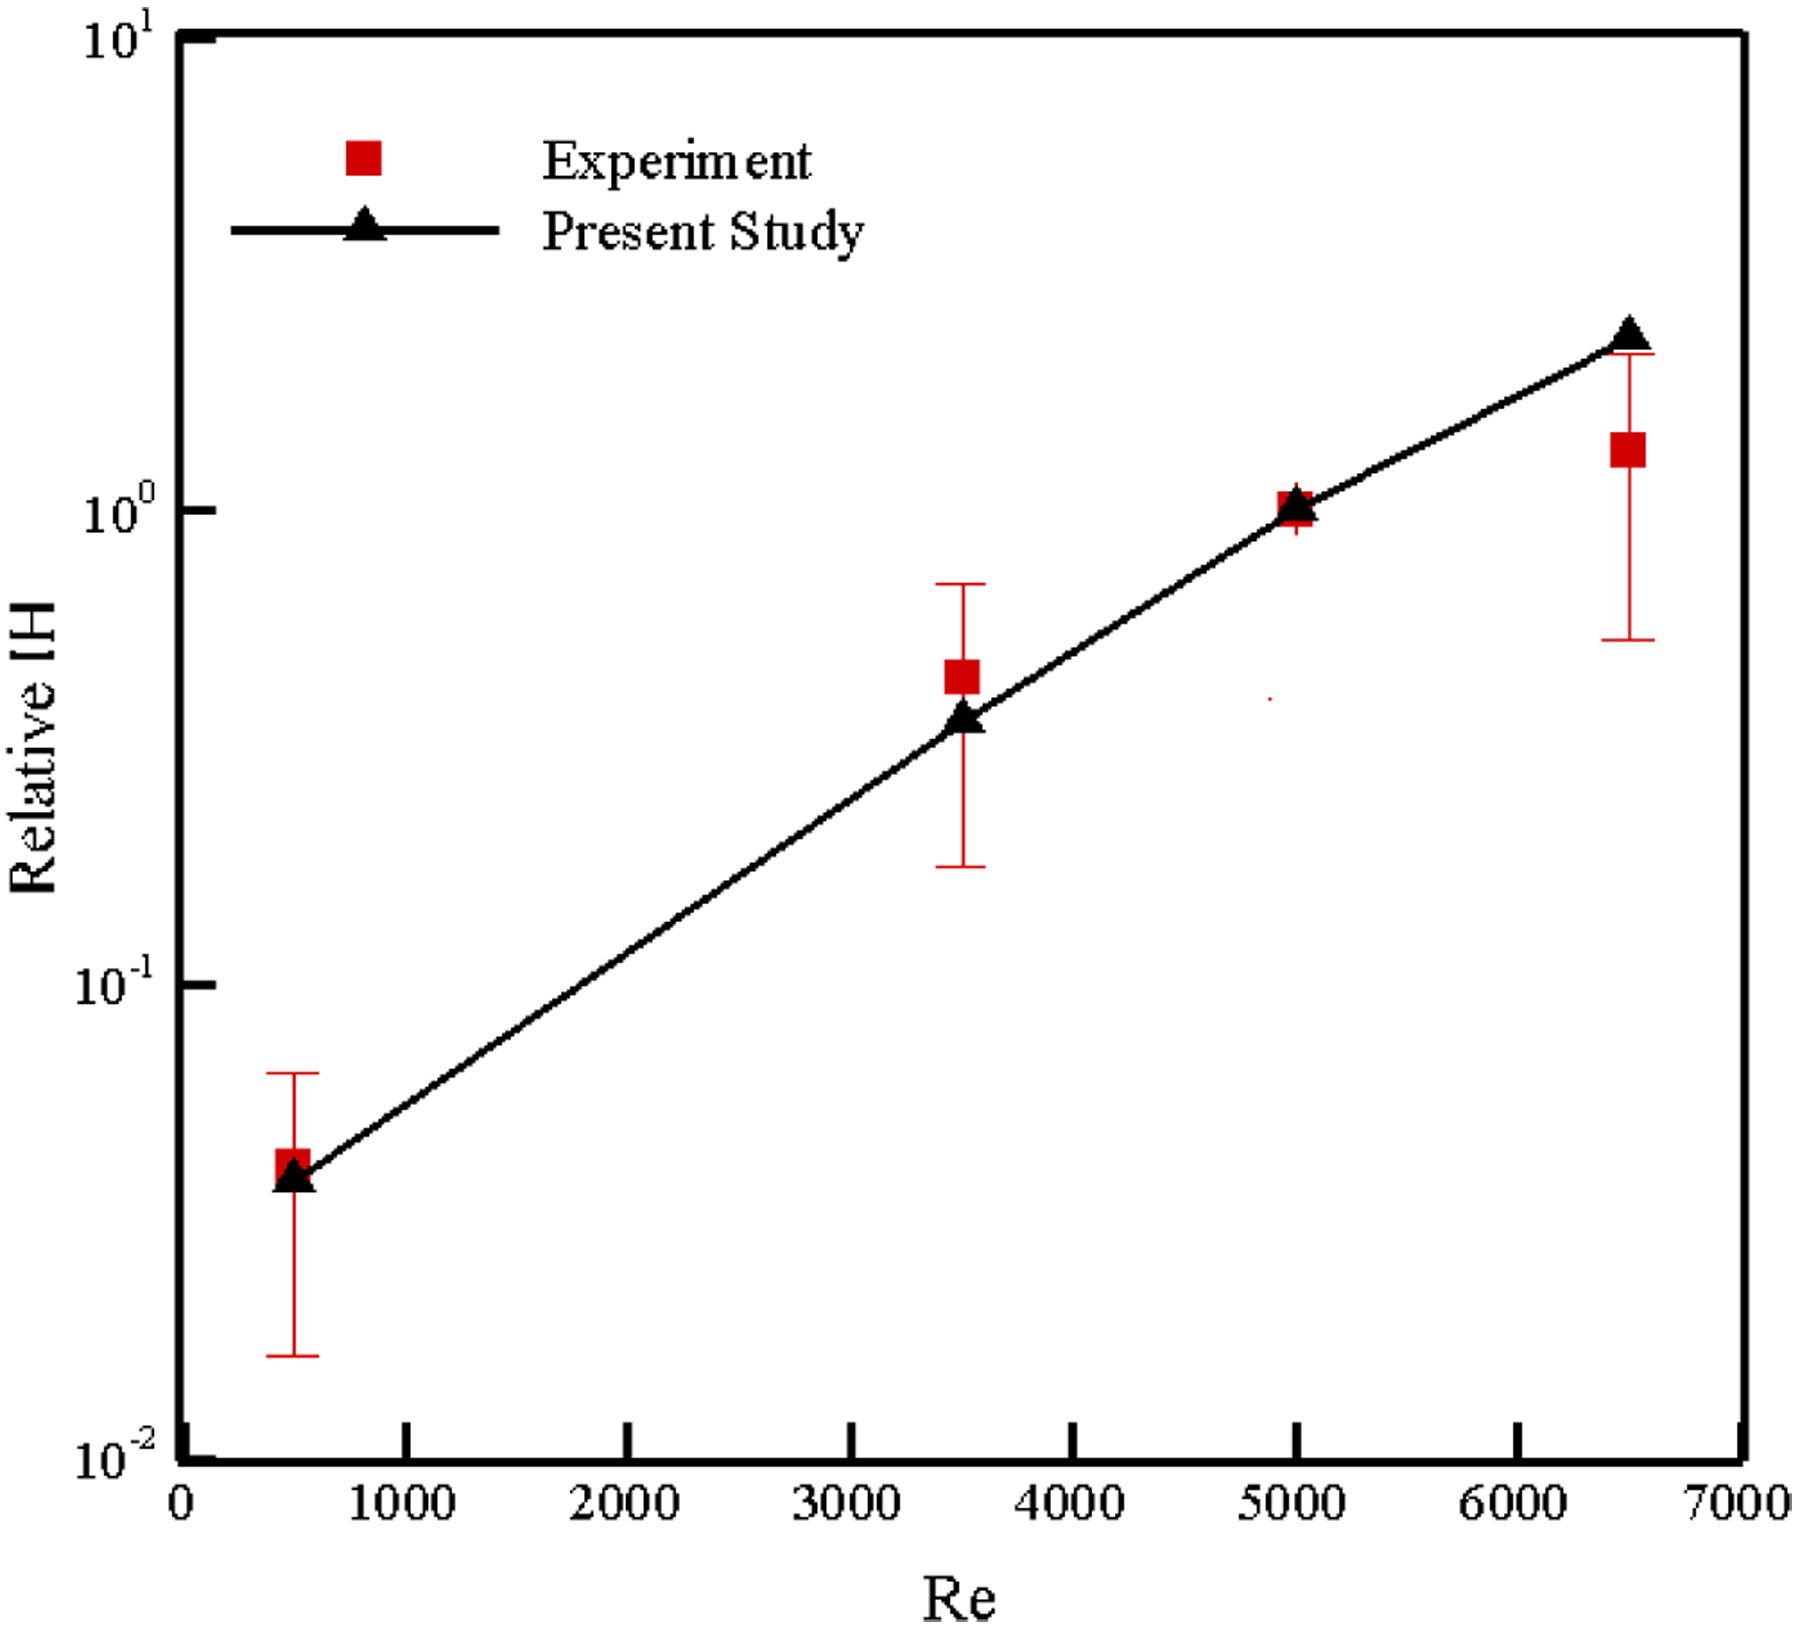
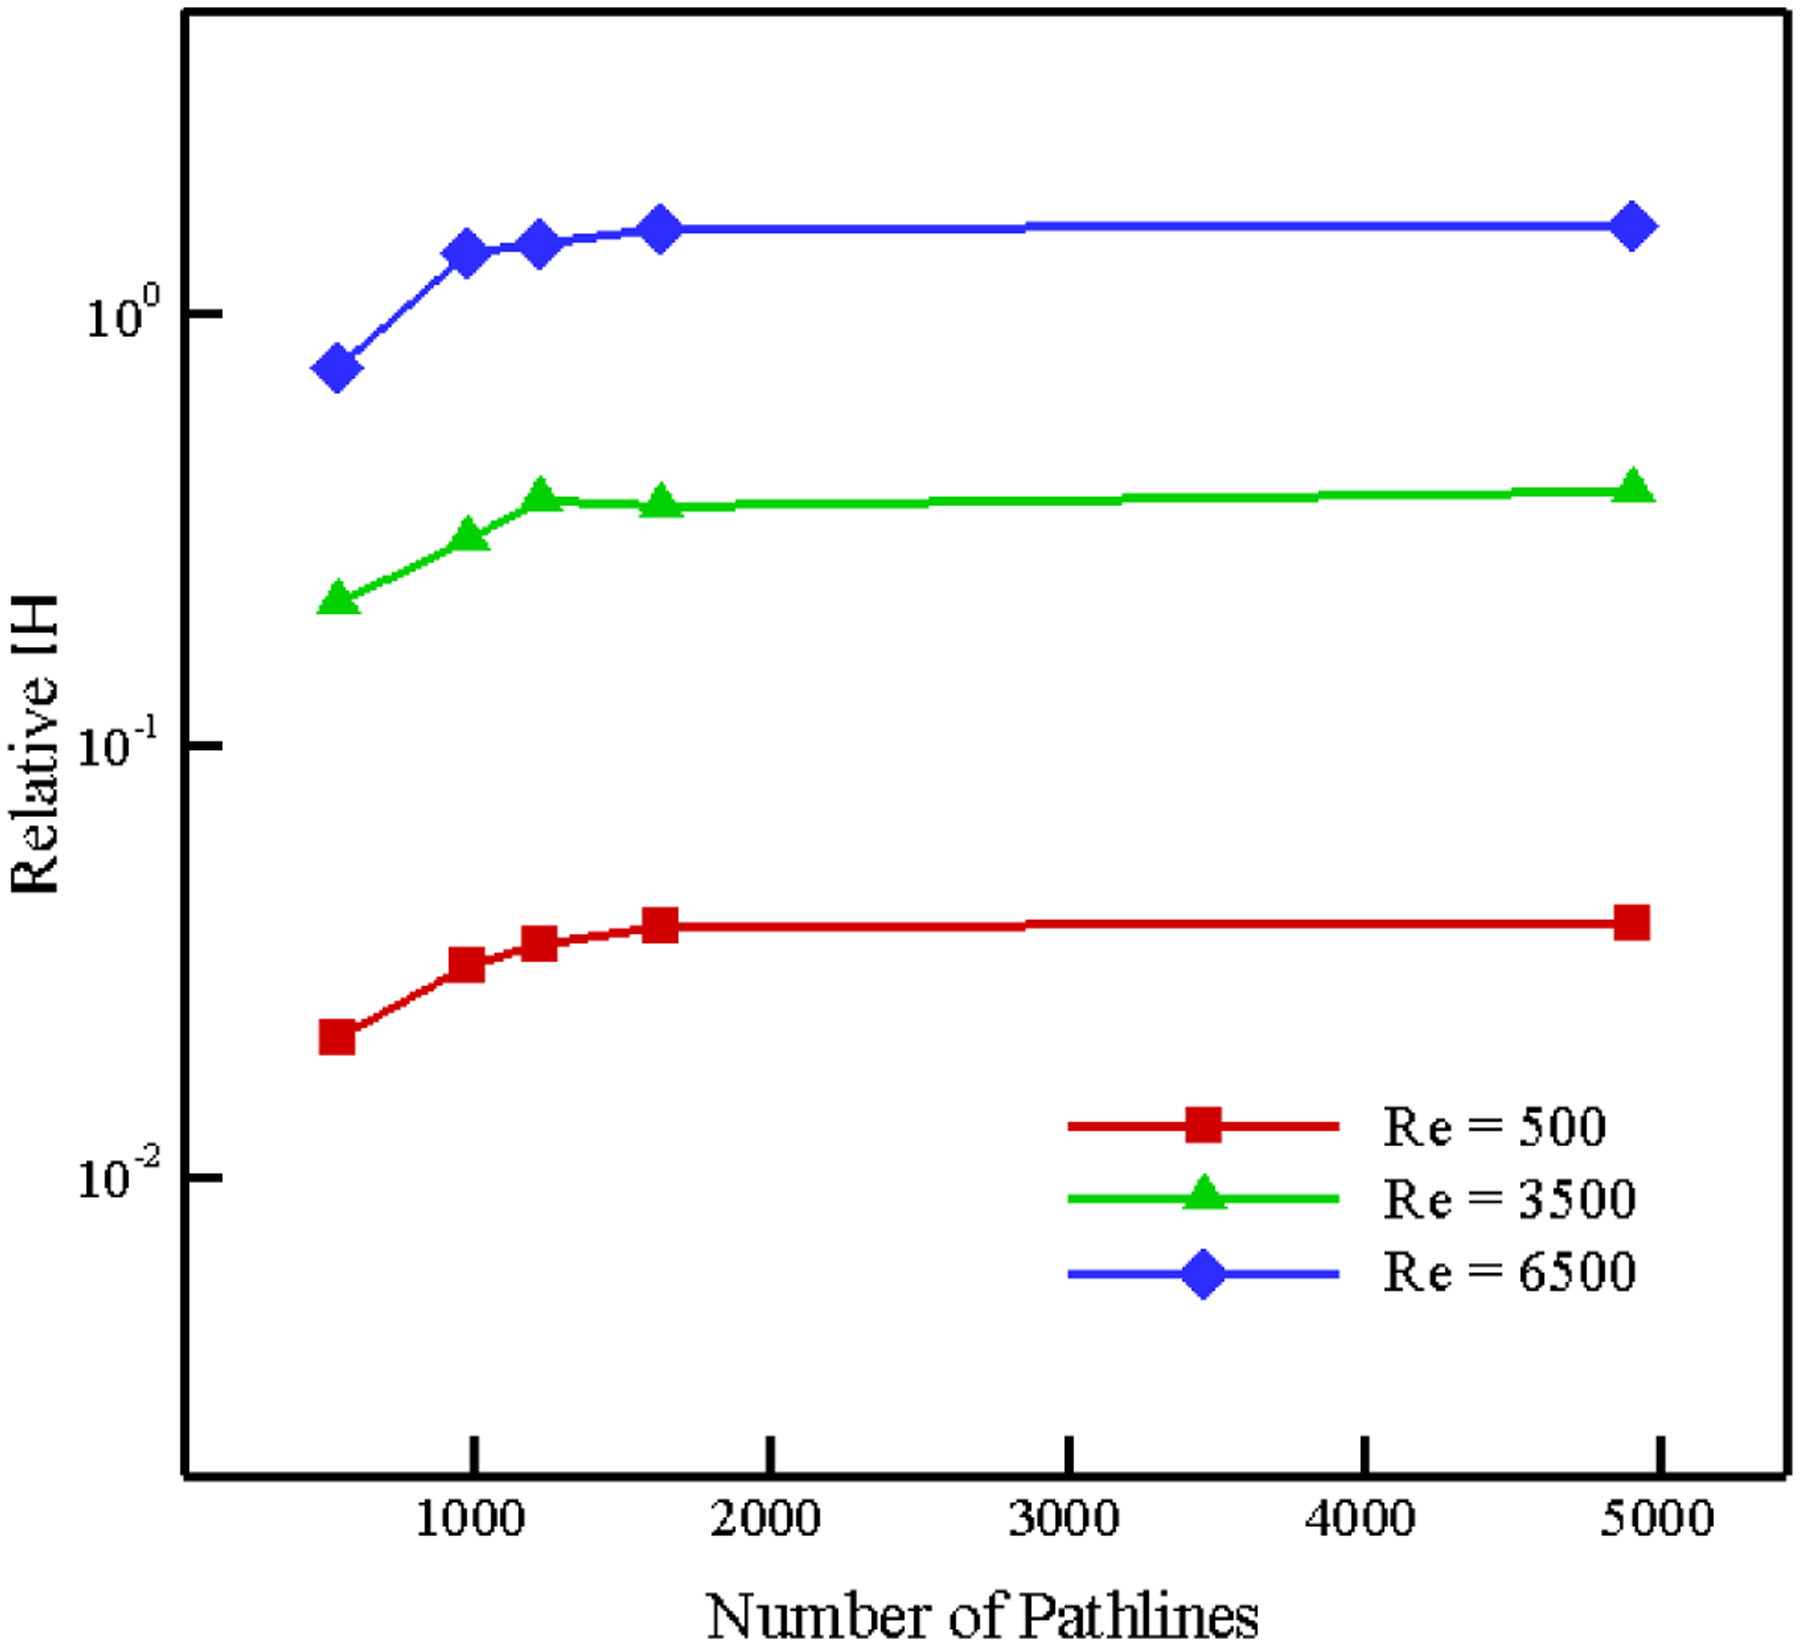
To validate the results, the IH obtained for a Reynolds number of 5000 in this simulation is used as a reference to normalize all other values. In Figure 12, our relative IH is compared with the results published in both [67], [68] within the framework of the “FDA Critical Path initiative”. These results can be found in [64] too. As the figure shows, the numerical and experimental results are in agreement and the relative IH increases by increasing Reynolds number. These results reveal that our algorithm is able to predict the hemolysis trend without adjusting any ad-hoc parameters while in other Lagrangian strain-based methods, choosing the empirical coefficients improperly can even lead to a wrong prediction of the trend [64]. The variation in the relative IH in this test case with number of path lines is analyzed up to 4905 paths for different Re numbers (Figure 13), and we found out that the IH calculation is independent of the number of path lines above 1635 for this device. Increasing the pathline number beyond this enhances the prediction accuracy less than 5%, but it increases the CPU time.
Figure 12:
Comparison of numerical relative IH in FDA nozzle with the results published in [64], [67], [68].
Figure 13:
Variation in Relative IH estimation with number of pathlines in FDA nozzle.
3.2. Blood Pumps
In the FDA nozzle, we showed that our model can predict the hemolysis behavior in a device with simple geometry. To show the capability of our model in predicting the value (and not only the trend) of hemolysis in a real biomedical device, here the hemolysis of two blood pumps, i.e. CentriMag and HM II is computed. The CentriMag blood pump is an extracorporeal circulatory support device providing hemodynamic stabilization in patients in need of circulatory support. It has a magnetically levitated centrifugal pump impeller and has been used clinically worldwide [35]. In the groups of authors, we have extensively carried out both experimental and numerical studies to understand the physics of blood flow in this device [10], [33], [44], [69]. The computational model of the CentriMag blood pump consists of the inlet, the impeller, the outlet, and the outer casing wall (Figure 14 (a)). The computational grid used for CFD simulation is shown in Figure 14 (b). Interested reader can refer to [10], [44] for more details of the model. To perform the CFD simulation for this test case, the fluid domain is divided into two sections: rotating fluid and stationary outer fluid. Motion of the impellers is incorporated using the multiple reference frame (MRF) approach. MRF is a steady-state approximation of the actual flow in which the flow domain could be separated and assigned different rotating and/or translational speeds. The impeller is enclosed in a region with axial symmetry. In this article, the fluid in the region surrounding the impeller is calculated in a frame of reference moving with the same velocity as the impeller, and flow in the outer region is calculated in a stationary reference frame. At the interface between the cell zones, a local reference frame transformation is performed to enable the flow variables in one zone to be used to calculate fluxes at the boundary of the adjacent zone [10], [44]. Rotational speeds of 2200 rpm, 2700 rpm and 4000 rpm for impeller are considered as operating conditions in this problem that can generate 75 mmHg, 150 mmHg and 350 mmHg pressure heads against the flow rate of 4.5 L/min. CFD validation for this test case can be found in our previous studies [10], [44].
Figure 14:
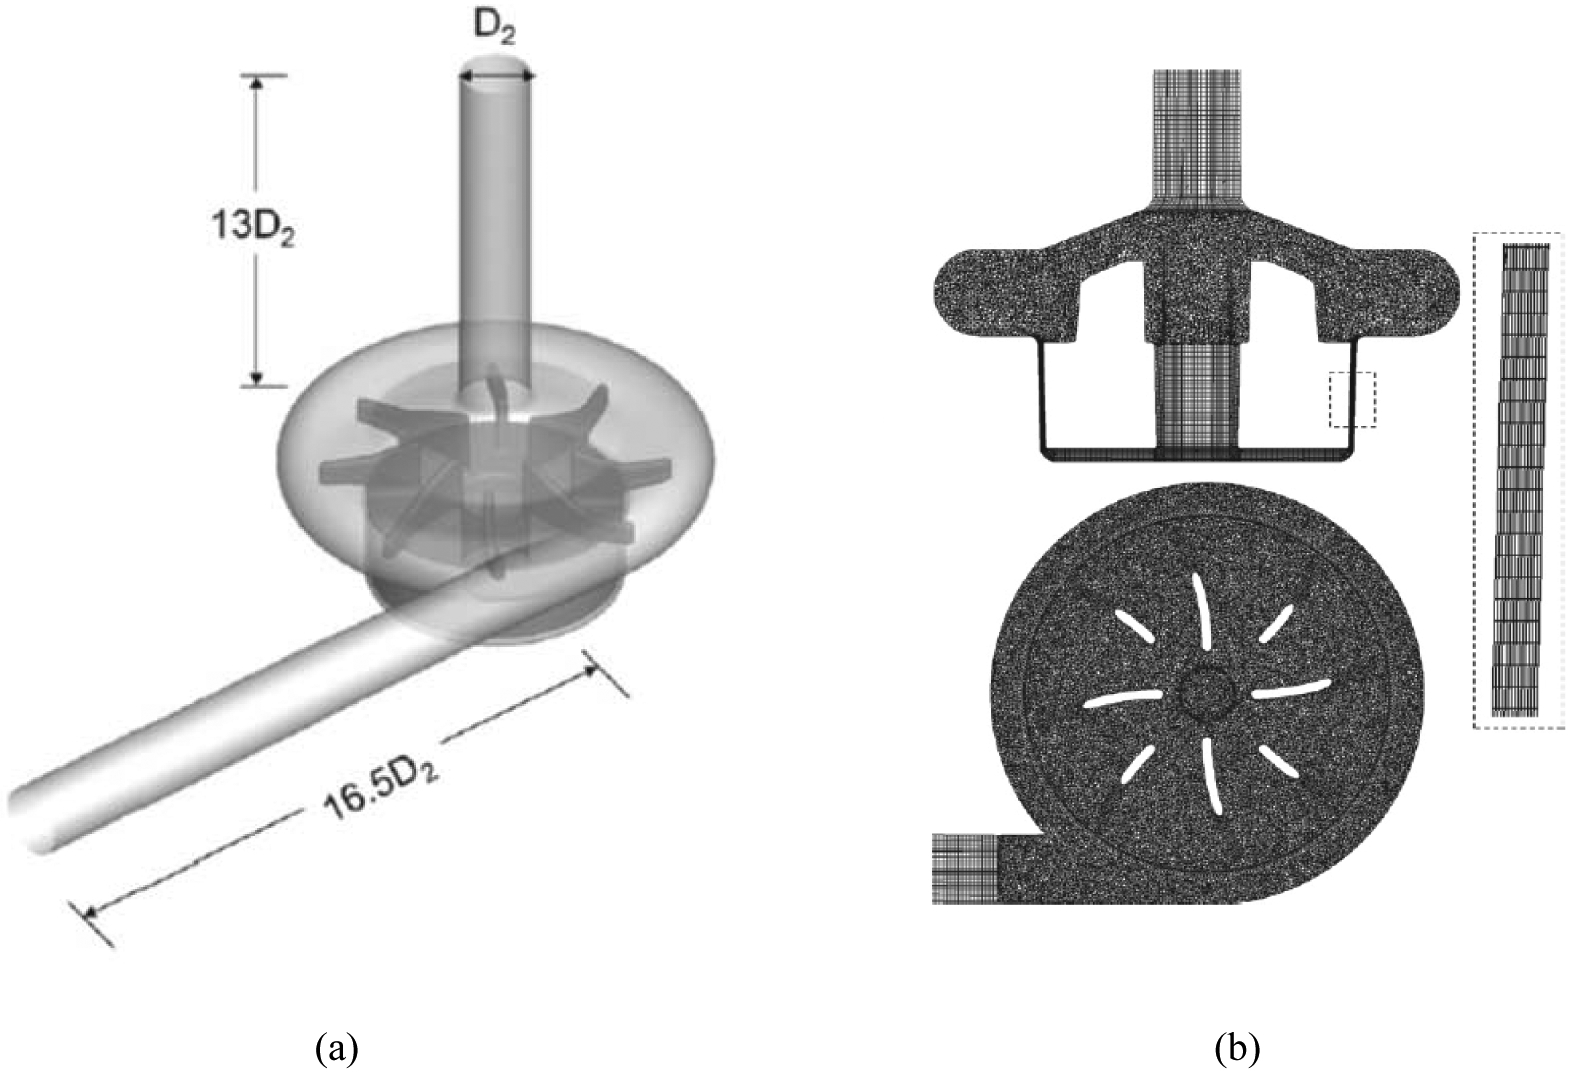
(a) Model of the CentriMag blood pump (D2 = 0.009 m), (b) computational mesh (7.34 million elements).
From CFD simulation, 358 pathlines are selected as the smallest number of pathlines to accurately calculate the IH inside the pump. A typical pathline inside the pump at 4000 rpm (350 mmHg) along with the history of different arrays of the strain rate tensor are shown in Figure 15. In contrast to FDA nozzle, the flow pattern and corresponding shear rates are more complex due to the rotary motion of the impeller. It is obvious that it takes nearly 1.2 sec for a RBC to pass from inlet to the outlet through the shown pathline [10].
Figure 15:
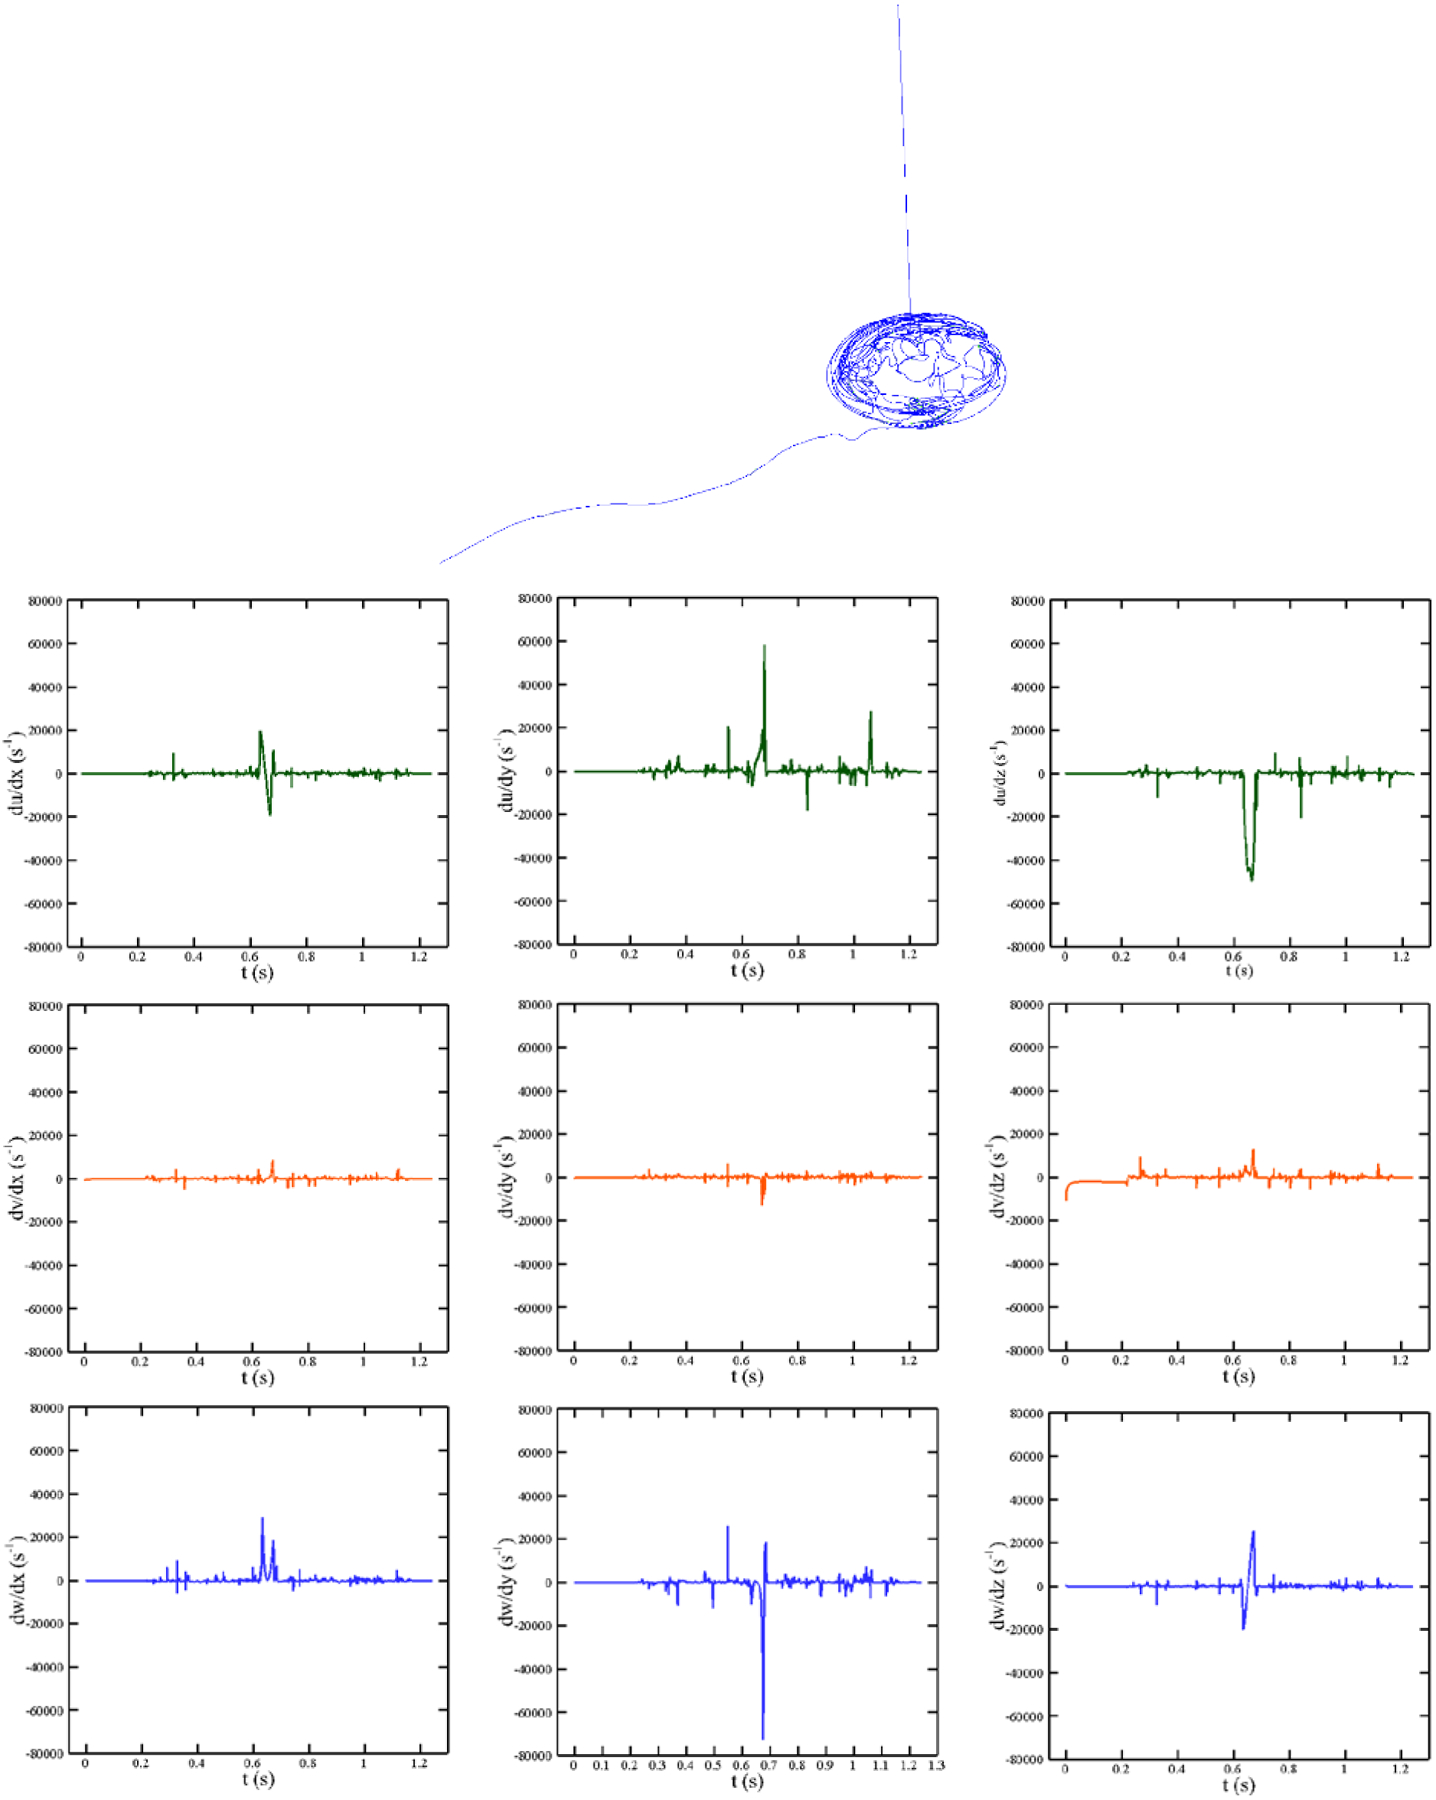
Different velocity gradients over the shown pathline in CentriMag blood pump at Re = 4000 rpm (350 mmHg).
Figure 16 (a) displays the deformation of a RBC and its strain distribution along its pathline shown in Figure 15 at 6 different time instances. Instantaneous IH and magnitude of strain rate tensor are also shown in Figure 16 (b). Considering these figures and similar to the previous test case, the RBC experiences higher deformation when the strain rate is higher. For example, RBC distortion at t = 0.69 sec is more than its deformation at t = 0.32 sec because it undergoes higher strain rate. It is interesting to note that, in spite of the model in which a droplet model is used for the RBC [25], [29], [30], our model predicts more complex shapes for the RBC under a complex loading from fluid flow. Again the RBC structure is recovered as it leaves the pump because of strain rate reduction. Furthermore, instantaneous IH trend is proportional to stain rate magnitude. Our model reveals that the Hb release starts slightly near 10000 s−1 and increases when it goes beyond this threshold. The required CPU time for computing hemolysis along this pathline is 102.658 sec. We need more CPU time here as compared to the FDA nozzle pathline in the previous section because the shear stress is more complex (the RBC model needs more time to reach equilibrium at each time step on the pathline) and the RBC needs more time to travel between inlet and outlet.
Figure 16:
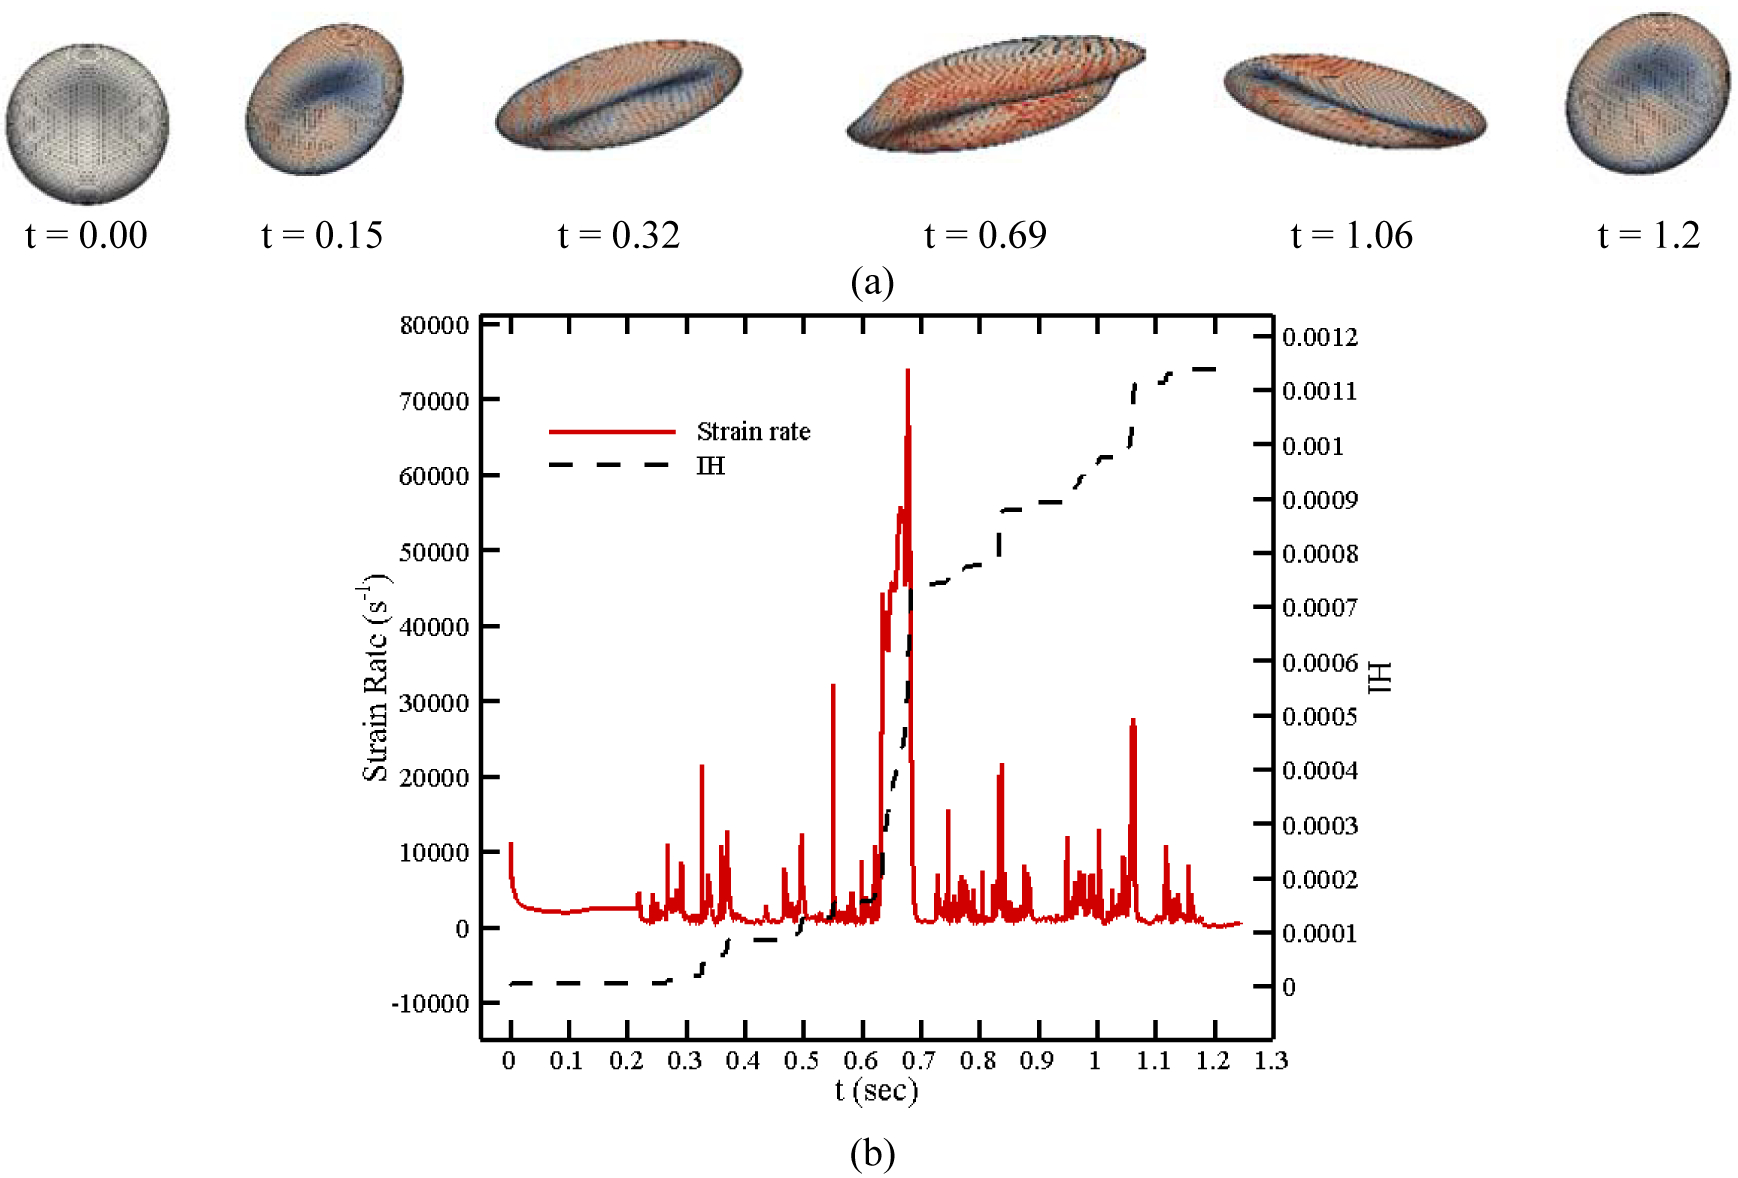
(a) RBC shapes along a pathline in CentriMag blood pump, (b) instantaneous IH and strain rate magnitude.
To validate our numerical results, an experiment is designed to measure the total IH in the CentriMag blood pump. A photograph of the experimental setup is shown in Figure 17. In this experiment, the operating condition is set to generate a flow rate of 4.5L/min at the intended operating speed for the CentriMag by adjusting the afterload resistance of the loop. The pressure heads were 75, 150 and 350 mmHg for 2200, 2700 and 4000 RPM, respectively. The blood in the loop is circulated continuously for 4 hours. A baseline blood sample was collected prior to the operation. After the initiation of the circulation, serial blood samples were collected every 60 minutes for the analyses. Blood counts of each collected blood sample was directly measured with a hematology analyzer (ABX Micros 60, Horiba, Irvine, CA). The collected blood samples were immediately centrifuged by a centrifuge machine with a brake system (Model number: IEC CL40R, Thermo Electron Corp., Walthan, MA, USA) at 1500 g for 15 minutes at constant temperature 4°C. The plasma of the centrifuged samples was then collected into Eppendorf tubes for the second centrifugation by a centrifuge machine (Model number: accuSpin Micro 17R, Fisher Scientific, Hampton, NH, USA) at 14000 RPM for 15 minutes at constant temperature 4°C. The plasma was collected for the plasma free Hb (PFH) measurement. PFH concentration in the blood sample was determined by using a spectrophotometric assay (PFH Kit, Catachem Inc., CT, USA) with a SpectraMax M3 Spectrophotometer (Molecular Devices, CA, USA). Normalized Index of Hemolysis (NIH) was calculated according to the ASTM standard formula:
| (19) |
where ΔfreeHb is the increase of plasma free hemoglobin concentration (g/L) over the sampling time interval, V is the circulation volume (L), Q is the flow rate (L/min), Ht = 32 is the hematocrit (%) of the blood and t is the sampling time interval (min). The average total hemoglobin and the standard errors for the experiments are 9.9±0.3 g/dL (7 experiments). It should be mentioned that with the improper choice of clamps, additional hemolysis could be introduced. In order to minimize the clamp induced high shear stress, we used flat head clamps (Figure 17) in our experiments. The clamp length is about 10 cm. With this clamp, the average shear stress levels inside the squeezed tubing section were much lower compared to the shear stress levels inside the rotating pumps. Specifically, considering that the blood reservoir was approximately 50 cm above the pump level (~38 mmHg static pressure due to gravity), the clamped tubing section had to reduce the pressure by approximately 35, 110 and 310 mmHg for the 2200, 2700, and 4000 RPM CentriMag operating conditions, respectively. According to Darcy-Weisbach equation, the equivalent hydraulic diameters of the clamped tubing sections were 4, 3 and 2.3 mm and the corresponding shear stress levels were approximately 20, 55, and 110 Pa for the 2200, 2700, and 4000 RPM operating conditions, respectively. The high shear stress generated by the rotating impellers were generally several folders larger than the ones caused by the clamp that we used. Although the shear stress generated by the clamp in the 4000 RPM operating condition was high, the associated exposure time was only approximately 0.005 s; this extremely short exposure time won’t cause significant hemolysis.
Figure 17:
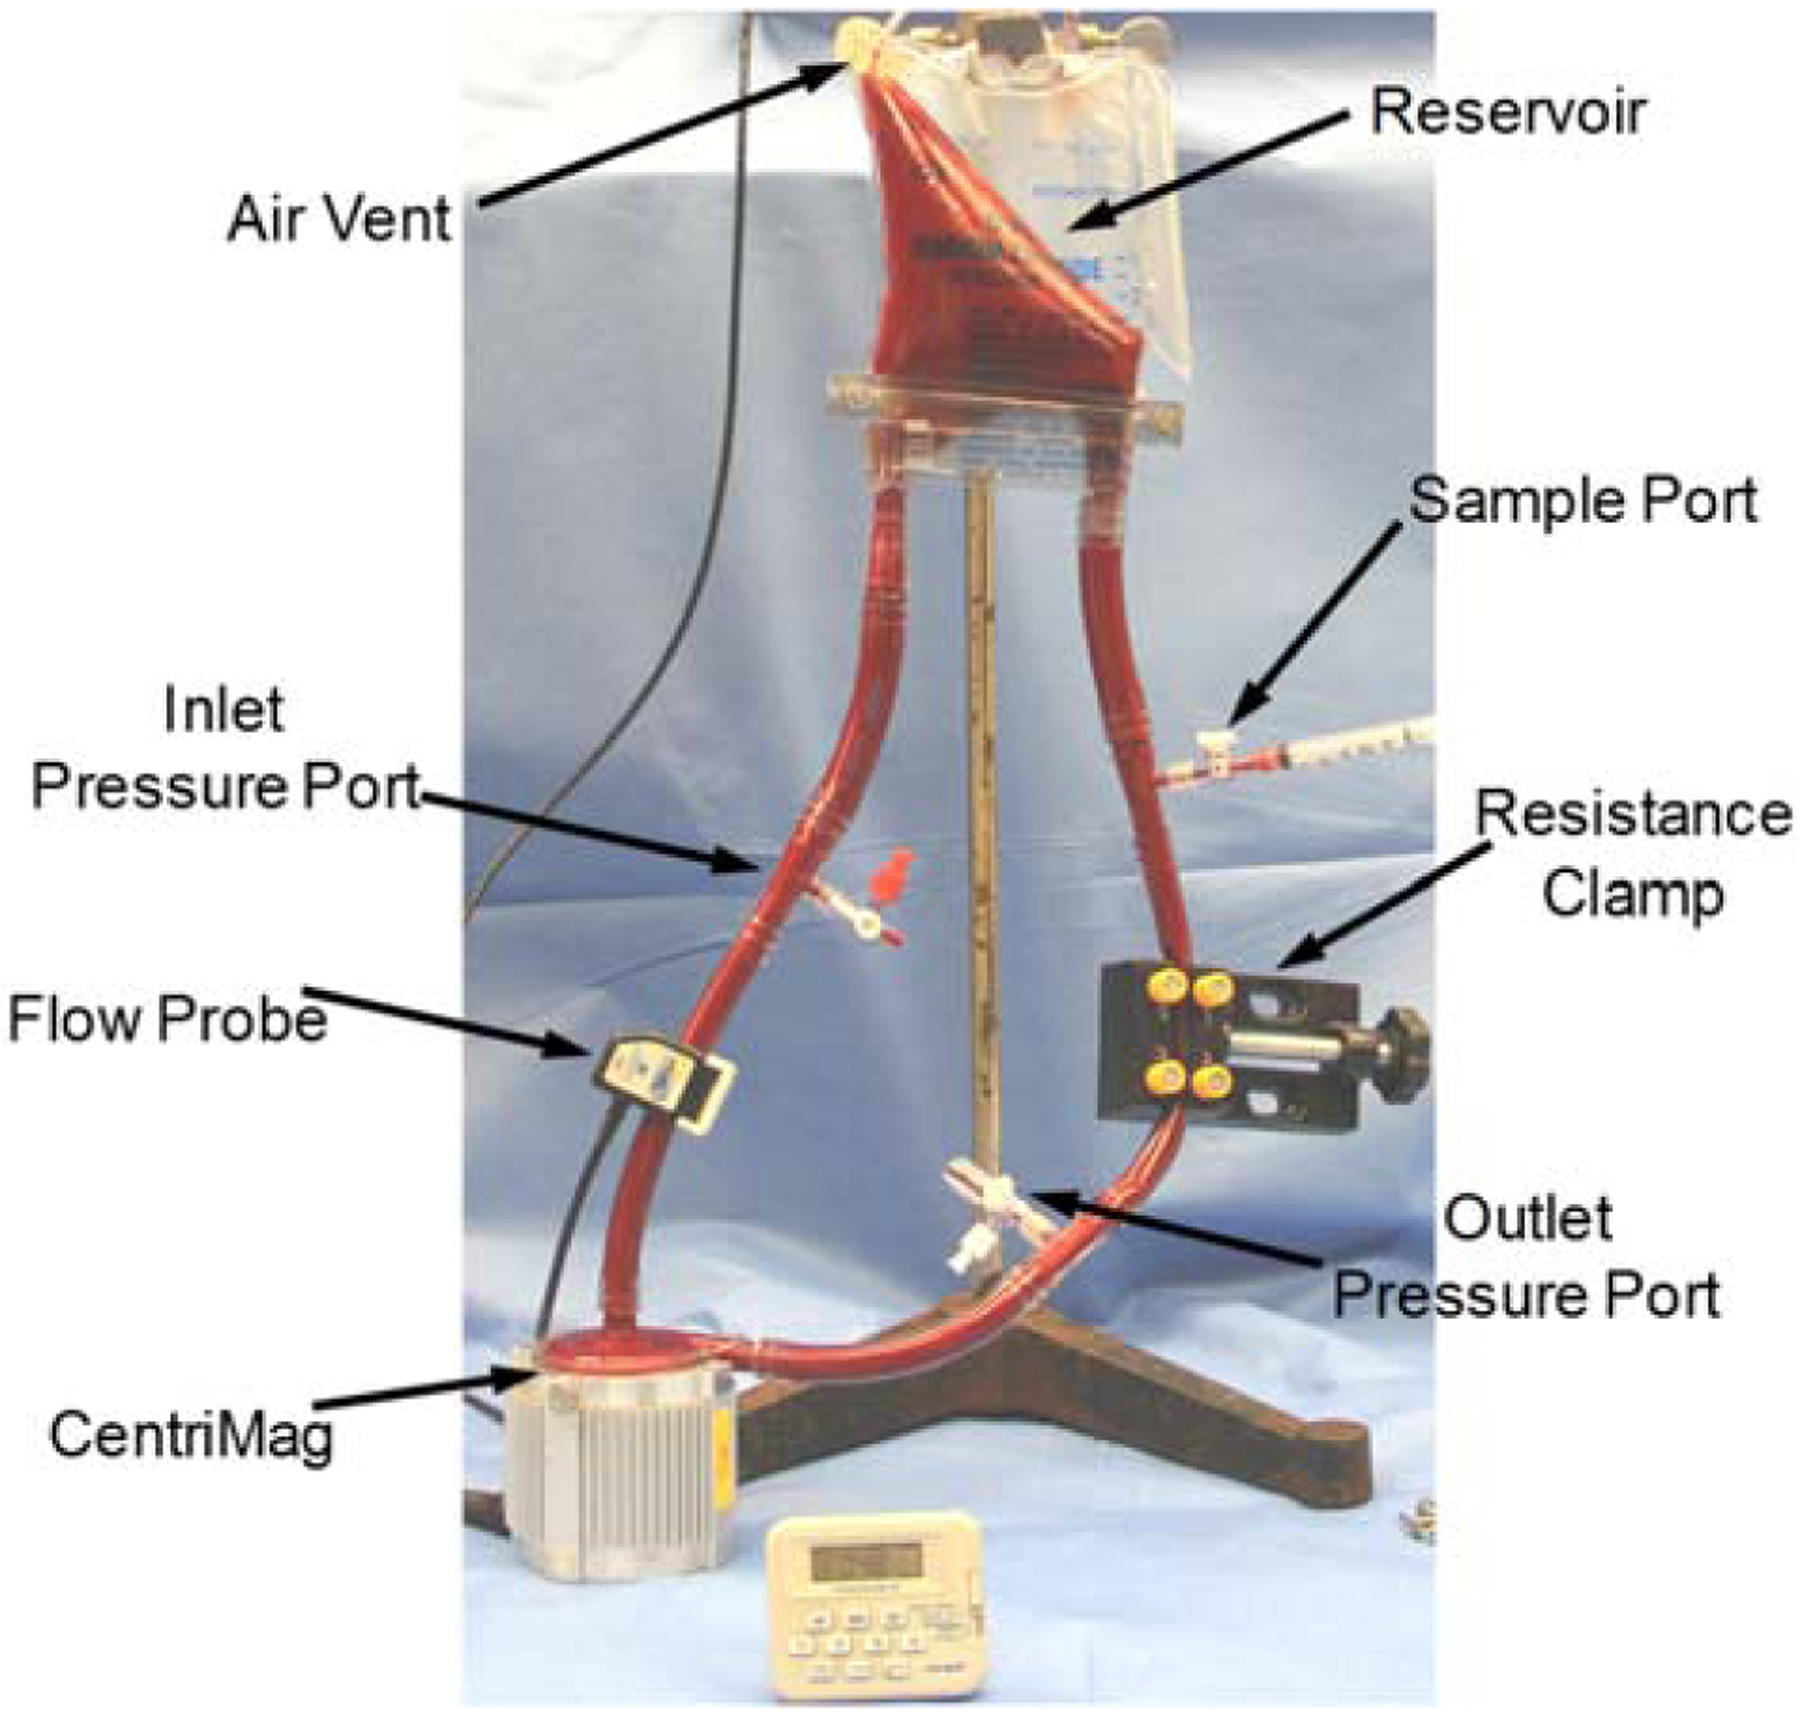
Picture of the small volume loop experiment with a CentriMag pump.
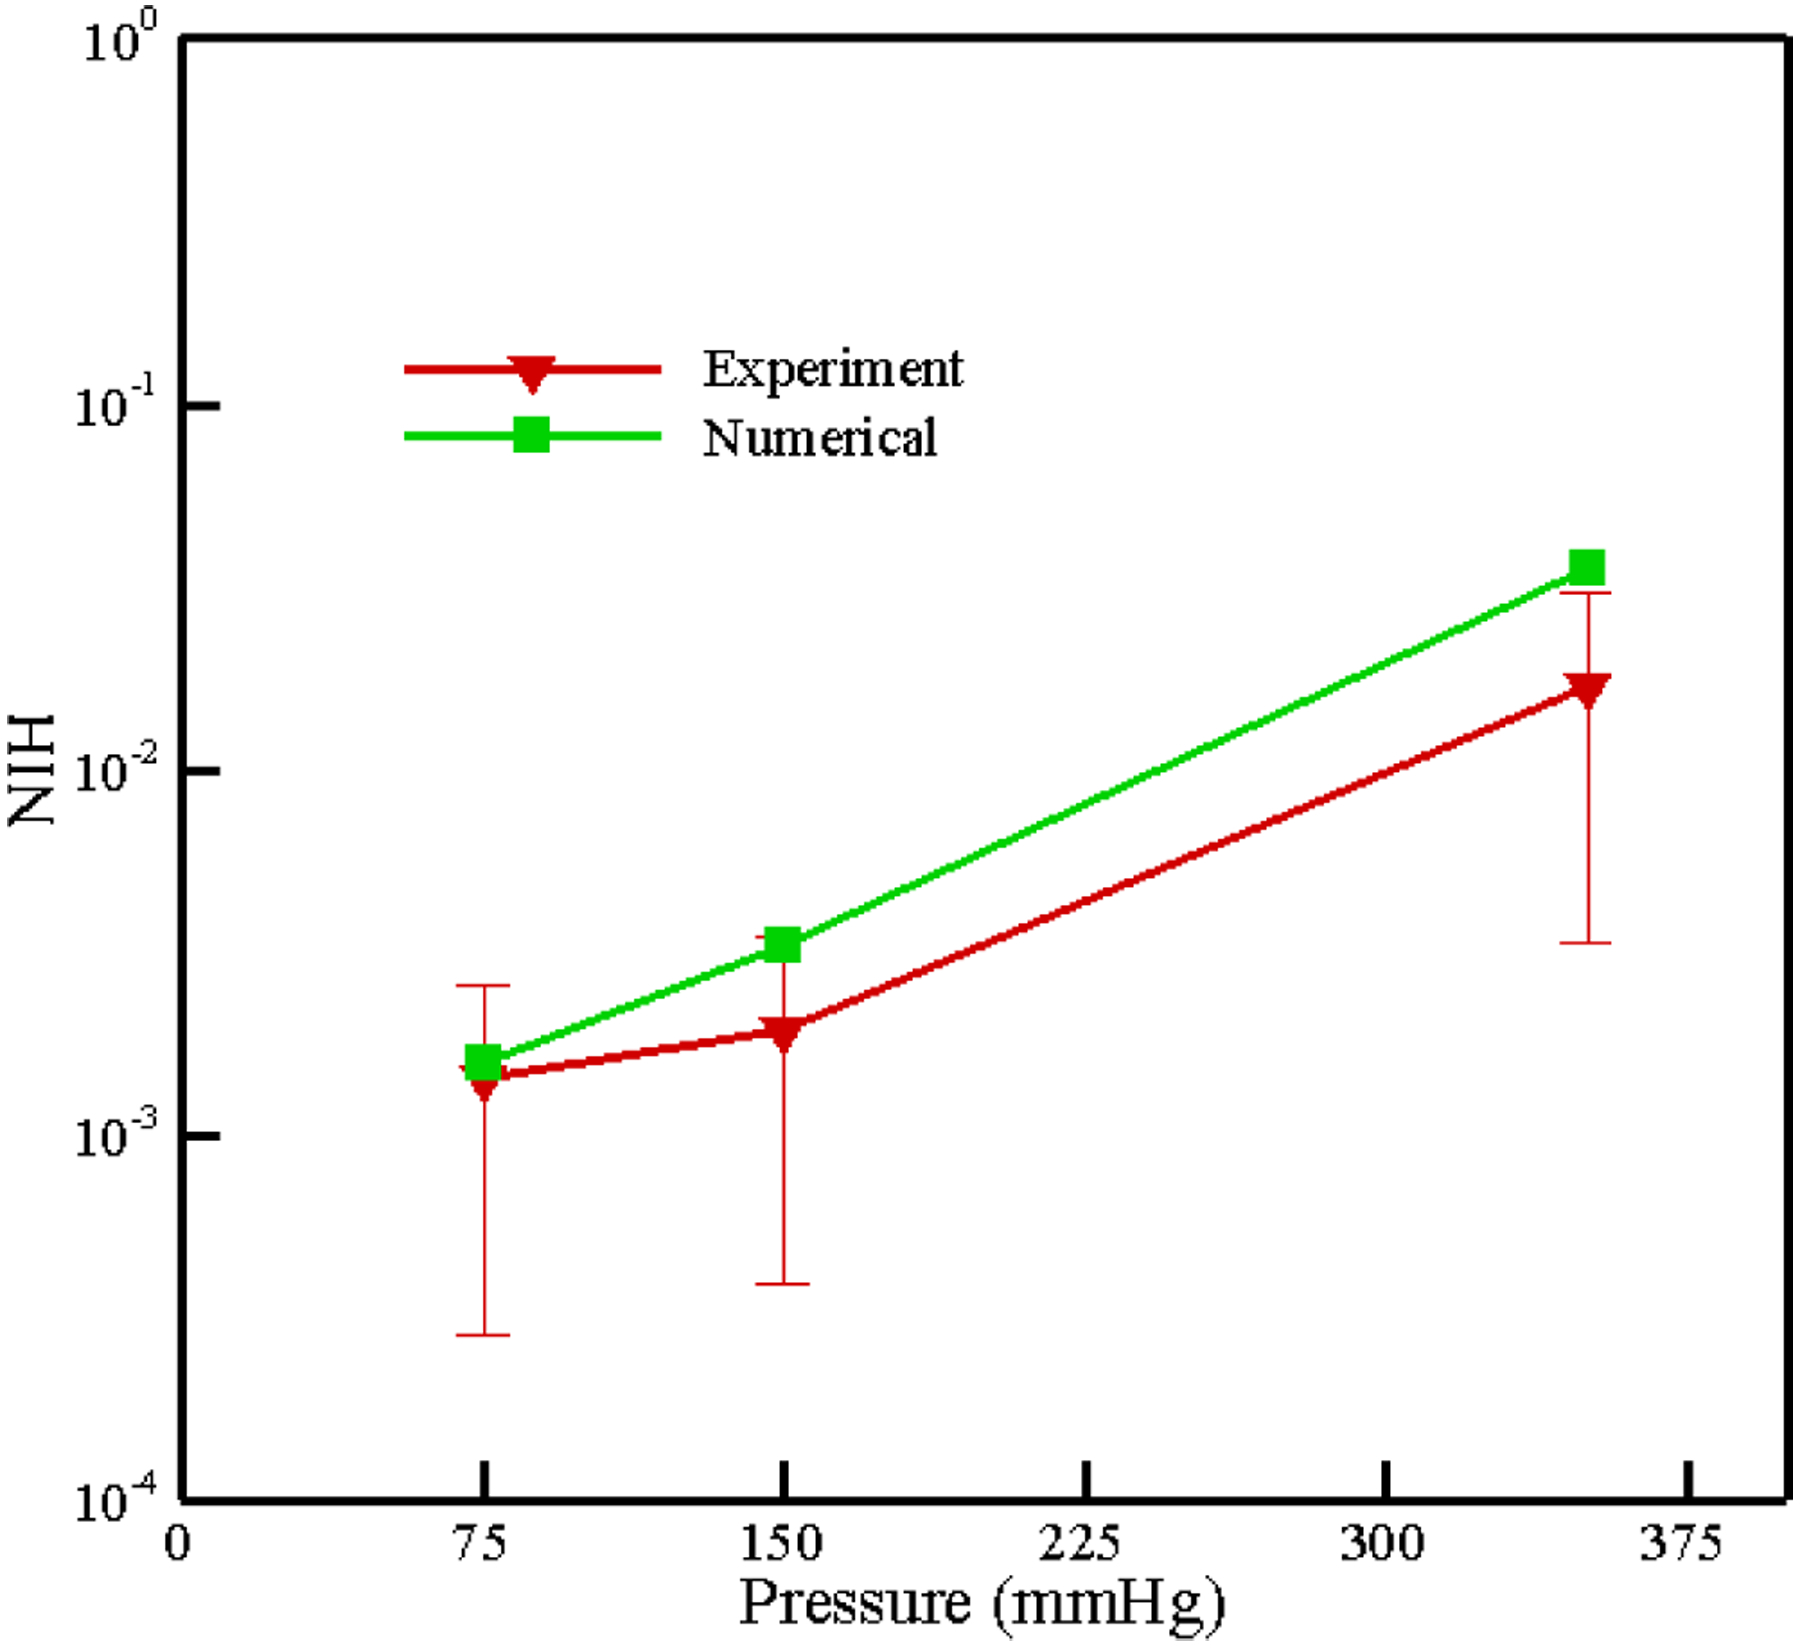
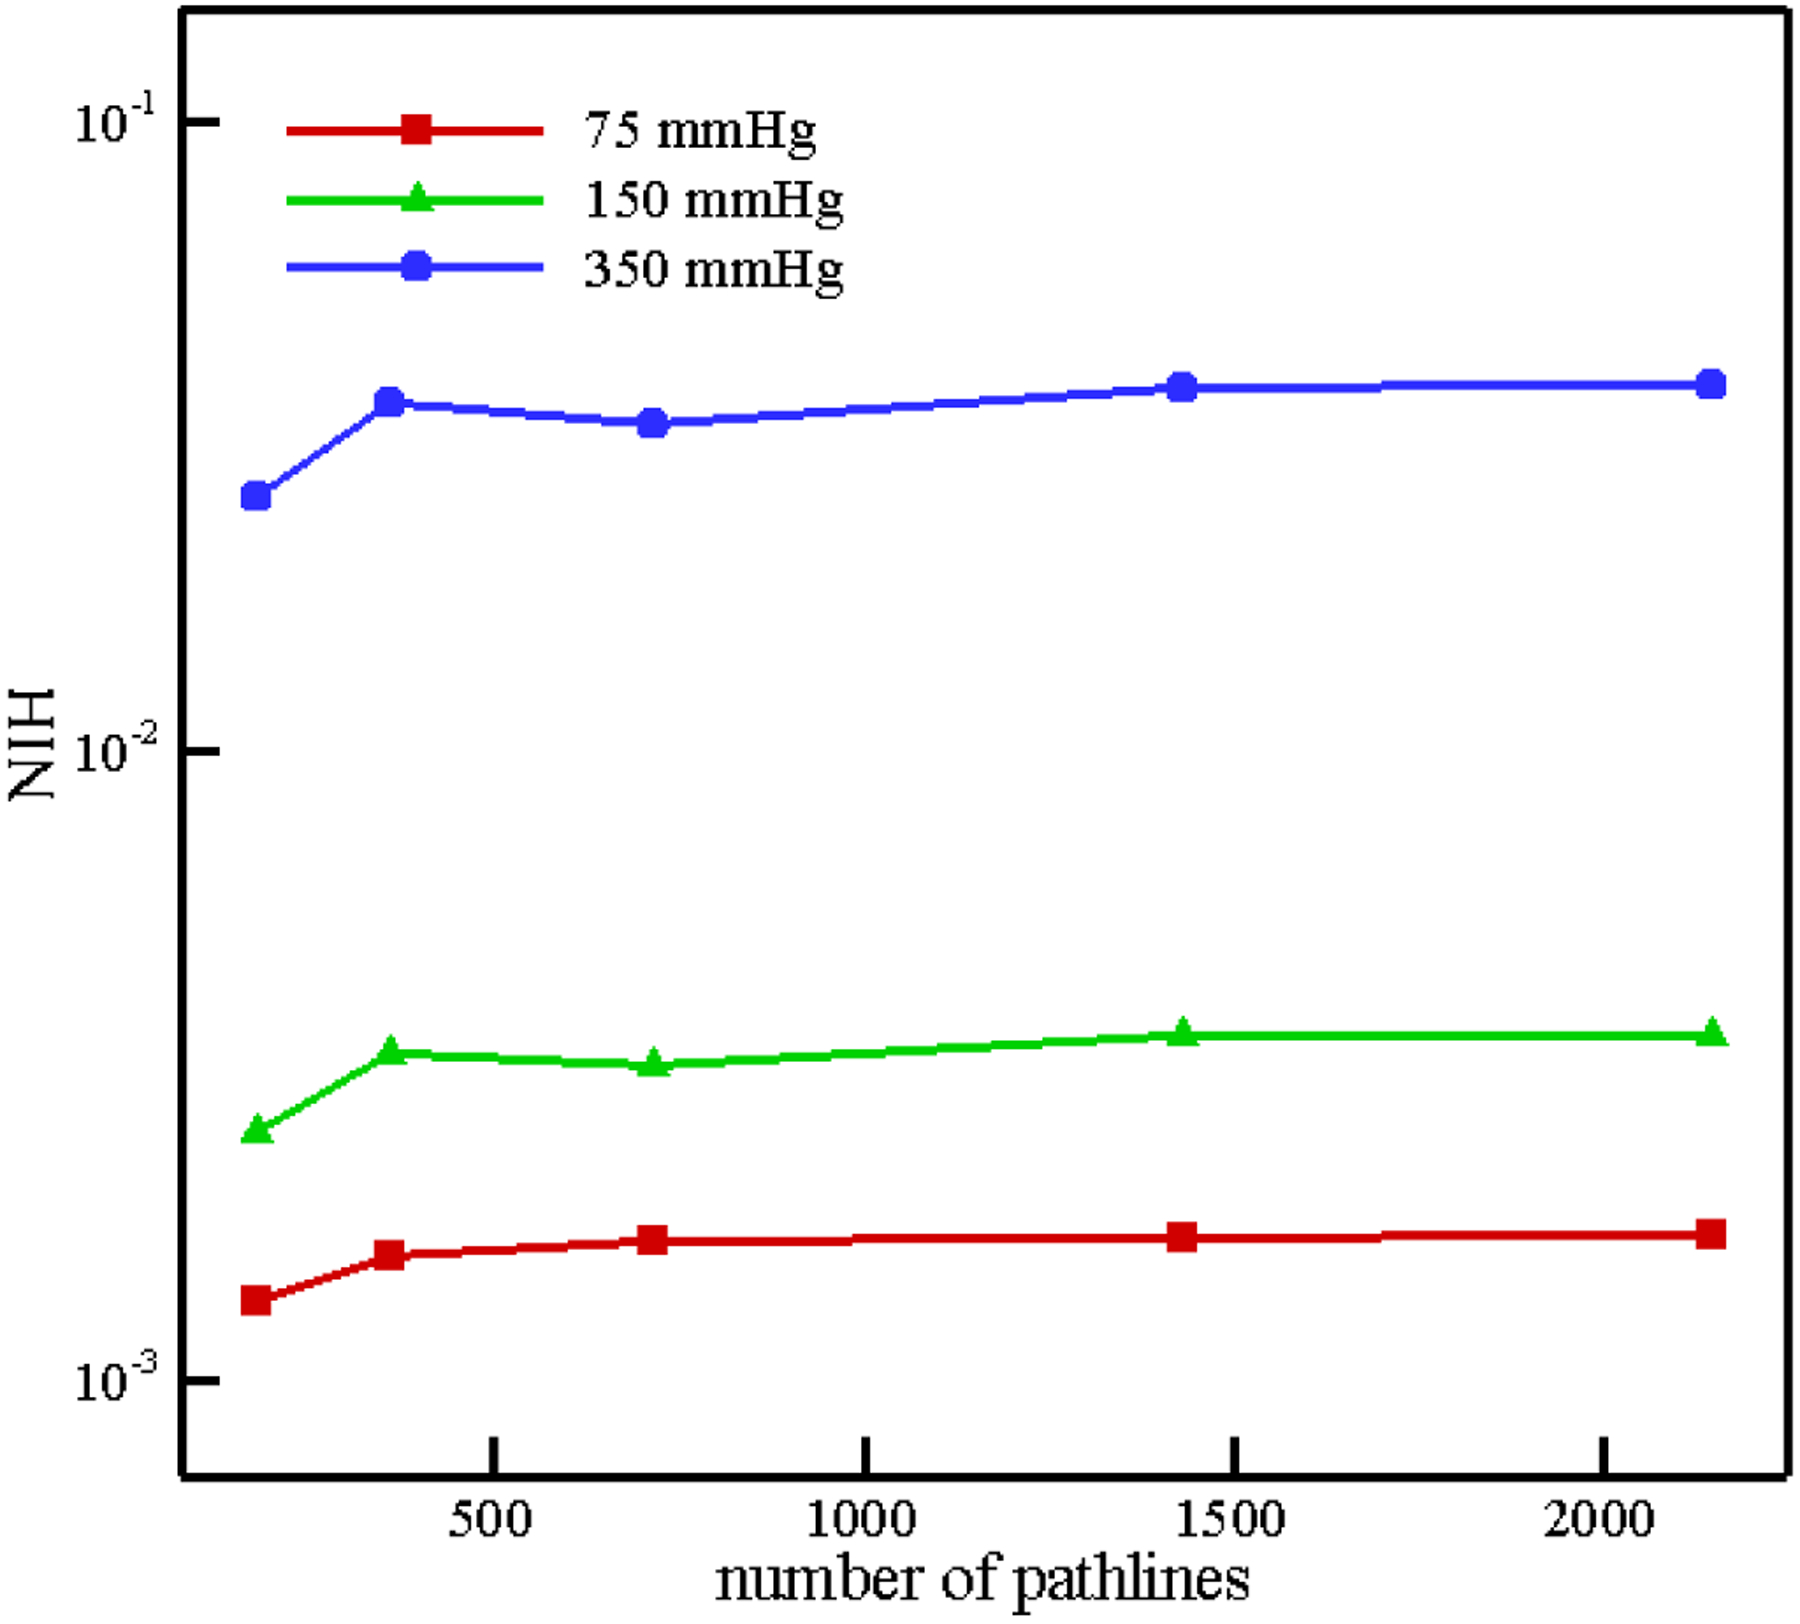
In Figure 18, the experimental and numerical NIH are compared with each other. As we can see, numerical results are in the range experimental data. Therefore, our hemolysis model is able to predict the value of hemolysis with enough accuracy in a complex flow. Similar to FDA nozzle, in this test case, the sensitivity of NIH with respect to the number of path lines is analyzed up to 2063 paths for different pressure difference in Figure 19. As the figure illustrates, above 358 pathlines, less than 7% difference is observed in computed NIH. It is interesting to note that we need less number of pathlines in CentriMag with respect to FDA nozzle. However, the shear stress history along the CentriMag pathline varies largely, among neighboring pathlines, the variance is not that drastic because the flow in blade channel and volute are well guided. But in nozzle, flow patterns are very complicated in the sudden expansion and contraction areas and neighboring pathlines could be significantly different. Therefore, in CentriMag, if we skip some pathlines and do the weighting process (as we described it earlier) the results do not change considerably.
Figure 18:
Numerical and experimental results for NIH in CentriMag at different pressure heads.
Figure 19:
Variation in NIH estimation with number of pathlines in CentriMag.
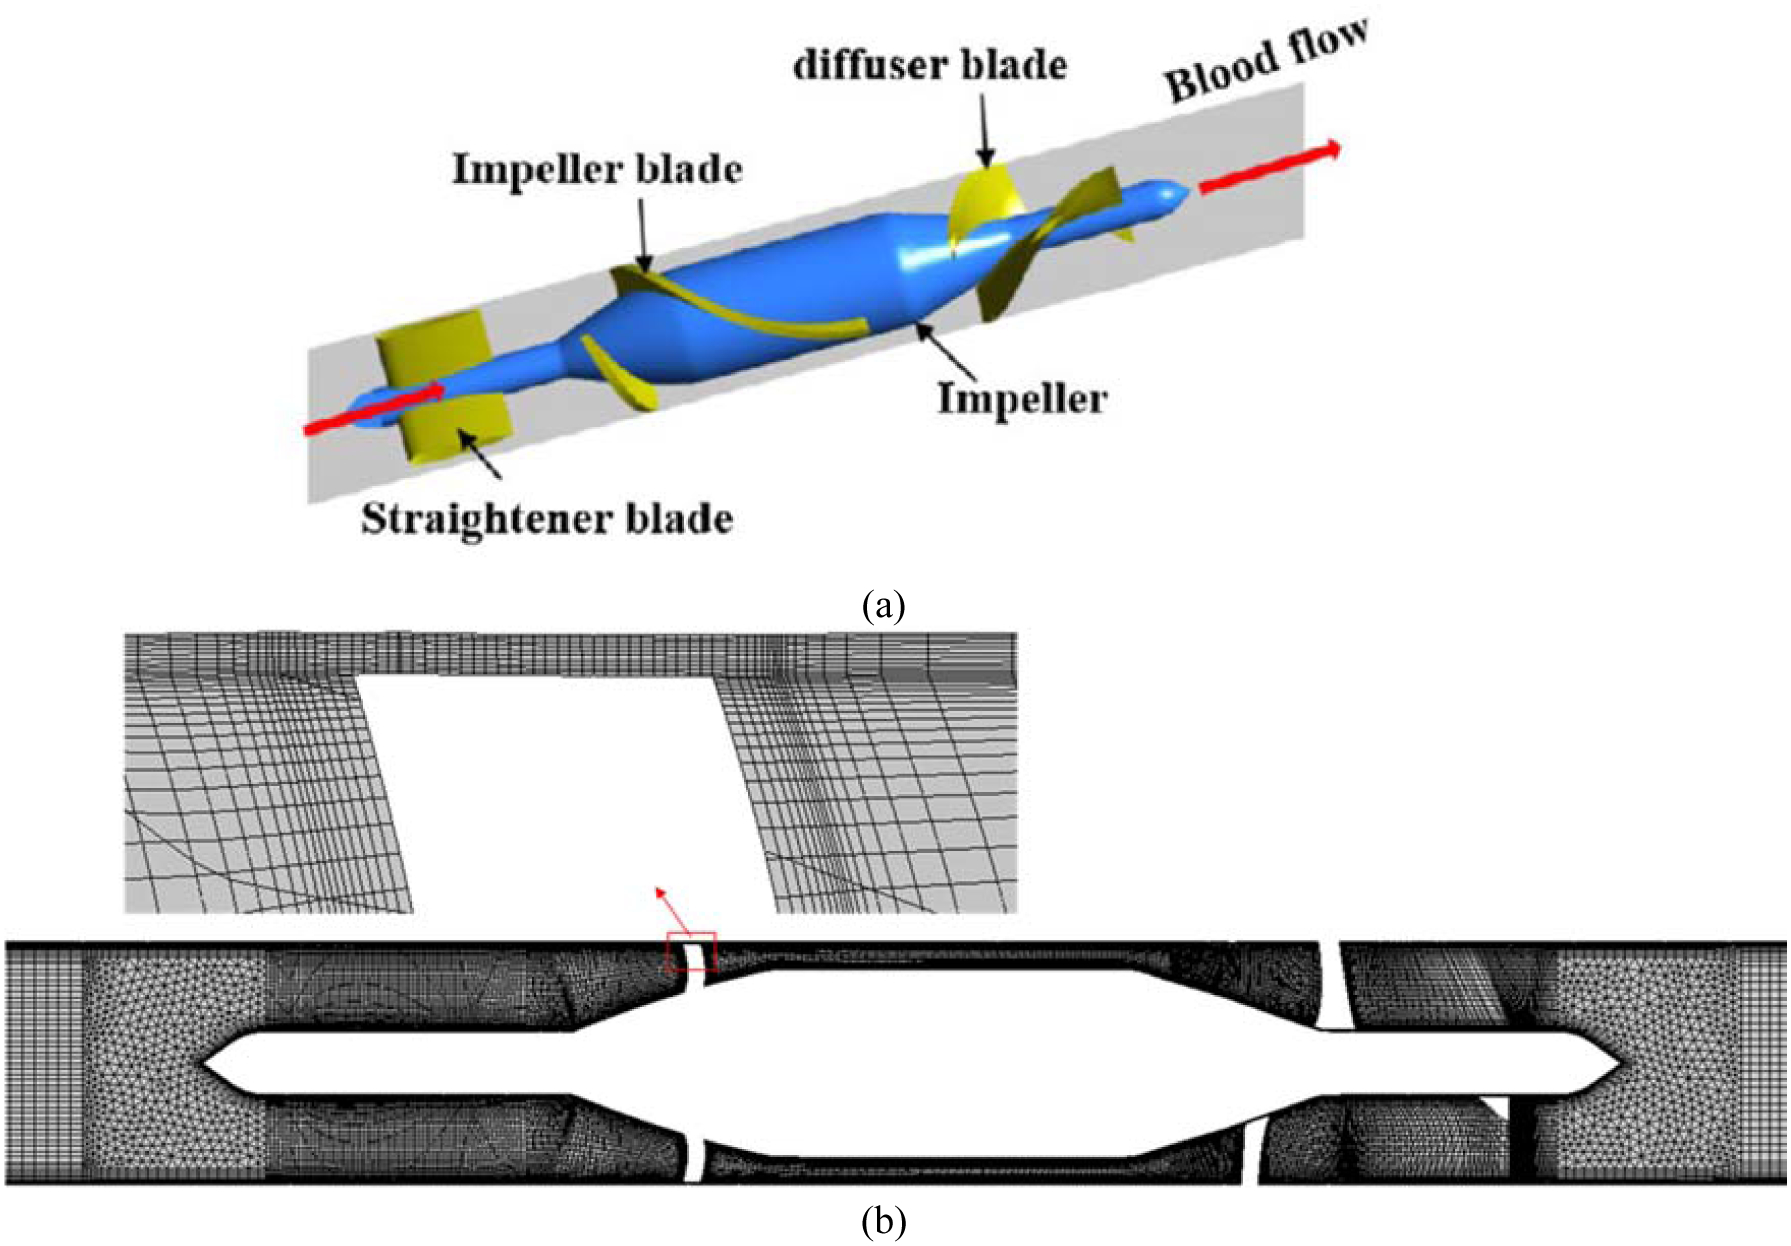
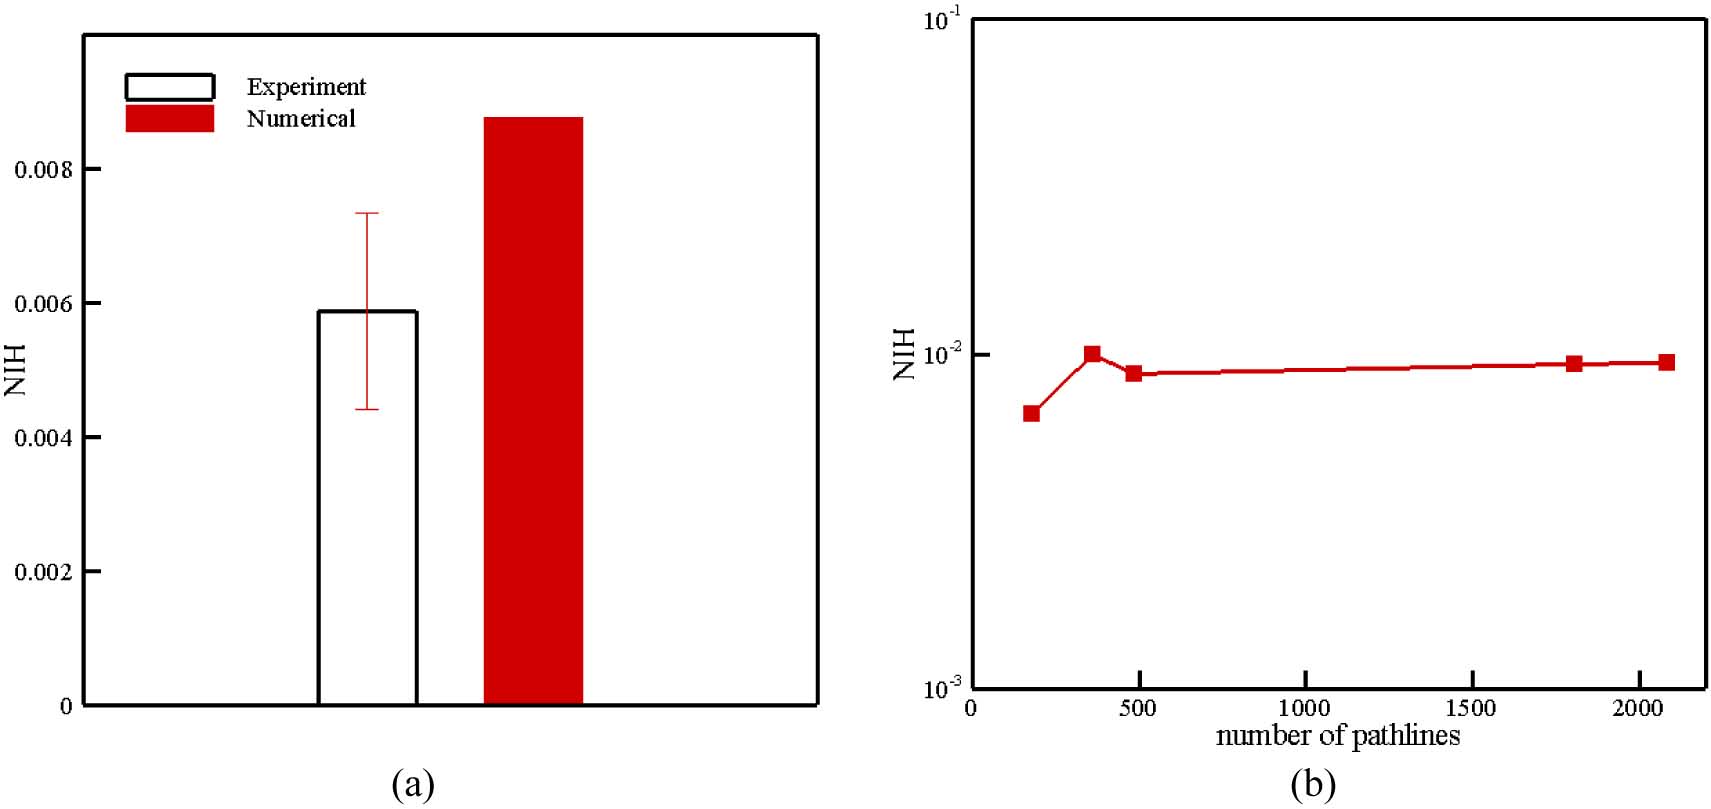
The second blood pump simulated in this section is HM II which is an axial blood pump in which the impeller is supported by a pair of mechanical ball-and-cup bearings. Figure 20 (a) shows the impeller, diffuser vanes, and supporting structure of HM II. The groups of authors recently measured the NIH in this device when the impeller speed is 9200 rpm and the flow rate is 4.5 LPM [69]. The loop used for measuring NIH of the HM II was the same as the CentriMag described previously. More details about this experiment can be found in [69]. The computational grid used for this test case is displayed in Figure 20 (b). Mesh was refined near walls and in the region with complex geometries. The numerical approach for solving the blood flow inside HM II is similar to the CentriMag. To calculate the NIH in HM II, we used 486 pathlines. In Figure 21 (a), the NIH computed for this test case via the proposed algorithm is compared with experimental data. As it can be observed the numerical results are close to the range of experimental data. To show the independency of numerical results from the number of pathlines, the computation was performed up to 486 pathlines (Figure 21 (b)). According to Figure 21 (b), the predicted NIH changes less 7% above 486 pathlines.
Figure 20:
(a) Schematic view of HeartMate II; (b) computational mesh (4.86 million elements)
Figure 21:
(a) Numerical and experimental results for NIH in HM II; (b) Variation in NIH estimation with number of pathlines in HM II.
4. Error Sources and Uncertainty Quantification
In the simulation performed in this study, inconsistencies between our prediction and experimental measurement may be attributed to simplified assumptions in our sub-models. For instance, CGMD results from equibiaxial stretching tests are used to determine pore formation criteria while the membrane undergoes various loading conditions which are not necessarily equibiaxial. Nanopores may not be always circular as it happens in equibiaxial stretching condition. CFD results also have an important influence on the hemolysis prediction. Therefore, it is very important to make sure that the underlying CFD simulation has high precision and the extracted pathlines can cover the high shear area in the device. Furthermore, turbulence effect on the RBC deformation was neglected in this study which can be considered as another source of error. The use of MRF method was an approximate of the pump impeller rotation. This approximation will affect the CFD predicted flow and shear stress fields inside the CentriMag pump, which could impact the hemolysis index prediction in this study. However, whether the MRF method may overestimate or underestimate the hemolysis is unclear. As another source of error, it should be mentioned that the device surface characteristics such as surface electrochemistry and roughness can influence the blood flow and corresponding shear stress which has not been taken into account in this study.
5. Conclusion
We presented a new Lagrangian strain-based model to predict hemolysis in biomedical devices. In contrast to the existing hemolysis models, this model does not have any empirical parameters and it can produce reasonable results in different kinds of devices under different operating conditions. In this algorithm, first the steady-state solution of the blood flow inside the medical device is first obtained via a CFD solver. Then, a number of pathlines from inlet to the outlet inside the computational domain is chosen and the history of the shear stress tensor is retrieved. The shear stress tensor is then converted to a force and applied on a CG model of the RBC. The RBC deforms and reaches an equilibrium state as a result of the implemented force. Once the deformation of a RBC has reached the equilibrium state, the local real strain of each patch is correlated to the sublytic pore size through the correlations obtained from MD simulations. To calculate the Hb release, a diffusion equation is solved for each patch. Finally, the total IH is calculated by integrating the instantaneous IH over all the selected pathlines.
Hemolysis in FDA nozzle, CentriMag and HM II blood pumps were calculated using the proposed method. The results showed that our model can well predict the hemolysis behavior inside FDA nozzle, while it is impossible for current models to capture the hemolysis trend without selecting proper empirical parameters. Moreover, hemolysis results of blood pumps show that our model can estimate the IH value correctly for a complex flow inside actual biomedical devices. To achieve more accurate prediction, this model still needs further improvements to provide more interesting insight for hemolysis prediction in medical devices. For example, instead of using a simple damage model, a localized coarse-grained molecular dynamics (CGMD) model at the high stress region on the RBC can be concurrently linked with CG membrane model to characterize pore formation and growth as well as to study hemoglobin release. This project is currently being studied in the groups of authors.
Acknowledgement
This work was supported by National Institutes of Health (NIH) (grant number: R01HL131750).
References
- [1].Schumacher JT, Grodrian A, Lemke K, Römer R, and Metze J, “System development for generating homogeneous cell suspensions and transporting them in microfluidic devices,” Eng. Life Sci, vol. 8, no. 1, pp. 49–55, 2008. [Google Scholar]
- [2].Throckmorton AL et al. , “Numerical, hydraulic, and hemolytic evaluation of an intravascular axial flow blood pump to mechanically support fontan patients,” Ann. Biomed. Eng, vol. 39, no. 1, pp. 324–336, 2011. [DOI] [PubMed] [Google Scholar]
- [3].Castellini P, Pinotti M, and Scalise L, “Particle image velocimetry for flow analysis in longitudinal planes across a mechanical artificial heart valve,” Artif. Organs, vol. 28, no. 5, pp. 507–513, 2004. [DOI] [PubMed] [Google Scholar]
- [4].Nair K et al. , “Characterization of cell viability during bioprinting processes,” Biotechnol. J, vol. 4, no. 8, pp. 1168–1177, 2009. [DOI] [PubMed] [Google Scholar]
- [5].Rother RP, Bell L, Hillmen P, and Gladwin MT, “The clinical sequelae of intravascular hemolysis and extracellular plasma hemoglobin: A novel mechanism of human disease,” Journal of the American Medical Association, vol. 293, no. 13 pp. 1653–1662, 2005. [DOI] [PubMed] [Google Scholar]
- [6].Giersiepen M, Wurzinger LJ, Opitz R, and Reul H, “Estimation of shear stress-related blood damage in heart valve prostheses--in vitro comparison of 25 aortic valves.,” Int. J. Artif. Organs, vol. 13, no. 5, pp. 300–6, May 1990. [PubMed] [Google Scholar]
- [7].Zhang T et al. , “Study of flow-induced hemolysis using novel couette-type blood-shearing devices,” Artif. Organs, vol. 35, no. 12, pp. 1180–1186, 2012. [DOI] [PubMed] [Google Scholar]
- [8].Galdi GP, Rannacher R, Roberston AM, and Turek S, Summary for Policymakers. 2008.
- [9].Yu H, Engel S, Janiga G, and Thévenin D, “A Review of Hemolysis Prediction Models for Computational Fluid Dynamics,” Artificial Organs, vol. 41, no. 7 pp. 603–621, 2017. [DOI] [PubMed] [Google Scholar]
- [10].Taskin ME, Fraser KH, Zhang T, Wu C, Griffith BP, and Wu ZJ, “Evaluation of Eulerian and Lagrangian models for hemolysis estimation,” ASAIO J, vol. 58, no. 4, pp. 363–372, 2012. [DOI] [PubMed] [Google Scholar]
- [11].Berg P, Abdelsamie A, Yu H, Janiga G, and Thévenin D, “Multi-Phase Blood Flow Modeling in Intracranial Aneurysms Considering Possible Transition to Turbulence,” 2014, p. V01AT04A005.
- [12].Liu Y and Liu WK, “Rheology of red blood cell aggregation by computer simulation,” J. Comput. Phys, vol. 220, no. 1, pp. 139–154, 2006. [Google Scholar]
- [13].Liu Y et al. , “Immersed electrokinetic finite element method,” Int. J. Numer. Methods Eng, vol. 71, no. 4, pp. 379–405, 2007. [Google Scholar]
- [14].Liu Y et al. , “Manipulation of nanoparticles and biomolecules by electric field and surface tension,” Comput. Methods Appl. Mech. Eng, vol. 197, no. 25–28, pp. 2156–2172, 2008. [Google Scholar]
- [15].Liu Y, Zhang L, Wang X, and Liu WK, “Coupling of Navier-Stokes equations with protein molecular dynamics and its application to hemodynamics,” Int. J. Numer. Methods Fluids, vol. 46, no. 12, pp. 1237–1252, 2004. [Google Scholar]
- [16].Liu Y, Chung JH, Liu WK, and Ruoff RS, “Dielectrophoretic assembly of nanowires,” J. Phys. Chem. B, vol. 110, no. 29, pp. 14098–14106, 2006. [DOI] [PubMed] [Google Scholar]
- [17].Tan J, Thomas A, and Liu Y, “Influence of red blood cells on nanoparticle targeted delivery in microcirculation,” Soft Matter, vol. 8, no. 6, pp. 1934–1946, 2012. [DOI] [PMC free article] [PubMed] [Google Scholar]
- [18].Sohrabi S and Liu Y, “A Cellular Model of Shear-Induced Hemolysis,” Artif. Organs, vol. 41, no. 9, pp. 80–91, 2017. [DOI] [PMC free article] [PubMed] [Google Scholar]
- [19].Fedosov DA, Caswell B, and Karniadakis GE, “A multiscale red blood cell model with accurate mechanics, rheology,dynamics,” Biophys. J, vol. 98, no. 10, pp. 2215–2225, May 2010. [DOI] [PMC free article] [PubMed] [Google Scholar]
- [20].Fedosov DA, Caswell B, and Karniadakis GE, “Systematic coarse-graining of spectrin-level red blood cell models,” Comput. Methods Appl. Mech. Eng, vol. 199, no. 29–32, pp. 1937–1948, 2010. [DOI] [PMC free article] [PubMed] [Google Scholar]
- [21].Závodszky G, van Rooij B, Azizi V, and Hoekstra A, “Cellular level in-silico modeling of blood rheology with an improved material model for red blood cells,” Front. Physiol, vol. 8, no. AUG, p. 563, August 2017. [DOI] [PMC free article] [PubMed] [Google Scholar]
- [22].Gusenbauer M et al. , “Cell Damage Index as Computational Indicator for Blood Cell Activation and Damage,” Artif. Organs, vol. 42, no. 7, pp. 746–755, 2018. [DOI] [PMC free article] [PubMed] [Google Scholar]
- [23].Heuser G and Opitz R, “A Couette viscometer for short time shearing of blood,” Biorheology, vol. 17, no. 1–2, pp. 17–24, December 2017. [DOI] [PubMed] [Google Scholar]
- [24].Grigioni M, Morbiducci U, D’Avenio G, Di Benedetto G, and Del Gaudio C, “A novel formulation for blood trauma prediction by a modified power-law mathematical model,” Biomech. Model. Mechanobiol, vol. 4, no. 4, pp. 249–260, 2005. [DOI] [PubMed] [Google Scholar]
- [25].Arora D, “Computational Hemodynamics: Hemolysis and Viscoelasticity,” Rice University, 2005. [Google Scholar]
- [26].Chen Y and Sharp MK, “A Strain-Based Flow-Induced Hemolysis Prediction Model Calibrated by In Vitro Erythrocyte Deformation Measurements,” Artif. Organs, vol. 35, no. 2, pp. 145–156, 2011. [DOI] [PubMed] [Google Scholar]
- [27].Pauli L, Nam J, Pasquali M, and Behr M, “Transient stress-based and strain-based hemolysis estimation in a simplified blood pump.,” Int. j. numer. method. biomed. eng, vol. 29, no. 10, pp. 1148–60, October 2013. [DOI] [PMC free article] [PubMed] [Google Scholar]
- [28].Farinas M-I, Garon A, Lacasse D, and N’dri D, “Asymptotically Consistent Numerical Approximation of Hemolysis,” J. Biomech. Eng, vol. 128, no. 5, p. 688, 2006. [DOI] [PubMed] [Google Scholar]
- [29].Arora D, Behr M, and Pasquali M, “Hemolysis estimation in a centrifugal blood pump using a tensor-based measure,” Artif. Organs, vol. 30, no. 7, pp. 539–547, July 2006. [DOI] [PubMed] [Google Scholar]
- [30].Arora D, Behr M, and Pasquali M, “A tensor-based measure for estimating blood damage,” Artif. Organs, vol. 28, no. 11, pp. 1002–1015, November 2004. [DOI] [PubMed] [Google Scholar]
- [31].Vitale F et al. , “A multiscale, biophysical model of flow-induced red blood cell damage,” AIChE J, vol. 60, no. 4, pp. 1509–1516, April 2014. [Google Scholar]
- [32].Lacasse D, Garon A, and Pelletier D, “Mechanical hemolysis in blood flow: User-independent predictions with the solution of a partial differential equation,” Comput. Methods Biomech. Biomed. Engin, vol. 10, no. 1, pp. 1–12, 2007. [DOI] [PubMed] [Google Scholar]
- [33].Chen Z et al. , “Flow features and device-induced blood trauma in CF-VADs under a pulsatile blood flow condition: A CFD comparative study,” Int. j. numer. method. biomed. eng, vol. 34, no. 2, 2018. [DOI] [PMC free article] [PubMed] [Google Scholar]
- [34].Garon A and Farinas MI, “Fast three-dimensional numerical hemolysis approximation,” Artif. Organs, vol. 28, no. 11, pp. 1016–1025, 2004. [DOI] [PubMed] [Google Scholar]
- [35].Zhang J et al. , “Computational and experimental evaluation of the fluid dynamics and hemocompatibility of the centrimag blood pump,” Artif. Organs, vol. 30, no. 3, pp. 168–177, 2006. [DOI] [PubMed] [Google Scholar]
- [36].Song X, Throckmorton AL, Wood HG, Antaki JF, and Olsen DB, “Quantitative Evaluation of Blood Damage in a Centrifugal VAD by Computational Fluid Dynamics,” J. Fluids Eng, vol. 126, no. 3, p. 410, 2004. [Google Scholar]
- [37].Yano T et al. , “An Estimation Method of Hemolysis within an Axial Flow Blood Pump by Computational Fluid Dynamics Analysis,” in Artificial Organs, 2003, vol. 27, no. 10, pp. 920–925. [DOI] [PubMed] [Google Scholar]
- [38].Chan WK, Wong YW, Ding Y, Chua LP, and Yu SCM, “Numerical investigation of the effect of blade geometry on blood trauma in a centrifugal blood pump,” Artif. Organs, vol. 26, no. 9, pp. 785–793, 2002. [DOI] [PubMed] [Google Scholar]
- [39].Faghih MM and Sharp MK, “Modeling and prediction of flow-induced hemolysis: a review,” Biomech. Model. Mechanobiol, pp. 1–37, 2019. [DOI] [PubMed] [Google Scholar]
- [40].Guido S and Tomaiuolo G, “Microconfined flow behavior of red blood cells in vitro,” Comptes Rendus Physique, vol. 10, no. 8 pp. 751–763, 2009. [Google Scholar]
- [41].Hallow DM, Seeger RA, Kamaev PP, Prado GR, LaPlaca MC, and Prausnitz MR, “Shear-induced intracellular loading of cells with molecules by controlled microfluidics,” Biotechnol. Bioeng, vol. 99, no. 4, pp. 846–854, 2008. [DOI] [PMC free article] [PubMed] [Google Scholar]
- [42].Ohta Y, Okamoto H, Kanno M, and Okuda T, “Atomic force microscopic observation of mechanically traumatized erythrocytes,” in Artificial Organs, 2002, vol. 26, no. 1, pp. 10–17. [DOI] [PubMed] [Google Scholar]
- [43].Ezzeldin HM, de Tullio MD, Vanella M, Solares SD, and Balaras E, “A Strain-Based Model for Mechanical Hemolysis Based on a Coarse-Grained Red Blood Cell Model,” Ann. Biomed. Eng, vol. 43, no. 6, pp. 1398–1409, 2015. [DOI] [PubMed] [Google Scholar]
- [44].Zhang J, Zhang P, Fraser KH, Griffith BP, and Wu ZJ, “Comparison and Experimental Validation of Fluid Dynamic Numerical Models for a Clinical Ventricular Assist Device,” Artif. Organs, vol. 37, no. 4, pp. 380–389, 2013. [DOI] [PMC free article] [PubMed] [Google Scholar]
- [45].Muntwyler J, Abetel G, Gruner C, and Follath F, “One-year mortality among unselected outpatients with heart failure,” Eur. Heart J, vol. 23, no. 23, pp. 1861–1866, 2002. [DOI] [PubMed] [Google Scholar]
- [46].Baskurt OK and Meiselman HJ, “Blood Rheology and Hemodynamics,” Seminars in Thrombosis and Hemostasis, vol. 29, no. 5 pp. 435–450, 2003. [DOI] [PubMed] [Google Scholar]
- [47].Wu P, Gao Q, and Hsu PL, “On the representation of effective stress for computing hemolysis,” Biomech. Model. Mechanobiol, vol. 18, no. 3, pp. 665–679, 2019. [DOI] [PubMed] [Google Scholar]
- [48].Ge L, Dasi LP, Sotiropoulos F, and Yoganathan AP, “Characterization of hemodynamic forces induced by mechanical heart valves: Reynolds vs. viscous stresses,” Ann. Biomed. Eng, vol. 36, no. 2, pp. 276–297, 2008. [DOI] [PubMed] [Google Scholar]
- [49].Quinlan NJ and Dooley PN, “Models of flow-induced loading on blood cells in laminar and turbulent flow, with application to cardiovascular device flow,” Ann. Biomed. Eng, vol. 35, no. 8, pp. 1347–1356, 2007. [DOI] [PubMed] [Google Scholar]
- [50].Hund SJ, Antaki JF, and Massoudi M, “On the representation of turbulent stresses for computing blood damage,” Int. J. Eng. Sci, vol. 48, no. 11, pp. 1325–1331, 2010. [DOI] [PMC free article] [PubMed] [Google Scholar]
- [51].Verlet L, “Computer ‘experiments’ on classical fluids. I. Thermodynamical properties of Lennard-Jones molecules,” Phys. Rev, vol. 159, no. 1, pp. 98–103, 1967. [Google Scholar]
- [52].Mills JP, Qie L, Dao M, Lim CT, and Suresh S, “Nonlinear elastic and viscoelastic deformation of the human red blood cell with optical tweezers.,” Mech. Chem. Biosyst, vol. 1, no. 3, pp. 169–80, 2004. [PubMed] [Google Scholar]
- [53].Hochmuth RM, Worthy PR, and Evans EA, “Red cell extensional recovery and the determination of membrane viscosity,” Biophys. J, vol. 26, no. 1, pp. 101–114, 1979. [DOI] [PMC free article] [PubMed] [Google Scholar]
- [54].Koshiyama K and Wada S, “Molecular dynamics simulations of pore formation dynamics during the rupture process of a phospholipid bilayer caused by high-speed equibiaxial stretching,” J. Biomech, vol. 44, no. 11, pp. 2053–2058, 2011. [DOI] [PubMed] [Google Scholar]
- [55].Tomasini MD, Rinaldi C, and Tomassone MS, “Molecular dynamics simulations of rupture in lipid bilayers,” Exp. Biol. Med, vol. 235, no. 2, pp. 181–188, 2010. [DOI] [PubMed] [Google Scholar]
- [56].V Tolpekina T, Den Otter WK, and Briels WJ, “Simulations of stable pores in membranes: System size dependence and line tension,” J. Chem. Phys, vol. 121, no. 10, pp. 154905–154701, 2004. [DOI] [PubMed] [Google Scholar]
- [57].Den Otter WK, “Free energies of stable and metastable pores in lipid membranes under tension,” J. Chem. Phys, vol. 131, no. 20, 2009. [DOI] [PubMed] [Google Scholar]
- [58].Leontiadou H, Mark AE, and Marrink SJ, “Molecular Dynamics Simulations of Hydrophilic Pores in Lipid Bilayers,” Biophys. J, vol. 86, no. 4, pp. 2156–2164, 2004. [DOI] [PMC free article] [PubMed] [Google Scholar]
- [59].Doster W and Longeville S, “Microscopic diffusion and hydrodynamic interactions of hemoglobin in red blood cells,” Biophys. J, vol. 93, no. 4, pp. 1360–1368, 2007. [DOI] [PMC free article] [PubMed] [Google Scholar]
- [60].Stewart SFC et al. , “Assessment of CFD Performance in Simulations of an Idealized Medical Device: Results of FDA’s First Computational Interlaboratory Study,” Cardiovasc. Eng. Technol, vol. 3, no. 2, pp. 139–160, 2012. [Google Scholar]
- [61].Stewart SFC et al. , “Results of FDA’s First Interlaboratory Computational Study of a Nozzle with a Sudden Contraction and Conical Diffuser,” Cardiovasc. Eng. Technol, vol. 4, no. 4, pp. 374–391, 2013. [Google Scholar]
- [62].Herbertson LH et al. , “Multilaboratory study of flow-induced hemolysis using the FDA benchmark nozzle model,” Artif. Organs, vol. 39, no. 3, pp. 237–248, 2015. [DOI] [PMC free article] [PubMed] [Google Scholar]
- [63].Woodcock J, “FDA’s Critical Path Initiative,” Drug Discov. Today Technol, vol. 4, no. 1, p. 1, 2007. [DOI] [PubMed] [Google Scholar]
- [64].Yu H, Thévenin D, and Janiga G, “Numerical Prediction of Hemolysis Based on Computational Fluid Dynamics,” in ECCOMAS Thematic International Conference on Simulation and Modeling of Biological Flows (SIMBIO), 2011, pp. 1–5. [Google Scholar]
- [65].Stewart S, Hariharan P, Berman M, Myers M, and Malinauskas R, “Turbulence modeling as a source of error in FDA’s Critical Path interlaboratory computational study of flow in a nozzle model,” in American Society of Internal Artificial Organs ASAIO, 56th Annual Conference, Poster Presentation, 2010. [Google Scholar]
- [66].Giarra M, “Multilaboratory Particle Image Velocimetry Analysis of the FDA Benchmark Nozzle Model to Support Validation of Computational Fluid Dynamics Simulations,” J. Biomech. Eng, vol. 133, no. 4, p. 041002, 2011. [DOI] [PubMed] [Google Scholar]
- [67].Stewart SFC et al. , “Preliminary Results of FDA’s Interlaboratory Assessment of Computational Fluid Dynamics and Hemolysis in Medical Devices,” in FDA-NHLBI-NSF Workshop CPI-CFD- Slide Presentation, 2009. [Google Scholar]
- [68].Stewart SFC et al. , “Preliminary Results of FDA’s ‘Critical Path’ Project to Validate Computational Fluid Dynamic Methods Used in Medical Device Evaluation,” in American Society of Internal Artificial Organs ASAIO, 55th Annual Conference, Poster Presentation, 2009, p. 4. [Google Scholar]
- [69].Berk ZBK, Zhang J, Chen Z, Tran D, Griffith BP, and Wu ZJ, “Evaluation of in vitro hemolysis and platelet activation of a newly developed maglev LVAD and two clinically used LVADs with human blood,” Artif. Organs, 2019. [DOI] [PMC free article] [PubMed] [Google Scholar]


