

Abstract
The balance of excitation and inhibition in neural circuits is hypothesized to be increased in autism spectrum disorder, possibly mediated by altered signaling of the inhibitory neurotransmitter γ-aminobutyric acid (GABA), yet empirical evidence in humans is inconsistent. We used edited magnetic resonance spectroscopy (MRS) to quantify signals associated with both GABA and the excitatory neurotransmitter glutamate in multiple regions of the sensory and sensorimotor cortex, including primary visual, auditory, and motor areas in adult individuals with autism and in neurotypical controls. Despite the strong a priori hypothesis of reduced GABA in autism spectrum disorder, we found no group differences in neurometabolite concentrations in any of the examined regions and no correlations of MRS measure with psychophysical visual sensitivity or autism symptomatology. We demonstrate high data quality that is comparable across groups, with a relatively large sample of well-characterized participants, and use Bayesian statistics to corroborate the lack of any group differences. We conclude that levels of GABA and Glx (glutamate, glutamine, and glutathione) in the sensory and sensorimotor cortex, as measured with MRS at 3T, are comparable in adults with autism and neurotypical individuals.
Keywords: autism spectrum disorders, magnetic resonance spectroscopy, γ-aminobutyric acid, glutamate, visual cortex, auditory cortex, sensorimotor cortex
Lay Summary:
γ-Aminobutyric acid (GABA) and glutamate are the main inhibitory and excitatory neurotransmitters in the human brain, respectively, and their balanced interaction is necessary for neural function. Previous research suggests that the GABA and glutamate systems might be altered in autism. In this study, we used magnetic resonance spectroscopy to measure concentrations of these neurotransmitters in the sensory areas in the brains of young adults with autism. In contradiction to the common hypothesis of reduced GABA in autism, we demonstrate that concentrations of both GABA and glutamate, in all the brain regions examined, are comparable in individuals with autism and in neurotypical adults.
Introduction
An imbalance of excitation and inhibition (E/I) in neural circuits has been postulated as a key neurobiological characteristic of autism spectrum disorder [ASD; Nelson & Valakh, 2015; Rubenstein & Merzenich, 2003; Sohal & Rubenstein, 2019; Yizhar et al., 2011]. E/I balance is a complex multidimensional concept influenced by multiple mechanisms at the cellular and the circuit levels. Among these mechanisms, there is an important role for the balanced interaction of the excitatory neurotransmitter glutamate and the inhibitory neurotransmitter γ-aminobutyric acid (GABA) to maintain E/I balance and effective neural processing [Bak, Schousboe, & Waagepetersen, 2006; McCormick, 1989; Petroff, 2002]. Multiple findings point to alterations in GABAergic signaling in ASD [Coghlan et al., 2012], including postmortem histological analyses that show altered expression of proteins involved in GABA transmission and low prevalence of GABA receptors [Fatemi et al., 2014; Fatemi, Reutiman, Folsom, & Thuras, 2009; Oblak, Gibbs, & Blatt, 2011], genetic studies identifying ASD-risk genes that code for GABA receptors [Griswold et al., 2012; Ma et al., 2005; Piton et al., 2013], and animal models demonstrating altered GABAergic pathways [Antoine, Langberg, Schnepel, & Feldman, 2019; Chao et al., 2010; Han et al., 2012; Lee, Lee, & Kim, 2017; Martens & Vandeghinste, 2010]. Similar kinds of findings, though less numerous, exist for glutamatergic signaling disruption in ASD [Carlson, 2012; Carlsson, 2015; Choudhury, Lahiri, & Rajamma, 2012; Fatemi et al., 2018; Jamain et al., 2002; Purcell, Jeon, Zimmerman, Blue, & Pevsner, 2001; Tarabeux et al., 2011].
In addition to these indirect findings, magnetic resonance spectroscopy (MRS) provides a noninvasive technique to measure concentrations of neurometabolites in vivo [de Graaf, 2019]. Using spectral editing techniques in MRS, it is possible to quantify signals associated with both GABA and glutamate in specific volumes of interest in the brain [Puts & Edden, 2012]. Currently, the most widely used sequence for GABA editing is MEGA-PRESS [Mescher, Merkle, Kirsch, Garwood, & Gruetter, 1998], yielding a measure of GABA at 3 ppm with contribution from coedited macromolecules, denoted as GABA+, and a combined measure of glutamate, glutamine, and glutathione at 3.75 ppm, denoted as Glx [Mullins et al., 2014].
Several recent MRS studies have reported reduced GABA+ concentration in children with ASD, lending support to the E/I imbalance model [Gaetz et al., 2014; Harada et al., 2011; Ito et al., 2017; Kubas et al., 2012; Port et al., 2017; Puts et al., 2017; Rojas, Singel, Steinmetz, Hepburn, & Brown, 2014]. However, others reported no differences in GABA+ levels between children with and without ASD [Brix et al., 2015; Carvalho Pereira, Violante, Mouga, Oliveira, & Castelo-Branco, 2018; Cochran et al., 2015; Drenthen et al., 2016; Goji et al., 2017]. Several studies with adult participants also found no differences in levels of GABA+ in ASD [Ajram et al., 2017; Horder et al., 2018; Kirkovski, Suo, Enticott, Yücel, & Fitzgerald, 2018; Port et al., 2017; Pretzsch et al., 2019; Robertson, Ratai, & Kanwisher, 2016]. Hence, although the overall trend is for lower GABA+ in ASD, it seems that results are inconsistent, owing perhaps to differences in experimental procedures and analysis methods, regions of interest (ROIs), and sample characteristics, as summarized in several recent reviews [Ajram et al., 2019; Ford & Crewther, 2016; Schür et al., 2016]. In the case of Glx, results are even less conclusive, with studies reporting reduced [Bernardi et al., 2011; Corrigan et al., 2013; DeVito et al., 2007; Hegarty et al., 2018; Horder et al., 2013, 2018; Kubas et al., 2012; Tebartz Van Elst et al., 2014], equivalent [Ajram et al., 2017; Aoki et al., 2012; Brix et al., 2015; Carvalho Pereira et al., 2018; Endres et al., 2017; Friedman et al., 2006; Goji et al., 2017; Hardan et al., 2008; Horder et al., 2018; Ito et al., 2017; Libero et al., 2016; Mikkelsen et al., 2017; Robertson et al., 2016], or increased [Bejjani et al., 2012; Brown, Singel, Hepburn, & Rojas, 2013; Doyle-Thomas et al., 2014; Page et al., 2006] levels in ASD. In the current study, we sought to extend previous results by measuring GABA+ and Glx simultaneously using current methodology, in a relatively large sample of well-characterized individuals with ASD, including previously unexamined ROIs, and testing the functional relevance of neurometabolite levels by correlating individual differences in MRS measures with behavior and ASD symptomatology.
We quantified GABA+ and Glx in multiple regions of the sensory and sensorimotor cortex, including primary visual, auditory, and motor areas. Sensory sensitivities are common in ASD [Ben-Sasson et al., 2009; Leekam, Nieto, Libby, Wing, & Gould, 2007; Rogers & Ozonoff, 2005] and have been recently recognized as a core diagnostic feature of autism [American Psychiatric Association, 2013]. There are various psychophysical and neuroimaging findings that are consistent with alterations in the neural circuitry underlying sensory perception in ASD [Robertson & Baron-Cohen, 2017]. Both GABA and glutamate play an important role in the sensory systems in the brain, and it has been previously shown using MRS that these neurotransmitter levels are modulated by sensory input [Apšvalka, Gadie, Clemence, & Mullins, 2015; Kurcyus et al., 2018; Mekle et al., 2017] and are associated with sensory perception in the visual [Edden, Muthukumaraswamy, Freeman, & Singh, 2009; Van Loon et al., 2013], auditory [Kompus et al., 2015], and tactile [Heba et al., 2016; Puts, Edden, Evans, McGlone, & McGonigle, 2011] domains. Moreover, it has been suggested that the role of GABA and glutamate in perception and behavior may be different in the autistic brain than in neurotypicals [NTs; Puts et al., 2017; Robertson et al., 2016], and that it may correlate with subjective experience of the sensory world [Sapey-Triomphe, Lamberton, Sonié, Mattout, & Schmitz, 2019]. Thus, sensory and sensorimotor areas are the focus of the current study.
Specifically, we aimed to quantify GABA+ and Glx in ROIs previously associated with functional disruptions in ASD, which are also well established in the MRS literature: an occipital region over the early visual cortex, a left temporal region over the auditory cortex, and a parietal region over the sensorimotor cortex. These voxel locations are common in MRS studies [Puts & Edden, 2012], have clear anatomical landmarks [Gaetz et al., 2014], show good spatial overlap within and between participants [Bai et al., 2017], and have high signal-to-noise ratio (especially in the occipital and parietal regions; Mikkelsen, Loo, Puts, Edden, & Harris, 2018). Furthermore, there is evidence for disrupted gamma-band oscillations over these regions in ASD [Cornew, Roberts, Blaskey, & Edgar, 2012; Dickinson, Bruyns-Haylett, Smith, Jones, & Milne, 2016; Rojas et al., 2011; Snijders, Milivojevic, & Kemner, 2013], altered neural responses as indexed with functional MRI [fMRI; Brieber et al., 2010; Millin et al., 2018], and previous reports of altered neurometabolite levels in children with ASD [Gaetz et al., 2014; Port et al., 2017; Puts et al., 2017; Rojas et al., 2014], all suggestive of E/I disruptions. In addition to the above three regions, we placed two additional volumes of interest over left and right area MT+, a higher-order motion-sensitive visual area in the extrastriate cortex [Born & Bradley, 2005; Huk, Dougherty, & Heeger, 2002; Zeki, 2015]. While not previously studied with MRS, this region is of interest since atypical processing of moving visual stimuli is often reported in ASD, both in behavior and in neuroimaging [Koh, Milne, & Dobkins, 2010; Koldewyn, Whitney, & Rivera, 2011; Manning, Tibber, Charman, Dakin, & Pellicano, 2015; Robertson et al., 2014; Robertson, Martin, Baker, & Baron-Cohen, 2012; Spencer et al., 2000].
Since developmental changes may underlie the mixed results in previous MRS studies as described above, we confined the current sample to young adults, while controlling for effects of sex, IQ, and psychotropic medication as possible confounds, and applying various analysis approaches. Our results demonstrate typical concentrations of both GABA+ and Glx in adult ASD in all examined regions. Moreover, we did not find any associations of GABA+ or Glx with behavioral measures of visual sensitivity or with clinical measures of ASD symptoms.
Methods
Participants
Forty NT adult participants and 31 adult participants with ASD were recruited for the study. The same cohorts also participated in other studies recently reported by our group [Kolodny, Schallmo, Gerdts, Bernier, & Murray, 2020; Millin et al., 2018; Murray et al., 2018; Schallmo et al., 2018; Schallmo, Kolodny, et al., 2019; Schallmo, Millin, et al., 2019]. All participants had normal IQ (Wechsler Abbreviated Scale of Intelligence score; Stano, 2004) of at least 75, and normal or corrected-to-normal vision. Groups were of equivalent ages and IQ (age range: 18–30 years; nonverbal IQ scores: 75–160; Table 1). All participants reported smoking no more than one cigarette per day within the past 3 months, no illicit drug use within the past month, and no alcohol use within 3 days prior to scanning. Participants with ASD met diagnostic criteria for ASD on the Autism Diagnostic Interview-Revised [ADI-R; Lord, Rutter, & Le Couteur, 1994], the Autism Diagnostic Observation Schedule - 2nd Edition [ADOS-2; Lord et al., 2012], and according to expert clinical judgment using DSM-5 [American Psychiatric Association, 2013] criteria. Participants were included in the study only if stable on any medication dosage for at least 3 months prior to the study (see Supporting Information Table S1 for detailed medication information). All participants provided written informed consent to participate and were compensated monetarily for their time. The research protocol was approved by the Institutional Review Board of the University of Washington (UW).
Table 1.
Demographics and Clinical Scores
| NT (n = 39) | ASD (n = 29) | Stats | |
|---|---|---|---|
| Demographics | |||
| Sex | 23 M/16 F | 19 M/10 F | χ2(1) = 0.30, P = 0.583 |
| Age (years) | 23.0 (3.5) | 22.7 (3.6) | t(66) = 0.34, P = 0.734 |
| Nonverbal IQa | 113 (13) | 112 (17) | t(66) = 0.41, P = 0.681 |
| Handedness | 37 R/2 L | 25 R/4 L | χ2(1) = 1.55, P = 0.213 |
| Clinical scales | |||
| ADOS-2b | – | 7.34 (1.56) | – |
| Sensory Profile | 141.9 (17.7) | 154.9 (25.0) | t(65) = 2.49, P = 0.015 |
| Social | 38.6 (17.0) | 73.4 (27.7) | t(66) = 6.40, P < 0.001 |
| Responsiveness | |||
| Scale |
Note. Values for age, IQ, and all clinical scales represent means, with standard deviations in parentheses.
Nonverbal IQ was calculated based on the Wechsler Abbreviated Scale of Intelligence (WASI).
Autism Diagnostic Observation Schedule, 2nd Ed. (ADOS-2) total comparison score.
One NT and one ASD participant withdrew midway through the MRI scan due to discomfort and their data are not included. One ASD participant was excluded due to excessive motion during the scans resulting in severe artifacts. This resulted in a final sample of 39 NT and 29 ASD participants (Table 1). Nine temporal ROI data sets are missing: two NT and one ASD participants withdrew from the experiment after completing the main MRS session but before attending the separate session in which the temporal ROI was acquired. In two NT and one ASD participants, the temporal ROI acquisition was skipped due to time constrains during scanning. In addition, one NT and two ASD participants had severe artifacts in this scan and their data have been excluded. This resulted in a final sample of 34 NT and 25 ASD participants for the temporal ROI. One parietal data set of an ASD participant was also excluded due to severe artifacts, resulting in a final sample of 39 NT and 28 ASD participants for the parietal ROI.
MRI and MRS Acquisition
MR data were acquired on a Philips Achieva 3 Tesla scanner, with a 32-channel high-resolution head coil, over two scanning sessions. Detailed methods were reported in recent publications from our group [Schallmo et al., 2018; Schallmo, Millin, et al., 2019] and are briefly described here following the MRS-Q guidelines for reporting acquisition parameters and quality measures of MRS [Peek et al., 2020]. Briefly, we used Mescher-Garwood Point Resolved Spectroscopy sequence (MEGA-PRESS) to quantify GABA+ and Glx within 27 cm3 voxels (320 averages, 2 s TR, 68 ms TE, 2048 spectral data points, 2 kHz spectral width, 1.4 kHz refocusing pulse, VAPOR water suppression). Fourteen-millisecond editing pulses were applied at 1.9 ppm (“on”) or 7.5 ppm (“off”) during alternating acquisitions within a 16-step phase cycle. The duration of a single MRS run was approximately 11 min.
MRS was acquired in five different regions for each participant (Fig. 1): An occipital 3 × 3 × 3 cm3 voxel was placed medially within occipital cortex adjacent to the occipital pole, and aligned parallel to the cerebellar tentorium [Muthukumaraswamy, Edden, Jones, Swettenham, & Singh, 2009]. A centro-parietal 3 × 3 × 3 cm3 voxel was centered on the “hand knob” within the central sulcus [Yousry et al., 1997], and aligned parallel to the dorsolateral cortical surface, in the hemisphere contralateral to the dominant hand. A temporal 4 × 3 × 2 cm3 voxel was placed in the left hemisphere aligned to the mid-temporal lobe with the long aspect (4 cm) of the cuboid positioned such that the top of the voxel contained the superior temporal gyrus [Gaetz et al., 2014]. The voxel was placed in the left hemisphere following previous studies in children [Gaetz et al., 2014; Port et al., 2017; Rojas et al., 2014] and due to the proximity to language-processing areas. Left and right 3 × 3 × 3 cm3 voxels in the ventrolateral occipital lobes, parallel to the lateral cortical surface, were further positioned based on an in-session functional localizer fMRI scan designed to identify human MT complex (hMT+, not attempting to distinguish between areas MT and MST, which are both motion selective; Huk et al., 2002). The localizer consisted of drifting and static 15% contrast gratings subtending 2° visual angle presented in the center of the visual field in alternating 10 s blocks (duration = 195 s, TR = 3 s, resolution = 3 × 3 × 5 mm, 14 slices with 0.5 mm gap). Functional localizer data were acquired prior to the anatomical scan and subsequent MRS runs, in order to minimize the effect of frequency drift during MRS caused by gradient heating during fMRI. The hMT + region was identified online using Philips iViewBOLD to identify voxels in the lateral occipital lobe that responded significantly more to moving versus static gratings (t ≥ 3.0).
Figure 1.
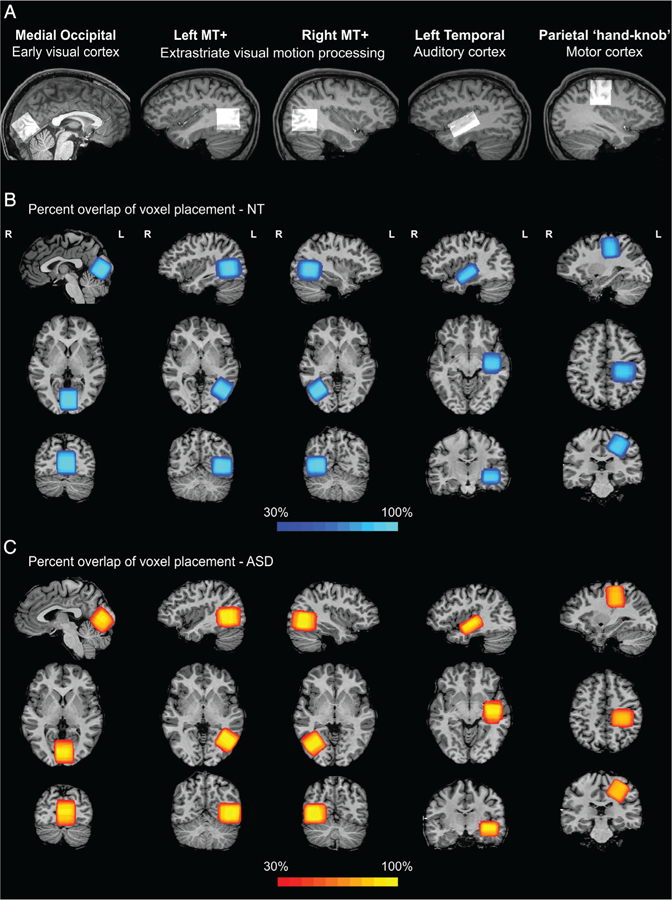
Regions of interest in visual, auditory, and motor areas. For each ROI, the voxel location for an example participant is overlaid on a sagittal slice from their anatomical scan and presented in the upper row (A). The spatial percent overlap across NT participants (B) and ASD participants (C) is presented on top of an example subject’s anatomical scan in sagittal, axial, and coronal (top to bottom) views.
T1-weighted structural MRI data were acquired in each session using MPRAGE sequence at 1 mm isotropic resolution. In the first MRS session, a structural scan was run after the MT+ functional localizer, followed by MRS scans in a fixed order: left MT+, parietal, occipital, and right MT+. The session lasted approximately 1 hr and 10 min. In a second session that lasted approximately 1 hr, an in-session structural scan was followed by a second acquisition of an occipital voxel, then by temporal MRS. The latter part of this session included additional fMRI scans reported elsewhere [Millin et al., 2018]. Both sessions occurred within a 2-week time window. The fixed order of scans was chosen to maximize similarity of parameters when comparing scans of a specific region across participants. Examining the data quality measures, there were no systematic relationships between water frequency drift or creatine peak width and scan order (Fig. S3). There were, however, slightly more occasions of rejected time points in the right MT+ voxel in the ASD group, which was the last region in the acquisition sequence in the main MRS session, and this might be related to increased subject motion toward the end of the session. During structural MRI and MRS scans, participants watched a movie of their choice, to reduce fatigue and maximize compliance.
MRS Analysis
MRS data were analyzed in the Gannet 2.0 toolbox [Edden, Puts, Harris, Barker, & Evans, 2014] within MATLAB 2017a. Briefly, data were processed using the toolbox-standard approach, including automated frequency and phase correction, artifact rejection (frequency correction >3 SD above the mean), and 3 Hz exponential line broadening. To calculate the concentration of GABA+, a Gaussian was fit to the peak at 3 ppm. To calculate the concentration of Glx, a double Gaussian was fit to the peak at 3.75 ppm (Fig. 2). The area under the fitted curve served as the measure for metabolite concentration, and was scaled relative to water; the unsuppressed water peak was fit with a mixed Gaussian– Lorentzian. Tissue segmentation was performed on the T1 anatomical scan using SPM8 [Friston et al., 1994], and the tissue fractions were used to apply a scaling for neurometabolite concentrations based on the proportion of gray matter, white matter, and CSF within each MRS voxel, to account for different relaxation properties in different tissue types [Gasparovic et al., 2006; Mikkelsen et al., 2019]. A further correction (alpha-correction approach) was applied to GABA+ assuming twice the concentration in gray versus white matter [Harris, Puts, & Edden, 2015]. Tissue correction was not applied in the main analysis of Glx because there is no common standard for the ratio of Glx concentration in gray and white matters. However, since some studies suggest a similar 2:1 ratio of glutamate in gray and white matter [Morgenroth et al., 2019; Srinivasan et al., 2006], a complementary analysis was conducted using an alpha-corrected Glx. In addition, GABA+ values without the alpha-correction were also calculated (hereafter “uncorrected GABA+”), to align with the methods used in previous studies. For further comparability with other studies, GABA+ and Glx values scaled to creatine rather than to water are also reported, and these metabolite ratios were not tissue corrected. Concentrations for GABA+ and Glx are reported in institutional units (i.u.).
Figure 2.

Group averaged MRS spectra. Raw spectra (black), fitted GABA+, and Glx peaks for NT (blue) and ASD (red), and fitting residuals (green). Shaded regions represent the standard deviation across individual participants.
Voxel Placement Overlap
The quantification of spatial overlap of MRS voxels within each group was done using the Dice coefficient [Dice, 1945], defined as the intersection between voxel masks divided by their mean volume:, where A and B are the MRS voxel masks for a specific region (e.g., occipital) registered to Talairach space for two different participants; || denotes the number of anatomical voxels (1 mm isotropic voxels) that fall within the MRS voxel mask; and denotes the intersection of the two masks, that is, the number of anatomical voxels that are common to the two MRS voxel masks. The DC ranges between 0 (no overlap) and 1 (perfect overlap). To estimate between-subject overlap in each group of participants, the Dice coefficient was calculated for each subjects’ MRS voxel mask and each of the masks of any other participants from the same group (NT/ASD). These n−1 values (where n is the number of participants in the group) were averaged to create an index of spatial consistency for each subject and all other subjects in the same group. This procedure was done separately for each of the ROIs, and allowed for testing of whether the spatial overlap is significantly greater in one group than the other. Left-handed participants (Table 1) were excluded from the spatial overlap analysis of the parietal ROI.
Psychophysics
Visual sensitivity was assessed in two psychophysical tasks quantifying motion discrimination thresholds and contrast detection thresholds. Detailed methods for these tasks can be found in a recent publication from our group [Murray et al., 2018]. Briefly, stimuli were presented using a ViewSonic PF790 CRT monitor (120 Hz) with an associated Bits# stimulus processor (Cambridge Research Systems, Kent, UK). The monitor luminance was linearized using custom software. Stimuli were presented on a Windows PC in MATLAB 2015a (MathWorks, Natick, MA) using Psychtoolbox-3 [Brainard, 1997; Pelli, 1997], with a chin rest used to stabilize head position at a viewing distance of 66 cm.
For motion discrimination, the task was to detect whether a briefly presented grating drifted left or right [Foss-feig, Tadin, Schauder, & Cascio, 2013; Tadin, Lappin, Gilroy, & Blake, 2003]. Gratings were sinusoidal luminance modulated at two possible contrast levels (3 or 98%) and three different sizes (0.84°, 1.7°, or 10° diameter) and appeared in the center of the screen on a mean luminance background. Motion speed was 4 Hz, and spatial frequency was 1.2 cycles/°. Gratings were presented within a circular aperture, whose edges were blurred with a Gaussian envelope (SD = 0.21°). Stimulus duration was adjusted using a Psi adaptive staircase procedure, to determine the amount of time needed to correctly discriminate motion direction with 80% accuracy (i.e., the threshold). For the purpose of the current analysis, we computed a geometric mean across thresholds from different conditions, to create an overall estimate of motion sensitivity. For seven NT and six ASD participants, thresholds were not obtained for all of the stimuli conditions, hence their data from this task were not included. One NT and one ASD participants were excluded from the analysis due to catch trial accuracy lower than 80% (catch trials contained large high-contrast gratings presented for 333 ms). One additional NT participant and one ASD participant were excluded because their thresholds were more than 3 SDs away from the groups’ mean. This resulted in a final sample of 30 NT and 21 ASD participants for the motion discrimination task.
For contrast detection, the task was to detect whether a grating (sinusoidal luminance modulation within a Gaussian window, SD = 0.42°, FWHM = 1°, 1.5 cycles/°, vertical or horizontal orientation) was presented at the center of a mean gray background during either the first or second of two possible stimulus presentation intervals. Stimulus contrast was adjusted using the same staircase procedure as above to determine the lowest contrast that could be detected with 80% accuracy (i.e., the threshold). One participant in each group is missing the data for this task, thus the final sample for the contrast detection task includes 38 ASD and 28 ASD participants.
Clinical Scales
Clinical and cognitive assessments were conducted by clinicians expert in the evaluation of individuals with neurodevelopmental disorders. Autism symptom severity was estimated using the ADOS-2 [Lord et al., 2012], and was obtained only for participants in the ASD group. An overall comparison score was used for correlations with MRS measures reported in the main text, and domain comparison scores, separating social affect, and restricted and repetitive behaviors [Hus, Gotham, & Lord, 2014], were included in the exploratory analysis reported in the Supporting Information. Self-report on the Social Responsiveness Scale (SRS) served as an additional tool to capture autism-related symptoms in the NT population as well [Constantino, 2011; Constantino & Gruber, 2005]. To examine sensory characteristics as reflected in everyday behavior, we used the Adult/Adolescent Sensory Profile [Catana & Dunn, 2002] across all participants. One ASD participant did not complete this scale, hence data are reported for 39 NT and 28 ASD participants. To reduce the number of statistical tests, a total score (sum over the four subscales: sensory sensitivity, sensation seeking, sensory avoiding, and low registration) was used and reported in the main text. Subscale scores were used in the exploratory analysis reported in the Supporting Information.
Statistics
Statistical analyses were performed in MATLAB 2017a. Group differences were examined using two-sample t tests, with equality of variances verified using Levene’s test and normal data distribution verified using the Shapiro–Wilk test. In case of deviation from normality, the nonparametric Mann–Whitney U test was used to compare groups and is reported accordingly. Correlations were computed using two-tailed Pearson’s correlation coefficients. Significance level was defined as P < 0.05 for any individual test. Given the large number of statistical comparisons, the Benjamini– Hochberg procedure for controlling the false discovery rate (FDR) was applied to adjust P-values in analyses where a significant effect was found, separately for each analysis and metabolite but across ROIs and groups, and the number of comparisons corrected for is reported next to each corrected value. Unless otherwise stated, reported P-values are uncorrected.
To aid interpretation of null results, we complemented our standard null hypothesis significance testing with Bayesian analyses. The Bayes factor (BF) quantifies the ratio of the probability of the observed data under the null hypothesis (no group differences) and the probability of the data under the alternative (groups differ). Thus, if there is strong evidence in favor of the null, it will be reflected in a large BF; whereas, if the null hypothesis cannot be rejected due to low statistical power, this will result in a BF close to 1 (see Jarosz & Wiley, 2014; Rouder, Speckman, Sun, Morey, & Iverson, 2009 for comprehensive description of the Bayesian approach). We adopt here the convention that a BF between 1 and 3 implies anecdotal evidence for the lack of an effect, and a BF larger than 3 provides moderate evidence for the lack of an effect.
Outlier Exclusions
Several individual scans were deemed unusable by examining the raw spectra, due to severe artifacts, and were excluded before quantifying GABA+ or Glx, as described in the “Participants” section. All other obtained scans were included in the main analyses reported in the “Results” section. To examine the possible effects of outliers on our statistical results, we conducted an additional analysis, excluding data points deviating more than 3 SD from the groups’ mean. For the main analysis, this resulted in an exclusion of a single data point—Glx concentration of a NT participant in the temporal ROI, and this exclusion did not alter the pattern of the results (i.e., no group difference in Glx concentration). In addition, we applied a stricter procedure excluding any scan with an outlier value on any of the following data quality measures: water frequency drift, creatine (Cr) peak width, number of excluded timepoints, and fitting errors for GABA+, Glx, water, and Cr. This resulted in an exclusion of one occipital scan (ASD participant), three left MT+ scans (one NT, two ASD), three right MT+ scans (two NT, one ASD), three parietal scans (NT participants), and eight temporal scans (five NT, three ASD). A group comparison of GABA+ and Glx concentrations after these exclusions yielded the same pattern of results as in the main analysis, with no group difference in any metabolite in any of the ROIs (all ts < 1.3, P > 0.22).
Results
Using MR spectroscopy, we measured the concentration of GABA+ (GABA plus coedited macromolecules) and Glx (glutamate plus glutamine and glutathione) in five ROIs in visual, auditory, and motor cortices (Figs. 1 and 2; Fig. S1), among young adults with ASD and demographically matched NT participants (Table 1). No differences were found between the ASD and the NT groups, in any of the metabolites and ROIs (all t-values57–66 < 1.55; Table 2; Fig. 3). Traditional statistics were complemented with Bayesian analysis to quantify the evidence for the absence of group differences, yielding moderate evidence for the lack of an effect in most regions (1.44 < BF01 < 3.95; Table 2).
Table 2.
GABA+ and Glx Concentrations
| ROI | NT | ASD | Stats | |
|---|---|---|---|---|
| GABA+ | Occipital | 3.76 (0.27) | 3.82 (0.28) | U = 497, P = 0.399 |
| BF01 = 2.94 | ||||
| Left MT+ | 3.21 (0.27) | 3.26 (0.22) | t(66) = −0.77, P = 0.442 | |
| BF01 = 3.08 | ||||
| Right MT+ | 3.24 (0.28) | 3.28 (0.31) | t(66) = −0.61, P = 0.542 | |
| BF01 = 3.39 | ||||
| Temporal | 3.25 (0.48) | 3.22 (0.38) | t(57) = 0.20, P = 0.841 | |
| BF01 = 3.69 | ||||
| Parietal | 3.67 (0.27) | 3.77 (0.29) | t(65) = −1.55, P = 0.127 | |
| BF01 = 1.44 | ||||
| Glx | Occipital | 6.91 (0.68) | 6.72 (0.75) | t(66) = 1.10, P = 0.288 |
| BF01 = 2.39 | ||||
| Left MT+ | 5.51 (0.86) | 5.54 (1.07) | U = 554, P = 0.446 | |
| BF01 = 3.95 | ||||
| Right MT+ | 6.59 (0.67) | 6.83 (0.71) | t(66) = −1.46, P = 0.183 | |
| BF01 = 1.61 | ||||
| Temporal | 7.17 (0.93) | 7.11 (1.11) | t(57) = 0.24, P = 0.697 | |
| BF01 = 3.66 | ||||
| Parietal | 5.17 (0.59) | 5.12 (0.73) | U = 492, P = 0.248 | |
| BF01 = 3.77 |
Note. Values represent means, with standard deviations in parentheses. Two-sample t tests are reported for variables that met the normality assumption, Mann–Whitney U test reported otherwise. BF, Bayes factor.
Figure 3.
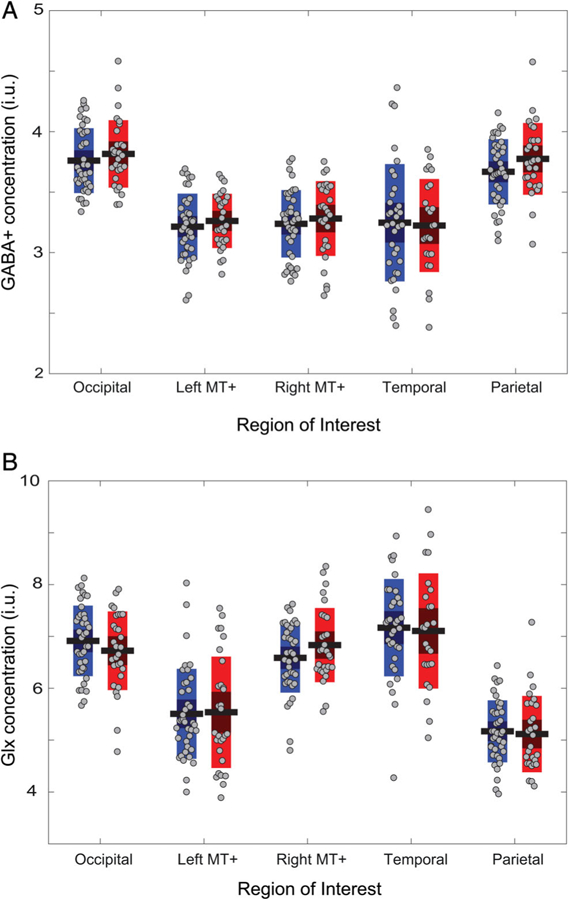
No group differences in GABA+ concentration (A) or in Glx concentration (B). For each region of interest, the left bars (blue) represent the NT group, the right bars (red) represent the ASD group. Horizontal black lines denote group mean, bars denote 95% confidence intervals, and the central dark area of the bar denotes 1 SD around the mean. Gray symbols represent individual participants. i.u., institutional units.
Although the groups were not different in age, sex or IQ (Table 1), we examined the effects of these possible moderators on the MRS results. There were no differences in GABA+ or Glx levels between males and females in any of the ROIs (all t-values57–66 < 1.28; Fig. S2), and there were no significant correlations with age nor nonverbal IQ (all r-values59–68 < 0.22). Another possible confound common in MRS studies in ASD is the use of psychotropic medication that might affect the levels of GABA and glutamate [Krystal et al., 2002; McLoughlin et al., 2009; Taylor et al., 2008]. As our inclusion criterion in this study was stable dosage of any medication, we conducted additional analyses to examine the possible effects of medications in our sample. There were no differences between ASD and NT after the exclusion of any participants using psychotropic medication (all t-values46–51 < 1.95), and no differences between participants with ASD treated or not treated with psychotropic medication (all t-values23–27 < 1.65; Fig. 4; Tables SII and SIII).
Figure 4.

(A, B) No group differences in GABA+ concentration or in Glx concentration after excluding participants using any psychotropic medication. For each ROI, the left bars (blue) represent the NT group, the right bars (red) represent the ASD group. (C, D) No differences in GABA+ or Glx concentration between ASD participants who are currently treated with psychotropic medication (left bar, green) or are not treated with psychotropic medication (right bar, purple). In all panels, horizontal black lines denote group mean, bars denote 95% confidence intervals, and the central dark area of the bar denotes 1 SD around the mean. Gray symbols represent individual participants.
To examine the possibility that the ASD and NT groups differed in the consistency of voxel placement, which could have introduced noise and conceal group differences, we corroborated the visual inspection (Fig. 1B,C) with a quantification of spatial overlap of the MRS voxels within each group using the dice coefficient (see the “Methods” section). This analysis yielded average coefficients of 0.54 to 0.69 (Table 3), in the range expected considering individual differences in brain size and shape (for anatomically defined ROIs) and in functional organization (for functionally defined ROIs). There was less consistency in the occipital ROI in the ASD group than in the NT group; however, this difference was not significant after correction for multiple comparisons (Table 3). There were no significant group differences in any of the other regions, confirming that voxel placement was similarly consistent in ASD and NT and ruling out this possible confound.
Table 3.
Dice Coefficients of Voxel Overlap
| ROI | NT | ASD | Stats | |
|---|---|---|---|---|
| Dice coefficients | Occipital | 0.69 (0.06) | 0.65 (0.09) | U = 378, P = 0.017a |
| Left MT+ | 0.63 (0.06) | 0.64 (0.06) | U = 485, P = 0.407 | |
| Right MT+ | 0.63 (0.07) | 0.64 (0.07) | U = 451, P = 0.272 | |
| Temporal | 0.61 (0.05) | 0.60 (0.07) | U = 371, P = 0.418 | |
| Parietal | 0.54 (0.09) | 0.57 (0.05) | U = 342, P = 0.340 |
Note. Values represent means, with standard deviations in parentheses. Mann–Whitney U test on the ranked means reported for variables that did not meet the normality assumption.
Adjusted P-value = 0.085 (FDR correction for five comparisons).
Importantly, we assessed data quality to ensure that poor quality was not obscuring any group differences. The following seven quality metrics were comparable across groups: water frequency drift, creatine (Cr) peak width, number of excluded time points, and fitting errors for water, Cr, GABA+, and Glx (Fig. S3; and see the “Methods” section for outlier handling).
Additionally, we reanalyzed the data applying different approaches used in previous studies to examine whether the choice of our specific methods affected the results (Table SIV). First, we calculated the ratio of GABA+ to Glx, which did not differ between the groups in any of the regions (Fig. S4a). Next, in the main analysis, GABA+ and Glx were scaled to unsuppressed water [Mullins et al., 2014]. The pattern of results did not change when scaling to creatine (Fig. S4b,c). Similarly, in the main analysis GABA+ measurements were corrected for gray and white matter ratio within each voxel [Harris et al., 2015] whereas Glx measurements were not. Repeating the GABA+ analysis without the correction and the Glx analysis with the correction also did not yield any group differences (Fig. S4d,e). Voxel composition was also similar between groups, with the exception of lower fraction of gray matter and higher proportion of white matter in the occipital region in the ASD group than in the NT group (Table SV).
After concluding that the groups do not differ on any of the GABA+ or Glx measures, we turned to examine whether neurometabolite levels are associated with sensory sensitivity or with ASD symptomatology, and whether these associations differ in direction or magnitude between the groups, as previously suggested [Brix et al., 2015; Robertson et al., 2016]. We estimated visual sensitivity by measuring thresholds for contrast detection, a task thought to rely on early visual cortex computations [Boynton, Demb, Glover, & Heeger, 1999; Ress & Heeger, 2003], and thresholds for motion discrimination, a task associated with MT+ activation [Chen, Lu, Shao, Weng, & Fang, 2017; Schallmo, Millin, et al., 2019; Turkozer, Pamir, & Boyaci, 2016]. We correlated these thresholds with GABA+ and Glx measurements in the corresponding ROIs in the visual cortex (left and right MT+ for motion and occipital for contrast), however no significant correlations were observed (|r21–38| < 0.29, uncorrected P > 0.217).
Lastly, we explored correlations of MRS measures with several clinical scales of ASD symptoms. No correlations were found with overall autism symptom severity as quantified using ADOS scores (|r25–29| < 0.27, uncorrected P > 0.168). GABA+ in left MT+ and Glx in the parietal region were associated with scores on the SRS, among the ASD and the NT groups, respectively, however these correlations were not significant after correction for multiple comparisons (r29 = −0.42, Padj = 0.221; r39 = −0.32, Padj = 0.268, respectively; FDR correction for 10 correlations per metabolite; Fig. 5A,B). GABA+ in left MT+ was negatively associated with the total score on the Sensory Profile questionnaire among the ASD group (r28 = −0.56, Padj = 0.019; FDR correction for 10 correlations per metabolite; Fig. 5C). A further exploratory analysis of this data, including correlations with different subscales of these questionnaires, is included in the Supplementary Material (Table SVI). Overall, there is little evidence for associations between MRS measures and clinical ASD symptoms.
Figure 5.

Correlations of MRS measures with clinical scales scores. Glx concentration in the left mid-temporal lobe plotted against Social Responsiveness Scale (SRS) total score among NT participants (A); GABA+ in left MT+ plotted against SRS total score (B) and Sensory Profile total score (C) among ASD participants. The correlations in the left and middle panels were significant before, but not after, correcting for multiple comparisons, and hence should be interpreted with caution. i.u., institutional units.
Discussion
Imbalance of excitation and inhibition is hypothesized to be altered in ASD, and dysfunction of glutamatergic and GABAergic transmission has been suggested as an underlying mechanism. A number of papers [Gaetz et al., 2014; Harada et al., 2011; Kubas et al., 2012; Rojas et al., 2014] reported differences in the levels of GABA, as measured with MRS, in individuals with ASD. These differences are of interest both as a potential biomarker of ASD and as a target for pharmacological intervention, and hence have driven an upsurge of MRS studies in autism in the last 5 years. However, the range of currently reported results is wide and inconsistent (see a meta-analysis by Schür et al., 2016 and a recent review by Ajram et al., 2019). In the current study, we sought to replicate reported reduced GABA levels in ASD and extend previous results by including an index for glutamate alongside GABA, including newly examined ROIs, and testing the functional relevance of GABA and glutamate levels using correlations with behavior and ASD symptomatology. In a relatively large sample of participants, with gold-standard clinical characterization, we found comparable concentrations of GABA+ and Glx, in all of the sensory and sensorimotor cortical areas examined, among individuals with ASD and NT controls. This null result was confirmed with a Bayesian analysis, providing moderately strong evidence for lack of any group differences in GABA+ or Glx, and indicating that the results likely stem from a true absence of an effect rather than inconclusive or underpowered data. Furthermore, we found no evidence for a relationship between neurometabolite levels and psychophysical performance and no correlations with autism symptoms severity. We did observe a correlation between GABA+ levels and self-reported sensory atypicalities, but this was limited to only one brain region (left MT+) and warrants replication and validation in future research.
Findings from multiple lines of research using methods other than MRS, including genetics, cytoarchitecture, and recordings in rodent models, provide compelling evidence for alterations in GABA and glutamate neurotransmission in ASD. Our results are seemingly inconsistent with this wide literature. However, MRS, although providing a direct quantification of GABA and glutamate in vivo, captures a different, possibly broader, aspect of the system than that measured with other techniques. Both GABA and glutamate are amino acids abundant in the nervous system, playing a prominent role as neurotransmitters, but also found in the brain as transmitter precursors and as metabolites. MRS provides an overall measure of these compounds, that is not necessarily a direct reflection of the neurotransmitter GABA/glutamate pool, and does not correspond to specific synaptic activity [Myers, Nutt, & Lingford-Hughes, 2016; Stagg, Bachtiar, & Johansen-berg, 2011]. Thus, while no differences have been detected in this study between the MRS measures of GABA+ or Glx in ASD and NT, this does not preclude the possibility that underlying neurotransmitter levels differ, only that such differences could not be detected with the current methods. A further limitation of this measurement that could be contributing to these null findings is the contamination of the GABA signal in the MEGA-PRESS sequence by coedited macromolecules [Mullins et al., 2014; Shungu et al., 2016], contributing up to 50% of the MRS signal. Techniques such as MEGA-PRESS with macromolecule suppression [Edden, Puts, & Barker, 2012; Mikkelsen, Harris, Edden, & NAJ, 2018] may provide a clearer picture of GABA in ASD. In addition, the MEGA-PRESS sequence is optimized for the detection of GABA. For glutamate, the peak at 3.75 ppm in the edited spectrum reflects the combined measurement of multiple metabolites, with a main contribution of glutamate, alongside glutamine and glutathione signals (hence referred to as Glx). This combined signal might conceal underlying effects in these three different metabolites, especially if these effects have opposite directions. Furthermore, MRS in 3T scanners is limited to low spatial resolution, with voxel size of approximately 27 cm3. Findings in a mouse model of ASD show that E/I imbalance is region-specific [Gonçalves et al., 2017], and it could be that we do not have the spatial resolution to capture this with the current MRS methods.
In the current study, we included young adult participants only, ranging from 18 to 30 years of age, to avoid heterogeneity resulting from age differences and developmental stage which could have been contributing to inconsistencies in cross-sectional studies with children. The null results that we report here are in line with several recent studies with adults. First, Robertson and colleagues [2016] and Port and colleagues [2017] reported no differences in adults with ASD in GABA+ in a medial occipital region and in the left superior temporal gyrus, respectively, in ROIs overlapping with those investigated in the current study. Others have recently reported equivalent GABA+ in frontal areas and in subcortical regions: Pretzsch and colleagues reported equivalent levels of GABA+ and Glx in the dorsomedial prefrontal cortex and in the basal ganglia in adults with ASD and controls, in a baseline measurement before cannabidiol administration [Pretzsch et al., 2019]. Similarly, Ajram and colleagues reported no baseline differences in GABA+\Glx ratio in the medial prefrontal cortex before Riluzole treatment [Ajram et al., 2017]. Horder et al. [2018] found lower Glx in adults with ASD in the striatum, but no differences in the medial prefrontal and no differences in GABA+ in either region; and Kirkovski et al. [2018] reported no differences in the dorsolateral prefrontal cortex and in the right superior temporal sulcus. The overall pattern of results summarized here, from the current study and others, is that there are no differences in GABA levels in adults with ASD. Considering these findings in light of reports of lower GABA+ in children (notably, only in some studies but not in others; Brix et al., 2015; Carvalho Pereira et al., 2018; Cochran et al., 2015; Drenthen et al., 2016; Goji et al., 2017) raises the possibility that alterations that are observed in childhood in ASD become more typical by adulthood. And indeed, GABA and glutamate balance and function change throughout the development [Corrigan et al., 2013; Ito et al., 2017; Luján, Shigemoto, & López-Bendito, 2005]. However, developmental studies are susceptible to further methodological challenges, including measurement noise and subject motion during scanning [Power et al., 2014; Yuan et al., 2009], as well as developmental effects on brain size and tissue composition [Giedd & Rapoport, 2010]. Since motion and tissue composition have not been accounted for in many previous studies with children, group differences in measured MRS signal could be attributed to group differences in brain development, differences in the ratio of CSF, gray and white matters in a given region [Maes et al., 2018], or differences in data quality, rather than stemming from true differences in neurometabolite levels.
Throughout the MRS scans, participants were watching a movie of their choice. This approach was chosen to maximize comfort and wakefulness and to reduce head motion and stress, which could be particularly challenging for individuals with ASD. This sensory stimulation is likely to cause functional changes in the dynamics of neurometabolism in the cortex. While these stimuli-driven fluctuations could be detected in high-field functional MRS, as shown in recent studies [Chen et al., 2017; Ip, Emir, Parker, Campbell, & Bridge, 2019], the evidence for such changes effecting MRS measures collected in 3T is limited, and the size of these effects is small [Apšvalka et al., 2015; Kurcyus et al., 2018]. Hence, we believe that while the movies introduce a certain amount of noise to our measurements, the benefit of increasing subject compliance, which is critical for achieving high-quality data (i.e., by reducing head motion and facilitating completion of a long scanning session), is greater than the cost, particularly in the case of group comparisons.
Another aspect to consider in the interpretation of the current results is the regions examined. We placed the MRS voxels in sensory and sensorimotor areas, following the recent emphasis on sensory perception abnormalities in ASD [Robertson & Baron-Cohen, 2017], and using well-established locations for consistency with previous MRS studies. There are some indications for neurometabolite concentration differences in ASD in other cortical regions, including the frontal lobe and the cingulate cortex, in subcortical structures such as the thalamus, and in the cerebellum. Specifically, a recent study with over a hundred children reported decreased levels of GABA and increased levels of glutamate in the anterior cingulate cortex and in the left cerebellum [Ito et al., 2017]. However, replications are warranted to provide further support for these findings.
Importantly, the cohort of participants in this study included some participants using psychotropic medication, which could be influencing the neurometabolite levels. Our analysis of medication effects indicated no differences in GABA+ or Glx levels between those participants using regular medication to those who were not, and no differences between ASD and NT when excluding any participants using medication. However, the power of these analyses is low due to the small number of participants in each subgroup, and further larger studies, or stricter exclusion criteria, are required to draw definitive conclusions about the effects of medication.
To conclude, our results show no differences in cortical levels of GABA+ and Glx in ASD as measured with MRS, replicating and expanding previous studies in adult samples, and do not provide support for altered E/I balance in autism. However, the current findings do not preclude the role of disrupted neurotransmission in the disorder nor the potential benefit from pharmacological manipulation of the GABAergic and glutamatergic systems. While MRS might not be suitable for detecting baseline differences in GABA or glutamate, it has been shown to track changes in neurometabolite levels following pharmacological manipulation in both rats [Waschkies et al., 2014] and humans [Ajram et al., 2017; Pretzsch et al., 2019; Zhang et al., 2020], as well as changes in metabolite levels in response to sensory stimuli [Apšvalka et al., 2015; Ip et al., 2019; Kurcyus et al., 2018]. Future studies using such causal manipulations of neurotransmitter levels with MRS may provide greater clarity regarding their potential role in the pathophysiology of ASD.
Supplementary Material
Acknowledgments
We thank Rachel Millin, Alex Kale, Anastasia Flevaris, Ly Nguyen, Heena Panjwani, Micah Pepper, and the UW Diagnostic Imaging Center for help with recruitment, data collection, and/or data analysis. This work was supported by funding from the National Institute of Health (R01 MH106520 to S.O.M. and R.A.B.). This study applies tools developed under NIH R01 EB016089 and P41 EB015909; RAEE receives salary support from these grants and from R01 MH106564 and U54 HD079123.
Footnotes
Conflict of Interest
The authors declared no conflict of interest.
Supporting Information
Additional supporting information may be found online in the Supporting Information section at the end of the article.
Appendix S1. Supporting information
Contributor Information
Tamar Kolodny, Department of Psychology, University of Washington, Seattle, Washington.
Michael-Paul Schallmo, Department of Psychology, University of Washington, Seattle, Washington, Department of Psychiatry and Behavioral Science, University of Minnesota, Minneapolis, Minnesota.
Jennifer Gerdts, Department of Psychiatry and Behavioral Sciences, University of Washington, Seattle, Washington.
Richard A. E. Edden, Department of Radiology and Radiological Sciences, Johns Hopkins University, Baltimore, Maryland
Raphael A. Bernier, Department of Psychiatry and Behavioral Sciences, University of Washington, Seattle, Washington
Scott O. Murray, Department of Psychology, University of Washington, Seattle, Washington.
References
- Ajram LA, Horder J, Mendez MA, Galanopoulos A, Brennan LP, Wichers RH, … McAlonan GM (2017). Shifting brain inhibitory balance and connectivity of the prefrontal cortex of adults with autism spectrum disorder. Translational Psychiatry, 7, e1137 10.1038/tp.2017.104 [DOI] [PMC free article] [PubMed] [Google Scholar]
- Ajram LA, Pereira AC, Durieux AMS, Velthius HE, Petrinovic MM, & McAlonan GM (2019). The contribution of [1H] magnetic resonance spectroscopy to the study of excitation-inhibition in autism. Progress in NeuroPsychopharmacology & Biological Psychiatry, 89, 236–244. 10.1016/j.pnpbp.2018.09.010 [DOI] [PubMed] [Google Scholar]
- American Psychiatric Association. (2013). Diagnostic and statistical manual of mental disorders (DSM-5®). Arlington, VA: Author. [Google Scholar]
- Antoine MW, Langberg T, Schnepel P, & Feldman DE (2019). Increased excitation-inhibition ratio stabilizes synapse and circuit excitability in four autism mouse models. Neuron, 101, 1–14. 10.1016/j.neuron.2018.12.026 [DOI] [PMC free article] [PubMed] [Google Scholar]
- Aoki Y, Abe O, Yahata N, Kuwabara H, Natsubori T, Iwashiro N, … Yamasue H (2012). Absence of age-related prefrontal NAA change in adults with autism spectrum disorders. Translational Psychiatry, 2(10), e178 10.1038/tp.2012.108 [DOI] [PMC free article] [PubMed] [Google Scholar]
- Apšvalka D, Gadie A, Clemence M, & Mullins PG (2015). Event-related dynamics of glutamate and BOLD effects measured using functional magnetic resonance spectroscopy (fMRS) at 3T in a repetition suppression paradigm. NeuroImage, 118, 292–300. 10.1016/j.neuroimage.2015.06.015 [DOI] [PubMed] [Google Scholar]
- Bai X, Harris AD, Gong T, Puts NAJ, Wang G, Schär M, … Edden RAE (2017). Voxel placement precision for GABA-edited magnetic resonance spectroscopy. Open Journal of Radiology, 7, 35–44. 10.4236/ojrad.2017.71004 [DOI] [PMC free article] [PubMed] [Google Scholar]
- Bak LK, Schousboe A, & Waagepetersen HS (2006). The glutamate/GABA-glutamine cycle: Aspects of transport, neurotransmitter homeostasis and ammonia transfer. Journal of Neurochemistry, 98, 641–653. 10.1111/j.1471-4159.2006.03913.x [DOI] [PubMed] [Google Scholar]
- Bejjani A, O’Neill J, Kim JA, Frew AJ, Yee VW, Ly R, et al. (2012). Elevated glutamatergic compounds in pregenual anterior cingulate in pediatric autism spectrum disorder demonstrated by1H MRS and 1H MRSI. PLoS One, 7(7), e38786 10.1371/journal.pone.0038786 [DOI] [PMC free article] [PubMed] [Google Scholar]
- Ben-Sasson A, Hen L, Fluss R, Cermak SA, Engel-Yeger B, & Gal E (2009). A meta-analysis of sensory modulation symptoms in individuals with autism spectrum disorders. Journal of Autism and Developmental Disorders, 39, 1–11. 10.1007/s10803-008-0593-3 [DOI] [PubMed] [Google Scholar]
- Bernardi S, Anagnostou E, Shen J, Kolevzon A, Buxbaum JD, Hollander E, … Fan J (2011). In vivo 1 H-magnetic resonance spectroscopy study of the attentional networks in autism. Brain Research, 1380, 198–205. 10.1016/j.brainres.2010.12.057 [DOI] [PMC free article] [PubMed] [Google Scholar]
- Born RT, & Bradley DC (2005). Structure and function of visual area Mt. Annual Review of Neuroscience, 28(1), 157–189. 10.1146/annurev.neuro.26.041002.131052 [DOI] [PubMed] [Google Scholar]
- Boynton GM, Demb JB, Glover GH, & Heeger DJ (1999). Neuronal basis of contrast discrimination. Vision Research, 39, 257–269. 10.1109/IAS.2007.174 [DOI] [PubMed] [Google Scholar]
- Brainard DH (1997). The psychophysics toolbox. Spatial Vision, 10(4), 443–436. [PubMed] [Google Scholar]
- Brieber S, Herpertz-Dahlmann B, Fink GR, Kamp-Becker I, Remschmidt H, & Konrad K (2010). Coherent motion processing in autism spectrum disorder (ASD): An fMRI study. Neuropsychologia, 48(6), 1644–1651. 10.1016/j.neuropsychologia.2010.02.007 [DOI] [PubMed] [Google Scholar]
- Brix MK, Ersland L, Hugdahl K, Grüner R, Posserud M-B, Hammar Å, … Beyer MK (2015). Brain MR spectroscopy in autism spectrum disorder—The GABA excitatory/inhibitory imbalance theory revisited. Frontiers in Human Neuroscience, 9(June), 1–12. 10.3389/fnhum.2015.00365 [DOI] [PMC free article] [PubMed] [Google Scholar]
- Brown MS, Singel D, Hepburn S, & Rojas DC (2013). Increased glutamate concentration in the auditory cortex of persons with autism and first-degree relatives: A 1H-MRS study. Autism Research, 6(1), 1–10. 10.1002/aur.1260 [DOI] [PMC free article] [PubMed] [Google Scholar]
- Carlson GC (2012). Glutamate receptor dysfunction and drug targets across models of autism spectrum disorders. Pharmacology, Biochemistry, and Behavior, 100(4), 850–854. 10.1016/j.pbb.2011.02.003 [DOI] [PMC free article] [PubMed] [Google Scholar]
- Carlsson M (2015). Autism and glutamate In Fatemi HS (Ed.), The molecular basis of autism contemporary clinical neuroscience. New York, NY: Springer. [Google Scholar]
- Carvalho Pereira A, Violante IR, Mouga S, Oliveira G, & Castelo-Branco M (2018). Medial frontal lobe neurochemistry in autism spectrum disorder is marked by reduced N-acetylaspartate and unchanged gamma-aminobutyric acid and glutamate + glutamine levels. Journal of Autism and Developmental Disorders, 48(5), 1467–1482. 10.1007/s10803-017-3406-8 [DOI] [PubMed] [Google Scholar]
- Catana B, & Dunn W (2002). Adolescent-adult sensory profile: User’s manual. San Antonio, TX: Therapy Skill Builders. [Google Scholar]
- Chao H-T, Chen H, Samaco RC, Xue M, Chahrour M, Yoo J, … Zoghbi HY (2010). Dysfunction in GABA signalling mediates autism-like stereotypies and Rett syndrome phenotypes. Nature, 468, 263–269. 10.1038/nature09582 [DOI] [PMC free article] [PubMed] [Google Scholar]
- Chen C, Sigurdsson HP, Pépés SE, Auer DP, Morris PG, Morgan PS, … Jackson SR (2017). Activation induced changes in GABA: Functional MRS at 7 T with MEGA-sLASER. NeuroImage, 156, 207–213. 10.1016/j.neuroimage.2017.05.044 [DOI] [PubMed] [Google Scholar]
- Chen N, Lu J, Shao H, Weng X, & Fang F (2017). Neural mechanisms of motion perceptual learning in noise. Human Brain Mapping, 38(12), 6029–6042. 10.1002/hbm.23808 [DOI] [PMC free article] [PubMed] [Google Scholar]
- Choudhury PR, Lahiri S, & Rajamma U (2012). Glutamate mediated signaling in the pathophysiology of autism spectrum disorders. Pharmacology, Biochemistry, and Behavior, 100(4), 841–849. 10.1016/j.pbb.2011.06.023 [DOI] [PubMed] [Google Scholar]
- Cochran DM, Sikoglu EM, Hodge SM, Edden RAE, Foley A, Kennedy DN, … Frazier JA (2015). Relationship among glutamine, γ-aminobutyric acid, and social cognition in autism spectrum disorders. Journal of Child and Adolescent Psychopharmacology, 25(4), 314–322. 10.1089/cap.2014.0112 [DOI] [PMC free article] [PubMed] [Google Scholar]
- Coghlan S, Horder J, Inkster B, Mendez MA, Murphy DG, & Nutt DJ (2012). GABA system dysfunction in autism and related disorders: From synapse to symptoms? Neuroscience and Biobehavioral Reviews, 36, 2044–2055. 10.1016/j.neubiorev.2012.07.005 [DOI] [PMC free article] [PubMed] [Google Scholar]
- Constantino JN (2011). The quantitative nature of autistic social impairment. Pediatric Research, 69(5), 55–62. 10.1203/PDR.0b013e318212ec6e [DOI] [PMC free article] [PubMed] [Google Scholar]
- Constantino JN, & Gruber CP (2005). Social responsiveness scale (SRS). Los Angeles, CA: Western Psychological Services. [Google Scholar]
- Cornew L, Roberts TPL, Blaskey L, & Edgar JC (2012). Resting-state oscillatory activity in autism spectrum disorders. Journal of Autism and Developmental Disorders, 42(9), 1884–1894. 10.1007/s10803-011-1431-6 [DOI] [PMC free article] [PubMed] [Google Scholar]
- Corrigan NM, Shaw DWW, Estes AM, Richards TL, Munson J, Friedman SD, … Dager SR (2013). Atypical developmental patterns of brain chemistry in children with autism spectrum disorder. JAMA Psychiatry, 70(9), 964–974. 10.1001/jamapsychiatry.2013.1388 [DOI] [PubMed] [Google Scholar]
- de Graaf RA (2019). In vivo NMR spectroscopy: Principles and techniques (3rd ed.). Hoboken, NJ: Wiley. [Google Scholar]
- DeVito TJ, Drost DJ, Neufeld RWJ, Rajakumar N, Pavlosky W, Williamson P, & Nicolson R (2007). Evidence for cortical dysfunction in autism: A proton magnetic resonance spectroscopic imaging study. Biological Psychiatry, 61(4), 465–473. 10.1016/j.biopsych.2006.07.022 [DOI] [PubMed] [Google Scholar]
- Dice LR (1945). Measures of the amount of ecologic association between species. Ecology, 26, 297–302. [Google Scholar]
- Dickinson A, Bruyns-Haylett M, Smith R, Jones M, & Milne E (2016). Superior orientation discrimination and increased peak gamma frequency in individuals with autism spectrum conditions. Journal of Abnormal Psychology, 123(3), 412–422. 10.1037/abn0000148 [DOI] [PubMed] [Google Scholar]
- Doyle-Thomas KAR, Card D, Soorya LV, Ting Wang A, Fan J, & Anagnostou E (2014). Metabolic mapping of deep brain structures and associations with symptomatology in autism spectrum disorders. Research in Autism Spectrum Disorder, 8(1), 44–51. 10.1016/j.rasd.2013.10.003 [DOI] [PMC free article] [PubMed] [Google Scholar]
- Drenthen GS, Barendse EM, Aldenkamp AP, van Veenendaal TM, Puts NAJ, Edden RAE, … Jansen JFA (2016). Altered neurotransmitter metabolism in adolescents with high-functioning autism. Psychiatry Research: Neuroimaging, 256, 44–49. 10.1016/j.pscychresns.2016.09.007 [DOI] [PMC free article] [PubMed] [Google Scholar]
- Edden RAE, Muthukumaraswamy SD, Freeman TCA, & Singh KD (2009). Orientation discrimination performance is predicted by GABA concentration and gamma oscillation frequency in human primary visual cortex. The Journal of Neuroscience, 29(50), 15721–15726. 10.1523/jneurosci.4426-09.2009 [DOI] [PMC free article] [PubMed] [Google Scholar]
- Edden RAE, Puts NAJ, & Barker PB (2012). Macromolecule-suppressed GABA-edited magnetic resonance spectroscopy at 3T. Magnetic Resonance in Medicine, 68(3), 657–661. 10.1002/mrm.24391 [DOI] [PMC free article] [PubMed] [Google Scholar]
- Edden RAE, Puts NAJ, Harris AD, Barker PB, & Evans CJ (2014). Gannet: A batch-processing tool for the quantitative analysis of gamma-aminobutyric acid-edited MR spectroscopy spectra. Journal of Magnetic Resonance Imaging, 40(6), 1445–1452. 10.1002/jmri.24478 [DOI] [PMC free article] [PubMed] [Google Scholar]
- Endres D, Tebartz Van Elst L, Meyer SA, Feige B, Nickel K, Bubl A, et al. (2017). Glutathione metabolism in the prefrontal brain of adults with high-functioning autism spectrum disorder: An MRS study. Molecular Autism, 8(1), 1–11. 10.1186/s13229-017-0122-3 [DOI] [PMC free article] [PubMed] [Google Scholar]
- Fatemi HS, Reutiman TJ, Folsom TD, Rustan OG, Rooney RJ, & Thuras PD (2014). Downregulation of GABAA receptor protein subunits α6, β2, δ, ε, γ2, θ, and ρ2 in superior frontal cortex of subjects with autism. Journal of Autism and Developmental Disorders, 44(8), 1833–1845. 10.1007/s10803-014-2078-x [DOI] [PubMed] [Google Scholar]
- Fatemi HS, Reutiman TJ, Folsom TD, & Thuras PD (2009). GABAAreceptor downregulation in brains of subjects with autism. Journal of Autism and Developmental Disorders, 39(2), 223–230. 10.1007/s10803-008-0646-7 [DOI] [PMC free article] [PubMed] [Google Scholar]
- Fatemi HS, Wong DF, Brašić JR, Kuwabara H, Mathur A, Folsom TD, et al. (2018). Metabotropic glutamate receptor 5 tracer [18F]-FPEB displays increased binding potential in postcentral gyrus and cerebellum of male individuals with autism: A pilot PET study. Cerebellum & Ataxias, 5(1), 1–8. 10.1186/s40673-018-0082-1 [DOI] [PMC free article] [PubMed] [Google Scholar]
- Ford TC, & Crewther DP (2016). A comprehensive review of the 1H-MRS metabolite spectrum in autism spectrum disorder. Frontiers in Molecular Neuroscience, 9, 18 10.3389/fnmol.2016.00014 [DOI] [PMC free article] [PubMed] [Google Scholar]
- Foss-feig JH, Tadin D, Schauder KB, & Cascio CJ (2013). A substantial and unexpected enhancement of motion perception in autism. The Journal of Neuroscience, 33(19), 8243–8249. 10.1523/JNEUROSCI.1608-12.2013 [DOI] [PMC free article] [PubMed] [Google Scholar]
- Friedman SD, Shaw DWW, Artru AA, Dawson G, Petropoulos H, & Dager SR (2006). Gray and white matter brain chemistry in young children with autism. Archives of General Psychiatry, 63(7), 786–794. 10.1001/archpsyc.63.7.786 [DOI] [PubMed] [Google Scholar]
- Friston KJ, Worsley KJ, Poline J-PB, Frith CD, Frackowiak RSJ, Holmes AP, … Frackowiak RSJ (1994). Statistical parametric maps in functional imaging: A general linear approach. Human Brain Mapping, 2(4), 189–210. 10.1002/hbm.460020402 [DOI] [Google Scholar]
- Gaetz W, Bloy L, Wang DJ, Port RG, Blaskey L, Levy SE, & Roberts TPL (2014). GABA estimation in the brains of children on the autism spectrum: Measurement precision and regional cortical variation. NeuroImage, 86, 1–9. 10.1016/j.neuroimage.2013.05.068 [DOI] [PMC free article] [PubMed] [Google Scholar]
- Gasparovic C, Song T, Devier D, Bockholt HJ, Caprihan A, Mullins PG, … Morrison LA (2006). Use of tissue water as a concentration reference for proton spectroscopic imaging. Magnetic Resonance in Medicine, 55(6), 1219–1226. 10.1002/mrm.20901 [DOI] [PubMed] [Google Scholar]
- Giedd JN, & Rapoport JL (2010). Structural MRI of pediatric brain development: What have we learned and where are we going? Neuron, 67(5), 728–734. 10.1016/j.neuron.2010.08.040 [DOI] [PMC free article] [PubMed] [Google Scholar]
- Goji A, Ito H, Mori K, Harada M, Hisaoka S, Toda Y, … Kagami S (2017). Assessment of anterior cingulate cortex (ACC) and left cerebellar metabolism in Asperger’s syndrome with proton magnetic resonance spectroscopy (MRS). PLoS One, 12(1), 1–8. 10.1371/journal.pone.0169288 [DOI] [PMC free article] [PubMed] [Google Scholar]
- Gonçalves J, Violante IR, Sereno J, Leitão RA, Cai Y, Abrunhosa A, … Castelo-Branco M (2017). Testing the excitation/inhibition imbalance hypothesis in a mouse model of the autism spectrum disorder: in vivo neurospectroscopy and molecular evidence for regional phenotypes. Molecular Autism, 8(1), 1–8. 10.1186/s13229-017-0166-4 [DOI] [PMC free article] [PubMed] [Google Scholar]
- Griswold AJ, Ma D, Cukier HN, Nations LD, Schmidt MA, Chung RH, … Pericak-Vance MA (2012). Evaluation of copy number variations reveals novel candidate genes in autism spectrum disorder-associated pathways. Human Molecular Genetics, 21(15), 3513–3523. 10.1093/hmg/dds164 [DOI] [PMC free article] [PubMed] [Google Scholar]
- Han S, Tai C, Westenbroek RE, Yu FH, Cheah CS, Potter GB, … Catterall WA (2012). Autistic-like behaviour in Scn1a+/− mice and rescue by enhanced GABA-mediated neurotransmission. Nature, 489, 385–390. 10.1038/nature11356 [DOI] [PMC free article] [PubMed] [Google Scholar]
- Harada M, Taki MM, Nose A, Kubo H, Mori K, Nishitani H, & Matsuda T (2011). Non-invasive evaluation of the GABAergic/glutamatergic system in autistic patients observed by MEGA-editing proton MR spectroscopy using a clinical 3 Tesla instrument. Journal of Autism and Developmental Disorders, 41(4), 447–454. 10.1007/s10803-010-1065-0 [DOI] [PubMed] [Google Scholar]
- Hardan AY, Minshew NJ, Melhem NM, Srihari S, Jo B, Bansal R, … Stanley JA (2008). An MRI and proton spectroscopy study of the thalamus in children with autism. Psychiatry Research: Neuroimaging, 163(2), 97–105. 10.1016/j.pscychresns.2007.12.002 [DOI] [PMC free article] [PubMed] [Google Scholar]
- Harris AD, Puts NAJ, & Edden RAE (2015). Tissue correction for GABA-edited MRS: Considerations of voxel composition, tissue segmentation, and tissue relaxations. Journal of Magnetic Resonance Imaging, 42(5), 1431–1440. 10.1002/jmri.24903 [DOI] [PMC free article] [PubMed] [Google Scholar]
- Heba S, Puts NAJ, Kalisch T, Glaubitz B, Haag LM, Lenz M, … Schmidt-Wilcke T (2016). Local GABA concentration predicts perceptual improvements after repetitive sensory stimulation in humans. Cerebral Cortex, 26(3), 1295–1301. 10.1093/cercor/bhv296 [DOI] [PMC free article] [PubMed] [Google Scholar]
- Hegarty JP, Gu M, Spielman DM, Cleveland SC, Hallmayer JF, Lazzeroni LC, … Hardan AY (2018). A proton MR spectroscopy study of the thalamus in twins with autism spectrum disorder. Progress NeuroPsychopharmacology & Biological Psychiatry, 81(June 2017), 153–160. 10.1016/j.pnpbp.2017.09.016 [DOI] [PMC free article] [PubMed] [Google Scholar]
- Horder J, Lavender T, Mendez MA, O’Gorman R, Daly E, Craig MC, … Murphy DG (2013). Reduced subcortical glutamate/glutamine in adults with autism spectrum disorders: A [1H] MRS study. Translational Psychiatry, 3(April), 7–9. 10.1038/tp.2013.53 [DOI] [PMC free article] [PubMed] [Google Scholar]
- Horder J, Petrinovic MM, Mendez MA, Bruns A, Takumi T, Spooren W, … Murphy DG (2018). Glutamate and GABA in autism spectrum disorder-a translational magnetic resonance spectroscopy study in man and rodent models. Translational Psychiatry, 8(1), 1–11. 10.1038/s41398-018-0155-1 [DOI] [PMC free article] [PubMed] [Google Scholar]
- Huk AC, Dougherty RF, & Heeger DJ (2002). Retinotopy and functional subdivision of human areas MT and MST. The Journal of Neuroscience, 22(16), 7195–7205. 10.1523/JNEUROSCI.22-16-07195.2002 [DOI] [PMC free article] [PubMed] [Google Scholar]
- Hus V, Gotham K, & Lord C (2014). Standardizing ADOS domain scores: Separating severity of social affect and restricted and repetitive behaviors. Journal of Autism and Developmental Disorders, 44(10), 2400–2412. 10.1007/s10803-012-1719-1 [DOI] [PMC free article] [PubMed] [Google Scholar]
- Ip IB, Emir UE, Parker AJ, Campbell J, & Bridge H (2019). Comparison of neurochemical and BOLD signal contrast response functions in the human visual cortex. The Journal of Neuroscience, 39(40), 7968–7975. 10.1523/JNEUROSCI.3021-18.2019 [DOI] [PMC free article] [PubMed] [Google Scholar]
- Ito H, Mori K, Harada M, Hisaoka S, Toda Y, Mori T, … Kagami S (2017). A proton magnetic resonance spectroscopic study in autism spectrum disorder using a 3-Tesla clinical magnetic resonance imaging (MRI) system: The anterior cingulate cortex and the left cerebellum. Journal of Child Neurology, 32 (8), 731–739. 10.1177/0883073817702981 [DOI] [PubMed] [Google Scholar]
- Jamain S, Betancur C, Quach H, Philippe A, Fellous M, Giros B, … Bourgeron T (2002). Linkage and association of the glutamate receptor 6 gene with autism. Molecular Psychiatry, 7(3), 302–310. 10.1038/sj.mp.4000979 [DOI] [PMC free article] [PubMed] [Google Scholar]
- Jarosz AF, & Wiley J (2014). What are the odds? A practical guide to computing and reporting Bayes factors. The Journal of Problem Solving, 7, 2–9. 10.7771/1932-6246.1167 [DOI] [Google Scholar]
- Kirkovski M, Suo C, Enticott PG, Yücel M, & Fitzgerald PB (2018). Sex-linked differences in gamma-aminobutyric acid (GABA) are related to social functioning in autism spectrum disorder. Psychiatry Research: Neuroimaging, 274, 19–22. 10.1016/j.pscychresns.2018.02.004 [DOI] [PubMed] [Google Scholar]
- Koh HC, Milne E, & Dobkins K (2010). Contrast sensitivity for motion detection and direction discrimination in adolescents with autism spectrum disorders and their siblings. Neuropsychologia, 48(14), 4046–4056. 10.1016/j.neuropsychologia.2010.10.008 [DOI] [PMC free article] [PubMed] [Google Scholar]
- Koldewyn K, Whitney D, & Rivera SM (2011). Neural correlates of coherent and biological motion perception in autism. Developmental Science, 14(5), 1075–1088. 10.1111/j.1467-7687.2011.01058.x [DOI] [PMC free article] [PubMed] [Google Scholar]
- Kolodny T, Schallmo M-P, Gerdts J, Bernier RA, & Murray SO (2020). Response dissociation in hierarchical corticalcircuits: a unique feature of autism spectrum disorder. The Journal of Neuroscience, 40(11), 2369–2281. 10.1523/jneurosci.2376-19.2020 [DOI] [PMC free article] [PubMed] [Google Scholar]
- Kompus K, Westerhausen R, Craven AR, Kreegipuu K, Põldver N, Passow S, … Näätänen R (2015). Resting-state glutamatergic neurotransmission is related to the peak latency of the auditory mismatch negativity (MMN) for duration deviants: An 1H-MRS-EEG study. Psychophysiology, 52 (9), 1131–1139. 10.1111/psyp.12445 [DOI] [PubMed] [Google Scholar]
- Krystal JH, Sanacora G, Blumberg H, Anand A, Charney DS, Marek G, … Mason GF (2002). Glutamate and GABA systems as targets for novel antidepressant and mood-stabilizing treatments. Molecular Psychiatry, 7, S71–S80. 10.1038/sj.mp.4001021 [DOI] [PubMed] [Google Scholar]
- Kubas B, Kułak W, Sobaniec W, Tarasow E, Łebkowska U, & Walecki J (2012). Metabolite alterations in autistic children: A 1H MR spectroscopy study. Advances in Medical Sciences, 57(1), 152–156. 10.2478/v10039-012-0014-x [DOI] [PubMed] [Google Scholar]
- Kurcyus K, Annac E, Hanning NM, Harris AD, Oeltzschner G, Edden R, & Riedl V (2018). Opposite dynamics of GABA and glutamate levels in the occipital cortex during visual processing. The Journal of Neuroscience, 38 (46), 9967–9976. 10.1523/JNEUROSCI.1214-18.2018 [DOI] [PMC free article] [PubMed] [Google Scholar]
- Lee E, Lee J, & Kim E (2017). Excitation/Inhibition imbalance in animal models of autism spectrum disorders. Biological Psychiatry, 81, 838–847. 10.1016/j.biopsych.2016.05.011 [DOI] [PubMed] [Google Scholar]
- Leekam SR, Nieto C, Libby SJ, Wing L, & Gould J (2007). Describing the sensory abnormalities of children and adults with autism. Journal of Autism and Developmental Disorders, 37(5), 894–910. 10.1007/s10803-006-0218-7 [DOI] [PubMed] [Google Scholar]
- Libero LE, Reid MA, White DM, Salibi N, Lahti AC, & Kana RK (2016). Biochemistry of the cingulate cortex in autism: An MR spectroscopy study. Autism Research, 9(6), 643–657. 10.1002/aur.1562 [DOI] [PMC free article] [PubMed] [Google Scholar]
- Lord C, Rutter M, DiLavore PC, Risi S, Gotham K, & Bishop S (2012). Autism diagnostic observation schedule: ADOS. Los Angeles, CA: Western Psychological Services. [Google Scholar]
- Lord C, Rutter M, & Le Couteur A (1994). Autism diagnostic interview-revised: A revised version of a diagnostic interview for caregivers of individuals with possible pervasive developmental disorders. Journal of Autism and Developmental Disorders, 24(5), 659–685. [DOI] [PubMed] [Google Scholar]
- Luján R, Shigemoto R, & López-Bendito G (2005). Glutamate and GABA receptor signalling in the developing brain. Neuroscience, 130(3), 567–580. 10.1016/j.neuroscience.2004.09.042 [DOI] [PubMed] [Google Scholar]
- Ma DQ, Whitehead PL, Menold MM, Martin ER, Mei H, Ritchie MD, et al. (2005). Identification of significant association and gene-gene interaction of GABA receptor subunit genes in autism. American Journal of Human Genetics, 77, 377–388. [DOI] [PMC free article] [PubMed] [Google Scholar]
- Maes C, Hermans L, Pauwels L, Chalavi S, Leunissen I, Levin O, … Swinnen SP (2018). Age-related differences in GABA levels are driven by bulk tissue changes. Human Brain Mapping, 39(9), 3652–3662. 10.1002/hbm.24201 [DOI] [PMC free article] [PubMed] [Google Scholar]
- Manning C, Tibber MS, Charman T, Dakin SC,& Pellicano E (2015). Enhanced integration of motion information in children with autism. The Journal of Neuroscience, 35(18), 6979–6986. 10.1523/JNEUROSCI.4645-14.2015 [DOI] [PMC free article] [PubMed] [Google Scholar]
- Martens S, & Vandeghinste V (2010) An efficient, generic approach to extracting multi-word expressions from dependency trees. Paper presented at the CoLing Workshop: Multiword Expressions: From theory to applications (MWE 2010) p. 84–7. Retrieved from https://lirias.kuleuven.be/handle/123456789/276651 [Google Scholar]
- McCormick DA (1989). GABA as an inhibitory neurotransmitter in human cerebral cortex. Journal of Neurophysiology, 62 (5), 1018–1027. 10.1152/jn.1989.62.5.1018 [DOI] [PubMed] [Google Scholar]
- McLoughlin GA, Ma D, Tsang TM, Jones DNC, Cilia J, Hill MD, … Bahn S (2009). Analyzing the effects of psychotropic drugs on metabolite profiles in rat brain using 1 H NMR spectroscopy. Journal of Proteome Research, 8(4), 1943–1952. 10.1021/pr800892u [DOI] [PubMed] [Google Scholar]
- Mekle R, Kühn S, Pfeiffer H, Aydin S, Schubert F, & Ittermann B (2017). Detection of metabolite changes in response to a varying visual stimulation paradigm using short-TE 1H MRS at 7 T. NMR in Biomedicine, 30, e3672 10.1002/nbm.3672 [DOI] [PubMed] [Google Scholar]
- Mescher M, Merkle H, Kirsch J, Garwood M, & Gruetter R (1998). Simultaneous in vivo spectral editing and water suppression. NMR in Biomedicine, 11(6), 266–272. [DOI] [PubMed] [Google Scholar]
- Mikkelsen M, Barker PB, Bhattacharyya PK, Brix MK, Buur PF, Cecil KM, … Edden RAE (2017). Big GABA: Edited MR spectroscopy at 24 research sites. NeuroImage, 159, 32–45. 10.1016/j.neuroimage.2017.07.021 [DOI] [PMC free article] [PubMed] [Google Scholar]
- Mikkelsen M, Harris AD, Edden RAE, & Puts NAJ (2018). Macromolecule-suppressed GABA measurements correlate more strongly with behavior than macromolecule-contaminated GABA+ measurements. Brain Research, 1701, 204–211. 10.1016/j.brainres.2018.09.021 [DOI] [PMC free article] [PubMed] [Google Scholar]
- Mikkelsen M, Loo RS, Puts NAJ, Edden RAE, & Harris AD (2018). Designing GABA-edited magnetic resonance spectroscopy studies: Considerations of scan duration, signal-to-noise ratio and sample size. Journal of Neuroscience Methods, 303, 86–94. 10.1016/j.jneumeth.2018.02.012 [DOI] [PMC free article] [PubMed] [Google Scholar]
- Mikkelsen M, Rimbault DL, Barker PB, Bhattacharyya PK, Brix MK, Buur PF, … Edden RAE (2019). Big GABA II: Water-referenced edited MR spectroscopy at 25 research sites. NeuroImage, 191, 537–548. 10.1016/j.neuroimage.2019.02.059 [DOI] [PMC free article] [PubMed] [Google Scholar]
- Millin R, Kolodny T, Flevaris AV, Kale AM, Schallmo M-P, Gerdts J, … Murray SO (2018). Reduced auditory cortical adaptation in autism spectrum disorder. eLife, 7, 1–15. 10.7554/eLife.36493 [DOI] [PMC free article] [PubMed] [Google Scholar]
- Morgenroth E, Orlov N, Lythgoe DJ, Stone JM, Barker H, Munro J, … Allen P (2019). Altered relationship between prefrontal glutamate and activation during cognitive control in people with high trait anxiety. Cortex, 117, 53–63. 10.1016/j.cortex.2019.02.021 [DOI] [PubMed] [Google Scholar]
- Mullins PG, McGonigle DJ, O’Gorman RL, Puts NAJ, Vidyasagar R, Evans CJ, … Wilson M (2014). Current practice in the use of MEGA-PRESS spectroscopy for the detection of GABA. NeuroImage, 86, 43–52. 10.1016/j.neuroimage.2012.12.004 [DOI] [PMC free article] [PubMed] [Google Scholar]
- Murray SO, Schallmo M-P, Kolodny T, Millin R, Kale AM, Thomas P, … Tadin D (2018). Sex differences in visual motion processing. Current Biology, 28, 2794–2799. 10.1016/j.cub.2018.06.014 [DOI] [PMC free article] [PubMed] [Google Scholar]
- Muthukumaraswamy SD, Edden RAE, Jones DK, Swettenham JB, & Singh KD (2009). Resting GABA concentration predicts peak gamma frequency and fMRI amplitude in response to visual stimulation in humans. Proceedings of the National Academy of Sciences of the United States of America, 106(20), 8356–8361. 10.1073/pnas.0900728106 [DOI] [PMC free article] [PubMed] [Google Scholar]
- Myers JFM, Nutt DJ, & Lingford-Hughes AR (2016). γ-aminobutyric acid as a metabolite: Interpreting magnetic resonance spectroscopy experiments. Journal of Psychopharmacology, 30(5), 422–427. 10.1177/0269881116639298 [DOI] [PubMed] [Google Scholar]
- Nelson SB, & Valakh V (2015). Excitatory/Inhibitory balance and circuit homeostasis in autism spectrum disorders. Neuron, 87(4), 684–698. 10.1016/j.neuron.2015.07.033 [DOI] [PMC free article] [PubMed] [Google Scholar]
- Oblak AL, Gibbs TT, & Blatt GJ (2011). Reduced GABAAreceptors and benzodiazepine binding sites in the posterior cingulate cortex and fusiform gyrus in autism. Brain Research, 1380, 218–228. 10.1016/j.brainres.2010.09.021 [DOI] [PMC free article] [PubMed] [Google Scholar]
- Page LA, Daly E, Schmitz N, Simmons A, Toal F, Deeley Q, … Murphy DGM (2006). In vivo 1H-magnetic resonance spectroscopy study of amygdala-hippocampal and parietal regions in autism. The American Journal of Psychiatry, 163(12), 2189–2192. 10.1176/ajp.2006.163.12.2189 [DOI] [PubMed] [Google Scholar]
- Peek AL, Rebbeck T, Puts NA, Watson J, Aguila ME, & Leaver AM (2020). Brain GABA and glutamate levels across pain conditions: A systematic literature review and metaanalysis of 1H-MRS studies using the MRS-Q quality assessment tool. NeuroImage, 210, 116532 10.1016/j.neuroimage.2020.116532 [DOI] [PubMed] [Google Scholar]
- Pelli DG (1997). The VideoToolbox software for visual psychophysics: Transforming numbers into movies. Spatial Vision, 10(4), 437–442. [PubMed] [Google Scholar]
- Petroff OAC (2002). GABA and glutamate in the human brain. Neuroscience, 8(6), 562–573. 10.1177/1073858402238515 [DOI] [PubMed] [Google Scholar]
- Piton A, Jouan L, Rochefort D, Dobrzeniecka S, Lachapelle K, Dion PA, … Rouleau GA (2013). Analysis of the effects of rare variants on splicing identifies alterations in GABA A receptor genes in autism spectrum disorder individuals. European Journal of Human Genetics, 21(7), 749–756. 10.1038/ejhg.2012.243 [DOI] [PMC free article] [PubMed] [Google Scholar]
- Port RG, Gaetz W, Bloy L, Wang DJ, Blaskey L, Kuschner ES, … Roberts TPL (2017). Exploring the relationship between cortical GABA concentrations, auditory gamma-band responses and development in ASD: Evidence for an altered maturational trajectory in ASD. Autism Research, 10(4), 593–607. 10.1002/aur.1686 [DOI] [PMC free article] [PubMed] [Google Scholar]
- Power JD, Mitra A, Laumann TO, Snyder AZ, Schlaggar BL, & Petersen SE (2014). Methods to detect, characterize, and remove motion artifact in resting state fMRI. NeuroImage, 84, 320–341. 10.1016/j.neuroimage.2013.08.048 [DOI] [PMC free article] [PubMed] [Google Scholar]
- Pretzsch CM, Freyberg J, Voinescu B, Lythgoe D, Horder J, Mendez MA, … McAlonan GM (2019). Effects of cannabidiol on brain excitation and inhibition systems; a randomised placebo-controlled single dose trial during magnetic resonance spectroscopy in adults with and without autism spectrum disorder. Neuropsychopharmacology, 44, 1398–1405. 10.1038/s41386-019-0333-8 [DOI] [PMC free article] [PubMed] [Google Scholar]
- Purcell AE, Jeon OH, Zimmerman AW, Blue ME, & Pevsner J (2001). Postmortem brain abnormalities of the glutamate neurotransmitter system in autism. Neurology, 57(9), 1618–1628. 10.1212/wnl.57.9.1618 [DOI] [PubMed] [Google Scholar]
- Puts NAJ, & Edden RAE (2012). In vivo magnetic resonance spectroscopy of GABA: A methodological review. Progress in Nuclear Magnetic Resonance Spectroscopy, 60, 29–41. 10.1016/j.pnmrs.2011.06.001 [DOI] [PMC free article] [PubMed] [Google Scholar]
- Puts NAJ, Edden RAE, Evans CJ, McGlone F, & McGonigle DJ (2011). Regionally specific human GABA concentration correlates with tactile discrimination thresholds. The Journal of Neuroscience, 31(46), 16556–16560. 10.1523/jneurosci.4489-11.2011 [DOI] [PMC free article] [PubMed] [Google Scholar]
- Puts NAJ, Wodka EL, Harris AD, Crocetti D, Tommerdahl M, Mostofsky SH, & Edden RAE (2017). Reduced GABA and altered somatosensory function in children with autism spectrum disorder. Autism Research, 10(4), 608–619. 10.1002/aur.1691 [DOI] [PMC free article] [PubMed] [Google Scholar]
- Ress D, & Heeger DJ (2003). Neuronal correlates of perception in early visual cortex. Nature Neuroscience, 6(4), 414–420. 10.1038/nn1024 [DOI] [PMC free article] [PubMed] [Google Scholar]
- Robertson CE, & Baron-Cohen S (2017). Sensory perception in autism. Nature Reviews. Neuroscience, 18(11), 671–684. 10.1038/nrn.2017.112 [DOI] [PubMed] [Google Scholar]
- Robertson CE, Martin A, Baker CI, & Baron-Cohen S (2012). Atypical integration of motion signals in autism spectrum conditions. PLoS One, 7(11), e48173 10.1016/j.cub.2015.11.019 [DOI] [PMC free article] [PubMed] [Google Scholar]
- Robertson CE, Ratai EM, & Kanwisher N (2016). Reduced GABAergic action in the autistic brain. Current Biology, 26 (1), 80–85. 10.1016/j.cub.2015.11.019 [DOI] [PubMed] [Google Scholar]
- Robertson CE, Thomas C, Kravitz DJ, Wallace GL, Baron-Cohen S, Martin A, & Baker CI (2014). Global motion perception deficits in autism are reflected as early as primary visual cortex. Brain, 137(9), 2588–2599. 10.1093/brain/awu189 [DOI] [PMC free article] [PubMed] [Google Scholar]
- Rogers SJ, & Ozonoff S (2005). Annotation: What do we know about sensory dysfunction in autism? A critical review of the empirical evidence. Journal of Child Psychology and Psychiatry, 46(12), 1255–1268. 10.1111/j.1469-7610.2005.01431.x [DOI] [PubMed] [Google Scholar]
- Rojas DC, Singel D, Steinmetz S, Hepburn S, & Brown MS (2014). Decreased left perisylvian GABA concentration in children with autism and unaffected siblings. NeuroImage, 86, 28–34. 10.1016/j.neuroimage.2013.01.045 [DOI] [PMC free article] [PubMed] [Google Scholar]
- Rojas DC, Teale PD, Maharajh K, Kronberg E, Youngpeter K, Wilson LB, et al. (2011). Transient and steady-state auditory gamma-band responses in first-degree relatives of people with autism spectrum disorder. Molecular Autism, 2(1), 11 10.1186/2040-2392-2-11 [DOI] [PMC free article] [PubMed] [Google Scholar]
- Rouder JN, Speckman PL, Sun D, Morey RD, & Iverson G (2009). Bayesian t tests for accepting and rejecting the null hypothesis. Psychonomic Bulletin & Review, 16(2), 225–237. 10.3758/PBR.16.2.225 [DOI] [PubMed] [Google Scholar]
- Rubenstein JLR, & Merzenich MM (2003). Model of autism: Increased ratio of excitation / inhibition in key neural systems. Genes, Brain and Behaviour, 2, 255–267. 10.1034/j.1601-183X.2003.00037.x [DOI] [PMC free article] [PubMed] [Google Scholar]
- Sapey-Triomphe LA, Lamberton F, Sonié S, Mattout J, & Schmitz C (2019). Tactile hypersensitivity and GABA concentration in the sensorimotor cortex of adults with autism. Autism Research, 12(4), 562–575. 10.1002/aur.2073 [DOI] [PubMed] [Google Scholar]
- Schallmo M-P, Kale AM, Millin R, Flevaris AV, Brkanac Z, Edden RA, et al. (2018). Suppression and facilitation of human neural responses. eLife, 7, e30334 10.7554/eLife.30334 [DOI] [PMC free article] [PubMed] [Google Scholar]
- Schallmo M-P, Kolodny T, Kale AM, Millin R, Flevaris AV, Edden RAE, et al. (2019). Weaker neural suppression in autism. Nature Communications, in press. http://biorxiv.org/content/early/2019/05/26/645846.abstract [DOI] [PMC free article] [PubMed]
- Schallmo M-P, Millin R, Kale AM, Kolodny T, Edden RAE, Bernier RA, & Murray SO (2019). Glutamatergic facilitation of neural responses in MT enhances motion perception in humans. NeuroImage, 184, 925–931. 10.1016/j.neuroimage.2018.10.001 [DOI] [PMC free article] [PubMed] [Google Scholar]
- Schür RR, Draisma LWR, Wijnen JP, Boks MP, Koevoets MGJC, Joëls M, … Vinkers CH (2016). Brain GABA levels across psychiatric disorders: A systematic literature review and meta-analysis of 1H-MRS studies. Human Brain Mapping, 37(9), 3337–3352. 10.1002/hbm.23244 [DOI] [PMC free article] [PubMed] [Google Scholar]
- Shungu DC, Mao X, Gonzales R, Soones TN, Dyke JP, van der Veen JW, & Kegeles LS (2016). Brain γ-aminobutyric acid (GABA) detection in vivo with the J-editing 1H MRS technique: A comprehensive methodological evaluation of sensitivity enhancement, macromolecule contamination and test–retest reliability. NMR in Biomedicine, 29(7), 932–942. 10.1002/nbm.3539 [DOI] [PMC free article] [PubMed] [Google Scholar]
- Snijders TM, Milivojevic B, & Kemner C (2013). Atypical excitation-inhibition balance in autism captured by the gamma response to contextual modulation. NeuroImage Clinical, 3, 65–72. 10.1016/j.nicl.2013.06.015 [DOI] [PMC free article] [PubMed] [Google Scholar]
- Sohal VS, & Rubenstein JLR (2019). Excitation-inhibition balance as a framework for investigating mechanisms in neuropsychiatric disorders. Molecular Psychiatry, 24(9), 1248–1257. 10.1038/s41380-019-0426-0 [DOI] [PMC free article] [PubMed] [Google Scholar]
- Spencer J, O’brien J, Riggs K, Braddick O, Atkinson J, & Wattam-Bell J (2000). Motion processing in autism: Evidence for a dorsal stream deficiency. Neuroreport, 11(12), 2765–2767. [DOI] [PubMed] [Google Scholar]
- Srinivasan R, Cunningham C, Chen A, Vigneron D, Hurd R, Nelson S, & Pelletier D (2006). TE-Averaged two-dimensional proton spectroscopic imaging of glutamate at 3 T. NeuroImage, 30(4), 1171–1178. 10.1016/j.neuroimage.2005.10.048 [DOI] [PubMed] [Google Scholar]
- Stagg CJ, Bachtiar V, & Johansen-berg H (2011). What are we measuring with GABA magnetic resonance spectroscopy? Communicative & Integrative Biology, 4(5), 573–575. 10.4161/cib.4.5.16213 [DOI] [PMC free article] [PubMed] [Google Scholar]
- Stano JF (2004). Wechler abbreviated scale of intelligence. Rehabilitation Counseling Bulletin, 48(1), 56–57. [Google Scholar]
- Tadin D, Lappin JS, Gilroy LA, & Blake R (2003). Perceptual consequences of centre – Surround antagonism in visual motion processing. Nature, 424, 312–315. 10.1038/nature01812.1 [DOI] [PubMed] [Google Scholar]
- Tarabeux J, Kebir O, Gauthier J, Hamdan FF, Xiong L, Piton A, … Krebs MO (2011). Rare mutations in N-methyl-D-aspartate glutamate receptors in autism spectrum disorders and schizophrenia. Translational Psychiatry, 1, e55 10.1038/tp.2011.52 [DOI] [PMC free article] [PubMed] [Google Scholar]
- Taylor M, Murphy SE, Selvaraj S, Wylezinkska M, Jezzard P, Cowen PJ, & Evans J (2008). Differential effects of citalopram and reboxetine on cortical Glx measured with proton MR spectroscopy. Journal of Psychopharmacology, 22 (5), 473–476. 10.1177/0269881107081510 [DOI] [PubMed] [Google Scholar]
- Tebartz Van Elst L, Maier S, Fangmeier T, Endres D, Mueller GT, Nickel K, … Perlov E (2014). Disturbed cingulate glutamate metabolism in adults with high-functioning autism spectrum disorder: Evidence in support of the excitatory/inhibitory imbalance hypothesis. Molecular Psychiatry, 19(12), 1314–1325. 10.1038/mp.2014.62 [DOI] [PubMed] [Google Scholar]
- Turkozer HB, Pamir Z, & Boyaci H (2016). Contrast affects fMRI activity in middle temporal cortex related to center-surround interaction in motion perception. Frontiers in Psychology, 7, 454 10.3389/fpsyg.2016.00454 [DOI] [PMC free article] [PubMed] [Google Scholar]
- Van Loon AM, Knapen T, Scholte HS, St. John-Saaltink E, Donner TH, & Lamme VAF (2013). GABA shapes the dynamics of bistable perception. Current Biology, 23(9), 823–827. 10.1016/j.cub.2013.03.067 [DOI] [PubMed] [Google Scholar]
- Waschkies CF, Bruns A, Müller S, Kapps M, Borroni E, Von Kienlin M, … Künnecke B (2014). Neuropharmacological and neurobiological relevance of in vivo 1 H-MRS of GABA and glutamate for preclinical drug discovery in mental disorders. Neuropsychopharmacology, 39(10), 2331–2339. 10.1038/npp.2014.79 [DOI] [PMC free article] [PubMed] [Google Scholar]
- Yizhar O, Fenno LE, Prigge M, Schneider F, Davidson TJ, Ogshea DJ, … Dersseroth K (2011). Neocor tical excitation/inhibition balance in information processing and social dysfunction. Nature, 477, 171–178. 10.1038/nature10360 [DOI] [PMC free article] [PubMed] [Google Scholar]
- Yousry TA, Schmid UD, Alkadhi H, Schmidt D, Peraud A, Buettner A, & Winkler P (1997). Localization of the motor hand area to a knob on the precentral gyrus. A new landmark. Brain, 120(1), 141–157. 10.1093/brain/120.1.141 [DOI] [PubMed] [Google Scholar]
- Yuan W, Altaye M, Ret J, Schmithorst V, Byars AW, Plante E, & Holland SK (2009). Quantification of head motion in children during various fMRI language tasks. Human Brain Mapping, 30(5), 1481–1489. 10.1002/hbm.20616 [DOI] [PMC free article] [PubMed] [Google Scholar]
- Zeki S (2015). Area V5 – A microcosm of the visual brain. Frontiers in Integrative Neuroscience, 9(21), 1–18. 10.3389/fnint.2015.00021 [DOI] [PMC free article] [PubMed] [Google Scholar]
- Zhang L, Huang C-C, Dai Y, Luo Q, Ji Y, Wang K, … Li F (2020). Symptom improvement in children with autism spectrum disorder following bumetanide administration is associated with decreased GABA/glutamate ratios. Translational Psychiatry, 10(9), 1–12. 10.1038/s41398-020-0692-2 [DOI] [PMC free article] [PubMed] [Google Scholar]
Associated Data
This section collects any data citations, data availability statements, or supplementary materials included in this article.