

Abstract
Objective:
To characterize the presence and nature of discrete behavioral phenotypes and their correlates in a cohort of youth with new and recent onset focal and generalized epilepsies.
Methods:
The parents of 290 youth (age 8–18) with epilepsy (n=183) and typically developing participants (n=107), completed the Child Behavior Checklist for children aged 6–18 (CBCL/6–18) from the Achenbach System of Empirically Based Assessment. The 8 behavior problem scales were subjected to hierarchical clustering analytics to identify behavioral subgroups. To characterize the external validity and co-occurring comorbidities of the identified subgroups we examined demographic (age, gender, handedness), cognition (language, perception, attention, executive function, speed), academic problems (present/absent), clinical epilepsy characteristics (epilepsy syndrome, medications), familial factors (parental IQ, education, employment), neuroimaging features (cortical thickness), parent observed day-to day executive function, and number of lifetime-to-date DSM-IV diagnoses.
Results:
Hierarchical clustering identified three behavioral phenotypes which included: no behavioral complications (Cluster 1, 67% of epilepsy cohort [n=122]), non-externalizing problems (Cluster 2, 11% of cohort [n=21]), and combined internalizing and externalizing problems (Cluster 3, 22% of cohort [n=40]). These behavioral phenotypes were characterized by orderly differences in personal characteristics, neuropsychological status, history of academic problems, parental status, cortical thickness, daily executive function, and number of lifetime to date DSM-IV diagnoses. Cluster 1 was most similar to controls across most metrics while Cluster 3 was the most abnormal compared to controls. Epilepsy syndrome was not a predictor of cluster membership.
Significance:
Youth with new and recent onset epilepsy fall into 3 distinct behavioral phenotypes associated with a variety of co-occurring features and comorbidities. This approach identifies important phenotypes of behavior problem presentations and their accompanying factors that serve to advance clinical and theoretical understanding of the behavioral complications of children with epilepsy and the complex conditions with which they co-occur.
Keywords: Behavior problems, Child Behavior Checklist, epilepsy, cluster analysis, latent groups, comorbidity
Introduction
Among the neurobehavioral complications of the childhood epilepsies, psychiatric and behavior disorders represent a particular concern reflected in reports by the International League Against Epilepsy1, Centers for Disease Control2, National Institute of Medicine3, and World Health Organization4. This concern has been generated by an extensive empirical literature including population- and community-based investigations that have documented increased rates of behavioral problems and psychiatric comorbidities in youth with epilepsy compared to normally developing youth and children with other medical conditions5–9. These and other studies have been critically evaluated in narrative, systematic and meta-analytic reviews10–11.
Despite the longstanding nature of this concern, a rarely pursued approach has been to ask whether there are clusters or latent groups of children who may be empirically categorized as behaviorally uncomplicated, severely affected, or impacted in specific ways (e.g., internalizing [depression or anxiety] or externalizing problems [aggression, rule breaking]). Identification of subgroups such as these could be of both clinical and theoretical significance. The relevant analytic approach in question (cluster analysis) has been used to characterize the taxonomy of cognitive abnormalities and their neuroimaging correlates in youth with epilepsy12 and especially adults with chronic temporal lobe epilepsy13–17. This approach has been extended to identify phenotypes of academic competence in adults with epilepsy18, parent-reported ratings of executive function in children with epilepsy19, and fMRI-based language activation patterns in youth with focal epilepsy20.
Finally, children with new onset epilepsy have been followed prospectively regarding the latent group trajectories of quality of life21 and depressive symptoms among mothers of children with new onset epilepsy22. In direct contrast, rarely have there been attempts to quantitatively identify phenotypes of emotional-behavioral status in patients with epilepsy, a notable example being the examination of symptom-based phenotypes of depression in adults with epilepsy23. No studies have attempted to identify behavioral phenotypes via cluster analytic techniques in children with epilepsy.
Here the first aim is to determine whether distinct behavioral phenotypes can be identified in youth with new and recent onset childhood epilepsies using arguably the most commonly used behavioral measure in the childhood epilepsy literature, the Child Behavior Checklist24. We hypothesize that at least three clusters will be identified, one without significant behavioral issues compared to controls, one with significant elevations compared to controls across all or most CBCL scales, and at least one group exhibiting specific behavioral complications. The second aim is to determine the association of identified behavioral phenotypes with demographic features (age, gender, handedness), cognition (language, perception, attention, executive function, speed), academic problems (present/absent), clinical epilepsy characteristics (epilepsy syndrome, medications), familial factors (parental IQ, education, employment status), neuroimaging features (cortical thickness), day-to day executive function (BRIEF), and number of lifetime-to-date DSM-IV diagnoses.
Methods
Participants
Participants consisted of 290 children aged 8–18, including youth with recent-onset epilepsy (n = 183) and healthy first-degree cousin controls (n = 107). Methodological details of this cohort have been provided previously25, but in brief, participants attended regular schools and were recruited from pediatric neurology clinics at three midwestern medical centers (University of Wisconsin—Madison, Marshfield Clinic, Dean Clinic), meeting the following inclusion criteria: (i) diagnosis of epilepsy within the past 12 months, (ii) no other developmental disabilities (e.g., intellectual disability or autism), (iii) no other neurological disorder, and (iv) normal clinical MRI with the exception of hippocampal sclerosis. Epilepsy participants were classified into broad syndrome groups of generalized epilepsies (GE) (n=91) and focal epilepsies (FE) (n=92), followed by classification into specific syndromes of GE (juvenile myoclonic epilepsy [JME](n=42), childhood and juvenile absence [Absence] (n=33), and IGE not otherwise specified [NOS] (n=16)) and FE (benign epilepsy with centrotemporal spikes [BECTS] (n=41), temporal lobe epilepsy [TLE] (n=20), frontal lobe epilepsy [FLE] (n=8), occipital lobe epilepsy (n=3) and focal epilepsy NOS (n=20)). The groups with temporal and frontal lobe syndrome were combined into one group (FLE/TLE) (n=28) because of their small sample size and lack of ictal confirmation of frontal versus temporal lobe seizure onset. The 3 children with occipital lobe epilepsy were not included in the analyses relating specific syndromes to behavioral clusters.
Exclusion criteria for controls were as follows: (i) history of any initial precipitating insult (e.g., simple or complex febrile seizures, cerebral infections, or perinatal stroke); (ii) any seizure or seizure-like episode; (iii) diagnosed neurological disease; (iv) loss of consciousness for more than 5 min; and (v) other family history of a first-degree relatives with epilepsy or febrile convulsions. This study was reviewed and approved by the Institutional Review Boards of all institutions and on the day of study participation, families and children gave informed consent and assent. All procedures were consistent with the Declaration of Helsinki26. Demographic characteristics of the participants are provided in Table 1.
Table 1:
Sample Characteristics
| Epilepsy | Controls | |
|---|---|---|
| Subjects (n) | 183 | 107 |
| Age | 12.2 (3.1) | 12.4 (3.0) |
| Gender | 90 male, 93 female | 54 male, 53 female |
| Grade | 6.5 (3.3) | 6.6 (2.7) |
| Full Sacle IQ | 101.4 (13.7) | 109.3 (11.3) |
| No/Mono/Poly | 29/144/10 | |
| Syndrome (IGE1/LRE2) | 91/92 |
Notes:
IGE composed of the following syndromes: juvenile myoclonic epilepsy [JME](n=42), childhood and juvenile absence [Absence] (n=33), and IGE not otherwise specified [NOS] (n=16)).
LRE composed of the following syndromes: benign epilepsy with centrotemporal spikes [BECTS] (n=41), temporal lobe epilepsy [TLE] (n=20), frontal lobe epilepsy [FLE] (n=8), occipital lobe epilepsy (n=3) and focal epilepsy NOS (n=20)). For syndromic analyses the groups with temporal and frontal lobe syndrome were combined (FLE/TLE) (n=28) and occipital lobe epilepsy excluded.
Procedures
Parent Reported Child Behavior:
Parents completed the Child Behavior Checklist for children aged 6–18 (CBCL/6–18) from the Achenbach System of Empirically Based Assessment (ASEBA)24. The dependent variables of interest included the CBCL/6–18 specific problem scales including Anxious/Depressed, Withdrawn/Depressed, Somatic Complaints, Social Problems, Thought Problems, Attention Problems, Rule Breaking Behavior, and Aggressive Behavior. The CBCL was completed by the parent accompanying the child to the study visit. Detailed information pertaining to the validity and reliability of the CBCL is available at: http://www.aseba.org/ordering/reliabilityvalidity.html. This measure has been used in an international literature addressing behavioral problems and social competence in youth with epilepsy10.
Regarding select measures to be described below, this longitudinal project was initiated in 2003 and we continued on with the initially administered tests rather than switch to newer versions of measures as they became available, some of which changed in content, scales or norms.
Neuropsychological assessment:
All children were administered a comprehensive test battery including measures of intelligence, academic achievement, language, immediate and delayed verbal memory, executive function, and speeded fine motor dexterity (see Supplementary Information 1 for a listing of the specific test measures). We previously demonstrated through confirmatory factor analysis that this battery is characterized by 5 underlying latent factors including Verbal, Perceptual, Attention, Executive Function, and Speed factors12. These 5 factor scores served as the dependent variables.
Child academic problems:
Parents underwent a structured interview assessing their child’s school progress and whether specific educational services were provided to address academic problems which included traditional individualized educational plan, history of early childhood interventions, mandatory summer school, grade retention, special tutoring services, or other specific educational services (inventory available from the authors)25. The interview was conducted blinded to cognitive and behavioral results and the key dependent measure was the presence/absence of academic problems.
Parent rating of executive function (Behavior Rating Inventory of Executive Function [BRIEF]).
The BRIEF is an 86-item parent questionnaire assessing multiple dimensions of day-to-day executive function which yields two summary index scores (Behavioral Regulation Index [BRI] and Metacognition index [MCI]), the dependent measures of interest here. The subscales of inhibit, shift, and emotional control comprise the summary BRI index; while the initiate, working memory, plan/organize, organizations, and monitor subscales comprise the MCI index27.
Family factors:
The full‐scale IQ (FSIQ) of each child’s participating parent was obtained using the two-subtest version of the Wechsler Abbreviated Scale of Intelligence (WASI)28. For each parent, employment status was classified as unemployed, employed part-time or employed full-time. Education was rated as greater than a high school education versus a high school diploma or less.
Psychiatric diagnostic interview:
In order to obtain DSM-IV-TR diagnoses, each child and parent participated in an independent semi‐structured interview using the Kiddie–Schedule for Affective Disorders and Schizophrenia–Present and Lifetime Version (K‐SADS)29 by a trained research assistant or three PhD psychologists. A consensus diagnosis was reached when parent and child interviews were conducted by different interviewers. Interviews were recorded and randomly selected for review to ensure interrater reliability. The number of lifetime-to-date diagnoses was the dependent variable of interest.
MRI acquisition:
Images were obtained on a 1.5T GE Signa MRI scanner (GE Healthcare, Waukesha, WI, U.S.A.). Sequences acquired for each participant were T1-weighted, three-dimensional (3D) spoiled gradients recall (SPGR) using the following parameters: TE = 5ms, TR = 24ms, flip angle = 40 degrees, NEX = 1, slice thickness = 1.5mm, slices = 124, plane = coronal, field of view (FOV) = 200mm, matrix = 256 × 256. All MR images were inspected before image processing. Image quality was rated from 0 – 4 (4 being the highest quality) and a minimum quality score of 3 was required for inclusion in the analysis.
Data analyses:
Cluster analysis:
The eight behavior problem scale scores were used for hierarchical clustering among patients with epilepsy. First, the variables were scaled and normalized. The optimal between cluster distance metric was determined by maximizing agglomerative coefficient using “average”, “single”, “complete”, and “Ward” linkages (“cluster” 2.1.0 R package `Finding Groups in Data”: Cluster Analysis Extended30. Next, the number of clusters was determined using the Elbow Method31 which is a graphical approach to determine optimal clustering number by determining the “within cluster sum of squares” (WSS), which is a measure of the within cluster variance. Then the WSS was plotted versus the number of clusters. The WSS monotonically decreases with increasing cluster number, but the inflection point at which more clusters results in a minimal decrease of WSS is considered the optimal number of clusters. Here, the optimal number of clusters was confirmed by finding the number of clusters in which the gap statistic was maximized (number of clusters limited between 2 and 5)32. After an optimal number of clusters was determined, hierarchical cluster bootstrapping with replacement for 1000 trials was used to ensure stability of clustering. Final partitions were determined by the frequency of concurrence over the 1000 trials (“fpc” - Flexible Procedures for Clustering” 2.2–3, Christian Henning R package). All statistical analysis was performed in R version 3.6.1 (Vienna, Austria).
Other analytics.
First, group comparisons across CBCL scales were conducted by ANOVA (epilepsy vs. controls) or MANOVA (comparison of epilepsy phenotypes and controls) with Sidek correction for multiple comparisons. Targeted group comparisons were conducted for other continuous variables including parental IQ, parent-reported child executive function, neuropsychological factor scores, child age, and number of lifetime-to-date psychiatric disorders. Distributional analyses confirmed that assumptions for parametric analyses were met. Second, Chi Square was used to examine dichotomous variables (academic problems, handedness, gender, parental education, employment status, total number of CBCL defined “at risk” scores (T> 65) across each scale). Examined within the epilepsy group was the distribution of epilepsy syndromes defined broadly (focal, generalized) and narrowly (BECTS, temporal/frontal, focal NOS, absence, JME, generalized NOS), as well as medication treatment (no medication, one medication, more than one medication). Finally, the neuroimaging correlates of cluster membership focused on differences in cortical thickness between controls and behavioral phenotype groups using surface-based group analyses with Freesurfer’s statistical tool, Qdec. Surface data was smoothed to improve intersubject averaging with a 15 mm full width half maximum (FWHM) Gaussian kernel. Age and gender were modeled as covariates for all measures. To correct for multiple comparisons, a Monte-Carlo simulation was implemented with an initial cluster-forming threshold set to p < 0.05. Clusters were tested against an empirical null distribution of maximum cluster size built using synthesized Z distributed data across 10,000 permutations, producing cluster wise p-values (CWP) fully corrected for multiple comparisons.
Results
Overall control vs epilepsy differences:
Epilepsy and control participants were compared across the 8 CBCL/6–18 behavior problem scales (Figure 1). MANOVA was significant, Hotelling T= .795, F=9.02, df=8,280, p< 0.001. The groups differed across all scales (p <0.001 for all but Rule Breaking at p=0.001) with all scores significantly elevated in the epilepsy group compared to controls.
Figure 1.
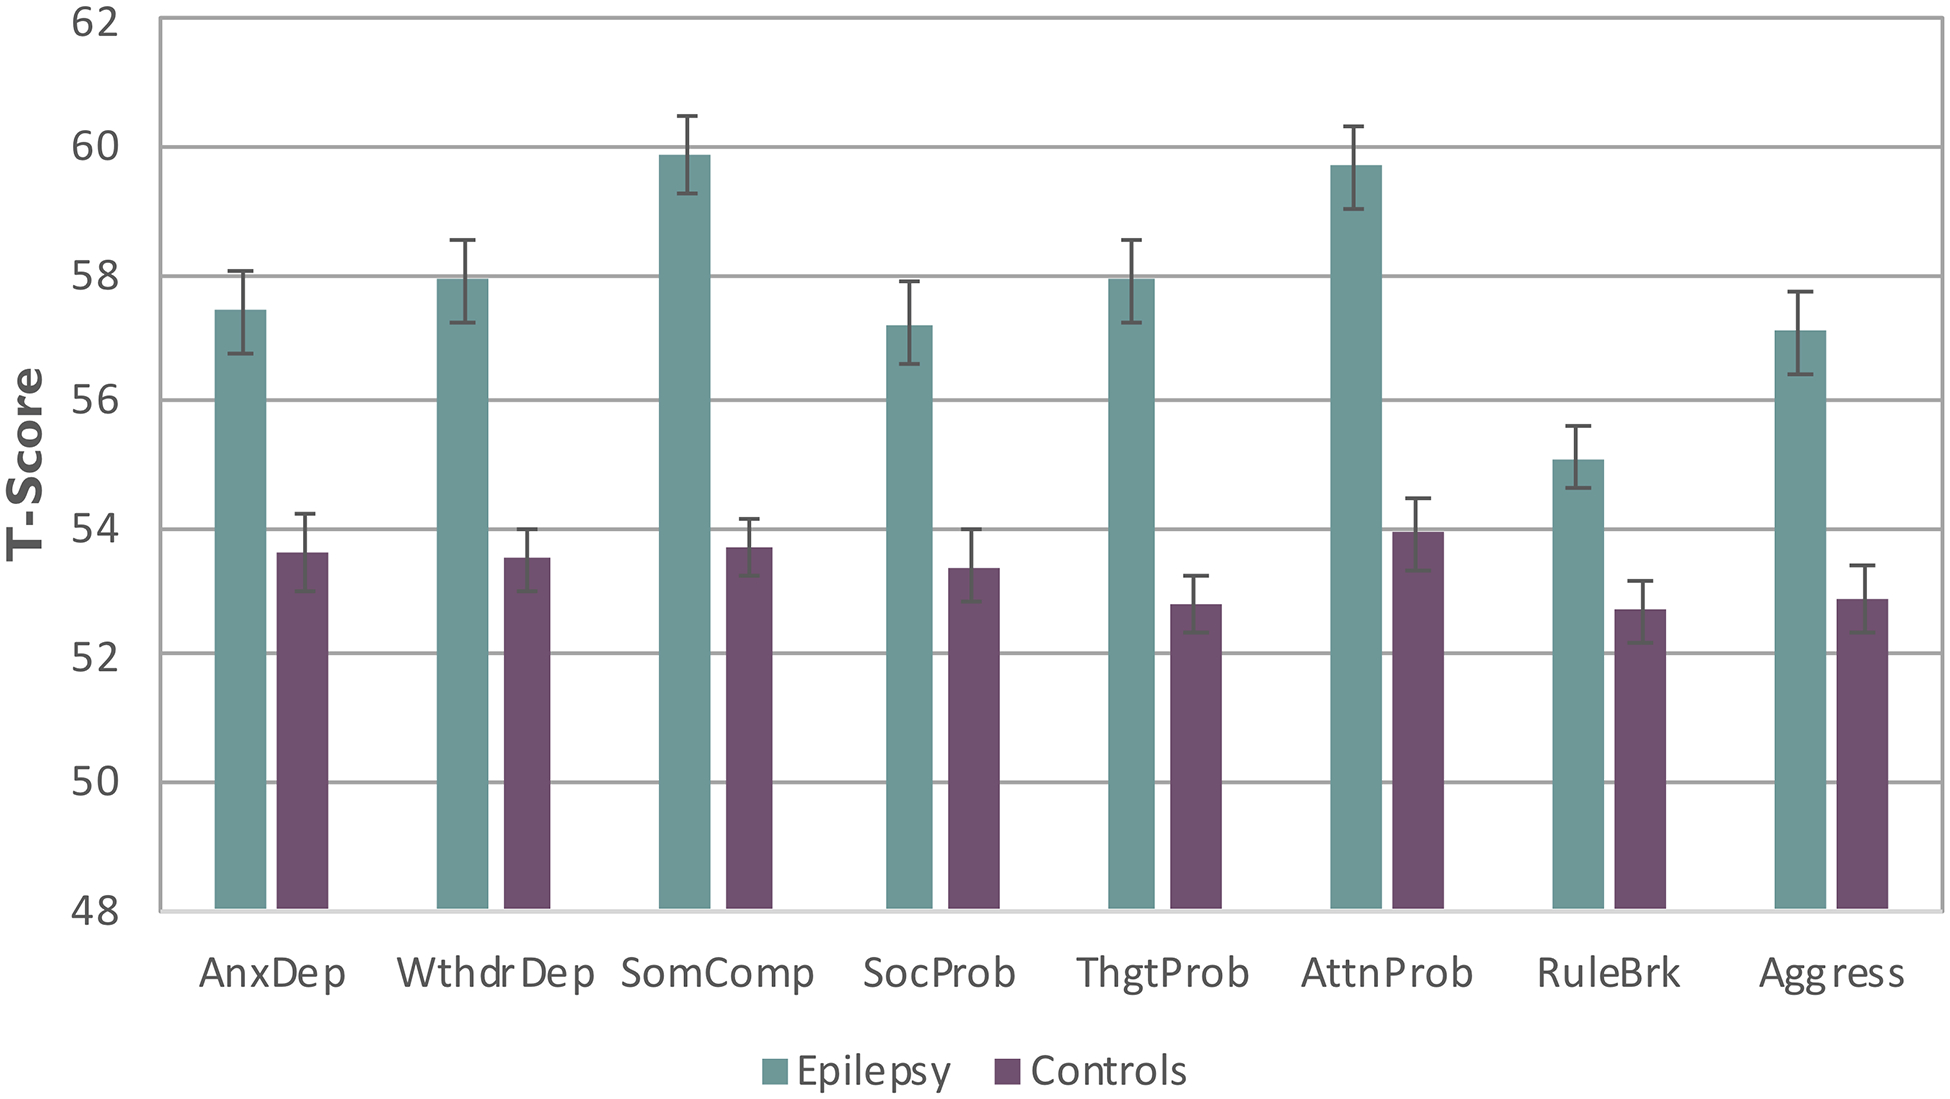
Mean behavior problem scale scores for the epilepsy and control groups
Note: AnxDep=Anxious Depressed, WdrlDep=Withdrawal Depressed, SomComp=Somatic Complaints, SocProb=Social Problems, ThgtProb=Thought Problems, AttnProb=Attention Problems, RuleBrk=Rule Breaking Behavior, Agress=Aggressive Behavior
Cluster analytic results:
Ward distance had the highest agglomerative coefficient at 0.962 and was used for final clusters. Other agglomerative coefficients were Average 0.817, Single 0.693, and Complete 0.870. The elbow method was used to determine the optimal number of clusters and it was determined that 3 clusters was a reasonable number of clusters given the small decline in total within sum of square in greater than 3 clusters (See Supplementary Information 2). The number of clusters was confirmed by using the gap statistic which was maximized at 3 clusters. Gap statistic was 0.306, 0.344, 0.342, 0.321 for cluster number 2,3,4,5 respectively. Final cluster partition was determined from bootstrapping as described in methods. Supplementary Information 3 presents the dendogram for the final solution. Figure 2 provides the CBCL profiles for the control and cluster groups.
Figure 2.

Mean CBCL scores for the 3 epilepsy cluster groups and controls
Note: AnxDep=Anxious Depressed, WdrlDep=Withdrawal Depressed, SomComp=Somatic Complaints, SocProb=Social Problems, ThgtProb=Thought Problems, AttnProb=Attention Problems, RuleBrk=Rule Breaking Behavior, Agress=Aggressive Behavior
Cluster 1 (67% of epilepsy cohort [n=122]) exhibited behavior problem scores similar to controls, Cluster 2 (11% of epilepsy sample [n=21]) exhibited elevations predominantly on non-externalizing behavior problem scales compared to controls, and Cluster 3 (22% of epilepsy sample [n=40]) exhibited elevated behavior problem scores across all scales except Rule Breaking compared to controls.
MANOVA for the control and epilepsy cluster groups across the CBCL behavior problem scales was significant, Hotelling T = 2.589 (24, 833) F=2.188, p<0.001). Compared to controls, Cluster 3 was worse across all scales (all p’s <0.001), and Cluster 1 was worse only on the Somatic Complaints (p=0.005) and Attention Problem (p=0.03) scales. Compared to controls, Cluster 2 was worse on Anxiety/Depression (p<0.001), Withdrawal/Depression (p<0.001), Somatic Complaints (p<0.001), Social Problems (p<0.001), Thought Problems (p<0.001) and Attention Problems (p=0.009) scales, but not Rule Breaking Behavior (p=0.68) or Aggressive Behavior (p=0.99). Regarding intra-cluster differences, Group 2 had higher (worse) scores than Group 1 across all scales (p<0.001) except Attention Problems (p=0.49), Rule Breaking Behavior (p=0.51), and Aggressive Behavior (p=0.43). Cluster 3 was worse than Cluster 2 on Anxiety/Depression (p<0.001), Social Problems (p<0.001), Thought Problems (p<0.001), Attention Problems (p<0.001) Rule Breaking Behavior (p<0.001) and Aggressive Behavior (p<0.001), but not Withdrawal/Depression (p=0.33) or Somatic Complaints (p=0.08).
Table 2 shows the proportion of at risk (T> 65) scores per scale for each group. All Chi Square analyses were significant (p<0.001), indicating an increasing proportion of at risk scores across the groups, consistent with the mean profile as described.
Table 2.
Proportion of Scale Scores Exceeding At Risk Threshold Per Group
| Scale | Controls | Cluster 1 | Cluster 2 | Cluster 3 |
|---|---|---|---|---|
| Anxious Depressed | 9.3 | 5.7 | 23.8 | 57.5 |
| Withdrawal Depressed | 4.7 | 6.6 | 42.9 | 65.0 |
| Somatic Complaints | 2.8 | 8.2 | 71.4 | 62.5 |
| Social Problems | 1.9 | 4.1 | 19.0 | 72.5 |
| Thought Problems | 4.7 | 4.9 | 38.1 | 65.0 |
| Attention Problems | 8.4 | 13.1 | 9.5 | 70.0 |
| Rule Breaking Behaviors | 3.7 | 2.5 | 0.0 | 40.0 |
| Aggressive Behaviors | 5.6 | 5.7 | 0 | 67.5 |
At risk threshold is T score ≥ 65
Neuropsychological assessment.
The mean cognitive factor scores for controls and clusters groups are presented in Figure 3. The overall MANOVA was significant, Hotelling T= 0.395, F=6.59, df=15, 752, p < 0.001, with an effect of group across all cognitive factor scores (all p’s <0.001). For the Verbal factor, controls performed better than all cluster groups (p’s 0.001 to <0.001). Cluster 3 performed worse than Cluster 1 (p <0.001) and Cluster 2 (0.005). Clusters 1 and 2 did not differ (p=0.43). For the Perceptual factor, controls performed better than all cluster groups (p’s 0.001 to <0.001). Cluster 3 performed significantly worse than Cluster 1 (p <0.001) and Cluster 2 (0.005). Clusters 1 and 2 did not differ (p=0.43). For the Attention factor, controls performed significantly better than all cluster groups (p’s 0.001 to <0.001). Cluster 3 performed worse than Cluster1 (p=0.04) and Cluster 2 showed a similar trend (p=0.10), with no other significant pairwise differences. For the Executive factor, controls performed better than all cluster groups (p’s 0.002 to <0.001). Cluster 3 performed worse than Cluster1 (p=0.004) and Cluster 2 (p=0.04), with no other significant pairwise differences. For the Speed factor, controls performed better than all cluster groups (p’s 0.009 to <0.001). Cluster 3 performed worse than Cluster1 (p=0.001) and Cluster 2 (p=0.015), with no other significant pairwise differences.
Figure 3.

Cognitive factor scores for control and behavioral cluster groups.
Note: AnxDep=Anxious Depressed, WdrlDep=Withdrawal Depressed, SomComp=Somatic Complaints, SocProb=Social Problems, ThgtProb=Thought Problems, AttnProb=Attention Problems, RuleBrk=Rule Breaking Behavior, Agress=Aggressive Behavior
Academic problems:
There was a significant relationship between history of academic problems and group (Chi Square = 43.1, df=6, p < 0.001). Among controls, 17.8% presented with a history of academic problems compared to 44.3%, 52.4% and 72.5% of participants within Clusters 1 through 3, significantly highest in the most problematic behavior group.
Parent rating of executive function (BRIEF).
MANOVA for the two BRIEF summary scales was significant, Hotelling T=.682 (df=6, 562), F=31.9, p<0.001. Compared to controls, Clusters 2 and 3 were elevated (worse) on the Behavioral Regulation Index and Cluster 3 was elevated (worse) compared to both Clusters 1 and 2 (p’s < 0.001). Compared to controls, all clusters were elevated (worse) on the Metacognition Index, and Cluster 3 was higher (worse) than Clusters 1 and 2 (p<0.001 and 0.001 respectively).
Family factors:
Father employment status varied across groups (Chi square = 33.4, df=6, p<0.001) with a greater rate of unemployment in Cluster 3 (29.6%) compared to controls and Clusters 1 and 2 (2.9%, 5.3%, and 0% respectively). There was no difference in employment status for mothers across groups (Chi square = 5.3, df= 6, p=0.50). Father education was significantly different across groups (Chi square= 13.2, df=3, p=0.004), but not mother education (Chi square=1.2, df=3, p=0.75). Lower paternal education was most common in Cluster 3 (51.6%) compared to controls (22.1%) and Clusters 1(39.3%) and 2 (45%).
Clinical factors:
There was a significant relationship between group membership and non-right handedness (Chi square= 12.7, df=3, p=0.005), characterized by 4.7% of controls and 11.5%, 9.5% and 25% of participants across Clusters 1 through 3. There was no difference in duration of epilepsy (p=0.35), number of medications (p=0.22), or epilepsy syndrome (focal versus generalized) (Chi Square= .82, df=2, p=0.66), as well as with examination of defined subgroups of generalized (absence, JME, generalized NOS) or focal epilepsies (BECTS, temporal/frontal, focal NOS), Chi square 16.7, df=16, p=0.40. Because the number of participants in Cluster 2 is modest (n=21) and the number of participants with specific syndromes is also modest in some cases, we reran these analyses deleting Cluster 2, using the larger Cluster 1 and 3 groups, focusing again on the broad syndrome groups (FE, GE) and then the specific syndrome groups with the largest sample sizes. Again, there were no associations between syndrome and cluster membership (all p’s >0.15). There were no differences across the clusters in age (p=0.81), grade (p=0.33) or gender (p=0.47).
Regarding specific medication issues, the number of children on topiramate was too small to examine (n=5). A total of 32 children with epilepsy were treated with levetiracetam and the presence/absence of levetiracetam was not associated with behavioral cluster membership (Chi Square= .68, df=2, p=0.71). Other medications taken by the participants were recorded and psychiatric medications were significantly overrepresented in Cluster 3 (Controls= 3.7%, Cluster 1= 9%, Cluster 2= 9.5%, Cluster 3= 47.5%) which is consistent with the KSADS results (to be presented below) (Chi Square=54.1, df=3, p<0.001).
Regarding seizure frequency, time since last seizure did not differ across the behavioral clusters (p=0.63) nor did onset age (p=0.61) or the presence of early (prediagnosis) untreated seizures (p=0.71).
Number of lifetime-to-date DSM-IV diagnoses.
The number of diagnoses differed across groups (F=64.5, df 3, 286, p <0.001) with a mean of .40 for controls and .74, .86, and 2.25 for Clusters 1 through 3. Cluster 3 had a higher number of diagnoses compared to all other groups (all p’s <0.001), with no difference between Clusters 1 and 2 (p= 0.98).
Cortical thickness.
There were significant differences between controls and Cluster 3 in the left paracentral (p=0.01), superior frontal (p=<0.001), superior temporal (p<0.001), and lateral occipital (p<0.001) areas; as well as the right paracentral (p=0.003), pars opercularis (p<0.001), supramarginal (p=0.05), caudal middle frontal (p=0.01), and inferior parietal (p<0.001) regions. Clusters 1 and 2 did not differ from controls. Supplementary Information 4 provides specific details.
Discussion
To our knowledge, this is the first demonstration of cluster-analytically defined behavior problem phenotypes in children with epilepsy. The phenotype groups will be reviewed followed by discussion of the correlates of phenotype membership and their implications.
Behavioral phenotypes.
Compared to controls, the average profile of the childhood epilepsy cohort suggested a general disruption of behavior with significantly worse behavior scores across all CBCL behavior problem scales (Figure 1), consistent with prior reports10,11,33. In this context, our hypothesis regarding underlying behavioral phenotypes was confirmed by hierarchical cluster analysis which identified three distinct subgroups characterized by very divergent behavioral profiles (Figure 2 and Supplementary Information 2).
Notable, and generally underappreciated, was the large subset of children with epilepsy whose behavior was largely indistinguishable from healthy controls (Cluster 1), representing 66% of the epilepsy cohort. The presence and proportion of this group is important as children with epilepsy who are doing well represent a substantial and understudied group, clearly identified by the behavioral phenotyping and its associated features. More generally, with the other behavioral phenotypes, the results point to a spectrum of behavioral presentations including the non-problematic group34. To that point, the other notable group was the significant minority of participants who carried a heavy behavior problem burden with significantly elevated (worse) ratings across all 8 behavior problem scales (Cluster 3), representing 22% of the epilepsy sample, with all but one of the scales (Rule Breaking) falling in the CBCL-defined “at risk” range. The third group (Cluster 2), representing 11% of the sample, exhibited significant elevations predominantly involving the non-externalizing behavior problem scales. Thus, mean behavior profiles are arguably misleading as they obscure the substantial variability that exists across youth with epilepsy, presenting an alternative view of this important comorbidity.
Neuropsychological and academic status.
Regarding cognition (Figure 3), all cluster groups differed from controls across all factor scores including the most normal behavioral group (Cluster 1). Despite the average IQ of the epilepsy participants, albeit mildly lower than controls, there was an impact of epilepsy on specific cognitive domains in a non-uniform manner35. Regarding the impact of behavioral cluster, Cluster 3 demonstrated the most adversely impacted cognition, differing from Cluster 1 across all factor scores and Cluster 2 on the Verbal, Perceptual, and Executive factors. Consistent with this pattern, the presence/absence of a history of academic difficulties leading to provision of various supportive services was highest in Cluster 3 and least in Cluster 1, the latter still elevated compared to controls, again representing an independent impact of epilepsy.
Neurobehavioral correlates.
The objective impairments in executive function were mirrored by parent reports of disrupted day-to-day self-directed behavior (BRIEF) where youth in Cluster 3 exhibited the poorest behavior and metacognition indices, reflecting more dysexecutive function in day-to-day behavior and emotional control. Despite these findings, there is a need to update these results in the context of evolving understanding of more differentiated executive function including in children and in that regard, the BRIEF-2 could be informative in future studies. Furthermore, the significant relationship between cluster membership and the number of lifetime-to-date DSM IV diagnoses provides both an external validation of the behavioral taxonomy reported here as well as a reflection of the broader psychiatric implications of this taxonomy.
Family and demographic factors.
The most abnormal behavioral group, Cluster 3, was characterized by the lowest parent full scale IQ, highest proportion of unemployed fathers, lowest father educational level, and highest proportion of non-right-handedness among the youth with epilepsy. While parental IQ was lowest in Cluster 3 it still fell well within the average range and should not be considered clinically significant. The possibility of significant ambient financial/socioeconomic stress is raised by the finding of the highest proportion of father unemployment in Cluster 3 (29%). We did not obtain specific financial information to determine the degree of distress, but a relationship between socioeconomic stress and deprivation on the family unit and/or risk of specific behavior problems in youth with epilepsy has been reported36. These findings underscore the important role of the family unit on the behavioral status of children with epilepsy37. Finally, the elevated rate of non-right handedness in Cluster 3 speaks to the possibility of an early atypical neurodevelopmental impact, interesting in that entry into this study required normal clinical imaging, so brain lesional status was not a complicating factor.
Clinical epilepsy correlates.
While clinical epilepsy variables are typically a prominent focus of interest regarding the etiology of behavioral complications in childhood epilepsy38–40, here neither broad syndromic classification (focal versus generalized epilepsy) nor specific syndrome classification of either focal or generalized epilepsy syndromes were associated with cluster membership. The same result was found in relation to cognitive phenotypes in this cohort12. The behavioral phenotypes were distributed independently of epilepsy syndromes. Cluster representation was also unrelated to the number of medications and duration of epilepsy.
Neuroimaging correlates.
Cluster 3 exhibited notable anomalies in cortical thickness involving regions of the limbic and frontal regions. There are imaging signatures associated with abnormalities across specific CBCL behavior problem scales, a point we have demonstrated previously with this measure41. But here we find that the taxonomy of behavioral disruption is in part related to brain anatomy, particularly regions involved in affect and affect regulation. We would not have expected the epilepsy group with “normal” behavioral scores (Cluster 1) to be different from controls in imaging characteristics, but an unexpected finding was that Cluster 2 exhibited no imaging correlates. As noted, both we and others have found imaging correlates associated with specific CBCL behavior problem scales in both cross-section and longitudinal research39,42,43, and we suspect that further work with an expanded number of Cluster 2 participants will help determine whether the null findings are an accurate or false negative finding.
Implications and limitations.
First, this study and others have demonstrated that characteristic profiles of behavioral, cognitive and quality of life comorbidities yield an incomplete understanding of the nature and range of comorbidity status. As shown here, while the average profile of behavioral status infers a picture of far ranging behavior problems in youth with epilepsy, cluster analysis demonstrates that discrete groups of youth with epilepsy can be identified, suggesting that a spectrum view of behavioral comorbidities is useful and that a phenotyping approach may be helpful. This approach could similarly be applied to formal psychiatric diagnoses in patients with epilepsy which would be very informative.
Second, while the focus here was the taxonomy of behavioral issues, the linkage of CBCL cluster membership to other important issues including objective cognitive status, need for supportive academic services, family status (intelligence, education, employment) and even personal characteristics such as handedness is notable. These findings indicate that multiple problems and challenges co-occur or “travel together” in this behavioral taxonomy.
Third, while interest in the neurobiology of diverse comorbidities has been great and continues to grow over time, the factors involved in taxonomies in both adults and children with epilepsy are broad and include family, socioeconomic, developmental and psychological factors—suggesting that more comprehensive views of the potential etiologies and hence subsequent interventions may be possible.
This study has limitations including the fact that patterns of causation between the behavioral phenotypes and their co-occurring conditions remain to be determined and the findings speak only to idiopathic epilepsies. The status of behavioral phenotypes in acquired and more complicated epilepsies remains unclear, and this cross-sectional study cannot speak to the prospective course of behavioral adjustment in this cohort—all issues for future research. To clarify the nature of the relationship between epilepsy syndromes and cluster membership it is likely that a much larger number of epilepsy participants is needed. In this investigation, the number of participants for the broad syndromic groups (FE=92, GE=91) would seem to be robust, but the specific syndrome groupings are clearly smaller and very possibly associated with insufficient power to detect relationships, and therefore large multicenter investigations may be useful. Finally, investigations such as this will benefit by inclusion of newer versions of administered tests; updates of some of the tests have made a substantive difference in how the scales are interpreted (i.e., BRIEF compared to the BRIEF-2).
Supplementary Material
Supporting Information 1. Neuropsychological test battery
Supporting Information 2. Cluster elbow figure
Supporting Information 3. Cluster dendogram
Supporting Information 4. Cortical thickness areas
Figure 4.

Decreased in cortical thickness in Cluster 3 compared to controls in left hemisphere (top left and right) and right hemisphere (bottom left and right panels). See text for details.
Key Points.
We examined whether distinct behavioral phenotypes could be identified in youth with new and recent onset childhood epilepsies.
The eight CBCL behavior problem scales were subjected to hierarchical clustering analytics.
Three behavioral phenotype groups were identified: normal [67% of sample], non-externalizing problems [11%], and globally impaired [22%].
The behavioral phenotypes were linked to orderly differences in cognitive, psychiatric, functional, imaging and family characteristics.
Identification of behavioral phenotypes and their correlates may offer new insights into the longstanding clinical problem of neuropsychiatric co-morbidities of epilepsy.
Acknowledgments:
This paper was supported by NIH 2RO1-44351.
Footnotes
Conflicts of Interest: The authors have no significant relationship with, or financial interest in, any commercial companies pertaining to this article.
Ethical Approval: We confirm that we have read the Journal’s position on issues involved in ethical publication and affirm that this report is consistent with those guidelines.
References
- 1.Besag F, Aldenkamp A, Caplan R, Dunn DW, Gobbi G, Sillanpaa M. Psychiatric and Behavioural Disorders in Children with Epilepsy: an ILAE Task Force Report. Epileptic Disord. 2016;18 Suppl 1:1–86. [DOI] [PubMed] [Google Scholar]
- 2.Austin JK, Carr DA, Hermann BP. Living Well II: a review of progress since 2003. Epilepsy Behav. 2006;9(3):386–93. [DOI] [PubMed] [Google Scholar]
- 3.England MJ, Liverman CT, Schultz AM, Strawbridge LM. Epilepsy across the spectrum: promoting health and understanding. A summary of the Institute of Medicine report. Epilepsy Behav. 2012;25(2):266–76. [DOI] [PMC free article] [PubMed] [Google Scholar]
- 4.World Health Organization WH. Epilepsy: a public health imperative: Geneva: World Health Organization; 2019. [Available from: https://www.ilae.org/files/dmfile/19053_Epilepsy_A-public-health-imperative-For-Web.pdf. [Google Scholar]
- 5.Reilly C, Atkinson P, Das KB, Chin RF, Aylett SE, Burch V, et al. Neurobehavioral comorbidities in children with active epilepsy: a population-based study. Pediatrics. 2014;133(6):e1586–93. [DOI] [PubMed] [Google Scholar]
- 6.Davies S, Heyman I, Goodman R. A population survey of mental health problems in children with epilepsy. Dev Med Child Neurol. 2003;45(5):292–5. [DOI] [PubMed] [Google Scholar]
- 7.Gordon N A Neuropsychiatric Study in Childhood (Book). Journal of Child Psychology & Psychiatry & Allied Disciplines. 1971;12(2):147–8. [Google Scholar]
- 8.Austin JK, Harezlak J, Dunn DW, Huster GA, Rose DF, Ambrosius WT. Behavior problems in children before first recognized seizures. Pediatrics. 2001;107(1):115–22. [DOI] [PubMed] [Google Scholar]
- 9.McDermott SM,S; and Krishnawami S A population-based analysis of specific behavior problems associated with childhood seizures. Journal of Epilepsy. 1995;8(2):110–8. [Google Scholar]
- 10.Rodenburg R, Stams GJ, Meijer AM, Aldenkamp AP, Dekovic M. Psychopathology in children with epilepsy: a meta-analysis. J Pediatr Psychol. 2005;30(6):453–68. [DOI] [PubMed] [Google Scholar]
- 11.Austin JK, Caplan R. Behavioral and psychiatric comorbidities in pediatric epilepsy: toward an integrative model. Epilepsia. 2007;48(9):1639–51. [DOI] [PubMed] [Google Scholar]
- 12.Hermann BP, Zhao Q, Jackson DC, Jones JE, Dabbs K, Almane D, et al. Cognitive phenotypes in childhood idiopathic epilepsies. Epilepsy Behav. 2016;61:269–74. [DOI] [PMC free article] [PubMed] [Google Scholar]
- 13.Reyes A, Kaestner E, Bahrami N, Balachandra A, Hegde M, Paul BM, et al. Cognitive phenotypes in temporal lobe epilepsy are associated with distinct patterns of white matter network abnormalities. Neurology. 2019;92(17):e1957–e68. [DOI] [PMC free article] [PubMed] [Google Scholar]
- 14.Kaestner E, Reyes A, Macari AC, Chang YH, Paul BM, Hermann BP, et al. Identifying the neural basis of a language-impaired phenotype of temporal lobe epilepsy. Epilepsia. 2019;60(8):1627–38. [DOI] [PMC free article] [PubMed] [Google Scholar]
- 15.Elverman KH, Resch ZJ, Quasney EE, Sabsevitz DS, Binder JR, Swanson SJ. Temporal lobe epilepsy is associated with distinct cognitive phenotypes. Epilepsy Behav. 2019;96:61–8. [DOI] [PubMed] [Google Scholar]
- 16.Hermann B, Seidenberg M, Lee EJ, Chan F, Rutecki P. Cognitive phenotypes in temporal lobe epilepsy. J Int Neuropsychol Soc. 2007;13(1):12–20. [DOI] [PubMed] [Google Scholar]
- 17.Rodriguez-Cruces R, Velazquez-Perez L, Rodriguez-Leyva I, Velasco AL, Trejo-Martinez D, Barragan-Campos HM, et al. Association of white matter diffusion characteristics and cognitive deficits in temporal lobe epilepsy. Epilepsy Behav. 2018;79:138–45. [DOI] [PubMed] [Google Scholar]
- 18.Paradiso S, Hermann BP, Somes G. Patterns of academic competence in adults with epilepsy: a cluster analytic study. Epilepsy Res. 1994;19(3):253–61. [DOI] [PubMed] [Google Scholar]
- 19.Modi AC, Gutierrez-Colina AM, Wagner JL, Smith G, Junger K, Huszti H, et al. Executive functioning phenotypes in youth with epilepsy. Epilepsy Behav. 2019;90:112–8. [DOI] [PubMed] [Google Scholar]
- 20.Berl MM, Zimmaro LA, Khan OI, Dustin I, Ritzl E, Duke ES, et al. Characterization of atypical language activation patterns in focal epilepsy. Ann Neurol. 2014;75(1):33–42. [DOI] [PMC free article] [PubMed] [Google Scholar]
- 21.Sajobi TT, Wang M, Ferro MA, Brobbey A, Goodwin S, Speechley KN, et al. Multivariate trajectories across multiple domains of health-related quality of life in children with new-onset epilepsy. Epilepsy Behav. 2017;75:72–8. [DOI] [PubMed] [Google Scholar]
- 22.Puka K, Ferro MA, Anderson KK, Speechley KN. Prevalence and trajectories of depressive symptoms among mothers of children with newly diagnosed epilepsy: A longitudinal 10-year study. Epilepsia. 2019;60(2):358–66. [DOI] [PubMed] [Google Scholar]
- 23.Rayner G, Jackson GD, Wilson SJ. Two distinct symptom-based phenotypes of depression in epilepsy yield specific clinical and etiological insights. Epilepsy Behav. 2016;64(Pt B):336–44. [DOI] [PubMed] [Google Scholar]
- 24.Achenbach TM, Rescorla LA. Manual for the ASEBA School-Age forms and profiles. Burlington, VT: University of Vermont, Research Center for Children, Youth and Families; 2001. [Google Scholar]
- 25.Hermann B, Jones J, Sheth R, Dow C, Koehn M, Seidenberg M. Children with new-onset epilepsy: neuropsychological status and brain structure. Brain. 2006;129(Pt 10):2609–19. [DOI] [PubMed] [Google Scholar]
- 26.World Medical Association Declaration of Helsinki: ethical principles for medical research involving human subjects. Jama. 2013;310(20):2191–4. [DOI] [PubMed] [Google Scholar]
- 27.Gioia GA, Isquith PK, Guy SC, Kenworthy L. Behavior Rating Inventory of Executive Function professional manual. Lutz, FL: Psychological Assessment Resources, Inc.; 2000. [Google Scholar]
- 28.Wechsler D Wechsler Abbreviated Scale of Intelligence. San Antonio, TX: The Psychological Corporation; 1999. [Google Scholar]
- 29.Kaufman J, Birmaher B, Brent D, Rao U, Flynn C, Moreci P, et al. Schedule for Affective Disorders and Schizophrenia for School-Age Children-Present and Lifetime Version (K-SADS-PL): initial reliability and validity data. J Am Acad Child Adolesc Psychiatry. 1997;36(7):980–8. [DOI] [PubMed] [Google Scholar]
- 30.Maechler MR,P; Struyf A; Hubert M; Hornik K Cluster: C Cluster Analysis Basics and Extensions. R package version 2.1.0. The R Project for Statistical Computing. 2019. [Google Scholar]
- 31.Sujatha SS,AS. New Fast K-Means Clustering Algorithm using Modified Centroid Selection Method. International Journal of Engineering Research & Technology (IJERT). 2013;2(2). [Google Scholar]
- 32.Tibshirani RW,G; Hastie T Estimating the number of clusters in a data set via the gap statistic. Journal of the Royal Statistical Society. 2001;63:411–23. [Google Scholar]
- 33.Ott D, Siddarth P, Gurbani S, Koh S, Tournay A, Shields WD, et al. Behavioral disorders in pediatric epilepsy: unmet psychiatric need. Epilepsia. 2003;44(4):591–7. [DOI] [PubMed] [Google Scholar]
- 34.Berg AT. Epilepsy, cognition, and behavior: The clinical picture. Epilepsia. 2011;52 Suppl 1:7–12. [DOI] [PMC free article] [PubMed] [Google Scholar]
- 35.Lin JJ, Mula M, Hermann BP. Uncovering the neurobehavioural comorbidities of epilepsy over the lifespan. Lancet. 2012;380(9848):1180–92. [DOI] [PMC free article] [PubMed] [Google Scholar]
- 36.Carson J, Weir A, Chin RF, McLellan A. Socioeconomic deprivation is an independent risk factor for behavioral problems in children with epilepsy. Epilepsy Behav. 2015;45:105–9. [DOI] [PubMed] [Google Scholar]
- 37.Fastenau PS, Shen J, Dunn DW, Perkins SM, Hermann BP, Austin JK. Neuropsychological predictors of academic underachievement in pediatric epilepsy: moderating roles of demographic, seizure, and psychosocial variables. Epilepsia. 2004;45(10):1261–72. [DOI] [PMC free article] [PubMed] [Google Scholar]
- 38.Salpekar JA, Berl MM, Havens K, Cushner-Weinstein S, Conry JA, Pearl PL, et al. Psychiatric symptoms in children prior to epilepsy surgery differ according to suspected seizure focus. Epilepsia. 2013;54(6):1074–82. [DOI] [PubMed] [Google Scholar]
- 39.Morningstar M, Hung A, Mattson WI, Gedela S, Ostendorf AP, Nelson EE. Internalizing symptoms in intractable pediatric epilepsy: Structural and functional brain correlates. Epilepsy Behav. 2020;103(Pt A):106845. [DOI] [PubMed] [Google Scholar]
- 40.Ott D, Caplan R, Guthrie D, Siddarth P, Komo S, Shields WD, et al. Measures of psychopathology in children with complex partial seizures and primary generalized epilepsy with absence. J Am Acad Child Adolesc Psychiatry. 2001;40(8):907–14. [DOI] [PubMed] [Google Scholar]
- 41.Dabbs K, Jones JE, Jackson DC, Seidenberg M, Hermann BP. Patterns of cortical thickness and the Child Behavior Checklist in childhood epilepsy. Epilepsy Behav. 2013;29(1):198–204. [DOI] [PMC free article] [PubMed] [Google Scholar]
- 42.Whittle S, Vijayakumar N, Simmons JG, Allen NB. Internalizing and Externalizing Symptoms Are Associated With Different Trajectories of Cortical Development During Late Childhood. J Am Acad Child Adolesc Psychiatry. 2020;59(1):177–85. [DOI] [PubMed] [Google Scholar]
- 43.Ameis SH, Ducharme S, Albaugh MD, Hudziak JJ, Botteron KN, Lepage C, et al. Cortical thickness, cortico-amygdalar networks, and externalizing behaviors in healthy children. Biol Psychiatry. 2014;75(1):65–72. [DOI] [PubMed] [Google Scholar]
- 44.Dunn L, Dunn L, WIlliams KT. Peabody Picture Vocabulary Test. 3rd ed. Circle Pines, MN: American Guidance Service; 1997. [Google Scholar]
- 45.Williams KT. Expressive Vocabulary Test. Circle Pines, MN: American Guidance Service; 1997. [Google Scholar]
- 46.Wilkinson GS. Wide Range Achievement Test: Manual. 3 ed. Wilmington, DE: Wide Range, Inc.; 1993. [Google Scholar]
- 47.Conners C The Connors’ Continuous Performance Test. Toronto, Canada: Multi-Heath Systems; 1995. [Google Scholar]
- 48.Company LI. Grooved Peg Board Test. Lafayette, 2002. [Google Scholar]
- 49.Wechsler D Wechsler Intelligence Scale for Children. 3rd ed. San Antonio, TX: The Psycholocal Corporation; 1991. [Google Scholar]
- 50.Delis DCKE, Kramer JH. The Delis-Kaplan Executive Function System. San Antonio, TX: The Psychological Corporation; 2001. [Google Scholar]
Associated Data
This section collects any data citations, data availability statements, or supplementary materials included in this article.
Supplementary Materials
Supporting Information 1. Neuropsychological test battery
Supporting Information 2. Cluster elbow figure
Supporting Information 3. Cluster dendogram
Supporting Information 4. Cortical thickness areas