

Abstract
Background
The ideal quantity of dietary protein for formula‐fed low birth weight infants is still a matter of debate. Protein intake must be sufficient to achieve normal growth without leading to negative effects such as acidosis, uremia, and elevated levels of circulating amino acids.
Objectives
To determine whether higher (≥ 3.0 g/kg/d) versus lower (< 3.0 g/kg/d) protein intake during the initial hospital stay of formula‐fed preterm infants or low birth weight infants (< 2.5 kilograms) results in improved growth and neurodevelopmental outcomes without evidence of short‐ or long‐term morbidity.
Specific objectives were to examine the following comparisons of interventions and to conduct subgroup analyses if possible.
1. Low protein intake if the amount was less than 3.0 g/kg/d.
2. High protein intake if the amount was equal to or greater than 3.0 g/kg/d but less than 4.0 g/kg/d.
3. Very high protein intake if the amount was equal to or greater than 4.0 g/kg/d.
Search methods
We used the standard search strategy of Cochrane Neonatal to search the Cochrane Central Register of Controlled Trials (CENTRAL; 2019, Issue 8), in the Cochrane Library (August 2, 2019); OVID MEDLINE Epub Ahead of Print, In‐Process & Other Non‐Indexed Citations, Ovid MEDLINE(R) Daily, and Ovid MEDLINE(R) (to August 2, 2019); MEDLINE via PubMed (to August 2, 2019) for the previous year; and the Cumulative Index to Nursing and Allied Health Literature (CINAHL) (to August 2, 2019). We also searched clinical trials databases and the reference lists of retrieved articles for randomized controlled trials (RCTs) and quasi‐randomized trials.
Selection criteria
We included RCTs contrasting levels of formula protein intake as low (< 3.0 g/kg/d), high (≥ 3.0 g/kg/d but < 4.0 g/kg/d), or very high (≥ 4.0 g/kg/d) in formula‐fed hospitalized neonates weighing less than 2.5 kilograms. We excluded studies if infants received partial parenteral nutrition during the study period, or if infants were fed formula as a supplement to human milk.
Data collection and analysis
We used standard methodological procedures expected by Cochrane and the GRADE approach to assess the certainty of evidence.
Main results
We identified six eligible trials that enrolled 218 infants through searches updated to August 2, 2019. Five studies compared low (< 3 g/kg/d) versus high (3.0 to 4.0 g/kg/d) protein intake using formulas that kept other nutrients constant. The trials were small (n = 139), and almost all had methodological limitations; the most frequent uncertainty was about attrition. Low‐certainty evidence suggests improved weight gain (mean difference [MD] 2.36 g/kg/d, 95% confidence interval [CI] 1.31 to 3.40) and higher nitrogen accretion in infants receiving formula with higher protein content (3.0 to 4.0 g/kg/d) versus lower protein content (< 3 g/kg/d), while other nutrients were kept constant. No significant differences were seen in rates of necrotizing enterocolitis, sepsis, or diarrhea. We are uncertain whether high versus low protein intake affects head growth (MD 0.37 cm/week, 95% CI 0.16 to 0.58; n = 18) and length gain (MD 0.16 cm/week, 95% CI ‐0.02 to 0.34; n = 48), but sample sizes were small for these comparisons.
One study compared high (3.0 to 4.0 g/kg/d) versus very high (≥ 4 g/kg/d) protein intake (average intakes were 3.6 and 4.1 g/kg/d) during and after an initial hospital stay (n = 77). Moderate‐certainty evidence shows no significant differences in weight gain or length gain to discharge, term, and 12 weeks corrected age from very high protein intake (4.1 versus 3.6 g/kg/d). Three of the 24 infants receiving very high protein intake developed uremia.
Authors' conclusions
Higher protein intake (≥ 3.0 g/kg/d but < 4.0 g/kg/d) from formula accelerates weight gain. However, limited information is available regarding the impact of higher formula protein intake on long‐term outcomes such as neurodevelopment. Research is needed to investigate the safety and effectiveness of protein intake ≥ 4.0 g/kg/d.
Plain language summary
Higher versus lower protein intake in formula‐fed low birth weight infants
Review question
Does feeding preterm or low birth weight infants (< 2.5 kilograms) higher protein intake during the initial hospital stay improve growth and developmental outcomes?
Background
Infants grow quickly and need more protein for each kilogram of body weight than older children and adults. Infants born with low birth weight, for example, those who are born prematurely, need more protein because of their fast growth rates.
Study characteristics
We identified six eligible trials that enrolled a total of 218 infants through searches updated to August 2, 2019.
Key results
Higher protein intake (3 to 4 versus less than 3 grams of protein per kilogram) resulted in slightly greater weight gain, of around 2 grams per kilogram per day. We are uncertain whether this difference in protein intake affects head and length growth because not many infants were studied. Existing research does support specific recommendations regarding formula with protein content that provides more than 4 g/kg/d. No harmful effects were observed.
Certainty of evidence
The review was limited in the conclusions made because differences in protein content among comparison groups in some individual trials were small and formulas differed substantially across studies; some studies included healthier and more mature preterm infants. Information on long‐term outcomes is limited.
Summary of findings
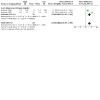
Summary of findings 1. High protein compared to low protein intake (restricted to studies meeting all a priori inclusion criteria) in formula‐fed low birth weight infants.
| Patient or population: formula‐fed low birth weight infants Setting: neonatal care facilities in USA, Canada, and Sweden Intervention: HIGH protein intake Comparison: LOW protein intake | ||||||
| Outcomes | Anticipated absolute effects* (95% CI) | Relative effect (95% CI) | №. of participants (studies) | Certainty of evidence (GRADE) | Comments | |
| Risk with low protein intake (restricted to studies meeting all a priori inclusion criteria) | Risk with high protein intake | |||||
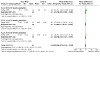
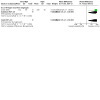
| Weight gain (g/kg/d) | Mean growth parameters ‐ weight gain (g/kg/d) was 0 | MD 2.36 higher (1.31 higher to 3.4 higher) | ‐ | 114 (5 RCTs) | ⊕⊕⊝⊝ Lowa | Evidence suggests that high vs low protein intake increases weight gain, but our confidence in the effect estimate is limited by risks of bias and heterogeneity |
| Linear growth (cm/week) | Mean growth parameters ‐ linear growth (cm/week) was 0 | MD 0.16 higher (0.02 lower to 0.34 higher) | ‐ | 48 (2 RCTs) | ⊕⊕⊝⊝ Lowb | Evidence suggests that high vs low protein intake probably leads to little or no difference in the rate of length gain, but our confidence in the effect estimate is limited by risks of bias and imprecision |
| Head circumference growth (cm/week) | Mean growth parameters ‐ head growth (cm/week) was 0 | MD 0.37 higher (0.16 higher to 0.58 higher) | ‐ | 18 (1 RCT) | ⊕⊝⊝⊝ Very lowc | Evidence is very uncertain about the effect of protein on head circumference growth, and it may have little to no effect on head circumference growth. but the evidence is very uncertain |
| IQ score and Bayley score at 18 months or later | This outcome was not measured | |||||
| Necrotizing enterocolitis | Study population | Not estimable | 46 (2 RCTs) | ⊕⊕⊝⊝ Lowd | High vs low protein intake may not increase necrotizing enterocolitis, but our confidence in the effect estimate is limited by risks of bias and the small sample size | |
| 0 per 1000 | 0 per 1000 (0 to 0) | |||||
| *The risk in the intervention group (and its 95% confidence interval) is based on the assumed risk in the comparison group and the relative effect of the intervention (and its 95% CI). CI: confidence interval; MD: mean difference; RCT: randomized controlled trial. | ||||||
aDowngraded two levels for risk of bias (selection, performance, detection, attrition) and moderate heterogeneity.
bDowngraded two levels for risk of bias (selection, performance, detection, attrition) and imprecision. Broad 95% CI; included both higher and lower length gain in estimate.
cDowngraded one level for risk of bias (selection, performance, detection, attrition) and two levels for serious imprecision (one RCT; N = 18).
dDowngraded two levels for risk of bias (selection, performance, detection, attrition) and imprecision.
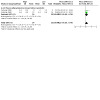
Summary of findings 2. Very high protein compared to low protein intake (restricted to studies meeting all a priori inclusion criteria) in formula‐fed low birth weight infants.
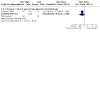
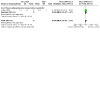
| Patient or population: formula‐fed low birth weight infants Setting: neonatal care facilities Intervention: VERY HIGH protein intake Comparison: LOW protein intake | ||||||
| Outcomes | Anticipated absolute effects* (95% CI) | Relative effect (95% CI) | №. of participants (studies) | Certainty of evidence (GRADE) | Comments | |
| Risk with low protein intake (restricted to studies meeting all a priori inclusion criteria) | Risk with high protein intake | |||||
| Weight gain | This outcome was not measured | |||||
| Linear growth | This outcome was not measured | |||||
| Head circumference growth | This outcome was not measured | |||||
| IQ score and Bayley score at 18 months or later | This outcome was not measured | |||||
| Necrotizing enterocolitis | This outcome was not measured | |||||
| *The risk in the intervention group (and its 95% confidence interval) is based on the assumed risk in the comparison group and the relative effect of the intervention (and its 95% CI). CI: confidence interval. | ||||||
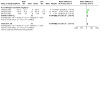
Summary of findings 3. Very high protein compared to high protein intake (restricted to studies meeting all a priori inclusion criteria) in formula‐fed low birth weight infants.
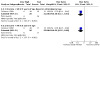
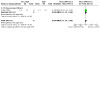
| Patient or population: formula‐fed low birth weight infants Setting: neonatal care facilities in England Intervention: VERY HIGH protein intake Comparison: HIGH protein intake | ||||||
| Outcomes | Anticipated absolute effects* (95% CI) | Relative effect (95% CI) | №. of participants (studies) | Certainty of evidence (GRADE) | Comments | |
| Risk with low protein intake (restricted to studies meeting all a priori inclusion criteria) | Risk with high protein intake | |||||
| Weight gain (g/d) to discharge | Mean growth parameters ‐ weight gain (g/d) was 0 | MD 3.10 higher (0.04 lower to 6.24 higher) | ‐ | 77 (1 RCT) | ⊕⊕⊝⊝ Moderatea | Evidence suggests that very high protein intake, compared to high protein intake, increases weight gain, but our confidence in the effect estimate is limited by imprecision |
| Linear growth (cm/week) | Mean growth parameters ‐ linear growth (cm/week) was 0 | MD 0.00 (0.14 lower to 0.14 higher) | ‐ | 77 (1 RCT) | ⊕⊕⊝⊝ Moderatea | Very high protein intake (compared to high protein intake) may have little or no effect on the rate of length gain, but our confidence in the effect estimate is limited by imprecision |
| Head circumference growth | This outcome was not measured | |||||
| IQ score and Bayley score at 18 months or later | This outcome was not measured | |||||
| Necrotizing enterocolitis | This outcome was not measured | |||||
| *The risk in the intervention group (and its 95% confidence interval) is based on the assumed risk in the comparison group and the relative effect of the intervention (and its 95% CI). CI: confidence interval; MD: mean difference; RCT: randomized controlled trial. | ||||||
aDowngraded one level for imprecision.
Background
Description of the condition
Good nutrition is essential for optimal growth and development of the preterm infant (AAP 2020). Protein is an important component of adequate nutrition, as it provides essential amino acids required for protein synthesis, which is necessary for growth. Hence, the quantity of protein consumed is an important consideration (AAP 2020). The protein requirement for preterm infants can be estimated in one of two ways: estimates based on the protein intake of breast‐fed infants or estimates based on theoretical calculations (the factorial approach). At three to four weeks postnatal age, a preterm infant fed own mother's milk receives approximately 1.4 g/100 mL (Gidrewicz 2014), or about 2.1 to 2.5 g/kg/d of protein. The factorial approach is a theory‐based calculation that sums the requirements for growth and those for replacement of inevitable losses in urine, feces, and skin (Fomon 1991). It is difficult to estimate requirements for protein intake in preterm infants because they may have a high rate of protein turnover and breakdown as a result of immaturity or illness (Hay 1996; Kalhan 2000; Pencharz 1981). Preterm infants have very rapid rates of growth and protein accretion. Based on the factorial approach with the "reference fetus," Ziegler and Fomon estimated the protein intake required for preterm infant growth and nitrogen accretion at 4 g/kg/d of enteral protein for infants with birth weight less than 1200 grams (Ziegler 1976; Ziegler 1981), and at 3.5 g/kg/d for infants with birth weight of 1200 to 1800 grams (AAP 2020). Formulas currently available for preterm infants in North America contain 3 g of protein per 100 kcal. If energy intakes are maintained at the recommended range (Klein 2002), formula‐fed infants would receive about 2.5 to 4 g/kg/d of protein. A disparity is evident between what is provided in own mother's milk versus estimated protein intake based on the factorial approach using the Ziegler‐Fomon reference, and what is contained in preterm formula.
Description of the intervention
Putative risks of higher protein intake include increased concentrations of amino acids, hydrogen ions, and urea as a result of immaturity of amino acid metabolic pathways in preterm infants (Senterre 1983). Preterm infants may not be able to handle higher protein intake efficiently; hence metabolic acidosis and higher plasma levels of amino acids such as tyrosine and phenylalanine concentrations may result (Micheli 1999). Theoretically, these metabolic changes could lead to mental retardation. Additionally, adaptive responses of endocrine and metabolic homeostasis resulting from early nutrition may lead to "metabolic programming," which alters long‐term outcomes of chronic diseases. Renal hypertrophy accompanied by a significant rise in kidney tissue and circulating insulin‐like growth factor‐1 has been reported secondary to high protein intake (Murray 1993). High protein intake in early life may increase risks later in life of obesity (Rolland‐Cachera 1995; Scaglioni 2000), as well as other pathology (Rolland‐Cachera 1995), such as diabetes mellitus (Raiha 2001). Therefore, long‐term consequences of early nutrition need to be considered.
How the intervention might work
Putative benefits of higher protein intake include adequacy of protein for growth of lean tissue, growth of bone and blood constituents, turnover of tissues, synthesis of hormones and enzymes, and maintenance of oncotic pressure (Fomon 1993). In an animal study, higher protein intake was shown to accelerate maturation of the renal tubules (Jakobsson 1990). Deficiency of protein in infants leads to growth failure and, when extreme, can result in edema and lower resistance to infection (Nayak 1989). Some very low birth weight infants have lower lean mass in childhood compared to infants born at term (Gianni 2015), which could be due to suboptimal protein intake in early life.
Why it is important to do this review
Sufficient energy and other nutrients are needed to allow protein to be used for anabolism (Kashyap 1994), rather than as a fuel source. When energy availability is limited, nitrogen balance and protein utilization for tissue synthesis are limited. When protein is used for energy, the amino groups are cleaved and are converted primarily to urea, which is excreted, while the carbon skeleton enters the citric acid cycle to be used as the energy source. When protein is used as an energy source, optimal protein synthesis cannot occur (Kashyap 1994). Consequently, protein intake needs to be evaluated in relation to energy intake for a direct comparison of alleged benefits and risks of higher protein intake.
Protein intake also needs to be evaluated in relation to intake of other nutrients, as differences in intake of other nutrients may influence infant growth rates (Castillo‐Duran 2003; Isojima 2015; Musoke 2001), and higher protein intakes may increase infant requirements for other nutrients, such as phosphate (Bonsante 2013). If studies provide variable amounts of protein and other nutrients at the same time, it is not possible to attribute study findings solely to the difference in protein intake. If formulas vary by more than 10% in any constituent other than protein, a direct comparison of outcomes may not be valid.
A related Cochrane Review concluded that protein supplementation of human milk in relatively well preterm infants offers certain short‐term benefits, including increases in weight gain, linear growth, and head growth (Amissah 2018). Although urea levels were higher among patients receiving protein supplementation, this was thought to reflect adequate rather than excessive dietary protein intake. Long‐term effects and adverse effects of protein supplementation of human milk could not be evaluated in this previous systematic review because of an absence of relevant data (Amissah 2018). The balance between supposed benefits and risks of higher protein intake for formula‐fed low birth weight infants weighing < 2.5 kilograms remains unclear.
Objectives
To determine whether higher (≥ 3.0 g/kg/d) versus lower (< 3.0 g/kg/d) protein intake during the initial hospital stay of formula‐fed preterm infants or low birth weight infants (< 2.5 kilograms) results in improved growth and neurodevelopmental outcomes without evidence of short‐ or long‐term morbidity.
Specific objectives were to examine the following comparisons of interventions and to conduct subgroup analyses if possible.
Low protein intake if the amount was less than 3.0 g/kg/d.
High protein intake if the amount was equal to or greater than 3.0 g/kg/d but less than 4.0 g/kg/d.
Very high protein intake if the amount was equal to or greater than 4.0 g/kg/d.
Methods
Criteria for considering studies for this review
Types of studies
We included randomized controlled trials and excluded quasi‐randomized trials.
Types of participants
We included infants who weighed less than 2.5 kilograms at birth, whether appropriate‐ or small‐for‐gestational‐age (AGA or SGA), who were studied during their initial hospital stay. They were exclusively fed formula and did not receive parenteral nutrition during the study.
Types of interventions
The interventions comprised different levels of protein intake during the initial hospital stay, which were categorized as follows: low protein intake if the amount was less than 3.0 g/kg/d, high protein intake if the amount was equal to or greater than 3.0 g/kg/d but less than 4.0 g/kg/d, and very high protein intake if the amount was equal to or greater than 4.0 g/kg/d. Contrasting levels of protein intake were compared over different periods of time.
Types of outcome measures
We used the criteria and standard methods of Cochrane and Cochrane Neonatal (see the Cochrane Neonatal search strategy for specialized register).
Primary outcomes
Growth parameters, including weight gain (g/kg/d or g/d), linear growth (cm/week), and head growth (cm/week), expressed in absolute terms or relative to intrauterine references or growth charts
Intelligence quotient (IQ) scores and Bayley score at 18 months and/or later
Necrotizing enterocolitis (Bell’s stage II or greater)
Secondary outcomes
Nitrogen utilization as reflected by blood urea (mmol/L)
Nitrogen accretion, expressed in absolute terms such as g/kg/d or relative to fetal accretion rate
Abnormal phenylalanine levels
Decreased gastric motility (number of episodes of abdominal distention experienced per day)
Days to full feedings (days from initiation of feedings to achievement of 120 mL/kg/d)
Feeding intolerance (number of feeding interruptions related to feeding intolerance experienced per day)
Metabolic acidosis (pH, base excess)
Serum albumin (g/L)
Sepsis (number of babies who developed confirmed sepsis‐positive blood culture and the organism[s] identified)
Diarrhea (number of babies who developed episodes of stools considered to have abnormal water loss)
Search methods for identification of studies
Electronic searches
We conducted a comprehensive search that included the Cochrane Central Register of Controlled Trials (CENTRAL; 2019, Issue 8), in the Cochrane Library (August 2, 2019); OVID MEDLINE and Epub Ahead of Print, In‐Process & Other Non‐Indexed Citations, Daily and Versions(R) (January 1, 2013, to August 2, 2019); MEDLINE via PubMed (July 1, 2018, to August 2, 2019) for the previous year; and the Cumulative Index to Nursing and Allied Health Literature (CINAHL; January 1, 2013, to August 2, 2019). See Appendix 1 for full search details. We did not apply language restrictions.
We searched clinical trial registries for ongoing and recently completed trials (ISRCTN Registry). We searched the World Health Organization International Clinical Trials Registry Platform (ICTRP) (www.who.int/ictrp/search/en/), as well as the US National Library of Medicine ClinicalTrials.gov (clinicaltrials.gov), via Cochrane CENTRAL.
This updates the searches that were completed for previous versions of this review (Appendix 2; Fenton 2014).
Searching other resources
We also searched the reference lists of any articles selected for inclusion in this review to identify additional relevant articles.
Data collection and analysis
We used standard methodological procedures expected by Cochrane. We used the GRADE approach to assess the certainty of evidence.
Selection of studies
All articles retrieved from the complete search were assessed for relevance independently by two review authors (HA, TRF). We considered RCTs testing contrasting levels of formula protein intake during initial hospital stay if they met the following criteria for relevance.
Study participants weighed less than 2.5 kilograms at birth.
Study participants were not receiving parenteral nutrition at the time of randomization.
Study participants were exclusively formula‐fed.
Energy, Na, K, P, Zn, and essential fatty acid intakes did not differ significantly (by no more than 10% relative concentration).
Given the small number of trials that met all of these criteria, and some larger and important studies that met the first three but not the last criterion, the review authors decided to include these studies in a post‐facto analysis of the primary outcomes to provide readers with a more comprehensive and clinically relevant systematic review.
If all of the protein intake groups within a study fell inside one of the predesignated protein intake criteria, we excluded this study.
Data extraction and management
Two review authors (HA, TRF) independently extracted data. We resolved differences by discussion and on the basis of consensus of three review authors. We made efforts to contact investigators for data, additional information, and/or clarification regarding 6 studies (Bhatia 1991; Embleton 2005; Hillman 1994; Kashyap 1986; Svenningsen 1982a; Wauben 1995).
Assessment of risk of bias in included studies
Two review authors (HA, TRF) independently assessed the risk of bias (low, high, or unclear) of all included trials using the Cochrane "Risk of bias" tool for the following domains (Higgins 2011).
Sequence generation (selection bias).
Allocation concealment (selection bias).
Blinding of participants and personnel (performance bias).
Blinding of outcome assessment (detection bias).
Incomplete outcome data (attrition bias).
Selective reporting (reporting bias).
Any other bias.
We resolved any disagreements by discussion, or by consultation with a third assessor. See Appendix 3 for a more detailed description of risk of bias for each domain.
Measures of treatment effect
We performed statistical analyses using Review Manager 5 software (Review Manager 2014). We analyzed categorical data using risk ratio (RR), risk difference (RD), and the number needed to treat for an additional beneficial outcome (NNTB). We analyzed continuous data using mean difference (MD) and standardized mean difference (SMD). We reported the 95% confidence interval (CI) for all estimates. We used a standardized statistical method to handle three‐arm trials in which two groups fell within one predesignated protein intake group (Rosner 2000).
Unit of analysis issues
The unit of analysis was the participating infant in individually randomized trials, and an infant was considered only once in the analysis.
Dealing with missing data
When feasible, we carried out analyses on an intention‐to‐treat basis for all outcomes. We requested missing data by contacting the original investigators. We will address the potential impact of missing data on the findings of the review in the Discussion section.
Assessment of heterogeneity
A statistical test for heterogeneity (I² test) included in the graphical output of Cochrane Reviews was used to assess variability in treatment effects evaluated by different trials.
We estimated the treatment effects of individual trials and examined heterogeneity among trials by inspecting the forest plots and quantifying the impact of heterogeneity using the I² statistic. We graded the degree of heterogeneity as follows: less than 25% no heterogeneity; 25% to 49% low heterogeneity; 50% to 75% moderate heterogeneity; more than 75% substantial heterogeneity. When we noted statistical heterogeneity (I² > 50%), we explored the possible causes (e.g. differences in study quality, participants, intervention regimens, or outcome assessments).
Assessment of reporting biases
We conducted a comprehensive search for eligible studies and were alert for duplication of data. Because we did not identify 10 or more trials for meta‐analysis, we did not assess for possible publication bias by inspecting a funnel plot.
Data synthesis
Because we identified multiple studies that we considered to be sufficiently similar, we performed meta‐analysis using Review Manager 5 (Review Manager 2014). For categorical outcomes, we calculated the typical estimates of RR and RD, each with its 95% CI; for continuous outcomes, we calculated the MD or the SMD, each with its 95% CI. We used a fixed‐effect model to combine data when it was reasonable to assume that studies were estimating the same underlying treatment effect. When meta‐analysis was inappropriate, we analyzed and interpreted individual trials separately. When we found evidence of clinical heterogeneity, we tried to explain this based on the different study characteristics and subgroup analyses.
Certainty of evidence
We used the GRADE approach, as outlined in the GRADE Handbook (Schünemann 2013), to assess the certainty of evidence of the following (clinically relevant) outcomes: weight gain (g/kg/d); linear growth (cm/week); head circumference growth (cm/week); IQ scores and Bayley score at 18 months or later; and necrotizing enterocolitis.
Two review authors (HA, TRF) independently assessed the certainty of evidence for each of the outcomes above. We considered evidence from RCTs as high certainty but downgraded the evidence one level for serious (or two levels for very serious) limitations based upon the following: design (risk of bias), consistency across studies, directness of evidence, precision of estimates, and presence of publication bias. We used the GRADEpro GDT Guideline Development Tool to create three "Summary of findings" tables to report the certainty of evidence.
The GRADE approach results in an assessment of the certainty of a body of evidence according to one of four grades.
High certainty: further research is very unlikely to change our confidence in the estimate of effect.
Moderate certainty: further research is likely to have an important impact on our confidence in the estimate of effect and may change the estimate.
Low certainty: further research is very likely to have an important impact on our confidence in the estimate of effect and is likely to change the estimate.
Very low certainty: we are very uncertain about the estimate.
Subgroup analysis and investigation of heterogeneity
If the reviewed studies combined alterations of protein and energy, we planned to carry out subgroup analyses for the planned categories of protein intake according to the following predefined energy intake categories.
Low energy intake: less than 105 kcal/kg/d.
Medium energy intake: greater than or equal to 105 kcal/kg/d and less than or equal to 135 kcal/kg/d.
High energy intake: greater than 135 kcal/kg/d.
As the Ziegler‐Fomon reference fetus estimates different protein requirements for infants based on birth weight, we planned to undertake subgroup analyses for the following birth weight categories.
< 800 grams.
800 to 1199 grams.
1200 to 1799 grams.
1800 to 2499 grams.
Post‐facto analysis
We conducted a post‐facto analysis to examine the results from studies in which formulas fed to low birth weight infants differed in one or more other nutrients by more than 10%. These studies had been excluded from the primary analysis of this systematic review based on the a priori defined selection criteria for relevance because differences in outcome cannot be solely attributed to differences in protein.
Sensitivity analysis
When we identified substantial heterogeneity, we conducted sensitivity analysis to determine if the findings are affected by inclusion of only those trials considered to have used adequate methods with low risk of bias (selection and performance bias). We reported results of sensitivity analyses for primary outcomes only.
Results
Description of studies
Results of the search
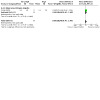
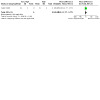
The original literature searches identified 49 studies, of which 13 were non‐randomized controlled studies (Fenton 2014). We did not identify additional studies for inclusion in the 2020 update of the review. We located one abstract; however, we did not include this study because both protein intakes fell within the same predesignated criterion of low protein intake (3.0 and 3.6 g/kg/d) (Cooke 2014). For a full description of our selection process, please see our "Study flow diagram" (Figure 1).
1.
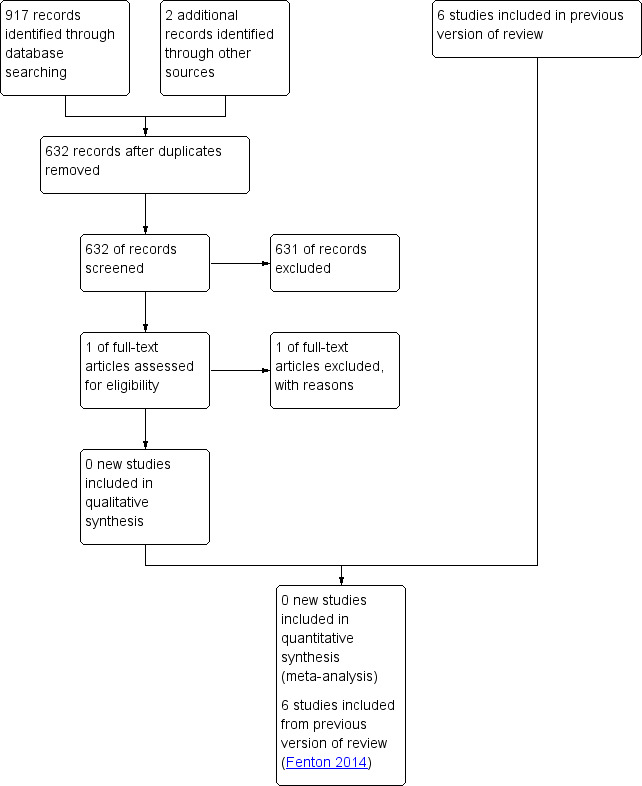
Study flow diagram, showing results of update search August 2, 2019.
We scrutinized a total of 34 randomized studies for criteria of relevance, of which 24 studies were excluded for the following reasons.
In eight studies, the protein intake groups fell inside one of the predesignated protein intake criteria.
In nine studies, the intervention being examined was different from that proposed in this systematic review (e.g. studies examining quality of protein).
In three studies, infants received parenteral nutrition during the study period.
Three studies reported no or incomplete numerical data.
In one study, the experimental protocol was modified during the study period.
Included studies
Studies meeting all a priori inclusion criteria
We identified six eligible trials (Bhatia 1991; Embleton 2005; Hillman 1994; Kashyap 1986; Svenningsen 1982a; Wauben 1995), which enrolled a total of 218 low birth weight infants and met all inclusion criteria for the primary analysis of formulas that did not differ in nutrients other than protein. Details of studies that met the inclusion criteria are presented in the Characteristics of included studies table.
Bhatia 1991 randomly assigned 23 AGA and SGA infants of birth weight less than 1550 grams to one of three formulas that were identical in composition, except for the protein content. Three infants were withdrawn from the study. Infants were given study formula when they were tolerating 60 kcal/kg/d of a standard preterm infant formula. The study formulas were continued for two weeks after intake reached 100 kcal/kg/d. Growth, biochemical parameters, necrotizing enterocolitis, and neonatal behavior were assessed. Data for two groups in the high protein category were combined in this review.
Embleton 2005 randomly assigned 77 AGA and SGA infants of gestational age less than 35 weeks and birth weight less than 1750 grams in two strata (< 1250 grams, 1250 to 1750 grams) to one of three study formulas. The study began when infants were tolerating ≥ 150 mL/kg/d of enteral intake for ≥ 48 hours and current weight was ≥ 1000 grams. Infants received the study formulas until term plus 12 weeks corrected age. Data for two groups in the high protein category were combined in this review, providing average intakes of 4.1 versus 3.6 g/kg/day protein intake. Growth, body composition, and biochemical parameters were assessed. Very high protein intake did not increase weight gain at discharge, at term, or at 12 weeks corrected age.
Hillman 1994 randomly assigned 27 infants weighing less than 1500 grams at birth in three weight group strata (< 1000 grams, 1000 to 1250 grams, 1250 to 1500 grams) to one of three study formulas before feedings were initiated in the first week of life. All infants completed two‐week and four‐week assessments of growth, biochemical parameters, and bone mineral content; however, 14 of the 27 infants were discharged before the six‐week assessment was performed. Data for two groups in the high protein category were combined in this review.
Kashyap 1986 randomly assigned 34 AGA and SGA low birth weight infants weighing 900 to 1750 grams at birth to receive one of three formulas. One group of nine infants received increased energy intake, so they were not included in this review. Growth, biochemical parameters, necrotizing enterocolitis, diarrhea, and nutrient balance were assessed. Data on energy expenditure and energy balance were collected for a subset of infants in this study and were published in Schulze 1987.
Svenningsen 1982a randomly allocated 48 AGA and SGA very low birth weight and preterm infants in the third week of life to one of three groups. One group received human milk and was not eligible for this review. The other two groups received formulas with or without the addition of a commercial product "protinpur" to produce high or low protein intake. Svenningsen 1982b reported long‐term follow‐up growth parameters and neurodevelopmental outcomes up to two years of age.
Wauben 1995 randomly allocated 16 healthy AGA preterm infants between 28 and 35 weeks gestational age to two formulas with differing protein content and conducted a modified three‐day protein and energy balance study. The study began once infants were receiving full enteral feedings of 160 mL/kg/d.
Studies comparing formulas with differences in other nutrients
Four studies (Cooke 2006; Goldman 1969; Kashyap 1988; Raiha 1976), which enrolled a total of 451 low birth weight infants fed formulas that differed in one or more other nutrients by more than 10%, were included in a post‐facto analysis for the primary outcomes. Details of studies included for the post‐facto analysis are presented in the Characteristics of included studies table.
In Cooke 2006, 18 preterm infants of birth weight ≤ 1500 grams and gestational age ≤ 32 weeks received both standard (3.0 g/100 kcal) and high protein (3.6 g/100 kcal) formulas over two one‐week comparison periods with the sequence of formula feeding randomly determined in a balanced cross‐over design. The higher protein formula had a 20% higher percentage of medium‐chain triglycerides (MCTs), 16% more sodium, 13% more potassium, 12% more chloride, 19% less copper, and 13% more magnesium compared with the standard protein formula. Anthropometry was performed at the beginning and at the end of each study period. Nutrient balance and plasma amino acids were determined at the end of each week.
Goldman 1969 randomly assigned 304 AGA and SGA infants of birth weight less than 2000 grams in three birthweight strata (< 1000 grams, 1000 to 1499 grams, and 1500 to 2000 grams) to two study formulas. Infants > 1000 grams were further stratified based on gender, and twins were assigned separately. Infants were followed from the first few days of life until 2200 grams was achieved. The study compared high (3.0 to 3.6 g/kg/d) versus very high (6.0 to 7.2 g/kg/d) protein intake. The higher protein formula had a 17% higher concentration of minerals. Growth and biochemical and neurological parameters were assessed. Two separate papers on the same study reported neurodevelopmental outcomes at three years and at five to seven years of age (Goldman 1971; Goldman 1974).
Kashyap 1988 randomly assigned 50 AGA and SGA low birth weight infants weighing 900 to 1750 grams at birth to receive one of three formulas until study end when the infants reached 2200 grams. One group of 15 infants who received increased energy intake was not included in this review. Formula in the high protein groups had 14% more potassium, 15% more calcium, and 20% more magnesium compared with formula in the low protein groups. Growth, biochemical parameters, necrotizing enterocolitis, and nutrient balance were assessed before study end when the infants reached 2200 grams.
Raiha 1976 randomly assigned 106 AGA infants of birth weight ≤ 2100 grams to one of four isocaloric formulas that varied in both quantity (2.25 and 4.5 g/kg/d) and type (whey:casein ratios) of protein in the first week of life. Infants were grouped into three categories: 28 to 30 weeks, 31 to 33 weeks, and 34 to 36 weeks. Potassium varied by 17%, calcium by 15%, and phosphorus by 12% in relative concentration in the whey predominant formulas between low and very high protein groups. Sodium varied by 28% and magnesium by 12% in relative concentration in the casein predominant formulas. Study formulas were provided until hospital discharge. Three separate published papers on this study have reported different outcomes (Gaull 1977; Rassin 1977a; Rassin 1977b).
Excluded studies
We excluded 24 studies. Details of reasons for exclusion are listed in the Characteristics of excluded studies table.
Risk of bias in included studies
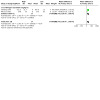
Quality assessments are detailed in the Characteristics of included studies table and are summarized in Figure 2 and Figure 3.
2.
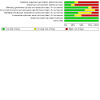
Risk of bias graph: review authors' judgements about each risk of bias item presented as percentages across all included studies.
3.
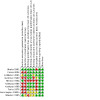
Risk of bias summary: review authors' judgements about each risk of bias item for each included study.
Allocation
Infants were allocated to assigned treatment by randomization in all studies included in this updated review. Only two studies reported adequate concealment of allocation and blinding of randomization (Bhatia 1991; Embleton 2005).
Blinding
Seven studies reported that the intervention was blinded to caregivers, investigator(s), or both (Bhatia 1991; Cooke 2006; Embleton 2005; Goldman 1969; Kashyap 1986; Kashyap 1988; Raiha 1976). Six studies reported blinding of outcomes (Bhatia 1991; Cooke 2006; Embleton 2005; Kashyap 1986; Kashyap 1988; Raiha 1976).
Incomplete outcome data
Only one study reported a loss of more than 20% of study participants to attrition (Kashyap 1986), and six studies had smaller losses to follow‐up (Bhatia 1991; Embleton 2005; Goldman 1969; Hillman 1994; Kashyap 1988; Raiha 1976). Two studies reported no attrition (Cooke 2006; Wauben 1995), and one study was unclear about attrition (Svenningsen 1982a).
Selective reporting
Selective outcome reporting was not observed in any of the included studies.
Other potential sources of bias
We did not identify any other potential sources of bias in the reports. Only two studies reported an intention‐to‐treat analysis (Cooke 2006; Wauben 1995).
Effects of interventions
See: Table 1; Table 2; Table 3
Comparison 1. High versus low protein intake (restricted to studies meeting all a priori inclusion criteria)
See Table 1.
Primary outcomes
Growth parameters (Outcome 1.1)
Weight gain (g/kg/d) (Outcome 1.1.1)
Two studies found no significant differences in weight gain between groups (Bhatia 1991; Svenningsen 1982a). However, three studies found that infants receiving high protein intake had significantly greater weight gain (Hillman 1994; Kashyap 1986; Wauben 1995). The overall analysis revealed a significant difference in weight gain (mean difference [MD] 2.36 g/kg/d, 95% confidence interval [CI] 1.31 to 3.40) in favor of the high protein group (low certainty). The evidence suggests that high versus low protein intake increases weight gain, but our confidence in the effect estimate is limited by risks of bias and heterogeneity.
Linear growth (cm/week) (Outcome 1.1.2)
Kashyap 1986 found that infants receiving high protein intake had significantly greater linear growth, and Svenningsen 1982a observed no significant differences between groups. The overall analysis did not reveal a significant difference (MD 0.16 cm/week, 95% CI ‐0.02 to 0.34) (low certainty). The evidence suggests that high versus low protein intake probably leads to little or no difference in the rate of length gain, but our confidence in the effect estimate is limited by risks of bias and imprecision.
Head growth (cm/week) (Outcome 1.1.3)
Kashyap 1986 found that infants receiving high protein intake had significantly greater head growth. Three studies reported no significant differences in head growth (Bhatia 1991, Hillman 1994; Svenningsen 1982a). However, data were missing, so these three studies were not included in the meta‐analysis. The evidence is very uncertain about the effect of protein on head circumference growth, and it may have little to no effect on head circumference growth, but the evidence is very uncertain (very low certainty).
IQ score and Bayley score at 18 months and/or later
No study primarily addressed these outcomes; however, two studies reported neurodevelopmental outcomes for infants enrolled in their studies (Bhatia 1991; Svenningsen 1982a).
Bhatia 1991 assessed behavior in a subset of 15 infants within five days of completing the feeding study. Infants were approximately 36 to 37 weeks at the time of testing. A certified child psychologist, blinded to the feeding history of the infants, administered the Neonatal Behavior Assessment Scale. Infants receiving formula with higher protein intake performed significantly better on the orientation (P = 0.0003), habituation (P = 0.003), and autonomic stability (P = 0.01) clusters of the Neonatal Behavior Assessment Scale. No differences between groups were noted in the remaining behavioral clusters of motor (P = 0.7), range of state (P = 0.5), and regulation of state (P = 0.29).
Svenningsen 1982a reported no significant differences in neurodevelopmental outcomes up to two years of age. Investigators assessed developmental performance indicators such as sitting, standing, walking, and talking at five to six, 10 to 11, 14 to 18, and 24 months of age for 46 of the 48 infants enrolled in the study. At 10 to 14 months, an audiometric test was also performed. The instruments used for these assessments were not identified.
Necrotizing enterocolitis
Necrotizing enterocolitis (Bell's stage II or greater) (Outcome 1.2.1)
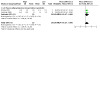
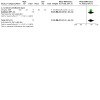
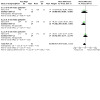
Two studies reported no incidence of necrotizing enterocolitis in high or low protein intake groups (Svenningsen 1982a; Wauben 1995). However, it is uncertain what criteria were used to define necrotizing enterocolitis in these studies. For the purpose of this systematic review, necrotizing enterocolitis was defined as Bell's stage II or greater. The overall analysis showed no significant effect of protein intake on necrotizing enterocolitis (typical risk difference [RD] 0.00, 95% CI ‐0.12 to 0.12) (very low certainty) (Analysis 1.2). High versus low protein intake may not increase necrotizing enterocolitis, but our confidence in the effect estimate is limited by risks of bias and by the small sample size.
1.2. Analysis.
Comparison 1: High versus low protein intake (restricted to studies meeting all a priori inclusion criteria), Outcome 2: Necrotizing enterocolitis
Secondary outcomes
Decreased gastric motility (number of episodes of abdominal distention)
No study addressed this outcome.
Days to full feedings (from initiation of feedings to achievement of 120 mL/kg/d)
Kashyap 1986 defined full intake as 180 mL/kg/d, which was maintained throughout the study. No significant differences between groups were noted with respect to the age at which feedings were started and the age at which full feeding was attained. None of the other studies provided information on when full feedings were achieved.
Feeding intolerance (number of episodes per day)
No study addressed this outcome.
Nitrogen utilization
Blood urea nitrogen (mg/dL) (Outcome 1.3.1)
Three studies report higher blood urea nitrogen levels among infants receiving high protein intake (Bhatia 1991; Kashyap 1986; Svenningsen 1982a).
Svenningsen 1982a did not find a significant difference in blood urea nitrogen at the third and fifth weeks of life, although at seven weeks, levels were significantly higher among infants receiving higher protein intake (third week P = 0.85, fifth week P = 0.375, and seventh week P = 0.0005). Blood urea nitrogen levels were measured by Svenningsen 1982a at different time points than in the other studies, so this study was not included in the meta‐analysis.
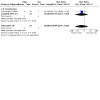
When data from the two studies that measured blood urea nitrogen at the two‐week point were combined (Bhatia 1991; Kashyap 1986), significantly higher levels were noted in infants in the high protein intake group (weighted mean difference [WMD] 1.92 mg/dL, 95% CI 1.00 to 2.84) compared with the low protein intake group (Analysis 1.3).
1.3. Analysis.
Comparison 1: High versus low protein intake (restricted to studies meeting all a priori inclusion criteria), Outcome 3: Nitrogen utilization
Nitrogen balance
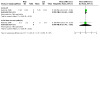
Nitrogen accretion (mg/kg/d) (Outcome 1.4.1)
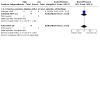
Two studies reported statistically significantly higher protein accretion in the high protein formula groups (Kashyap 1986; Wauben 1995). The meta‐analysis revealed significantly higher nitrogen accretion (MD 143.7 mg/kg/d, 95% CI 128.7 to 158.8) in infants receiving formula with high protein content compared with infants given low protein formula (Analysis 1.4). Of note, significant heterogeneity of treatment effect was evident; consequently, these data should be interpreted prudently.
1.4. Analysis.
Comparison 1: High versus low protein intake (restricted to studies meeting all a priori inclusion criteria), Outcome 4: Nitrogen balance
Phenylalanine levels
Plasma phenylalanine concentration (μmol/dL) (Outcome 1.5.1)
Bhatia 1991 and Kashyap 1986 tested phenylalanine levels and found no significant differences between low and high protein formula groups (Analysis 1.5).
1.5. Analysis.
Comparison 1: High versus low protein intake (restricted to studies meeting all a priori inclusion criteria), Outcome 5: Phenylalanine levels
Bhatia 1991 measured phenylalanine concentrations at the end of the two‐week study period. Kashyap 1986 monitored plasma amino acid concentrations before feedings were started, then weekly once the target intake was achieved. Different approaches were used to report data, so a meta‐analysis could not be undertaken.
Metabolic acidosis (pH, base excess) (Outcome 1.6)
Kashyap 1986 reported blood acid‐base status and found pH and base excess to be within normal limits for all infants enrolled in the study regardless of group assignment (Analysis 1.6).
1.6. Analysis.
Comparison 1: High versus low protein intake (restricted to studies meeting all a priori inclusion criteria), Outcome 6: Metabolic acidosis (pH, base excess)
Serum albumin (g/L) (Outcome 1.7)
Kashyap 1986 reported albumin as approximately 3 g/dL, and Hillman 1994 and Svenningsen 1982a reported albumin as 3 mg/dL and 30 g/mL, respectively (Analysis 1.7).
1.7. Analysis.
Comparison 1: High versus low protein intake (restricted to studies meeting all a priori inclusion criteria), Outcome 7: Serum albumin (g/L)
We attempted to clarify the units with the latter two study authors without success. Hillman 1994 measured albumin values at four and six weeks of age. Svenningsen 1982a measured albumin levels at approximately zero, two, and four weeks of the study. The values reported for each time period were not significantly different between low and high protein formula groups.
Kashyap 1986 reported prealbumin (mg/dL) (i.e. transthyretin) levels and found a significant difference between low and high protein formula groups, favoring the high protein formula group. A meta‐analysis could not be undertaken, given the discrepancy in the units used to report findings and the differences in time frames used to measure serum albumin.
Sepsis: incidence, number of episodes (Outcome 1.8)
Although Svenningsen 1982a reported no differences in rates of septicemia between groups, supporting data were not provided. Additionally, it is uncertain what constituted septicemia (e.g. positive blood culture, positive cerebrospinal fluid). Hillman 1994 indicated that five of the 27 infants enrolled in this study failed to complete at least four weeks of the study because the infants became unwell (e.g. sepsis), or because the infants were transferred to another hospital. The exact number of infants who developed infection was not specified (Analysis 1.8).
1.8. Analysis.
Comparison 1: High versus low protein intake (restricted to studies meeting all a priori inclusion criteria), Outcome 8: Sepsis
Diarrhea (number of episodes per day per baby) (Outcome 1.9)
Kashyap 1986 addressed the outcome of diarrhea using a categorical rather than a continuous level of measurement. Kashyap 1986 indicated that of seven infants withdrawn from the study (n = 34 infants), one developed diarrhea. This infant belonged in the group that differed in energy intake rather than protein intake and therefore was not included in this review (Analysis 1.9).
1.9. Analysis.
Comparison 1: High versus low protein intake (restricted to studies meeting all a priori inclusion criteria), Outcome 9: Diarrhea
Subgroup analyses
Stratification based on energy intake
No study addressed this outcome.
Distinction in birth weight categories
Although Hillman 1994 assigned infants enrolled in this study within three overlapping weight group strata (< 1000 grams, 1000 to 1250 grams, and 1250 to 1500 grams), data were not presented for each weight category but rather were based on protein group assignment. No other study reported data for birth weight categories. Consequently, subgroup analyses for birth weight categories were not undertaken.
Comparison 2. Very high versus low protein intake (restricted to studies meeting all a priori inclusion criteria)
No study addressed this outcome (Table 2).
Comparison 3. Very high versus high protein intake (restricted to studies meeting all a priori inclusion criteria)
See Table 3.
Primary outcomes
Growth parameters at discharge (Outcome 3.1)
Weight gain (g/d) (Outcome 3.1.1)
Embleton 2005 found that infants receiving very high protein intake compared with high protein intake showed no significant differences between groups in weight gain (g/d) to discharge (P = 0.053) (moderate certainty). The evidence suggests that very high protein intake, compared to high protein intake, increases weight gain, but our confidence in the effect estimate is limited by imprecision. This study of very high protein intake in the primary analysis provided average intakes of 4.1 versus 3.6 g/kg/day protein intake.
Linear growth (cm/week) (Outcome 3.1.2)
Embleton 2005 reported greater length gain from study enrollment to discharge; the confidence interval included both a possible difference and no important difference of 0.10 (95% CI 0.00 to 0.20) (P = 0.044) (moderate certainty). Very high protein intake (compared to high protein intake) may have little or no effect on the rate of length gain, but our confidence in the effect estimate is limited by imprecision.
Head growth (cm/week)
No study addressed this outcome.
Growth parameters at term (Outcome 3.2)
Weight gain (g/d) (Outcome 3.2.1)
Embleton 2005 detected no differences in weight gain between infants receiving very high protein intake and those with high protein intake from study enrollment until term (P = 0.2).
Linear growth (cm/week) (Outcome 3.2.2)
Embleton 2005 found no differences in length growth from study enrollment until term (P = 1.0).
Head growth (cm/week)
No study addressed this outcome.
Growth parameters at 12 weeks corrected age (Outcome 3.3)
Weight gain (g/d) (Outcome 3.3.1)
Embleton 2005 observed no significant differences in weight gain between groups receiving study formula between the time of discharge and term plus 12 weeks corrected age (P = 0.88).
Linear growth (cm/week) (Outcome 3.3.2)
Embleton 2005 found no significant differences in linear growth between groups receiving study formula between the time of discharge and term plus 12 weeks corrected age.
Head growth (cm/week)
No study addressed this outcome.
IQ score and Bayley score at 18 months and/or later
No study addressed this outcome.
Nectrotizing enterocolitis (Bell's stage II or greater)
No study addressed this outcome.
Secondary outcomes
Nitrogen utilization
Blood urea nitrogen (mM)
Embleton 2005 tested serum for urea nitrogen levels (mM) and found that three of the 24 infants receiving very high protein intake developed uremia, defined as serum urea nitrogen level greater than 6 mM. Increase in serum urea nitrogen levels was associated with the level of protein intake; levels normalized without intervention within two to three days in two infants, and within 10 days in another infant. As data were not reported, it was not feasible to determine whether group differences were significant when groups with high protein intake were combined.
Nitrogen balance
Nitrogen accretion (mg/kg/d)
No study addressed this outcome.
Phenylalanine levels
Plasma phenylalanine concentration (μmol/dL)
No study addressed this outcome.
Decreased gastric motility (number of episodes of abdominal distention)
No study addressed this outcome.
Days to full feedings (from initiation of feedings to achievement of 120 mL/kg/d)
Embleton 2005 did not define full feedings. No significant differences between the three groups were noted with respect to the age at which feedings were started nor the age at which full feeding was attained. As data were skewed, median and range were reported; it was not feasible to combine data for the groups representing high protein intake nor to compare them with data for the groups representing very high protein intake.
Feeding intolerance (number of episodes per day)
No study addressed this outcome.
Metabolic acidosis (pH, base excess)
Embleton 2005 reported acid‐base status within normal limits for infants in the very high protein intake group who developed uremia (i.e. serum blood urea nitrogen levels > 6 mM).
Serum albumin (g/L)
Embleton 2005 reported no significant differences in total albumin among infants in the three groups. As data were not reported, it is not feasible to combine data for the groups representing high protein intake nor to compare them with data for the groups representing very high protein intake.
Sepsis: incidence, number of episodes
No study addressed this outcome.
Diarrhea (number of episodes per day per baby)
No study addressed this outcome.
Subgroup analysis
Stratification based on energy intake
No study addressed this outcome.
Distinction in birth weight categories
Although Embleton 2005 stratified infants enrolled in this study into two birth weight categories (< 1250 grams and 1250 to 1750 grams), data were not presented for each weight category but rather were based on protein group assignment. Consequently, subgroup analyses for birth weight categories were not undertaken.
Post‐facto analysis
Comparison 4. High versus low protein intake (adding studies comparing formulas with differences in other nutrients)
Primary outcomes
Growth parameters (Outcome 4.1)
Weight gain (g/kg/d) (Outcome 4.1.1)
Kashyap 1988 found weight gain to be significantly lower in the low protein intake formula group. Inclusion of this study in the overall analysis revealed improvement in weight gain (MD 2.53 g/kg/d, 95% CI 1.62 to 3.45) beyond that revealed in the a priori analysis among infants receiving formula with high protein content (Analysis 4.1).
4.1. Analysis.
Comparison 4: High versus low protein intake (adding studies comparing formulas with differences in other nutrients), Outcome 1: Growth parameters
Linear growth (cm/week) (Outcome 4.1.2)
Two studies found no significant differences in linear growth between groups (Kashyap 1988; Svenningsen 1982a). These findings differed from those of Kashyap 1986, which noted a significant increase in linear growth among infants receiving higher protein intake. Inclusion of the Kashyap 1988 study in the meta‐analysis revealed a significant difference (MD 0.16 cm/week, 95% 0.03 to 0.30) and greater linear growth with high protein intake compared with low protein intake (Analysis 4.1).
Head growth (cm/week) (Outcome 4.1.3)
Kashyap 1988 found that infants receiving high protein intake had significantly greater head growth (P = 0.027). With inclusion of this study, a meta‐analysis revealed significantly greater head growth among those in the high protein intake group (MD 0.23 cm/week, 95% CI 0.12 to 0.35) compared with those in the low protein intake group (Analysis 4.1).
IQ score and Bayley score at 18 months and/or later
No study addressed this outcome.
Nectrotizing enterocolitis (Bell's stage II or greater)
No study addressed this outcome.
Secondary outcomes
Nitrogen utilization (Outcome 4.2)
Blood urea nitrogen (mg/dL) (Outcome 4.2.1)
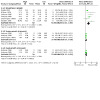
Kashyap 1988 found significantly higher blood urea nitrogen levels with increased protein intake. These findings are consistent with those of Bhatia 1991 and Svenningsen 1982a. Kashyap 1986 reported low levels of blood urea nitrogen in all groups, but levels were significantly lower in the low protein group. As both Kashyap 1986 and Kashyap 1988 reported results that were measured weekly, a meta‐analysis was possible for both of these studies. A significant increase in blood urea nitrogen levels was evident in the high protein intake group (MD 3.22 mg/dL, 95% CI 2.48 to 3.96). Of note, significant heterogeneity of treatment effect was evident; consequently, the data should be interpreted with caution (Analysis 4.2).
4.2. Analysis.
Comparison 4: High versus low protein intake (adding studies comparing formulas with differences in other nutrients), Outcome 2: Nitrogen utilization
Nitrogen balance (Outcome 4.3)
Nitrogen accretion (mg/kg/d) (Outcome 4.3.1)
Kashyap 1988 found that protein intake exerted a positive effect on nitrogen retention. These findings are consistent with those of Kashyap 1986 and Wauben 1995. With inclusion of this study, the meta‐analysis continued to show significantly higher nitrogen accretion (MD 112.6 mg/kg/d, 95% CI 101.4 to 123.8) in infants receiving formula with higher protein content (Analysis 4.3). Significant heterogeneity of treatment effect was evident; consequently, the data should be interpreted with caution.
4.3. Analysis.
Comparison 4: High versus low protein intake (adding studies comparing formulas with differences in other nutrients), Outcome 3: Nitrogen balance
Phenylalanine levels (Outcome 4.4)
Plasma phenylalanine concentration (μmol/dL) (Outcome 4.4.1)
Kashyap 1988 found no significant difference in concentrations of plasma phenylalanine between infants fed high versus low protein intake. When data from this study were included with those of Kashyap 1986, the meta‐analysis showed no significant difference (MD 0.25 μmol/dL, 95% CI ‐0.20 to 0.70) in concentrations of plasma phenylalanine between groups (Analysis 4.4).
4.4. Analysis.
Comparison 4: High versus low protein intake (adding studies comparing formulas with differences in other nutrients), Outcome 4: Phenylalanine levels
Additional secondary outcomes:
No study reported results for the following outcomes: decreased gastric motility, days to full enteral feedings, feeding intolerance, metabolic acidosis, serum albumin, sepsis, or diarrhea.
Comparison 5. Very high versus low protein intake (adding studies comparing formulas with differences in other nutrients)
Primary outcomes
Weight gain (g/week) (Outcome 5.1)
Raiha 1976 reported rate of weight gain in g/week measured from the time birth weight was regained to 2400 grams based on gestational age category. No significant differences in the rate of weight gain were noted between low and very high protein intake groups of any gestational age (Analysis 5.1).
5.1. Analysis.
Comparison 5: Very high versus low protein intake (adding studies comparing formulas with differences in other nutrients), Outcome 1: Weight gain (g/week)
Linear growth (cm/week) (Outcome 5.2)
Raiha 1976 reported rate of growth in crown‐rump length (cm/week) from regaining birth weight to attaining 2400 grams based on gestational age category. No significant differences were noted between low and very high protein intake groups in any gestational age strata (Analysis 5.2).
5.2. Analysis.
Comparison 5: Very high versus low protein intake (adding studies comparing formulas with differences in other nutrients), Outcome 2: Linear growth (cm/week)
Head growth (cm/week)
Raiha 1976 reported no significant difference in the rate of growth of head circumference from regaining birth weight to 2400 grams between low and very high protein intake groups of any gestational age. No numerical data were documented.
IQ score and Bayley score at 18 months and/or later
No study addressed this outcome.
Nectrotizing enterocolitis (Bell's stage II or greater)
No study addressed this outcome.
Secondary outcomes
Nitrogen utilization
Blood urea nitrogen (mg/dL)
Raiha 1976 reported a significant difference in blood urea nitrogen levels between infants fed very high versus low protein formulas when data from the three gestational ages were combined. Blood urea nitrogen levels varied directly with the quantity of protein in the diet; levels were greater than the normal range in infants receiving very high protein intake. Investigators report progressive elevation in blood urea nitrogen levels and metabolic acidosis in two infants receiving very high protein intake ‐ one given whey predominant formula (5%) and one given casein predominant formula (5%). Graphical data rather than numerical values were presented.
Nitrogen balance
Nitrogen accretion (mg/kg/d)
No study addressed this outcome.
Phenylalanine levels (Outcome 5.3)
Plasma phenylalanine concentration (μmol/dL) (Outcome 5.2.1)
Raiha 1976 found that infants fed formula providing higher protein intake had higher concentrations of plasma phenylalanine, particularly infants fed the casein predominant formula, when data from the three gestational ages were combined.
Additional secondary outcomes:
No study reported results for the following outcomes: decreased gastric motility, days to full enteral feedings, feeding intolerance, metabolic acidosis, serum albumin, sepsis, or diarrhea.
Comparison 6. Very high versus high protein intake (adding studies comparing formulas with differences in other nutrients)
Primary outcomes
Growth parameters(Outcome 6.1)
Weight gain (g/kg/d) (Outcome 6.1.1)
Cooke 2006 reported significantly higher weight gain in the very high protein formula group compared with the high protein group (23.1 ± 7 versus 16.7 ± 6 g/kg/d, P = 0.04). Goldman 1969 did not report weight gain (g/kg/d) but rather the number of days from regaining birth weight to 2200 grams. Based on regression curves calculated for infants < 1500 grams and > 1500 grams, more infants in the very high protein intake group took longer than the calculated period of time to reach 2200 grams (P < 0.01).
Weight gain (g/d) (Outcome 6.1.2)
In the analysis of weight gain in g/d, when the results of Cooke 2006 and Embleton 2005 were combined, weight gain was greater in the very high protein formula group (MD 3.9 g/d, 95% CI 1.04 to 6.77).
Linear growth (cm/week)
No study addressed this outcome.
Head growth (cm/week)
No study addressed this outcome.
IQ score or Bayley score at 18 months and/or later (Outcomes 6.2 and 6.3)
Two separate papers on the Goldman 1969 study reported incidences of low Stanford‐Binet test scores in infants at three years and five to seven years of life, respectively (Goldman 1971; Goldman 1974). Of the 80% of infants from the original study who were assessed at three years (corrected age and chronological age), a similar incidence of IQ scores below 90 was observed among infants fed very high and high protein formulas. Of the 81% of infants from the original study who were assessed at five to seven years, a similar incidence of IQ scores below 90 was reported in both groups. At both the three‐year evaluation and the five‐ to seven‐year evaluation, a significantly higher incidence of IQ scores below 90 was reported among infants of birth weight less than 1300 grams who received very high protein intake compared with those fed high protein intake (Analysis 6.2; Analysis 6.3).
6.2. Analysis.
Comparison 6: Very high versus high protein intake (adding studies comparing formulas with differences in other nutrients), Outcome 2: Low IQ or Bayley score at 18 months and/or later (all infants)
6.3. Analysis.
Comparison 6: Very high versus high protein intake (adding studies comparing formulas with differences in other nutrients), Outcome 3: Low IQ or Bayley score at 18 months and/or later (in infants < 1300 grams)
Secondary outcomes
Nitrogen utilization (Outcome 6.4)
Blood urea nitrogen (mg/dL) (Outcome 6.4.1)
Cooke 2006 reported a significantly higher blood urea level in the very high protein formula group compared with the high protein group (MD 1.4 mg/dL, 95% CI 0.4 to 2.4) (Analysis 6.4).
6.4. Analysis.
Comparison 6: Very high versus high protein intake (adding studies comparing formulas with differences in other nutrients), Outcome 4: Nitrogen utilization
Nitrogen balance (Outcome 6.5)
Nitrogen accretion (mg/kg/d) (Outcome 6.5.1)
Cooke 2006 found significantly higher nitrogen accretion in infants fed the very high protein formula (MD 88 mg/kg/d, 95% CI 25.17 to 150.83) (Analysis 6.5).
6.5. Analysis.
Comparison 6: Very high versus high protein intake (adding studies comparing formulas with differences in other nutrients), Outcome 5: Nitrogen balance
Phenylalanine levels (Outcome 6.6)
Plasma phenylalanine concentration (μmol/dL) (Outcome 6.6.1)
Cooke 2006 reported a non‐significantly higher plasma phenylalanine concentration in infants fed very high protein formula (MD 0.3 μmol/dL, 95% CI ‐0.67 to 1.27) (Analysis 6.6).
6.6. Analysis.
Comparison 6: Very high versus high protein intake (adding studies comparing formulas with differences in other nutrients), Outcome 6: Phenylalanine levels
Metabolic acidosis (mEq/L) (Outcome 6.7)
Cooke 2006 found no significant difference in base excess between the two groups (MD 0.5 mEq/L, 95% CI ‐1.19 to 2.19) (Analysis 6.7).
6.7. Analysis.
Comparison 6: Very high versus high protein intake (adding studies comparing formulas with differences in other nutrients), Outcome 7: Metabolic acidosis (base excess)
Serum albumin (g/L) (Outcome 6.8)
Cooke 2006 reported serum albumin levels and found no significant differences between the two groups (31 ± 3 versus 31 ± 3 g/L) (Analysis 6.8).
6.8. Analysis.
Comparison 6: Very high versus high protein intake (adding studies comparing formulas with differences in other nutrients), Outcome 8: Serum albumin (g/L)
Additional secondary outcomes:
No study reported results for the following outcomes: decreased gastric motility, days to full enteral feedings, feeding intolerance, sepsis, or diarrhea.
Discussion
Although a large number of studies (n = 41) were identified, upon close inspection only six studies were found to be suitable for inclusion in this systematic review (Bhatia 1991; Embleton 2005 [partial data]; Hillman 1994; Kashyap 1986; Svenningsen 1982a; Wauben 1995). The trials were small, and all except one had methodological limitations; the most frequent uncertainty was about incomplete outcome data. Most studies were excluded because they did not compare sufficiently different protein intakes, or because they examined a different intervention (e.g. studies examining quality of protein). Methodological limitations of the included trials may have introduced bias and therefore pose a threat to the validity of the analysis as follows.
Only two studies had adequately concealed allocation (Bhatia 1991; Embleton 2005).
Differences in protein content among comparison groups in some of the individual trials may be too small (range 0.56 to 1.36 g/kg/d) to illustrate the potential effects of changes in protein intake.
Formulas in some studies differed substantially across interventions.
The duration of interventions and/or study periods varied from eight days in Wauben 1995 to two years in Svenningsen 1982a.
Characteristics of participants varied across studies, with some studies including healthier and more mature preterm infants.
Researchers did not define which calculation of g/kg/day growth velocity they used (Fenton 2019).
These limitations may explain some of the differences in treatment effects and the statistical heterogeneity evident in trial outcomes.
For this review to be comprehensive and more clinically relevant, studies that varied in nutrient content other than protein were included only in a post‐facto analysis. Four studies were considered in the post‐facto analysis (Cooke 2006; Goldman 1969; Kashyap 1988; Raiha 1976), although only two of these studies could be included in the meta‐analysis (Cooke 2006; Kashyap 1988).
Weight gain (g/kg/d) was the most commonly reported outcome. An overall increase in weight gain was reported in infants randomly assigned to the high protein intake group compared with those in the low protein intake group (mean difference [MD] 2.36 g/kg/d, 95% confidence interval [CI] 1.31 to 3.40 for the overall analysis [low certainty]; MD 2.53 g/kg/d, 95% CI 1.62 to 3.45 for the post‐facto analysis). Certainty was downgraded one level for risk of bias (selection, performance, detection, attrition) and one level for inconsistency (I² = 57%).
One study that compared high (3.0 to 4.0 g/kg/d) versus very high (> 4 g/kg/d) protein intake (average intakes were 3.6 and 4.1 g/kg/d) during and after an initial hospital stay (n = 77) provided moderate‐certainty evidence showing no significant difference in weight gain (MD 3.10 g/d, 95% CI ‐0.04 to 6.24; P = 0.053) nor length gain (MD 0.0 cm/week, 95% CI ‐0.14 lower to 0.14; P = 1.0) to discharge from very high protein intake (4.1 versus 3.6 g/kg/d). This study also did not observe differences in weight or length gain to term and at 12 weeks corrected age with higher protein intakes. Three of the 24 infants receiving very high protein intake developed uremia. It is not known whether lack of a significant difference was due to insufficient differences in protein content between comparison groups (0.48 g/kg/d), or whether protein intakes > 4.0 g/kg/d do not support higher growth.
The most desirable level of protein intake is that which contributes to infant growth at the infant's predetermined genetic potential without negative consequences. The ideal composition of weight gain for the preterm infant is not known. It is generally considered that the lower lean tissue and higher fat gain of these infants relative to the fetus may not be desirable (Schulze 1987); however increasing evidence reveals that preterm infants do not have higher body fat compared to term‐born infants by three months corrected age (Goswami 2016; Griffin 2012; Scheurer 2017; Villela 2018). Significantly greater nitrogen accretion (MD 143.7 mg/kg/d, 95% CI 128.7 to 158.8 for the overall analysis; MD 112.6 mg/kg/d, 95% CI 101.4 to 123.8 for the post‐facto analysis) was observed in infants randomly assigned to the high protein intake groups. This greater nitrogen accretion suggests that some or all of the increment in weight is due to gains in lean body mass. These findings indicate that higher protein intake may help correct the non‐optimal body composition seen in preterm infants at term adjusted age (Gianni 2015; Villela 2018). Statistical heterogeneity was noted in nitrogen accretion; hence the data should be interpreted cautiously. Potential sources of heterogeneity might include clinical diversity (e.g. variability in participants, interventions, and outcome measures) and methodological variability (e.g. differences in trial design).
Two studies attempted to determine whether utilization of protein was enhanced by higher energy intake (Kashyap 1986; Kashyap 1988). These studies compared medium energy intake (120 kcal/kg/d) versus high energy intake (142 kcal/kg/d). Kashyap 1986 found that higher energy intake did not enhance protein utilization. This was evident in the similarities noted between groups in quantities of nitrogen retention, albumin, and prealbumin, as well as in the concentrations of blood urea nitrogen and most plasma amino acids. In contrast, in a later study, Kashyap 1988 reported improvements in nitrogen retention and blood urea nitrogen levels with higher energy intake.
Three studies reported that blood urea nitrogen levels were higher among infants fed high protein intake compared with those fed low protein intake (Bhatia 1991; Kashyap 1986; Svenningsen 1982a). Although detectable, some of these differences may not be clinically important. Three studies reported no significant differences in phenylalanine levels between low and high protein intake groups (Bhatia 1991; Kashyap 1986; Kashyap 1988). Inclusion of the two Kashyap studies in the post‐facto meta‐analysis resulted in no significant difference (MD 0.25, 95% CI ‐0.20 to 0.75) in concentrations of plasma phenylalanine between high and low protein intake groups.
Although the two Kashyap studies reported acid‐base status within normal limits (Kashyap 1986; Kashyap 1988), other trials raised concerns regarding metabolic acidosis among infants receiving high protein intake (Raiha 1976; Svenningsen 1982a). Raiha 1976 noted that infants receiving very high protein intake (4.5 g/kg/d) developed metabolic acidosis that resolved once infants were removed from the study and were fed breast milk. In the Svenningsen 1982a study, late metabolic acidosis occurred in 25% and 7%, respectively, of infants in high and low protein intake groups. It is possible that the supplement "protinpur" that was added to the low protein formula to prepare the high protein formula had poor biological value.
Very high protein intake may be poorly tolerated in infants with very low birth weight and extreme prematurity. Studies have not adequately evaluated short‐ and long‐term adverse sequelae of very high protein intake (≥ 4 g/kg/d). The single study of very high protein intake in the primary analysis reported an average protein intake of 4.1 versus 3.6 g/kg/day in its comparison arms (Embleton 2005). The maximal utilizable protein limits for infants in different weight and gestational age categories are unknown. In recent years, preterm infant formulas used in North America have changed such that if infants are fed at energy intake that exceeds 133 kcal/kg/d, protein intake will exceed 4 g/kg/d. In this systematic review, only one study compared high (≥ 3.0 g/kg/d but < 4.0 g/kg/d) versus very high protein intake (≥ 4.0 g/kg/d) both during and after initial hospital stay (Embleton 2005). Very high protein intake promoted significantly higher weights and lengths at discharge; weight gain to discharge was not significantly different (MD 3.10 g/kg/d, 95% CI ‐0.04 to 6.24), and differences in size did not remain significant at 12 weeks corrected age. Evidence suggests that very high protein intake, compared to high protein intake, increases weight gain, but our confidence in the effect estimate is limited by imprecision. Certainty was downgraded one level for imprecision (moderate certainty). Three of the 24 infants receiving very high protein intake developed uremia, which was associated with the level of protein intake and was normalized without intervention within two to three days in two infants, and within 10 days in another infant. Three studies in the post‐facto analysis assessed protein intake above 4.0 g/kg/d (Cooke 2006; Goldman 1969; Raiha 1976). The quantity of protein intake in these studies was 4.6 g/kg/d (Cooke 2006), 6 to 7.2 g/kg/d (Goldman 1969), and 4.5 g/kg/d (Raiha 1976). The findings of two studies could not be included in the meta‐analysis (Goldman 1969; Raiha 1976), as comparisons made within these studies were unique. A post‐facto meta‐analysis of two studies demonstrated significantly greater weight gain in the very high protein group compared with the high protein group (MD 3.9 g/d, 95% CI 1.04 to 6.77) (Cooke 2006; Embleton 2005).
Other potential adverse effects of high protein intake were assessed by reporting neurodevelopmental outcomes, days to full feedings, necrotizing enterocolitis, sepsis, and diarrhea. However, limited information could be obtained regarding these potential risks. Although a meta‐analysis was carried out for necrotizing enterocolitis, the findings presented should be interpreted cautiously because:
uncertainty about the definition of necrotizing enterocolitis used by some studies continues; and
small numbers of infants were included in the two studies (N = 64).
Neurodevelopmental outcomes of early nutrition were evaluated by three of the studies included in this systematic review (Bhatia 1991; Goldman 1969; Svenningsen 1982a).
Bhatia 1991 used the Neonatal Behavioral Assessment Scale, which has known psychometric properties but has been validated for use only in term infants up to two months of age (Brazelton 1995). Results of Bhatia 1991 suggest improvement in some of the parameters of neurodevelopmental outcome with high protein intake compared with low intake. Goldman 1969 (a study included only in the post‐facto analysis) administered the Stanford‐Binet test at three years and five to seven years of age and noted a significant increase in the incidence of low IQ among infants with birth weight < 1300 grams fed very high protein intake (6 to 7.2 g/kg/d) during their initial hospitalization. Svenningsen 1982a did not report the tool used to assess development.
Summary of main results
Five studies compared low (< 3 g/kg/d) versus high (3.0 to 4.0 g/kg/d) protein intake using formulas that kept other nutrients constant. Low‐certainty evidence suggests improved weight gain and higher nitrogen accretion in infants receiving formula with higher protein content (3.0 to 4.0 g/kg/d) versus low protein (< 3 g/kg/d) while other nutrients were kept constant. We are uncertain whether high versus low protein intake affects head (n = 18) and length (n = 48) growth. No significant differences were seen in rates of necrotizing enterocolitis, sepsis, or diarrhea. No data were available regarding neurodevelopmental outcomes.
Only one study included in this systematic review compared very high protein intake (≥ 4.0 g/kg/d) versus high (≥ 3.0 g/kg/d but < 4.0 g/kg/d) protein intake (Embleton 2005). Moderate‐certainty evidence shows that very high protein intake, compared to high protein intake, increases weight gain, but our confidence in the effect estimate is limited by imprecision.
Overall completeness and applicability of evidence
Uncertainty remains about the effects of various protein intake levels on long‐term growth and development. All of the included studies reported on weight gain for various protein intakes; however, none of those reporting weight gain velocity in g/kg/d defined how this was calculated (Fenton 2019). Growth assessments require more information, such as data on length and head growth and long‐term development; however few studies reported these outcomes. Because necrotizing enterocolitis is a relatively rare outcome, trails including a larger sample size are needed to inform about this outcome.
Quality of the evidence
None of the comparisons provided moderate‐ or high‐certainty evidence; all comparisons yielded evidence rated as low or very low certainty.
Potential biases in the review process
Most of the included trials were rated as having high risk of selection and attrition bias, and some were assessed as having high risk of performance and detection bias.
Agreements and disagreements with other studies or reviews
Similar to the Cochrane Review titled "Protein supplementation of human milk for promoting growth in preterm infants" (Amissah 2018), this updated systematic review also observed improved weight gain with higher protein intakes (their weight gain difference: (MD 3.8 g/kg/day, 95% CI 2.9 to 4.7) and our weight gain difference: (MD 2.4 g/kg/d, 95% CI 1.3 to 3.4)). The estimated difference in length growth for these two reviews were similar, however the estimate from protein supplementation of human milk ((MD 0.12 cm/wk, 95% CI 0.07 to 0.17) (Amissah 2018) was statistically significant while it was not significant from higher protein from formula (0.16 (‐0.02 to 0.34)).
Authors' conclusions
Implications for practice.
This systematic review suggests that weight gain and nitrogen accretion can be promoted by regulating protein intake in "healthy" formula‐fed preterm infants. The American Academy of Pediatrics recommends 3.2 to 4.5 g/kg/d of enteral protein for preterm infants (AAP 2020). Low‐certainty evidence supports 3 to 4 g/kg/d protein intake from infant formula. Increased levels of blood urea nitrogen and metabolic acidosis may occur in some infants who receive protein intake above 3 g/kg/d. This updated review revealed benefits in weight gain and nitrogen accretion and no clear risks associated with protein intakes up to 4 g/kg/d. Growth advantages of protein intake greater than 4 g/kg/d remain uncertain and require careful monitoring for protein overload (i.e. serum urea nitrogen levels). The exact protein intake that safely promotes optimal growth and development of low birth weight infants remains uncertain.
Implications for research.
Future research should determine the precise protein requirements of preterm infants according to birth weight and gestational and postnatal age. Moreover, unanswered research questions remain regarding protein requirements according to postnatal age and the presence of short‐term and long‐term growth and neurodevelopmental morbidities. The question of whether clinically significant risks are associated with moderately elevated blood urea nitrogen and metabolic acidosis warrants study. Given the current state of evidence, protein intake above 4 g/kg/d should be considered experimental.
What's new
| Date | Event | Description |
|---|---|---|
| 1 July 2020 | Amended | Typo corrected in Declarations of interest section. |
History
Protocol first published: Issue 1, 2003 Review first published: Issue 1, 2006
| Date | Event | Description |
|---|---|---|
| 19 December 2019 | New citation required but conclusions have not changed | No new studies were included, and no changes were made to the review conclusions. For the 2020 update, to meet current MECIR standards, we have modified the Objective statement without changing its intent to read as follows: To assess the effects of higher (≥ 3.0 g/kg/d) versus lower (< 3.0 g/kg/d) protein intake during the initial hospital stay of formula‐fed preterm infants or low birth weight infants (< 2.5 kilograms) on growth and neurodevelopmental and feeding tolerance outcomes, and to determine whether these effects differ based upon birth weight. |
| 19 December 2019 | New search has been performed | We searched the evidence until August 2019. This updates the review titled "Higher versus lower protein intake in formula‐fed low birth weight infants" (Fenton 2014). |
| 21 May 2013 | New search has been performed | This updates the review titled "Higher versus lower protein intake in formula‐fed low birth weight infants" (Fenton 2009) |
| 21 May 2013 | New citation required but conclusions have not changed | One new study was included. No changes were made to review conclusions |
| 20 July 2009 | New search has been performed | This updates the review titled "Higher versus lower protein intake in formula‐fed low birth weight infants" (Premji 2006) One new study was included. No changes were made to review conclusions |
| 27 October 2008 | Amended | Review was converted to new review format |
| 11 October 2005 | New citation required and conclusions have changed | Substantive amendments were made |
Acknowledgements
We would like to thank Cochrane Neonatal: Colleen Ovelman, Managing Editor; Jane Cracknell, Assistant Managing Editor; Roger Soll, Co‐coordinating Editor; and William McGuire, Co‐coordinating Editor, who provided editorial and administrative support. Carol Friesen, Information Specialist, designed and ran the literature searches.
We would like to thank Dr. Rollin Brant for statistical advice. We thank Dr. William McGuire, University of York, for technical assistance and advice.
The methods section of this review is based on a standard template used by Cochrane Neonatal.
Appendices
Appendix 1. Search methods for 2020 update
For the 2020 update, new search strategies were developed. The RCT filters have been created using Cochrane's highly sensitive search strategies for identifying randomized trials (Higgins 2011). The neonatal filters were created and tested by the Cochrane Neonatal Information Specialist.
Cochrane CENTRAL via CRS Web
Terms:
1. MESH DESCRIPTOR Infant Formula EXPLODE ALL AND CENTRAL:TARGET
2. formula* AND CENTRAL:TARGET
3. artificial milk AND CENTRAL:TARGET
4. synthetic milk AND CENTRAL:TARGET
5. milk substitute* AND CENTRAL:TARGET
6. #1 OR #2 OR #3 OR #4 OR #5
7. MESH DESCRIPTOR Dietary Proteins EXPLODE ALL AND CENTRAL:TARGET
8. protein* AND CENTRAL:TARGET
9. #8 OR #7
10. MESH DESCRIPTOR Infant, Newborn EXPLODE ALL AND CENTRAL:TARGET
11. infant or infants or infantile or infancy or newborn* or "new born" or "new borns" or "newly born" or neonat* or baby* or babies or premature or prematures or prematurity or preterm or preterms or "pre term" or premies or "low birth weight" or "low birthweight" or VLBW or LBW or ELBW or NICU or "small for gestational age" AND CENTRAL:TARGET
12. #11 OR #10 AND CENTRAL:TARGET
13. #6 AND #9 AND #12
14. 2013 TO 2019:YR AND CENTRAL:TARGET
15. #14 AND #13
# of Results: 373
OVID MEDLINE Epub Ahead of Print, In‐Process & Other Non‐Indexed Citations, Ovid MEDLINE(R) Daily and Ovid MEDLINE(R) 1946 to Present
Terms:
1. exp Infant Formula/ 2. formula*.mp. 3. artificial milk.mp. 4. synthetic milk.mp. 5. milk substitute*.mp. 6. 1 or 2 or 3 or 4 or 5 7. exp Dietary Proteins/ 8. protein*.mp. 9. 7 or 8 10. exp infant, newborn/ 11. (newborn* or new born or new borns or newly born or baby* or babies or premature or prematurity or preterm or pre term or low birth weight or low birthweight or VLBW or LBW or infant or infants or infantile or infancy or neonat* or "small for gestational age").ti,ab. 12. 10 or 11 13. randomized controlled trial.pt. 14. controlled clinical trial.pt. 15. randomized.ab. 16. placebo.ab. 17. drug therapy.fs. 18. randomly.ab. 19. trial.ab. 20. groups.ab. 21. or/13‐20 22. exp animals/ not humans.sh. 23. 21 not 22 24. 12 and 23 25. 6 and 9 and 24 26. limit 25 to yr="2013 ‐Current" # of Results: 342
MEDLINE via PubMed
Terms: (("Infant Formula"[Mesh] OR formula* OR "artificial milk" OR "synthetic milk" OR "milk substitute" OR "milk substitutes") AND ("Dietary Proteins"[Mesh] OR protein*)) AND (((infant, newborn[MeSH] OR newborn*[TIAB] OR "new born"[TIAB] OR "new borns"[TIAB] OR "newly born"[TIAB] OR baby*[TIAB] OR babies[TIAB] OR premature[TIAB] OR prematurity[TIAB] OR preterm[TIAB] OR "pre term"[TIAB] OR "low birth weight"[TIAB] OR "low birthweight"[TIAB] OR VLBW[TIAB] OR LBW[TIAB] OR infant[TIAB] OR infants[TIAB] OR infantile[TIAB] OR infancy[TIAB] OR neonat*[TIAB] OR "small for gestational age"[TIAB]) AND (randomized controlled trial[pt] OR controlled clinical trial[pt] OR randomized[tiab] OR placebo[tiab] OR drug therapy[sh] OR randomly[tiab] OR trial[tiab] OR groups[tiab]) NOT (animals[mh] NOT humans[mh]))) Filters activated: Publication date from 2018/07/01
# of Results: 61
CINAHL via EBSCOhost
Terms: (formula* OR "artificial milk" OR "synthetic milk" OR "milk substitute" OR "milk substitutes") AND (protein*) AND (infant or infants or infantile or infancy or newborn* or "new born" or "new borns" or "newly born" or neonat* or baby* or babies or premature or prematures or prematurity or preterm or preterms or "pre term" or premies or "low birth weight" or "low birthweight" or VLBW or LBW or "small for gestational age") AND (randomized controlled trial OR controlled clinical trial OR randomized OR placebo OR clinical trials as topic OR randomly OR trial OR PT clinical trial) Published Date: 20130101‐20191231 # of Results: 141
Clinical Trial Registries
ISRCTN.com: Search terms: formula* Interventions: Protein* Participant age range: Neonate Date applied: from: 01/01/2013 Date applied: to: 01/12/2019 Date searched: August 2, 2019 Retrieved: 2
Appendix 2. Previous literature search methods
For the previous version of this review (Fenton 2014), we used the following methods to search for available literature.
Electronic searches
We searched several databases, including MEDLINE back to 1966, CINAHL back to 1982, PubMed back to 1966, Embase back to 1980, and the Cochrane Central Register of Controlled Trials (CENTRAL; 2013, Issue 5). MeSH headings, including infant, newborn, low birth weight, small for gestational age, very low birth weight, premature, amino acids, dietary proteins, milk proteins, milk, infant food, food, and formulated, and text words, including formula and protein, were used for the computerized searches. We applied no language restrictions.
Two review authors updated computerized searches up to October 2019.
Searching other resources
We also identified abstracts and conference and symposia proceedings from the Society of Pediatric Research and the American Academy of Pediatrics. We reviewed cross‐references independently for additional relevant titles and abstracts for articles up to 50 years old. We contacted experts to identify other studies relevant to the topic. We applied no language restrictions.
We searched clinical trials registries for ongoing and recently completed trials (http://clinicaltrials.gov; controlled‐trials.com; who.int/ictrp).
Appendix 3. Risk of bias
1. Sequence generation (checking for possible selection bias). Was the allocation sequence adequately generated?
For each included study, we categorized the method used to generate the allocation sequence as:
low risk (any truly random process, e.g. random number table; computer random number generator);
high risk (any non‐random process, e.g. odd or even date of birth; hospital or clinic record number); or
unclear risk.
2. Allocation concealment (checking for possible selection bias). Was allocation adequately concealed?
For each included study, we categorized the method used to conceal the allocation sequence as:
low risk (e.g. telephone or central randomization; consecutively numbered sealed opaque envelopes);
high risk (open random allocation; unsealed or non‐opaque envelopes, alternation; date of birth); or
unclear risk.
3. Blinding of participants and personnel (checking for possible performance bias). Was knowledge of the allocated intervention adequately prevented during the study?
For each included study, we categorized the methods used to blind study participants and personnel from knowledge of which intervention a participant received. Blinding was assessed separately for different outcomes or classes of outcomes. We categorized the methods as:
low risk, high risk, or unclear risk for participants; and
low risk, high risk, or unclear risk for personnel.
4. Blinding of outcome assessment (checking for possible detection bias). Was knowledge of the allocated intervention adequately prevented at the time of outcome assessment?
For each included study, we categorized the methods used to blind outcome assessment. Blinding was assessed separately for different outcomes or classes of outcomes. We categorized the methods as:
low risk for outcome assessors;
high risk for outcome assessors; or
unclear risk for outcome assessors.
5. Incomplete outcome data (checking for possible attrition bias through withdrawals, dropouts, protocol deviations). Were incomplete outcome data adequately addressed?
For each included study and for each outcome, we described the completeness of data including attrition and exclusions from the analysis. We noted whether attrition and exclusions were reported, the numbers included in the analysis at each stage (compared with the total randomized participants), reasons for attrition or exclusion when reported, and whether missing data were balanced across groups or were related to outcomes. When sufficient information was reported or supplied by the trial authors, we re‐included missing data in the analyses. We categorized the methods as:
low risk (< 20% missing data);
high risk (≥ 20% missing data); or
unclear risk.
6. Selective reporting bias. Are reports of the study free of the suggestion of selective outcome reporting?
For each included study, we described how we investigated the possibility of selective outcome reporting bias and what we found. For studies in which study protocols were published in advance, we compared prespecified outcomes versus outcomes eventually reported in the published results. If the study protocol was not published in advance, we contacted study authors to gain access to the study protocol. We assessed the methods as:
low risk (when it is clear that all of the study's prespecified outcomes and all expected outcomes of interest to the review have been reported);
high risk (when not all of the study's prespecified outcomes have been reported; one or more reported primary outcomes were not prespecified outcomes of interest and are reported incompletely and so cannot be used; study fails to include results of a key outcome that would have been expected to have been reported); or
unclear risk.
7. Other sources of bias. Was the study apparently free of other problems that could put it at high risk of bias?
For each included study, we described any important concerns we had about other possible sources of bias (e.g. whether there was a potential source of bias related to the specific study design, whether the trial was stopped early due to some data‐dependent process). We assessed whether each study was free of other problems that could put it at risk of bias as:
low risk;
high risk; or
unclear risk.
If needed, we explored the impact of the level of bias by undertaking sensitivity analyses.
Data and analyses
Comparison 1. High versus low protein intake (restricted to studies meeting all a priori inclusion criteria).
| Outcome or subgroup title | No. of studies | No. of participants | Statistical method | Effect size |
|---|---|---|---|---|
| 1.1 Growth parameters | 5 | Mean Difference (IV, Fixed, 95% CI) | Subtotals only | |
| 1.1.1 Weight gain (g/kg/d) | 5 | 114 | Mean Difference (IV, Fixed, 95% CI) | 2.36 [1.31, 3.40] |
| 1.1.2 Linear growth (cm/week) | 2 | 48 | Mean Difference (IV, Fixed, 95% CI) | 0.16 [‐0.02, 0.34] |
| 1.1.3 Head growth (cm/week) | 1 | 18 | Mean Difference (IV, Fixed, 95% CI) | 0.37 [0.16, 0.58] |
| 1.2 Necrotizing enterocolitis | 2 | 46 | Risk Ratio (M‐H, Fixed, 95% CI) | Not estimable |
| 1.2.1 NEC (Bell's stage II or greater) comparing high and low protein intakes (same micronutrient content) | 2 | 46 | Risk Ratio (M‐H, Fixed, 95% CI) | Not estimable |
| 1.3 Nitrogen utilization | 2 | 41 | Mean Difference (IV, Fixed, 95% CI) | 1.92 [1.00, 2.84] |
| 1.3.1 Blood urea nitrogen (mg/dL) | 2 | 41 | Mean Difference (IV, Fixed, 95% CI) | 1.92 [1.00, 2.84] |
| 1.4 Nitrogen balance | 2 | 34 | Mean Difference (IV, Fixed, 95% CI) | 143.73 [128.70, 158.77] |
| 1.4.1 Nitrogen accretion (mg/kg/d) | 2 | 34 | Mean Difference (IV, Fixed, 95% CI) | 143.73 [128.70, 158.77] |
| 1.5 Phenylalanine levels | 2 | 41 | Mean Difference (IV, Fixed, 95% CI) | 0.34 [‐0.27, 0.96] |
| 1.5.1 Plasma phenylalanine concentration (μmol/dL) | 2 | 41 | Mean Difference (IV, Fixed, 95% CI) | 0.34 [‐0.27, 0.96] |
| 1.6 Metabolic acidosis (pH, base excess) | 1 | Mean Difference (IV, Fixed, 95% CI) | Subtotals only | |
| 1.6.1 pH | 1 | 18 | Mean Difference (IV, Fixed, 95% CI) | 0.01 [‐0.02, 0.04] |
| 1.6.2 Base excess (mEq/L) | 1 | 18 | Mean Difference (IV, Fixed, 95% CI) | ‐0.20 [‐2.43, 2.03] |
| 1.7 Serum albumin (g/L) | 1 | 18 | Mean Difference (IV, Fixed, 95% CI) | 44.00 [23.59, 64.41] |
| 1.7.1 Serum prealbumin (g/L) | 1 | 18 | Mean Difference (IV, Fixed, 95% CI) | 44.00 [23.59, 64.41] |
| 1.8 Sepsis | 1 | 30 | Risk Ratio (M‐H, Fixed, 95% CI) | 0.44 [0.04, 4.32] |
| 1.8.1 Septicemia | 1 | 30 | Risk Ratio (M‐H, Fixed, 95% CI) | 0.44 [0.04, 4.32] |
| 1.9 Diarrhea | 1 | 18 | Risk Difference (M‐H, Fixed, 95% CI) | 0.00 [‐0.19, 0.19] |
| 1.9.1 Diarrhea episodes (babies with 1 or more episodes of diarrhea) | 1 | 18 | Risk Difference (M‐H, Fixed, 95% CI) | 0.00 [‐0.19, 0.19] |
1.1. Analysis.
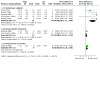
Comparison 1: High versus low protein intake (restricted to studies meeting all a priori inclusion criteria), Outcome 1: Growth parameters
Comparison 3. Very high versus high protein intake (restricted to studies meeting all a priori inclusion criteria).
| Outcome or subgroup title | No. of studies | No. of participants | Statistical method | Effect size |
|---|---|---|---|---|
| 3.1 Growth parameters at discharge | 1 | Mean Difference (IV, Fixed, 95% CI) | Subtotals only | |
| 3.1.1 Weight gain at discharge (g/d) | 1 | 77 | Mean Difference (IV, Fixed, 95% CI) | 3.10 [‐0.04, 6.24] |
| 3.1.2 Linear growth at discharge (cm/week) | 1 | 77 | Mean Difference (IV, Fixed, 95% CI) | 0.00 [‐0.14, 0.14] |
| 3.2 Growth parameters at term | 1 | 148 | Mean Difference (IV, Fixed, 95% CI) | 0.10 [0.00, 0.20] |
| 3.2.1 Weight gain at term (g/d) | 1 | 74 | Mean Difference (IV, Fixed, 95% CI) | 2.20 [‐1.15, 5.55] |
| 3.2.2 Linear growth at term (cm/week) | 1 | 74 | Mean Difference (IV, Fixed, 95% CI) | 0.10 [0.00, 0.20] |
| 3.3 Growth parameters at 12 weeks corrected age | 1 | 146 | Std. Mean Difference (IV, Fixed, 95% CI) | ‐0.02 [‐0.36, 0.33] |
| 3.3.1 Weight gain at 12 weeks corrected age (g/d) | 1 | 73 | Std. Mean Difference (IV, Fixed, 95% CI) | ‐0.04 [‐0.53, 0.45] |
| 3.3.2 Linear growth at 12 weeks corrected age (g/d) | 1 | 73 | Std. Mean Difference (IV, Fixed, 95% CI) | 0.00 [‐0.49, 0.49] |
3.1. Analysis.
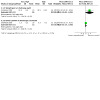
Comparison 3: Very high versus high protein intake (restricted to studies meeting all a priori inclusion criteria), Outcome 1: Growth parameters at discharge
3.2. Analysis.
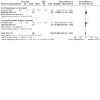
Comparison 3: Very high versus high protein intake (restricted to studies meeting all a priori inclusion criteria), Outcome 2: Growth parameters at term
3.3. Analysis.
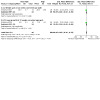
Comparison 3: Very high versus high protein intake (restricted to studies meeting all a priori inclusion criteria), Outcome 3: Growth parameters at 12 weeks corrected age
Comparison 4. High versus low protein intake (adding studies comparing formulas with differences in other nutrients).
| Outcome or subgroup title | No. of studies | No. of participants | Statistical method | Effect size |
|---|---|---|---|---|
| 4.1 Growth parameters | 6 | Mean Difference (IV, Fixed, 95% CI) | Subtotals only | |
| 4.1.1 Weight gain (g/kg/d) | 6 | 143 | Mean Difference (IV, Fixed, 95% CI) | 2.53 [1.62, 3.45] |
| 4.1.2 Linear growth (cm/week) | 3 | 77 | Mean Difference (IV, Fixed, 95% CI) | 0.16 [0.03, 0.30] |
| 4.1.3 Head growth (cm/week) | 2 | 47 | Mean Difference (IV, Fixed, 95% CI) | 0.23 [0.12, 0.35] |
| 4.2 Nitrogen utilization | 2 | 47 | Mean Difference (IV, Fixed, 95% CI) | 3.22 [2.48, 3.96] |
| 4.2.1 Blood urea nitrogen (mg/dL) | 2 | 47 | Mean Difference (IV, Fixed, 95% CI) | 3.22 [2.48, 3.96] |
| 4.3 Nitrogen balance | 3 | 63 | Mean Difference (IV, Fixed, 95% CI) | 112.57 [101.37, 123.77] |
| 4.3.1 Nitrogen accretion (mg/kg/d) | 3 | 63 | Mean Difference (IV, Fixed, 95% CI) | 112.57 [101.37, 123.77] |
| 4.4 Phenylalanine levels | 2 | 47 | Mean Difference (IV, Fixed, 95% CI) | 0.25 [‐0.20, 0.70] |
| 4.4.1 Plasma phenylalanine concentration (μmol/dL) | 2 | 47 | Mean Difference (IV, Fixed, 95% CI) | 0.25 [‐0.20, 0.70] |
Comparison 5. Very high versus low protein intake (adding studies comparing formulas with differences in other nutrients).
| Outcome or subgroup title | No. of studies | No. of participants | Statistical method | Effect size |
|---|---|---|---|---|
| 5.1 Weight gain (g/week) | 1 | 84 | Mean Difference (IV, Fixed, 95% CI) | ‐6.47 [‐19.05, 6.11] |
| 5.1.1 28 to 30 weeks gestation | 1 | 27 | Mean Difference (IV, Fixed, 95% CI) | ‐10.00 [‐38.86, 18.86] |
| 5.1.2 31 to 33 weeks gestation | 1 | 29 | Mean Difference (IV, Fixed, 95% CI) | ‐12.00 [‐30.93, 6.93] |
| 5.1.3 34 to 36 weeks gestation | 1 | 28 | Mean Difference (IV, Fixed, 95% CI) | 2.00 [‐18.74, 22.74] |
| 5.2 Linear growth (cm/week) | 1 | 84 | Mean Difference (IV, Fixed, 95% CI) | ‐0.03 [‐0.10, 0.04] |
| 5.2.1 28 to 30 weeks gestation | 1 | 27 | Mean Difference (IV, Fixed, 95% CI) | 0.00 [‐0.08, 0.08] |
| 5.2.2 31 to 33 weeks gestation | 1 | 29 | Mean Difference (IV, Fixed, 95% CI) | ‐0.17 [‐0.33, ‐0.01] |
| 5.2.3 34 to 36 weeks gestation | 1 | 28 | Mean Difference (IV, Fixed, 95% CI) | ‐0.01 [‐0.17, 0.15] |
| 5.3 Phenylalanine levels | 1 | 84 | Mean Difference (IV, Fixed, 95% CI) | 3.15 [1.31, 4.99] |
| 5.3.1 Plasma phenylalanine concentration (μmol/dL) | 1 | 84 | Mean Difference (IV, Fixed, 95% CI) | 3.15 [1.31, 4.99] |
5.3. Analysis.
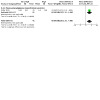
Comparison 5: Very high versus low protein intake (adding studies comparing formulas with differences in other nutrients), Outcome 3: Phenylalanine levels
Comparison 6. Very high versus high protein intake (adding studies comparing formulas with differences in other nutrients).
| Outcome or subgroup title | No. of studies | No. of participants | Statistical method | Effect size |
|---|---|---|---|---|
| 6.1 Growth parameters | 2 | 113 | Mean Difference (IV, Fixed, 95% CI) | 4.36 [1.78, 6.95] |
| 6.1.1 Weight gain (g/kg/d) | 1 | 18 | Mean Difference (IV, Fixed, 95% CI) | 6.40 [0.38, 12.42] |
| 6.1.2 Weight gain (g/d) | 2 | 95 | Mean Difference (IV, Fixed, 95% CI) | 3.90 [1.04, 6.77] |
| 6.2 Low IQ or Bayley score at 18 months and/or later (all infants) | 1 | Risk Ratio (M‐H, Fixed, 95% CI) | Subtotals only | |
| 6.2.1 IQ score < 90 at 3 years of age based on corrected age | 1 | 216 | Risk Ratio (M‐H, Fixed, 95% CI) | 0.70 [0.46, 1.08] |
| 6.3 Low IQ or Bayley score at 18 months and/or later (in infants < 1300 grams) | 1 | Risk Ratio (M‐H, Fixed, 95% CI) | Subtotals only | |
| 6.3.1 IQ score < 90 at 3 years of age based on chronological age | 1 | 47 | Risk Ratio (M‐H, Fixed, 95% CI) | 0.30 [0.14, 0.64] |
| 6.3.2 IQ score < 90 at 5 years of age | 1 | 49 | Risk Ratio (M‐H, Fixed, 95% CI) | 0.31 [0.15, 0.66] |
| 6.4 Nitrogen utilization | 1 | 18 | Mean Difference (IV, Fixed, 95% CI) | 1.40 [0.40, 2.40] |
| 6.4.1 Blood urea nitrogen (mg/dL) | 1 | 18 | Mean Difference (IV, Fixed, 95% CI) | 1.40 [0.40, 2.40] |
| 6.5 Nitrogen balance | 1 | 18 | Mean Difference (IV, Fixed, 95% CI) | 88.00 [25.17, 150.83] |
| 6.5.1 Nitrogen accretion (mg/kg/d) | 1 | 18 | Mean Difference (IV, Fixed, 95% CI) | 88.00 [25.17, 150.83] |
| 6.6 Phenylalanine levels | 1 | 18 | Mean Difference (IV, Fixed, 95% CI) | 0.30 [‐0.67, 1.27] |
| 6.6.1 Plasma phenylalanine concentration (μmol/dL) | 1 | 18 | Mean Difference (IV, Fixed, 95% CI) | 0.30 [‐0.67, 1.27] |
| 6.7 Metabolic acidosis (base excess) | 1 | 18 | Mean Difference (IV, Fixed, 95% CI) | 0.50 [‐1.19, 2.19] |
| 6.7.1 Base excess (mEq/L) | 1 | 18 | Mean Difference (IV, Fixed, 95% CI) | 0.50 [‐1.19, 2.19] |
| 6.8 Serum albumin (g/L) | 1 | 18 | Mean Difference (IV, Fixed, 95% CI) | 0.00 [‐2.77, 2.77] |
6.1. Analysis.
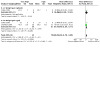
Comparison 6: Very high versus high protein intake (adding studies comparing formulas with differences in other nutrients), Outcome 1: Growth parameters
Characteristics of studies
Characteristics of included studies [ordered by study ID]
Bhatia 1991.
| Study characteristics | ||
| Methods | RCT: numbered envelopes Blinding of randomization: yes Blinding of intervention: yes (medical and nursing staff) Complete follow‐up: no Blinding of outcome: yes (to psychologist) 3 of 26 participants (12%) were withdrawn for provision of human milk and necrotizing enterocolitis 8 of 23 participants (22%) were lost to follow‐up |
|
| Participants | 26 infants Inclusion criteria: BW < 1500 grams, no major congenital anomalies, no congestive heart failure, oxygen requirements < 40% on study entry, no supplemental oxygen on day 1 of study Study entry: when infants reached 60 kcal/kg/d Study day 1: enteral intake reached 100 kcal/kg/d within 21 days of life To stay in study: enteral feeding to begin by 14 days of age, and infant to achieve enteral intake of 100 kcal/kg/d by 21 days of life Studies were conducted at the Department of Pediatrics, University of Texas Medical Branch, Galveston, TX, USA |
|
| Interventions | High protein intake: 3.8 g/kg/d (n = 8) and 3.1 g/kg/d (n = 8). Data for these 2 groups were combined in this review Low protein intake: 2.6 g/kg/d (n = 7) |
|
| Outcomes | Weight, length, head circumference, skin‐fold thickness, serum total protein, prealbumin, retinol‐binding protein, urea nitrogen, plasma amino acids, Neonatal Behavior Assessment Scale (orientation, habituation, stability, regulation, range, and motor) in subset of infants (n = 18; 69%) within 5 days of completing the feeding study | |
| Notes | Did not mention total parenteral nutrition Carbohydrates added to make the energy level identical between formulas |
|
| Risk of bias | ||
| Bias | Authors' judgement | Support for judgement |
| Random sequence generation (selection bias) | Low risk | A randomization schedule was prepared for random assignment to the 3 groups |
| Allocation concealment (selection bias) | Low risk | Blinding of randomization: yes, numbered envelopes |
| Blinding (performance bias and detection bias) All outcomes | Low risk | Blinding of intervention: yes (medical and nursing staff) Blinding of outcome: yes (to psychologist) |
| Blinding of participants and personnel (performance bias) All outcomes | Low risk | Blinding of intervention: yes (medical and nursing staff and psychologist) |
| Blinding of outcome assessment (detection bias) All outcomes | Low risk | Blinding of intervention: yes (medical and nursing staff) Blinding of outcome: yes (to psychologist) |
| Incomplete outcome data (attrition bias) All outcomes | High risk | Complete follow‐up: no 3 of 26 participants (12%) were withdrawn for provision of human milk and necrotizing enterocolitis 8 of 23 participants (22%) were lost to follow‐up |
| Selective reporting (reporting bias) | Low risk | No concerns |
| Other bias | Low risk | No concerns |
Cooke 2006.
| Study characteristics | ||
| Methods | RCT: balanced cross‐over design Blinding of randomization: no Blinding of intervention: yes Complete follow‐up: yes Blinding of outcome: outcomes objective, and study described as double‐blind |
|
| Participants | 18 infants Inclusion criteria: preterm infants with birth weight ≤ 1500 grams and gestational age ≤ 32 weeks were eligible if they were clinically stable and had received feeding volumes of at least 130 mL/kg/d, had not received postnatal steroids or diuretics, and had received no oxygen therapy by the time the first balance study was due Studies were conducted at the Royal Victoria Infirmary, Newcastle upon Tyne, UK, and at Service Universitaire de Neonatologie Liege, Liege, Belgium |
|
| Interventions | 9 infants were first fed the RgPro (3.0 g/100 kcal), and 9 infants were first fed the HighPro (3.6 g/100 kcal), with a minimum equilibration period of 72 hours and a balance period of 48 hours | |
| Outcomes | Nitrogen balance, metabolic status, growth | |
| Notes | Differences between formulas were noted in total amounts of sodium (20%), copper (19%), potassium (13%), magnesium (23%), and chloride (11%); in the proportions of carbohydrates provided by lactose and maltodextrin; and in the proportions of fats as medium‐chain triglycerides | |
| Risk of bias | ||
| Bias | Authors' judgement | Support for judgement |
| Random sequence generation (selection bias) | High risk | Not described |
| Allocation concealment (selection bias) | High risk | Not described |
| Blinding (performance bias and detection bias) All outcomes | Low risk | Described as double‐blind |
| Blinding of participants and personnel (performance bias) All outcomes | Low risk | Described as double‐blind |
| Blinding of outcome assessment (detection bias) All outcomes | Low risk | Described as double‐blind |
| Incomplete outcome data (attrition bias) All outcomes | Low risk | Outcomes objective |
| Selective reporting (reporting bias) | Low risk | All results reported |
| Other bias | Low risk | No concerns |
Embleton 2005.
| Study characteristics | ||
| Methods | RCT: numbered envelopes Blinding of randomization: yes Blinding of intervention: yes (bottle color coded by manufacturer) Complete follow‐up: no Blinding of outcome: cannot tell 88 infants eligible, 77 enrolled, 9 sets of parents refused, and 2 sets of parents not available to obtain consent 1 infant died post discharge because of sudden unexpected death in infancy. 2 infants were readmitted to the hospital and were mechanically ventilated because of acute viral illness. These 3 infants were included in the analysis when data were available. At term, corrected age data were available on only 74 infants (96% follow‐up), and at 12 weeks corrected age, data were available on only 73 infants (95% follow‐up). 68 of 77 (88%) infants had body composition measured (using DEXA scan) 2 weeks post discharge. 55 infants (71%) had body composition measured at 12 weeks post term. No explanation was provided with regard to infants lost to follow‐up at various time points |
|
| Participants | 88 infants Inclusion criteria: ≤ 34 weeks gestation, BW ≤ 1750 grams, AGA or SGA, enteral intake ≥ 150 mL/kg/d for ≥´48 hours, weight at enrollment ≥ 1000 grams Exclusion: infants who were ventilated, oxygen requirement ≥ 40% or on corticosteroid therapy, major congenital anomalies, gastrointestinal pathology, neurological abnormality Study entry: when infants reached enteral intake ≥ 150 mL/kg/d for ≥ 48 hours Studies were conducted at the Special Care Baby Unit, Royal Victoria Infirmary, Newcastle upon Tyne, UK Study period: infants were recruited over a 2‐year period starting in December 1997 |
|
| Interventions | Very high protein intake: 4.26 g/kg/d (n = 25) High protein intake: 3.8 g/kg/d (n = 26) and 3.5 g/kg/d (n = 26). Data for these 2 groups were combined in this review |
|
| Outcomes | Cumulative calorie and protein deficit; weight; crown‐heel length; occipitofrontal circumference; serum biochemistry including serum urea nitrogen, creatinine, total serum protein, serum albumin, pH, and base deficit; body composition (measured by whole‐body DEXA scan) including lean mass, fat mass, percentage fat mass, bone mineral content, and bone mineral density | |
| Notes | Formulas identical in osmolality and in mineral and vitamin content. Taurine, nucleotides, and long‐chain polyunsaturated fats included in formulas | |
| Risk of bias | ||
| Bias | Authors' judgement | Support for judgement |
| Random sequence generation (selection bias) | Unclear risk | Not described |
| Allocation concealment (selection bias) | Low risk | Numbered opaque envelopes |
| Blinding (performance bias and detection bias) All outcomes | Low risk | Bottle color coded by manufacturer |
| Blinding of participants and personnel (performance bias) All outcomes | Low risk | Bottle color coded by manufacturer |
| Blinding of outcome assessment (detection bias) All outcomes | Unclear risk | Not described ‐ masking possible but not certain |
| Incomplete outcome data (attrition bias) All outcomes | Low risk | 88 infants eligible, 77 enrolled ‐ 9 sets of parents refused and 2 sets of parents were not available to obtain consent 1 infant died post discharge because of sudden unexpected death in infancy. 2 infants were readmitted to hospital and were mechanically ventilated because of acute viral illness. These 3 infants were included in the analysis when data were available At term corrected age, data were available on 74 infants (96% follow‐up), and at 12 weeks corrected age, data were available on 73 infants (95% follow‐up). 68 of 77 (88%) infants had body composition measured (by DEXA scan) 2 weeks post discharge. 55 infants (71%) had body composition measured at 12 weeks post term. No explanation was provided with regard to infants lost to follow‐up at various time points |
| Selective reporting (reporting bias) | Low risk | No concerns |
| Other bias | Low risk | No concerns |
Goldman 1969.
| Study characteristics | ||
| Methods | RCT: random sequence Infants assigned within the following birth weight groups: < 1000 grams, 1000 to 1499 gram male, 1000 to 1499 grams female, 1500 to 2000 gram male, 1500 to 2000 gram female, and twins Blinding of randomization: cannot tell Blinding of intervention: yes (physician, nurses, and others) Complete follow‐up: no Blinding of outcome: no (1 physician aware of code for translation and did assessments of infants) 5 infants (1.6%) were withdrawn from the study: 2 infants (0.7%) in the low protein intake group died as the result of apneic episodes, 2 infants (1.3%) in the high protein group and 1 infant (0.7%) in the low protein intake group were withdrawn from the study after they developed diarrhea |
|
| Participants | 304 infants < 2000 grams birth weight Inclusion criteria: no major congenital anomalies, intestinal obstruction, Rh disease Exclusion criteria: infants more than 3 days of age on admission to the nursery, infants who died in the first few days of life Studies were conducted at the Long Island Jewish Hospital Premature Nursery, NY, USA Study period:between July 1963 and October 1965 |
|
| Interventions | Very high protein intake: 6 to 7.2 g/kg/d (n = 152). High protein intake: 3 to 3.6 g/kg/d (n = 152)
Formulas differed in nutrient content; very high protein formula was 17% higher in minerals Feeding was initiated within 72 hours after birth with the initial 2 feedings of 5% dextrose water. Formula was increased gradually to 150 to 180 mL/kg/d |
|
| Outcomes | Axillary temperature, weight, edema, lethargy, nipple feeding efforts, cyanosis, central nervous system symptoms, apnea, abdominal distention, diarrhea, serum albumin Goldman 1971 reported outcomes at 3 years of life: physical abnormalities, incidence of strabismus, and Stanford‐Binet test of IQ Goldman 1974 reported 5‐ to 7‐year follow‐up outcomes on survivors (81%): interval history, physical exam, Stanford‐Binet IQ, and strabismus |
|
| Notes | Study took place before routine use of parenteral nutrition | |
| Risk of bias | ||
| Bias | Authors' judgement | Support for judgement |
| Random sequence generation (selection bias) | High risk | Random sequence Infants assigned to the following birth weight groups: < 1000 grams, 1000 to 1499 gram male, 1000 to 1499 gram female, 1500 to 2000 gram male, 1500 to 2000 gram female, and twins |
| Allocation concealment (selection bias) | High risk | Blinding of randomization: cannot tell |
| Blinding (performance bias and detection bias) All outcomes | Low risk | Blinding of intervention: yes (physician, nurses, and others) |
| Blinding of participants and personnel (performance bias) All outcomes | Low risk | Blinding of intervention: yes (physician, nurses, and others) |
| Blinding of outcome assessment (detection bias) All outcomes | High risk | Blinding of outcome: no (1 physician aware of code for translation and did assessments of infants) |
| Incomplete outcome data (attrition bias) All outcomes | Unclear risk | Complete follow‐up: no 5 infants (1.6%) were withdrawn from the study: 2 infants (0.7%) in the low protein intake group died as the result of apneic episodes, 2 infants (1.3%) in the high protein group and 1 infant (0.7%) in the low protein intake group were withdrawn from the study after they developed diarrhea |
| Selective reporting (reporting bias) | Low risk | No concerns |
| Other bias | Low risk | No concerns |
Hillman 1994.
| Study characteristics | ||
| Methods | RCT: infants randomly assigned, by a previously generated random assignment table, to 1 of 3 formulas before initiation of feeding Infants assigned within 3 weight group strata: < 1000 grams, 1000 to 1250 grams, 1250 to 1500 grams Blinding of randomization: yes Blinding of intervention: cannot tell Complete follow‐up: no Blinding of outcome: cannot tell 5 infants (19%) failed to complete at least 4 weeks of the study as a result of: transfer to other hospitals, necrotizing enterocolitis, sepsis, and respiratory deterioration. These 5 infants were equally distributed between groups and were replaced in their formula assignment by 5 additional infants High attrition at 6 weeks; only 13 of 27 infants remaining in the study 27 infants assessed at 2 and 4 weeks, and 13 infants assessed at 6 weeks of age |
|
| Participants | 27 infants < 1500 grams Inclusion criteria: breathing room air, off total parenteral nutrition and diuretics Studies were conducted at the Department of Child Health, University of Missouri Medical School, Washington University, St Louis, Missouri, USA |
|
| Interventions | High protein intake: 3.6 g/kg/d (n = 9); 3.2 g/kg/d (n = 9). Data for these 2 groups were combined in this review Low protein intake: 2.8 g/kg/d (n = 9) Formulas had identical nutrient content except for protein Infants enrolled when taking total fluid intake enterally. Infants assessed at 2‐week intervals while receiving study formula |
|
| Outcomes | Weight gain (birth to 30 days of age); growth of length and head circumference; time to discharge; serum calcium, phosphorus, and magnesium; bone mineral content; bone width; serum albumin; parathyroid hormone levels; urinary calcium/creatinine ratio; phosphorus/creatinine ratio; aminoaciduria; beta 2‐microglobulins; N‐acetylglucosamine | |
| Notes | Infants could not be on total parenteral nutrition at the time of enrollment Unclear when infants were switched from study to "regular" formula In several infants, aminoaciduria persisted after change to standard formula was made |
|
| Risk of bias | ||
| Bias | Authors' judgement | Support for judgement |
| Random sequence generation (selection bias) | Low risk | Infants randomly assigned, by a previously generated random assignment table, to 1 of 3 formulas before initiation of feeding |
| Allocation concealment (selection bias) | High risk | Not described |
| Blinding (performance bias and detection bias) All outcomes | High risk | Cannot tell |
| Blinding of participants and personnel (performance bias) All outcomes | High risk | Cannot tell |
| Blinding of outcome assessment (detection bias) All outcomes | High risk | Cannot tell |
| Incomplete outcome data (attrition bias) All outcomes | High risk | Complete follow‐up: no 5 infants (19%) failed to complete at least 4 weeks of the study as a result of transfer to other hospitals, necrotizing enterocolitis, sepsis, and respiratory deterioration. These 5 infants were equally distributed between groups and were replaced in their formula assignment by 5 additional infants High attrition at 6 weeks; only 13 of 27 infants remaining in the study 27 infants assessed at 2 and 4 weeks, and 13 infants assessed at 6 weeks of age |
| Selective reporting (reporting bias) | Low risk | No concerns |
| Other bias | Low risk | No concerns |
Kashyap 1986.
| Study characteristics | ||
| Methods | RCT: states infants randomly assigned Blinding of randomization: cannot tell Blinding of intervention: yes (investigators and nurses) Complete follow‐up: no Blinding of outcome: cannot tell 7 infants (21%; 2 in group 1, 2 in group 2, and 3 in group 3) were withdrawn for medical conditions (e.g. PDA) that limited intake (3 infants), necrotizing enterocolitis (2 infants), diarrhea (1 infant), and inadequate stool or urine collection (1 infant) |
|
| Participants | 34 LBW infants weighing between 900 and 1750 grams at birth, with gestational age between 27 and 37 weeks, met the following inclusion criteria: no gastrointestinal tract disease, pulmonary disease severe enough to produce acidosis or to necessitate prolonged ventilatory assistance 27 infants completed the study ‐ 9 in each group Studies were conducted at the Babies Hospital (Presbyterian Hospital), New York, USA |
|
| Interventions | High protein intake: 3.6 g/kg/d (n = 9) Low protein intake: 2.2 g/kg/d (n = 9) Formulas had identical nutrient content except for protein As soon as enteral feedings were tolerated, the assigned formula was started. Formula increased until intake of 180 mL/kg/d was reached, and this was maintained throughout the study period (until infants reached 2200 grams) |
|
| Outcomes | Weight, length, head circumference, triceps and subscapular skin‐fold thickness, nutrient balance (N, Na, K, Cl, Ca, and P), blood urea nitrogen, albumin and transthyretin, acid‐base status, alkaline phosphatase, plasma amino acid levels Secondary analysis of this study was published in Schulze 1987, which reported the following outcomes: metabolizable energy, energy expenditure, stored energy |
|
| Notes | Does not mention total parenteral nutrition. However, Schulze states that monitoring began when full feedings were tolerated. The term "full feedings" was not defined Both carbohydrates and fats were altered to make the formulas isocaloric |
|
| Risk of bias | ||
| Bias | Authors' judgement | Support for judgement |
| Random sequence generation (selection bias) | High risk | Cannot tell |
| Allocation concealment (selection bias) | High risk | Cannot tell |
| Blinding (performance bias and detection bias) All outcomes | Low risk | Blinding of intervention: investigators and nurses |
| Blinding of participants and personnel (performance bias) All outcomes | Low risk | Blinding of intervention: investigators and nurses |
| Blinding of outcome assessment (detection bias) All outcomes | Low risk | Blinding of intervention: investigators and nurses |
| Incomplete outcome data (attrition bias) All outcomes | High risk | Complete follow‐up: no 7 infants (21%; 2 in group 1, 2 in group 2, and 3 in group 3) were withdrawn for medical conditions (e.g. PDA) that limited intake (3 infants), necrotizing enterocolitis (2 infants), diarrhea (1 infant), and inadequate stool or urine collection (1 infant) |
| Selective reporting (reporting bias) | Low risk | No concerns |
| Other bias | Low risk | No concerns |
Kashyap 1988.
| Study characteristics | ||
| Methods | RCT: assigned randomly Blinding of randomization: cannot tell Blinding of intervention: yes (investigators and nurses) Complete follow‐up: no Blinding of outcome: cannot tell 6 infants (12%) (2 in group 1, 1 in group 2, and 3 in group 3) were withdrawn for medical conditions (e.g. PDA) that limited intake (2 infants), necrotizing enterocolitis (2 infants), failed to tolerate 180 mL/kg/d (1 infant), and severe gastroesophageal reflux (1 infant) |
|
| Participants | 50 LBW infants weighing between 900 and 1750 grams at birth Inclusion criteria: no gastrointestinal disease, renal disease, pulmonary disease Studies were conducted at the Babies Hospital (Presbyterian Hospital), New York, USA |
|
| Interventions | High protein intake: 3.8 g/kg/d (n = 15) Low protein intake: 2.8 g/kg/d (n = 14) Formulas varied, with K 14% higher in high protein formula, and Ca and Mg 15% and 20% higher, respectively, in low protein formula Assigned formula was started as soon as enteral feedings were tolerated. Formula increased until intake of 180 mL/kg/d was reached, and this was maintained throughout the study period (until infants reached 2200 grams) |
|
| Outcomes | Weight, length, head circumference, triceps and subscapular skin‐fold thickness, nutrient balance (N, Na, K, Cl, Ca, and P), blood urea nitrogen, albumin and transthyretin, acid‐base status and alkaline phosphatase, plasma amino acids, nutrient retention, energy balance, composition of weight gain | |
| Notes | Both carbohydrates and fats in the formulas were altered to make formulas isocaloric | |
| Risk of bias | ||
| Bias | Authors' judgement | Support for judgement |
| Random sequence generation (selection bias) | High risk | Cannot tell |
| Allocation concealment (selection bias) | High risk | Cannot tell |
| Blinding (performance bias and detection bias) All outcomes | Low risk | Blinding of intervention: investigators and nurses |
| Blinding of participants and personnel (performance bias) All outcomes | Low risk | Blinding of intervention: investigators and nurses |
| Blinding of outcome assessment (detection bias) All outcomes | Low risk | Blinding of intervention: investigators and nurses |
| Incomplete outcome data (attrition bias) All outcomes | High risk | Complete follow‐up: no 6 infants (12%) (2 in group 1, 1 in group 2, and 3 in group 3) were withdrawn for medical conditions (e.g. PDA) that limited intake (2 infants), necrotizing enterocolitis (2 infants), failed to tolerate 180 mL/kg/d (1 infant), and severe gastroesophageal reflux (1 infant) |
| Selective reporting (reporting bias) | Low risk | No concerns |
| Other bias | Low risk | No concerns |
Raiha 1976.
| Study characteristics | ||
| Methods | RCT: assigned randomly Blinding of randomization: cannot tell Blinding of intervention: yes Complete follow‐up: no Blinding of outcome: yes 3 infants (3%) were dropped from the study during the 3 days because of respiratory problems. All other infants were in the study for at least 3 weeks. 2 infants were withdrawn at 3 and 3½ weeks because of progressive metabolic acidosis and "progressive nitrogen retention" |
|
| Participants | 106 infants Inclusion criteria: free of physical abnormality or obvious disease, gestational age between 28 and 36 weeks, birth weight < 2100 g, size appropriate for gestational age Studies were conducted at the Premature Unit of the Helsinki University Children's Hospital, Helsinki, Finland Study period: between April 1972 and January 1975 |
|
| Interventions | Very high protein intake: 4.5 g/kg/d (n = 41) Low protein intake: 2.3 g/kg/d (n = 43) Whey:casein ratios were 40:60 or 82:18. Whey‐based formula: K (17%), Ca (15%), and P (12%) were higher in the high protein intake formula Casein‐based formula: Na (28%) and Mg (12%) were higher in the low protein intake formula Feedings began before 24 hours of age, and volume increased gradually until infants reached 150 mL/kg/d, providing 2.3 or 4.5 g/kg/d of protein. This intake was maintained until infants reached 2400 grams |
|
| Outcomes | Weight (reported as initial weight loss, rate of gain from regained birth weight to 2400 grams, time from birth to regained BW, time from regained BW to 2400 grams, time from birth to 2400 grams), vomiting, edema, hypoglycemia, acid‐base studies, mean temperature, linear and head circumference growth, BUN, serum ammonia, urine osmolality, albumin 4 publications from the same study 2nd publication reported selected aliphatic amino acids in plasma and urine (Rassin 1977a) 3rd publication reported levels of sulfur amino acids in plasma and urine (Gaull 1977) 4th publication reported levels of tyrosine and phenylalanine in plasma and urine (Rassin 1977b) |
|
| Notes | Study took place before routine use of parenteral nutrition Lactose content varied to keep formulas isocaloric |
|
| Risk of bias | ||
| Bias | Authors' judgement | Support for judgement |
| Random sequence generation (selection bias) | High risk | Assigned randomly |
| Allocation concealment (selection bias) | High risk | Blinding of randomization: cannot tell |
| Blinding (performance bias and detection bias) All outcomes | Low risk | Blinding of intervention: yes |
| Blinding of participants and personnel (performance bias) All outcomes | Unclear risk | Blinding of intervention: yes |
| Blinding of outcome assessment (detection bias) All outcomes | Unclear risk | Blinding of outcome: yes |
| Incomplete outcome data (attrition bias) All outcomes | High risk | Complete follow‐up: no 3 infants (3%) were dropped from the study during the first 3 days because of respiratory problems. All other infants were in the study for at least 3 weeks. 2 infants were withdrawn at 3 and 3½ weeks because of progressive metabolic acidosis and "progressive nitrogen retention" |
| Selective reporting (reporting bias) | Low risk | No concerns |
| Other bias | Low risk | No concerns |
Svenningsen 1982a.
| Study characteristics | ||
| Methods | RCT: no details Blinding of randomization: cannot tell Blinding of intervention: cannot tell Complete follow‐up: no Blinding of outcome: cannot tell 1 death in the human milk–fed group. 1 infant in the high protein group was lost to follow‐up |
|
| Participants | 48 VLBW and preterm infants (n = 18 in human milk group) No inclusion/exclusion criteria Studies were conducted at the Department of Paediatrics, University of Lund, Sweden |
|
| Interventions | High protein intake: 3.2 g/kg/d (n = 16) Low protein intake: 2.6 g/kg/d (n = 14) Formulas had identical nutrient content except for protein TFI = 170 mL/kg/d |
|
| Outcomes | Mean weight, body length, head circumference, albumin, urea‐N, metabolic acidosis Second study (n = 46) reported long‐term follow‐up growth parameters until 2 years of age and neurodevelopmental outcomes at 6 months, 1 year, and 2 years of age (Svenningsen 1982a). Also measured B‐hemoglobin and B‐hematocrit on capillary samples |
|
| Notes | Birth to second week: IV glucose, electrolytes, some on parenteral nutrition (note: some infants given pooled human milk) Infants not randomly assigned until third week of life Formulas made isocaloric; however, energy source not specified End of second week: all fed orally with human milk Definition of "septicemia" unclear |
|
| Risk of bias | ||
| Bias | Authors' judgement | Support for judgement |
| Random sequence generation (selection bias) | High risk | No details |
| Allocation concealment (selection bias) | High risk | Cannot tell |
| Blinding (performance bias and detection bias) All outcomes | Unclear risk | Cannot tell |
| Blinding of participants and personnel (performance bias) All outcomes | Unclear risk | Cannot tell |
| Blinding of outcome assessment (detection bias) All outcomes | Unclear risk | Cannot tell |
| Incomplete outcome data (attrition bias) All outcomes | Unclear risk | Complete follow‐up: no 1 death in the human milk–fed group. 1 infant in the high protein group was lost to follow‐up |
| Selective reporting (reporting bias) | Low risk | No concerns |
| Other bias | Low risk | No concerns |
Wauben 1995.
| Study characteristics | ||
| Methods | RCT: infants randomly allocated via a computer‐created randomization table Blinding of randomization: cannot tell Blinding of intervention: no Complete follow‐up: yes Blinding of outcome: no (personal communication July 10, 2003) |
|
| Participants | 16 appropriate for gestational age "healthy" infants between 28 and 35 weeks Personal communication July 10, 2003: eligible infants 1000 to 2500 grams, AGA, no history of necrotizing enterocolitis Studies were conducted at the Academic Hospital Maastricht, Maastricht, The Netherlands |
|
| Interventions | High protein intake: 3.1 g/kg/d (n = 8) Low protein intake: 2.7 g/kg/d (n = 8) Nutrient intakes other than protein and energy were not reported Study started when infants were receiving full enteral feeding (TFI = 160 mL/kg/d) Study period 10 days: 2 days for adaptation to study formula, 8 days for observation |
|
| Outcomes | Protein accretion, weight gain, energy, protein balance | |
| Notes | ||
| Risk of bias | ||
| Bias | Authors' judgement | Support for judgement |
| Random sequence generation (selection bias) | Low risk | Randomly allocated via a computer‐created randomization table |
| Allocation concealment (selection bias) | Unclear risk | Cannot tell |
| Blinding (performance bias and detection bias) All outcomes | High risk | No |
| Blinding of participants and personnel (performance bias) All outcomes | Unclear risk | No |
| Blinding of outcome assessment (detection bias) All outcomes | Unclear risk | Blinding of outcome: no (personal communication July 10, 2003) |
| Incomplete outcome data (attrition bias) All outcomes | Low risk | Complete follow‐up: yes |
| Selective reporting (reporting bias) | Low risk | No concerns |
| Other bias | Low risk | No concerns |
Status as of April 2020 of additional data requested from authors
Bhatia 1991 Provided data on length, head circumference, and blood urea nitrogen levels. Data on length and head circumference were not reported in a manner that would permit inclusion in this systematic review. Last correspondence August 14, 2003.
Provided data on double‐blinding, which was maintained until end of study.
Hillman 1994 Awaiting information on head circumference, length, and incidence of stage II or greater necrotizing enterocolitis. Last correspondence September 3, 2003.
Kashyap 1986 Provided data on age when level of plasma amino acids was assessed, criteria for diagnosis of necrotizing enterocolitis, and clarification of units of measurement for blood urea nitrogen. Last correspondence June 30, 2004.
Raiha 1976 Provided data on phenylalanine levels. Last correspondence October 27, 2004.
Svenningsen 1982a Awaiting information on length, head circumference, pH, base deficit, and neurodevelopmental outcomes. Awaiting clarification regarding definition of "septicemia." Last correspondence January 24, 2004.
Wauben 1995 Provided data on necrotizing enterocolitis and clarified that all infants enrolled in the study weighed < 2.5 kg, and that there was no blinding of investigators. Last correspondence July 9, 2003.
Abbreviations
AGA = appropriate for gestational age.
BUN = blood urea nitrogen.
BW = body weight.
DEXA = dual‐energy x‐ray absorptiometry.
IQ = intelligence quotient.
IV = intravenous.
LBW = low birth weight.
PDA = patent ductus arteriosus.
RCT = randomized controlled trial.
SGA = small for gestational age.
TFI = total fluid intake.
VLBW = very low birth weight.
Characteristics of excluded studies [ordered by study ID]
| Study | Reason for exclusion |
|---|---|
| Bell 1986 | Compared intakes of protein whereby groups fell within the same predesignated high protein intake group (3.4 and 3.9 g/kg/d) |
| Brumberg 2010 | Not eligible because infants were receiving parenteral nutrition and breast milk as well |
| Clark 2009 | Not the intervention of interest, as higher doses of amino acid supplementation in parenteral nutrition were examined |
| Cooke 2014 | Both protein intakes fell within the same predesignated criterion of low protein intake (3.0 and 3.6 g/kg/d) |
| Costa‐Orvay 2011 | Not eligible because the energy difference (16%) is greater than the pro difference (A vs B 13%) and the comparison B vs C does not fit the predefined protein categories (both are in the high group) |
| Darling 1985 | Not the intervention of interest, as formulas differed in quality of protein (different ratio of whey‐casein and casein hydrolysate) |
| Davidson 1967 | Experimental protocol was modified during the study period (see p 700). Selective exclusion of infants based on review of clinical course (done before deciphering feeding code) |
| Fairey 1997 | Compared intakes of protein whereby groups fell within the same predesignated high protein intake group (3.1 and 3.7 g/kg/d) |
| Fanaro 2010 | Not eligible because it was not random and infants were receiving breast milk as well |
| Fewtrell 1997 | Compared intakes of protein whereby groups fell within the same predesignated high protein intake group (3.6 and 3.9 g/kg/d) |
| Greer 1988 | Both protein intakes fell within the same predesignated criterion of low protein intake (2.8 and 2.9 g/kg/d) |
| Lucas 1990 | Infants received parenteral nutrition during the study period |
| Mihatsch 2001 | Not the intervention of interest, as comparing high lactose vs negligible lactose. Did not meet all criteria of relevance ‐ infants receiving study formula and total parenteral nutrition |
| Mimouni 1989 | No numerical data |
| Moro 1984 | Not the intervention of interest, as protein intake was the same in comparison groups |
| Nichols 1966 | Incomplete data: reported means but no standard deviations |
| Picaud 2001 | Not the intervention of interest, as compared quality of protein (partially hydrolyzed vs standard formula) |
| Singhal 2010 | Not eligible because participants were term infants |
| Siripoonya 1989 | Not the intervention of interest, as compared quality of protein (special care formula vs standard whey predominant formula) |
| Spencer 1992 | Compared intakes of protein whereby groups fell within the same predesignated low protein intake group (2.9 and 2.95 g/kg/d) |
| Szajewska 2001 | Compared intakes of protein whereby groups fell within the same predesignated high protein intake group (3.3 and 3.8 g/kg/d) |
| Tan 2008 | Not the intervention of interest, as comparing hyperalimented or standard parenteral and enteral nutrition |
| Thom 1984 | No numerical data |
| van Goudoever 2000 | Not intervention of interest, as compared normal energy vs low energy formula. Compared intakes of protein whereby groups fell within the same predesignated high protein intake group (3.3 and 3.3 g/kg/d) |
Differences between protocol and review
As of July 2019, Cochrane Neonatal no longer searches Embase for its reviews. RCTs and controlled clinical trials (CCTs) from Embase are added to the Cochrane Central Register of Controlled Trials (CENTRAL) via a robust process (see How CENTRAL is created). Cochrane Neonatal has validated its searches to ensure that relevant Embase records are found while searching CENTRAL.
Also starting in July 2019, Cochrane Neonatal no longer searches for RCTs and CCTs from ClinicalTrials.gov nor from the World Health Organization’s International Clinical Trials Registry Platform (ICTRP), as records from both platforms are added to CENTRAL on a monthly basis (see How CENTRAL is created). Comprehensive search strategies are executed in CENTRAL to retrieve relevant records. The ISRCTN (at http://www.isrctn.com/, formerly Controlled‐trials.com) is searched separately.
For the 2020 review update, we added the methods and plan for "Summary of findings" tables and GRADE recommendations, which were not included in the previous publication of this review (Fenton 2014).
Contributions of authors
S. Premji (SSP) and T. Fenton (TRF): wrote protocol, searched for trials, selected studies, extracted data, wrote review. SSP: input data into RevMan 5 (Review Manager 2014), performed data analyses.
H. Al‐Wassia (HA): searched for trials, selected studies, extracted data, input data into RevMan 5. TRF: searched for trials, corresponded with study authors, double‐checked data entry, performed data analyses, input data into RevMan 5, revised the review. R. Sauve (RSS): served as principal investigator on intramural support, facilitated consensus decision‐making, revised review.
Sources of support
Internal sources
Perinatal Funding Competition, Canada
Alberta Children's Hospital, Canada
External sources
-
Vermont Oxford Network, USA
Cochrane Neonatal Reviews are produced with support from Vermont Oxford Network, a worldwide collaboration of health professionals dedicated to providing evidence‐based care of the highest quality for newborn infants and their families.
-
The Gerber Foundation, USA
Editorial support for this review, as part of a suite of preterm nutrition reviews, has been provided by a grant from The Gerber Foundation. The Gerber Foundation is a separately endowed, private, 501(c)(3) foundation not related to Gerber Products Company in any way.
-
National Institute for Health Research, UK
Editorial support for Cochrane Neonatal has been funded with funds from a UK National Institute of Health Research (NIHR) Cochrane Programme Grant (16/114/03). The views expressed in this publication are those of the authors and are not necessarily those of the National Health Service, the NIHR, or the UK Department of Health.
Declarations of interest
TRF has no interests to declare.
SSP has no interests to declare.
HA has no interests to declare.
RSS has no interests to declare.
Core editorial and administrative support for this review has been provided by a grant from The Gerber Foundation. The Gerber Foundation is a separately endowed, private foundation, independent from the Gerber Products Company. The grantor has no input on the content of the review nor on the editorial process (see Sources of support).
To maintain the utmost editorial independence for this Cochrane Review, an editor outside of the Cochrane Neonatal Burlington, Vermont, office who is not receiving any financial remuneration from the grant, William McGuire, was the Sign‐off Editor for this review. Additionally, a Senior Editor from the Cochrane Children and Families Network, Robert Boyle, assessed and signed off on this Cochrane Review.
Edited (no change to conclusions)
References
References to studies included in this review
Bhatia 1991 {published and unpublished data}
- Bhatia J, Rassin DK, Cerreto MC, Bee DE. Effect of protein/energy ratio on growth and behavior of premature infants: preliminary findings. Journal of Pediatrics 1991;119(1 Pt 1):103-10. [PMID: 2066840 ] [DOI] [PubMed] [Google Scholar]
Cooke 2006 {published and unpublished data}
- Cooke R, Embleton N, Rigo J, Carrie A, Haschke F, Ziegler E. High protein pre-term infant formula: effect on nutrient balance, metabolic status and growth. Pediatric Research 2006;59(2):265-70. [PMID: ] [DOI] [PubMed] [Google Scholar]
Embleton 2005 {published data only (unpublished sought but not used)}
- Embleton ND, Cooke RJ. Protein requirements in preterm infants: effect of different levels of protein intake on growth and body composition. Pediatric Research 2005;58(5):855-60. [PMID: ] [DOI] [PubMed] [Google Scholar]
Goldman 1969 {published data only}
- *.Goldman HI, Freudenthal R, Holland B, Karelitz S. Clinical effects of two different levels of protein intake on low-birth-weight infants. Journal of Pediatrics 1969;74(6):881-9. [PMID: ] [DOI] [PubMed] [Google Scholar]
- Goldman HI, Goldman JS, Kaufman I, Liebman OB. Late effects of early dietary protein intake on low-birth-weight infants. Journal of Pediatrics 1974;85(6):764-9. [PMID: 4472449 ] [DOI] [PubMed] [Google Scholar]
- Goldman HI, Liebman OB, Freudenthal R, Reuben R. Effects of early dietary protein intake on low-birth-weight infants: evaluation at 3 years of age. Journal of Pediatrics 1971;78(1):126-9. [PMID: 5539071 ] [DOI] [PubMed] [Google Scholar]
Hillman 1994 {published data only}
- Hillman LS, Salmons SS, Erickson MM, Hansen JW, Hillman RE, Chesney R. Calciuria and aminoaciduria in very low birth weight infants fed a high-mineral premature formula with varying levels of protein. Journal of Pediatrics 1994;125(2):288-94. [PMID: 8040780 ] [DOI] [PubMed] [Google Scholar]
Kashyap 1986 {published and unpublished data}
- *.Kashyap S, Forsyth M, Zucker C, Ramakrishnan R, Dell RB, Heird WC. Effects of varying protein and energy intakes on growth and metabolic response in low birth weight infants. Journal of Pediatrics 1986;108(6):955-63. [PMID: 3712165 ] [DOI] [PubMed] [Google Scholar]
- Schulze KF, Stefanski M, Masterson J, Spinnazola R, Ramakrishnan R, Dell RB, et al. Energy expenditure, energy balance, and composition of weight gain in low birth weight infants fed diets of different protein and energy content. Journal of Pediatrics 1987;110(5):753-9. [PMID: ] [DOI] [PubMed] [Google Scholar]
Kashyap 1988 {published data only}
- Kashyap S, Schulze KF, Forsyth M, Zucker C, Dell RB, Ramakrishnan R, et al. Growth, nutrient retention, and metabolic response in low birth weight infants fed varying intakes of protein and energy. Journal of Pediatrics 1988;113(4):713-21. [PMID: ] [DOI] [PubMed] [Google Scholar]
Raiha 1976 {published data only}
- Gaull GE, Rassin DK, Raiha NC, Heinonen K. Milk protein quantity and quality in low-birth-weight infants. III. Effects on sulfur amino acids in plasma and urine. Journal of Pediatrics 1977;90(3):348-55. [PMID: ] [DOI] [PubMed] [Google Scholar]
- *.Raiha NC, Heinonen K, Rassin DK, Gaull GE. Milk protein quantity and quality in low-birthweight infants. I. Metabolic responses and effects on growth. Pediatrics 1976;57(5):659-84. [PMID: ] [PubMed] [Google Scholar]
- Rassin DK, Gaull GE, Heinonen K, Raiha NC. Milk protein quantity and quality in low-birth-weight infants. II. Effects on selected aliphatic amino acids in plasma and urine. Pediatrics 1977;59(3):407-22. [PMID: ] [PubMed] [Google Scholar]
- Rassin DK, Gaull GE, Raiha NC, Heinonen K. Milk protein quantity and quality in low-birth-weight infants. IV. Effects of tyrosine and phenylalanine in plasma and urine. Journal of Pediatrics 1977;90(3):356-60. [PMID: 839327 ] [DOI] [PubMed] [Google Scholar]
Svenningsen 1982a {published data only}
- *.Svenningsen NW, Lindroth M, Lindquist B. A comparative study of varying protein intake in low birthweight infant feeding. Acta Paediatrica Scandinavica 1982;Suppl 296:28-31. [PMID: ] [DOI] [PubMed] [Google Scholar]
- Svenningsen NW, Lindroth M, Lindquist B. Growth in relation to protein intake of low birth weight infants. Early Human Development 1982;6(1):47-58. [PMID: 7056196] [DOI] [PubMed] [Google Scholar]
Wauben 1995 {published and unpublished data}
- Wauben I, Westerterp K, Gerver WJ, Blanco C. Effect of varying protein intake on energy balance, protein balance and estimated weight gain composition in premature infants. European Journal of Clinical Nutrition 1995;49(1):11-6. [PMID: ] [PubMed] [Google Scholar]
References to studies excluded from this review
Bell 1986 {published data only}
- Bell A, Halliday H, McClure G, Reid M. Controlled trial of new formulae for feeding low birth weight infants. Early Human Development 1986;13(1):97-105. [PMID: 3514202 ] [DOI] [PubMed] [Google Scholar]
Brumberg 2010 {published and unpublished data}
- Brumberg HL, Kowalski L, Troxell-Dorgan A, Gettner P, Konstantino M, Poulsen JF, et al. Randomized trial of enteral protein and energy supplementation in infants less than or equal 1250g at birth. Journal of Perinatology 2010;30(8):517-21. [PMID: 20200540 ] [DOI] [PubMed] [Google Scholar]
Clark 2009 {published data only}
- Clark RH, Chace DH, Spitzer AR, Pediatrix Amino Acid Study Group. Effects of two different doses of amino acid supplementation on growth and blood amino acid levels in premature neonates admitted to the neonatal intensive care unit: a randomized, controlled trial. Pediatrics 2007;120(6):1286-96. [PMID: 18055678 ] [DOI] [PubMed] [Google Scholar]
Cooke 2014 {published data only (unpublished sought but not used)}
- Cooke R, Embleton N, Rigo J, Picaud JC, Ziegler EE, Steenhout P, et al. O-085 dietary protein In the very-low-birth-weight infant: multicenter randomised controlled trial to evaluate the effects of dietary protein level on growth. Archives of Disease in Childhood 2014;99:A57. [DOI: 10.1136/archdischild-2014-307384.153] [DOI] [Google Scholar]
Costa‐Orvay 2011 {published and unpublished data}
- Costa-Orvay JA, Figueras-Aloy J, Romera G, Closa-Monasterolo R, Carbonell-Estrany X. The effects of varying protein and energy intakes on the growth and body composition of very low birth weight infants. Nutrition Journal 2011;29(10):140. [PMID: 22206271 ] [DOI] [PMC free article] [PubMed] [Google Scholar]
Darling 1985 {published data only}
- Darling P, Lepage G, Tremblay P, Collet S, Kien LC, Roy CC. Protein quality and quantity in preterm infants receiving the same energy intake. American Journal of Diseases of Children 1985;139(2):186-90. [PMID: 3872061 ] [DOI] [PubMed] [Google Scholar]
Davidson 1967 {published data only}
- Davidson M, Levine SZ, Bauer CH, Dann M. Feeding studies in low-birth-weight infants. I. Relationships of dietary protein, fat, and electrolyte to rates of weight gain, clinical courses, and serum chemical concentrations. Journal of Pediatrics 1967;70(5):695-713. [PMID: ] [DOI] [PubMed] [Google Scholar]
Fairey 1997 {published data only}
- Fairey AK, Butte NF, Mehta N, Thotathuchery M, Schanler RJ, Heird WC. Nutrient accretion in preterm infants fed formula with different protein:energy ratios. Journal of Pediatric Gastroenterology and Nutrition 1997;25(1):37-45. [PMID: 9226525 ] [DOI] [PubMed] [Google Scholar]
Fanaro 2010 {published and unpublished data}
- Fanaro S, Ballardini E, Vigi V. Different pre-term formulas for different pre-term infants. Early Human Development 2010;86(Suppl 1):27-31. [PMID: 20153128 ] [DOI] [PubMed] [Google Scholar]
Fewtrell 1997 {published data only}
- Fewtrell MS, Adams C, Wilson DC, Cairns P, McClure G, Lucas A. Randomized trial of high nutrient density formula versus standard formula in chronic lung disease. Acta Paediatrica 1997;86(6):577-82. [PMID: ] [DOI] [PubMed] [Google Scholar]
Greer 1988 {published data only}
- Greer FR, McCormick A. Improved bone mineralization and growth in premature infants fed fortified own mother's milk. Journal of Pediatrics 1988;112(6):961-9. [PMID: ] [DOI] [PubMed] [Google Scholar]
Lucas 1990 {published data only}
- Lucas A, Morely R, Colet TJ. Randomised trial of early diet in preterm babies and later intelligence quotient. BMJ 1998;317(7171):1481-7. [PMID: 9831573 ] [DOI] [PMC free article] [PubMed] [Google Scholar]
- *.Lucas A, Morley R, Cole TJ, Gore SM, Lucas PJ, Crowle P, et al. Early diet in preterm babies and developmental status at 18 months. Lancet 1990;335(8704):1477-81. [PMID: 1972430 ] [DOI] [PubMed] [Google Scholar]
- Morley R, Lucas A. Randomized diet in the neonatal period and growth performance until 7.5-8 y of age in preterm children. American Journal of Clinical Nutrition 2000;71(3):822-8. [PMID: ] [DOI] [PubMed] [Google Scholar]
Mihatsch 2001 {published data only}
- Mihatsch WA, Schoenaich P, Fahnenstich H, Dehne N, Ebbecke H, Platch C, et al. Randomized multicenter trial of two different formulas for very early enteral feeding advancement in extremely-low-birth-weight infants. Journal of Pediatric Gastroenterology and Nutrition 2001;33(2):155-9. [PMID: ] [DOI] [PubMed] [Google Scholar]
Mimouni 1989 {published data only}
- Mimouni F, Steichen JJ, Landi T, Tsang RC. A randomized, controlled clinical trial on protein requirements of the growing, healthy premature infant. Pediatric Research 1989;25:294A. [Google Scholar]
Moro 1984 {published data only}
- Moro G, Minoli I, Heininger J, Cohen M, Gaull G, Raiha N. Relationship between protein and energy in the feeding of preterm infants during the first month of life. Acta Paediatrica Scandinavica 1984;73(1):49-54. [PMID: 6702449 ] [DOI] [PubMed] [Google Scholar]
Nichols 1966 {published data only}
- Nichols MM, Danford BH. Feeding premature infants: a comparison of effects on weight gain, blood and urea of two formulas with varying protein and ash composition. Southern Medical Journal 1966;59(12):1420-4. [PMID: ] [DOI] [PubMed] [Google Scholar]
Picaud 2001 {published data only}
- Picaud JC, Rigo J, Normand S, Lapillonne A, Reygrobellet B, Claris O, et al. Nutritional efficacy of preterm formula with a partially hydrolyzed protein source: a randomized pilot study. Journal of Pediatric Gastroenterology and Nutrition 2001;32(5):555-61. [PMID: 11429516 ] [DOI] [PubMed] [Google Scholar]
Singhal 2010 {published and unpublished data}
- Singhal A, Kennedy K, Lanigan J, Fewtrell M, Cole TJ, Stephenson T, et al. Nutrition in infancy and long-term risk of obesity: evidence from 2 randomized controlled trials. American Journal of Clinical Nutrition 2010;92(5):1133-44. [PMID: ] [DOI] [PubMed] [Google Scholar]
Siripoonya 1989 {published data only}
- Siripoonya P, Sasivimolkul V, Tejavej A, Hotrakitya S, Tontisirin K. Clinical trial of special premature formula for low-birth-weight infants. Journal of the Medical Association of Thailand 1989;72(Suppl 1):61-5. [PMID: ] [PubMed] [Google Scholar]
Spencer 1992 {published data only}
- Spencer SA, McKenna S, Stammers J, Hull D. Two different low birth weight formulae compared. Early Human Development 1992;30(1):21-31. [PMID: ] [DOI] [PubMed] [Google Scholar]
Szajewska 2001 {published data only}
- Szajewska H, Albrecht P, Stoinska B, Prochowaska A, Gawecka A, Laskowska-Klita T. Extensive and partial protein hydrolysate preterm formulas: the effect on growth rate, protein metabolism indices, and plasma amino acid concentrations. Journal of Pediatric Gastroenterology and Nutrition 2001;32(3):303-9. [PMID: ] [DOI] [PubMed] [Google Scholar]
Tan 2008 {published data only}
- Tan MJ, Cooke RW. Improving head growth in very preterm infants - a randomised controlled trial I: neonatal outcomes. Archives of Disease in Childhood. Fetal and Neonatal Edition 2008;93(5):F337-41. [PMID: 18252814 ] [DOI] [PubMed] [Google Scholar]
Thom 1984 {published data only}
- Thom JC, Jong G, Kotze TJ. Clinical trial of a milk formula for infants of low birth weight. South African Medical Journal 1984;65(4):125-7. [PMID: ] [PubMed] [Google Scholar]
van Goudoever 2000 {published data only}
- Goudoever JB, Sulkers EJ, Lafeber HN, Sauer PJ. Short-term growth and substrate use in very-low-birth-weight infants fed formulas with different energy contents. American Journal of Clinical Nutrition 2000;71(3):816-21. [PMID: 10702178] [DOI] [PubMed] [Google Scholar]
Additional references
AAP 2020
- American Academy of Pediatrics, Committee on Nutrition. Nutritional needs of the preterm infant. In: Pediatric Nutrition Handbook. 8th edition. Elk Grove Village: AAP, 2020. [Google Scholar]
Amissah 2018
- Amissah EA, Brown J, Harding JE. Protein supplementation of human milk for promoting growth in preterm infants. Cochrane Database of Systematic Reviews 2018, Issue 6. [DOI: 10.1002/14651858.CD000433.pub2] [PMID: ] [DOI] [PMC free article] [PubMed] [Google Scholar]
Bonsante 2013
- Bonsante F, Iacobelli S, Latorre G, Rigo J, De Felice C, Robillard PY, et al. Initial amino acid intake influences phosphorus and calcium homeostasis in preterm infants - it is time to change the composition of the early parenteral nutrition. PloS One 2013;8(8):e72880. [PMID: ] [DOI] [PMC free article] [PubMed] [Google Scholar]
Brazelton 1995
- Brazelton TB, Nugent JK. The Neonatal Behavioral Assessment Scale. Cambridge: Mac Keith Press, 1995. [Google Scholar]
Castillo‐Duran 2003
- Castillo-Duran C, Weisstaub G. Zinc supplementation and growth of the fetus and low birth weight infant. Journal of Nutrition 2003;133(5 Suppl 1):1494S-7S. [PMID: ] [DOI] [PubMed] [Google Scholar]
Fenton 2019
- Fenton TR, Griffin IJ, Hoyos A, Groh-Wargo S, Anderson D, Ehrenkranz RA, et al. Accuracy of preterm infant weight gain velocity calculations vary depending on method used and infant age at time of measurement. Pediatric Research 2019;85(5):650-4. [PMID: ] [DOI] [PubMed] [Google Scholar]
Fomon 1991
- Fomon SJ. Requirements and recommended dietary intakes of protein during infancy. Pediatric Research 1991;30(5):391-5. [PMID: ] [DOI] [PubMed] [Google Scholar]
Fomon 1993
- Fomon SJ. Nutrition of Normal Infants. St Louis: Mosby, 1993. [Google Scholar]
Gaull 1977
- Gaull GE, Rassin DK, Raiha NC, Heinonen K. Milk protein quantity and quality in low-birth-weight infants. III. Effects on sulfur amino acids in plasma and urine. Journal of Pediatrics 1977;90(3):348-55. [PMID: ] [DOI] [PubMed] [Google Scholar]
Gianni 2015
- Gianni ML, Roggero P, Piemontese P, Morlacchi L, Bracco B, Taroni F, et al. Boys who are born preterm show a relative lack of fat-free mass at 5 years of age compared to their peers. Acta Paediatrica (Oslo, Norway : 1992) 2015;104(3):e119-23. [PMID: ] [DOI] [PubMed] [Google Scholar]
Gidrewicz 2014
- Gidrewicz DA, Fenton TR. A systematic review and meta-analysis of the nutrient content of preterm and term breast milk. BMC Pediatrics 2014;14:216. [PMID: ] [DOI] [PMC free article] [PubMed] [Google Scholar]
Goldman 1971
- Goldman HI, Liebman OB, Freudenthal R, Reuben R. Effects of early dietary protein intake on low-birth-weight infants: evaluation at 3 years of age. Journal of Pediatrics 1971;78(1):126-9. [PMID: ] [DOI] [PubMed] [Google Scholar]
Goldman 1974
- Goldman HI, Goldman JS, Kaufman I, Liebman OB. Late effects of early dietary protein intake on low-birth-weight infants. Journal of Pediatrics 1974;85(6):764-9. [PMID: ] [DOI] [PubMed] [Google Scholar]
Goswami 2016
- Goswami I, Rochow N, Fusch G, Liu K, Marrin ML, Heckmann M, et al. Length normalized indices for fat mass and fat-free mass in preterm and term infants during the first six months of life. Nutrients 2016;8(7):1-13. [PMID: ] [DOI] [PMC free article] [PubMed] [Google Scholar]
GRADEpro GDT [Computer program]
- GRADEpro GDT. Version accessed 27 January 2020. Hamilton (ON): McMaster University (developed by Evidence Prime).Available at gradepro.org.
Griffin 2012
- Griffin IJ, Cooke RJ. Development of whole body adiposity in preterm infants. Early Human Development 2012;88(Suppl 1):S19-24. [PMID: ] [DOI] [PubMed] [Google Scholar]
Hay 1996
- Hay WW Jr. Assessing the effect of disease on nutrition of the preterm infant. Clinical Biochemistry 1996;29(5):399-417. [PMID: 8884061 ] [DOI] [PubMed] [Google Scholar]
Higgins 2011
- Higgins JP, Green S, editor(s). Cochrane Handbook for Systematic Reviews of Interventions Version 5.1.0 (updated March 2011). The Cochrane Collaboration, 2011. Available from handbook.cochrane.org.
Isojima 2015
- Isojima T, Kushima R, Goishi K, Tsuchida S, Watanabe T, Takahashi N, et al. Mineral status of premature infants in early life and linear growth at age 3. Pediatrics International : Official Journal of the Japan Pediatric Society 2015;57(5):864-9. [PMID: ] [DOI] [PubMed] [Google Scholar]
Jakobsson 1990
- Jakobsson B, Aperia A. High protein intake accelerates the maturation of Na,K-ATPase in rat renal tubules. Acta Physiologica Scandinavica 1990;139(1):1-7. [PMID: ] [DOI] [PubMed] [Google Scholar]
Kalhan 2000
- Kalhan SC, Iben S. Protein metabolism in the extremely low-birth weight infant. Clinics in Perinatology 2000;27(1):23-56. [PMID: 10690563 ] [DOI] [PubMed] [Google Scholar]
Kashyap 1994
- Kashyap S, Schulze KF, Ramakrishnan R, Dell RB, Heird WC. Evaluation of a mathematical model for predicting the relationship between protein and energy intakes of low-birth-weight infants and the rate and composition of weight gain. Pediatric Research 1994;35(6):704-12. [PMID: 7936823 ] [DOI] [PubMed] [Google Scholar]
Klein 2002
- Klein CJ. Nutrient requirements for preterm infant formulas. Journal of Nutrition 2002;132(6(Suppl 1)):1395S-577S. [PMID: ] [DOI] [PubMed] [Google Scholar]
Micheli 1999
- Micheli JL, Fawer CL, Schutz Y. Protein requirement of the extremely low-birthweight preterm infant. In: Ziegler EE, Lucas A, Moro GE, editors(s). Nutrition of the Very Low Birthweight Infant. Nestle Nutrition Workshop Series. Vol. 43. Philadelphia: Lippincott Williams & Wilkins, 1999:155-77. [Google Scholar]
Murray 1993
- Murray BM, Campos SP, Schoenl M, MacGillivray MH. Effect of dietary protein intake on renal growth: possible role of insulin-like growth factor-1. Journal of Laboratory and Clinical Medicine 1993;122(6):677-85. [PMID: ] [PubMed] [Google Scholar]
Musoke 2001
- Musoke RN, Ayisi RK, Orinda DA, Mbiti MJ. Do healthy very-low-birth-weight infants fed on their own mothers' milk require sodium supplementation? Advances in Experimental Medicine and Biology 2001;501:431-7. [PMID: ] [DOI] [PubMed] [Google Scholar]
Nayak 1989
- Nayak KC, Sethi AS, Aggarwal TD, Chadda VS, Kumar KK. Bactericidal power of neutrophils in protein calorie malnutrition. Indian Journal of Pediatrics 1989;56(3):371-7. [PMID: ] [DOI] [PubMed] [Google Scholar]
Pencharz 1981
- Pencharz PB, Masson M, Desgranges F, Papageorgiou A. Total-body protein turnover in human premature neonates: effects of birth weight, intra-uterine nutritional status and diet. Clinical Science (London) 1981;61(2):207-15. [PMID: ] [DOI] [PubMed] [Google Scholar]
Raiha 2001
- Raiha NC, Fazzolari A, Cayozzo C, Puccio G, Minoli I, Moro G, et al. Protein nutrition during infancy: effects on growth and metabolism. In: Martorell R, Haschke F, editors(s). Nutrition and Growth. Vol. 47. Philadelphia: Lippincott Williams & Wilkins, 2001:73-83. [Google Scholar]
Rassin 1977a
- Rassin DK, Gaull GE, Heinonen K, Raiha NC. Milk protein quantity and quality in low-birth-weight infants. II. Effects on selected aliphatic amino acids in plasma and urine. Pediatrics 1977;59(3):407-22. [PMID: ] [PubMed] [Google Scholar]
Rassin 1977b
- Rassin DK, Gaull GE, Raiha NC, Heinonen K. Milk protein quantity and quality in low-birth-weight infants. IV. Effects of tyrosine and phenylalanine in plasma and urine. Journal of Pediatrics 1977;90(3):356-60. [PMID: 839327 ] [DOI] [PubMed] [Google Scholar]
Review Manager 2014 [Computer program]
- Review Manager 5 (RevMan 5). Version 5.3. Copenhagen: Nordic Cochrane Centre, The Cochrane Collaboration, 2014.
Rolland‐Cachera 1995
- Rolland-Cachera MF, Deheeger M, Akrout M, Bellisle F. Influence of macronutrients on adiposity development: a follow-up study of nutrition and growth from 10 months to 8 years of age. International Journal of Obesity and Related Metabolic Disorders 1995;19(8):573-8. [PMID: ] [PubMed] [Google Scholar]
Rosner 2000
- Rosner B. Hypothesis testing: two-sample inference. In: Rosner B, editors(s). Fundamental of Biostatistics. 5th edition. Pacific Grove, CA: Duxbury, 2000:273-329. [Google Scholar]
Scaglioni 2000
- Scaglioni S, Agostoni C, Notaris RD, Radaelli G, Radice N, Valenti M, et al. Early macronutrient intake and overweight at five years of age. International Journal of Obesity and Related Metabolic Disorders 2000;24(6):777-81. [PMID: 10878686 ] [DOI] [PubMed] [Google Scholar]
Scheurer 2017
- Scheurer JM, Zhang L, Gray HL, Weir K, Demerath EW, Ramel SE. Body composition trajectories from infancy to preschool in children born premature versus full-term. Journal of Pediatric Gastroenterology and Nutrition 2017;64(6):e147-53. [PMID: ] [DOI] [PubMed] [Google Scholar]
Schulze 1987
- Schulze KF, Stefanski M, Masterson J, Spinnazola R, Ramakrishnan R, Dell RB, et al. Energy expenditure, energy balance, and composition of weight gain in low birth weight infants fed diets of different protein and energy content. Journal of Pediatrics 1987;110(5):753-9. [PMID: ] [DOI] [PubMed] [Google Scholar]
Schünemann 2013
- Schünemann H, Brożek J, Guyatt G, Oxman A, editor(s). Handbook for Grading the Quality of Evidence and the Strength of Recommendations Using the GRADE Approach (updated October 2013). GRADE Working Group, 2013. Available from gdt.guidelinedevelopment.org/app/handbook/handbook.html.
Senterre 1983
- Senterre J, Voyer M, Putet G, Rigo J. Nitrogen, fat and mineral balance studies in preterm infants fed bank human milk, a human milk formula, or a low birth-weight infant formula. In: Baum D, editors(s). Human Milk Processing, Fractionation, and the Nutrition of the Low Birth-Weight Baby. Nestle Nutrition Workshop Series. Vol. 3. New York: Raven Press, 1983:102-11. [Google Scholar]
Svenningsen 1982b
- Svenningsen NW, Lindroth M, Lindquist B. Growth in relation to protein intake of low birth weight infants. Early Human Development 1982;6(1):47-58. [PMID: 7056196 ] [DOI] [PubMed] [Google Scholar]
Villela 2018
- Villela LD, Meio MDBB, Matos Fonseca V, Abranches AD, Junior SG, da Costa ACC, et al. Growth and body composition of preterm infants less than or equal to 32 weeks: cohort study. Early Human Development 2018;117:90-5. [PMID: ] [DOI] [PubMed] [Google Scholar]
Ziegler 1976
- Ziegler EE, O'Donnell AM, Nelson SE, Fomon SJ. Body composition of the reference fetus. Growth 1976;40(4):329-41. [PMID: 1010389] [PubMed] [Google Scholar]
Ziegler 1981
- Zeigler EE, Biga RL, Fomon SJ. Nutritional requirements of the premature infant. In: Suskind RM, editors(s). Textbook of Pediatric Nutrition. New York: Raven Press, 1981:29-39. [Google Scholar]
References to other published versions of this review
Fenton 2014
- Fenton TR, Premji SS, Al-Wassia H, Sauve RS. Higher versus lower protein intake in formula-fed low birth weight infants. Cochrane Database of Systematic Reviews 2014, Issue 4. [DOI: 10.1002/14651858.CD003959.pub3] [DOI] [PMC free article] [PubMed] [Google Scholar]
Premji 2006
- Premji S, Fenton T, Sauve RS. Higher versus lower protein intake in formula fed low birth weight infants. Cochrane Database of Systematic Reviews 2006, Issue 1. [DOI: 10.1002/14651858.CD003959.pub2] [DOI] [PubMed] [Google Scholar]