

Abstract
The first-order reaction kinetics of the cryotrapped 1, 1, 2, 2-2H4-aminoethanol substrate radical intermediate state in the adenosylcobalamin (B12) -dependent ethanolamine ammonia-lyase (EAL) from Salmonella enterica serovar Typhimurium are measured over 203 – 225 K by using time-resolved, full-spectrum electron paramagnetic resonance (EPR) spectroscopy. The studies target fundamental understanding of the mechanism of EAL, the signature enzyme in ethanolamine utilization (Eut) metabolism associated with microbiome homeostasis and disease conditions in the human gut. Incorporation of 2H in the hydrogen transfer that follows the substrate radical rearrangement step in the substrate radical decay reaction sequence leads to an observed 1H/2H isotope effect of approximately 2 that preserves, with high fidelity, the idiosyncratic piecewise pattern of rate constant versus inverse temperature dependence that was previously reported for 1H-substrate, including monoexponential (T≥220 K) and two distinct biexponential (T=203–219 K) regimes. In the global kinetic model, reaction at T≥220 K proceeds from the substrate radical macrostate, S•, and at T=203–219 K, along parallel pathways from the two sequential microstates, S1• and S2•, that are distinguished by different protein configurations. Decay from S•, or S1• and S2•, is rate-determined by radical rearrangement (1H) or by contributions from both radical rearrangement and hydrogen transfer (2H). Non-native direct decay to products from S1• is a consequence of the free energy barrier to the native S1• → S2• protein configurational transition. At physiological temperatures, this is averted by the fast protein configurational dynamics that guide the S1• → S2• transition.
Graphical Abstract
INTRODUCTION
The adenosylcobalamin (coenzyme B12) –dependent ethanolamine ammonia-lyase [EAL; EC 4.3.1.7; cobalamin (vitamin B12)-dependent enzyme superfamily]1, 2 is the first in a sequence of enzymes that process aminoethanol in the ethanolamine utilization (Eut) metabolic pathway3 that is associated with microbiome homeostasis,4 and Salmonella enterica and Escherichia coli –induced disease conditions, in the human gut.5–7 Toward characterization of the molecular mechanism of EAL, we have used low-temperature (T), time-resolved, full-spectrum electron paramagnetic resonance (EPR) spectroscopy8 to address aminoalkanol conversion to the corresponding aldehyde and ammonia by EAL.9–12 During steady-state turnover, the cob(II)alamin-substrate radical pair state (S•) accumulates and is cryotrapped in high yield.8 Subsequent T–step initiated decay of S• to products is rate-determined by the chemical step of substrate radical rearrangement (involving 1, 2-migration of the amino group2, 13), which resolves this step for first-order kinetic analysis (Figure 1). The decay of S• has been studied over the T range of 190 – 230 K (natural substrate, aminoethanol)9–11 and 220 – 250 K (non-native substrate, 2-aminopropanol).12 The low-T 2-aminopropanol substrate radical decay proceeds along two pathways: (1) a productive pathway proceeding to diamagnetic products, and (2) a destructive pathway leading to an organic radical species uncoupled from cob(II)alamin. The destructive pathway was proposed to originate from direct decay of the first (S1•) of two sequential substrate radical microstates, because S1• has a protein configuration specialized for trapping the nascent substrate radical, rather than direct, forward reaction to products.12 The succeeding state, S2•, is configured for guiding the radical rearrangement (RR) step and the following hydrogen transfer (HT) step, and is the progenitor for the native, productive path to product radical (P•) and diamagnetic product (PH) states.12 Two sequential protein configurational states, S1• and S2• were also proposed to mediate the biexponential decay of the aminoethanol-generated substrate radical.11 Here, we use deuterium (2H) substitution to selectively slow the HT step of the aminoethanol substrate radical decay in EAL from S. enterica serovar Typhimurium (S. typhimurium), in order to further define the decay pathways from S1• and S2• and to address the role of the HT step in the decay reaction, based on the observed 1H/2H isotope effects (IEobs).
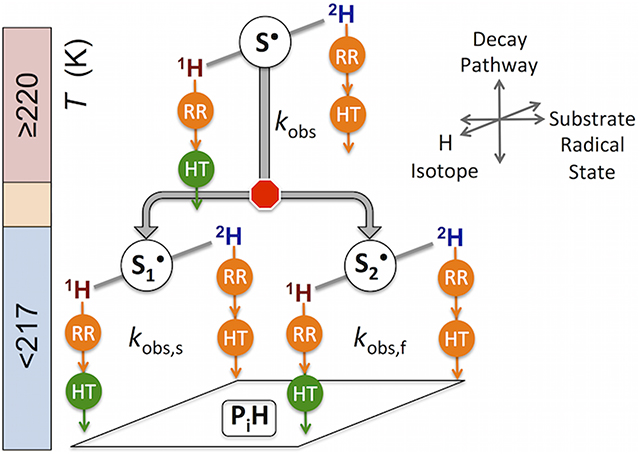
Figure 1.

Simplified scheme that illustrates sequence of canonical chemical steps and intermediate states culled from the catalytic cycle of EAL that are involved in the decay of the cryotrapped cob(II)alamin-aminoethanol substrate radical pair, at T≥220 K. Paramagnetic Co2+ or diamagnetic Co3+ in cobalamin, the substrate radical and products, and the 5’-deoxyadenosyl moiety (Ad) are depicted, in the active site. Turnover on 2H-substrate incorporates 2H (red H) at the 5’-carbon of Ad, leading to 2H-transfer, during the decay.
The Arrhenius dependence of the observed rate constants (kobs) for decay of the natural isotopic abundance, 1H-substrate radical, was previously shown to have a piecewise pattern over the T range of 190 to 295 K.11 The T-dependence is characterized by the following regions, with decreasing T: (1) Monoexponential decay extends from 295 to 220 K (mechanism depicted in Figure 1), indicating that the native free energy landscape persists deep into the cryo-regime. (2) An abrupt kinetic bifurcation leads to biexponential decay starting at 219 K, and a flat T-dependence of slow and fast observed first-order rate constants (kobs,s and kobs,f) over 219–217 K. (3) Following a concave-down kink, the biexponential decay continues along two distinct Arrhenius relations, from 214 to 203 K.11 Turnover of EAL on 1, 1, 2, 2-2H4-aminoethanol (denoted as 2H-substrate) leads to incorporation of 2H into the C5’-methyl group of 5’-deoxyadenosine.14–16 Consequently, the transfer of hydrogen (H•) from the C5’ donor to the product C2• radical center acceptor in the HT step proceeds with 2H (Figure 1). Previous work showed that decay of the 2H-substrate radical over 190–207 K proceeds with mean IEobs<2 on the slow and fast phases.10 Larger, steady-state isotope effects (IESS) are measured at room T for deuterium (1H/2H, 7.5)14,17 and tritium (1H/3H, 107),13 which were assigned to the HT step.18 The discrepancy between the measured 1H/2H IESS of 7.5 and the value of 25, which is a lower limit predicted from the 1H/3H IESS by using the semi-classical Swain-Schaad theory,19 is a conundrum,13 which is also observed for another adenosylcobalamin-dependent eliminase enzyme, diol dehydratase.20
Here, we determine the rate constants for decay of the 2H-substrate radical over the T-range of 203–225 K, and compare these to the corresponding observed rate constants for decay of the 1H-substrate radical.11 The relatively small (~2), uniform 1H/2H IEobs is consistent with masking of the intrinsic 1H/2H isotope effect (IEint) for the HT step by non-hydrogen isotope sensitive contributions to the activation free energy barriers. Combined analysis of the T-dependence of observed the 2H- and 1H- substrate decay rate constants over 203–214 K leads to a revised model for the decay reaction, in which both S1• and S2• are progenitors for decay pathways to diamagnetic products. The analysis also identifies the contribution of the HT step to the decay reactions for 2H-substrate. Thus, the chemical step of HT joins the protein configurational change (S1• →S2•) and chemical RR (S• → P•) steps that are accessible to study by low-T, time-resolved EPR spectroscopy.
MATERIALS AND METHODS
Enzyme Preparation.
Enzyme was purified from the Escherichia coli overexpression system that incorporated the cloned S. typhimurium EAL coding sequence21 as described22. The specific activity of purified EAL with aminoethanol as substrate was determined by using the coupled assay with alcohol dehydrogenase and NADH23 (20–30 μmol/min/mg; T= 298 K, P=1 atm).
EPR Sample Preparation.
All chemicals were purchased from commercial sources. The procedure for cryotrapping of the cob(II)alamin-substrate radical pair in EAL and low-T kinetic measurements has been described in detail.8 In brief, reactions were performed in aerobic buffer containing 10 mM potassium phosphate (pH 7.5), on ice, and under dim red safe-lighting, to eliminate photochemical degradation of the coenzyme B12 (adenosylcobalamin, AdoCbl) cofactor. AdoCbl was added to 2-fold molar excess over active sites. Substrate 1, 1, 2, 2-2H4-aminoethanol (Cambridge Isotope Laboratories, Inc., Tewksbury, MA) was present at 100 mM. The final concentration of enzyme in EPR samples was 10 mg/ml, which is equivalent to 20 μM,22 and an active site concentration of 120 μM.24, 25 Holoenzyme and substrate solutions were manually mixed and loaded into an EPR tube (4 mm outer diameter; Wilmad-LabGlass, Vineland, New Jersey), and the tube was immersed in isopentane (T≈140 K; elapsed time, 10–15 s).
EPR Spectroscopy and Kinetics Measurements.
EPR spectra were collected by using a Bruker E500 ElexSys EPR spectrometer equipped with a Bruker ER4123 SHQE cavity. Instrumentation and methods for measurements of the substrate radical decay kinetics by EPR have been described in detail.8 Briefly, EPR samples were held at a staging temperature of 160–180 K in the ER4131VT cryostat system in the spectrometer, and temperature was step-increased to the decay measurement values. The time from initiation of the temperature step to the start of acquisition of the first spectrum was 30–60 s. Continuous acquisition of EPR spectra proceeded for the duration of the decay (24 s sweep time; 2.56 ms time constant; sampling interval, 5–60 s, depending on T). Temperature at the sample was determined by using an Oxford Instruments ITC503 temperature controller with a calibrated model 19180 4-wire RTD probe, which has ±0.3 K accuracy over the range of decay measurements. The ER4131VT cryostat/controller system provided a temperature stability of ±0.5 K over the length of the EPR sample cavity. The temperature was therefore stable to ±0.5 K during each run.
Empirical fitting of the substrate radical decay: observed rate constants.
For each EPR spectrum in the decay time series, the amplitude of the substrate radical signal was obtained from the difference between peak and trough amplitudes of the substrate radical derivative feature around g≈2.0, with baseline-correction. All data processing programs were written in MATLAB (Mathworks, Natick, MA). The observed decays were fitted to monoexponential (Eq. 1, N=1) or biexponential (Eq. 1, N=2) functions by using the following expression,
| (1) |
Where is the normalized amplitude, Ai is the normalized component amplitude ( at t=0), and ki is the first-order rate constant. Additional data collection and averaging has led to changes in the mean k values at some temperatures, relative to earlier reports.9, 10 The empirical fitting of the substrate radical decay curves led to observed rate constants, specified as: kobs (monoexponential, T≥220 K) and kobs,s, kobs,f (biexponential, slow and fast components, T<220 K).
Temperature-dependence of the observed rate constants for substrate radical decay.
The temperature dependences of the microscopic rate constants were fitted by using the expression from Arrhenius reaction rate theory:26
| (2) |
where A (units, s−1), Ea (kcal/mol) and R (1.987 cal/mol/K) are the Arrhenius prefactor, the activation energy and the gas constant, respectively.
RESULTS
Time-resolved, full-spectrum EPR measurements of the cob(II)alamin-substrate radical pair decay.
The CW-EPR spectrum of the cob(II)alamin-substrate radical pair, that accumulates during turnover on substrate 2H4-aminoethanol, shows a prominent, broad derivative-shaped feature centered at 285 mT that corresponds to the g⊥ region of low-spin (S=1/2) Co2+ in cob(II)alamin, and a narrower feature, centered at 330 mT, that corresponds to the substrate radical (Figure S1).27,28,29 Figure 2 shows the time-dependence of the 2H-substrate radical component at 210 K, following T-step. As for the decay of the 1H-substrate radical,9 no other paramagnetic species were detected during the decay to the diamagnetic product state. Figure 3 shows the decay of the amplitude of the 2H-substrate radical at representative T values corresponding to the different kinetic regimes, over the full range of 203 to 225 K.
Figure 2.
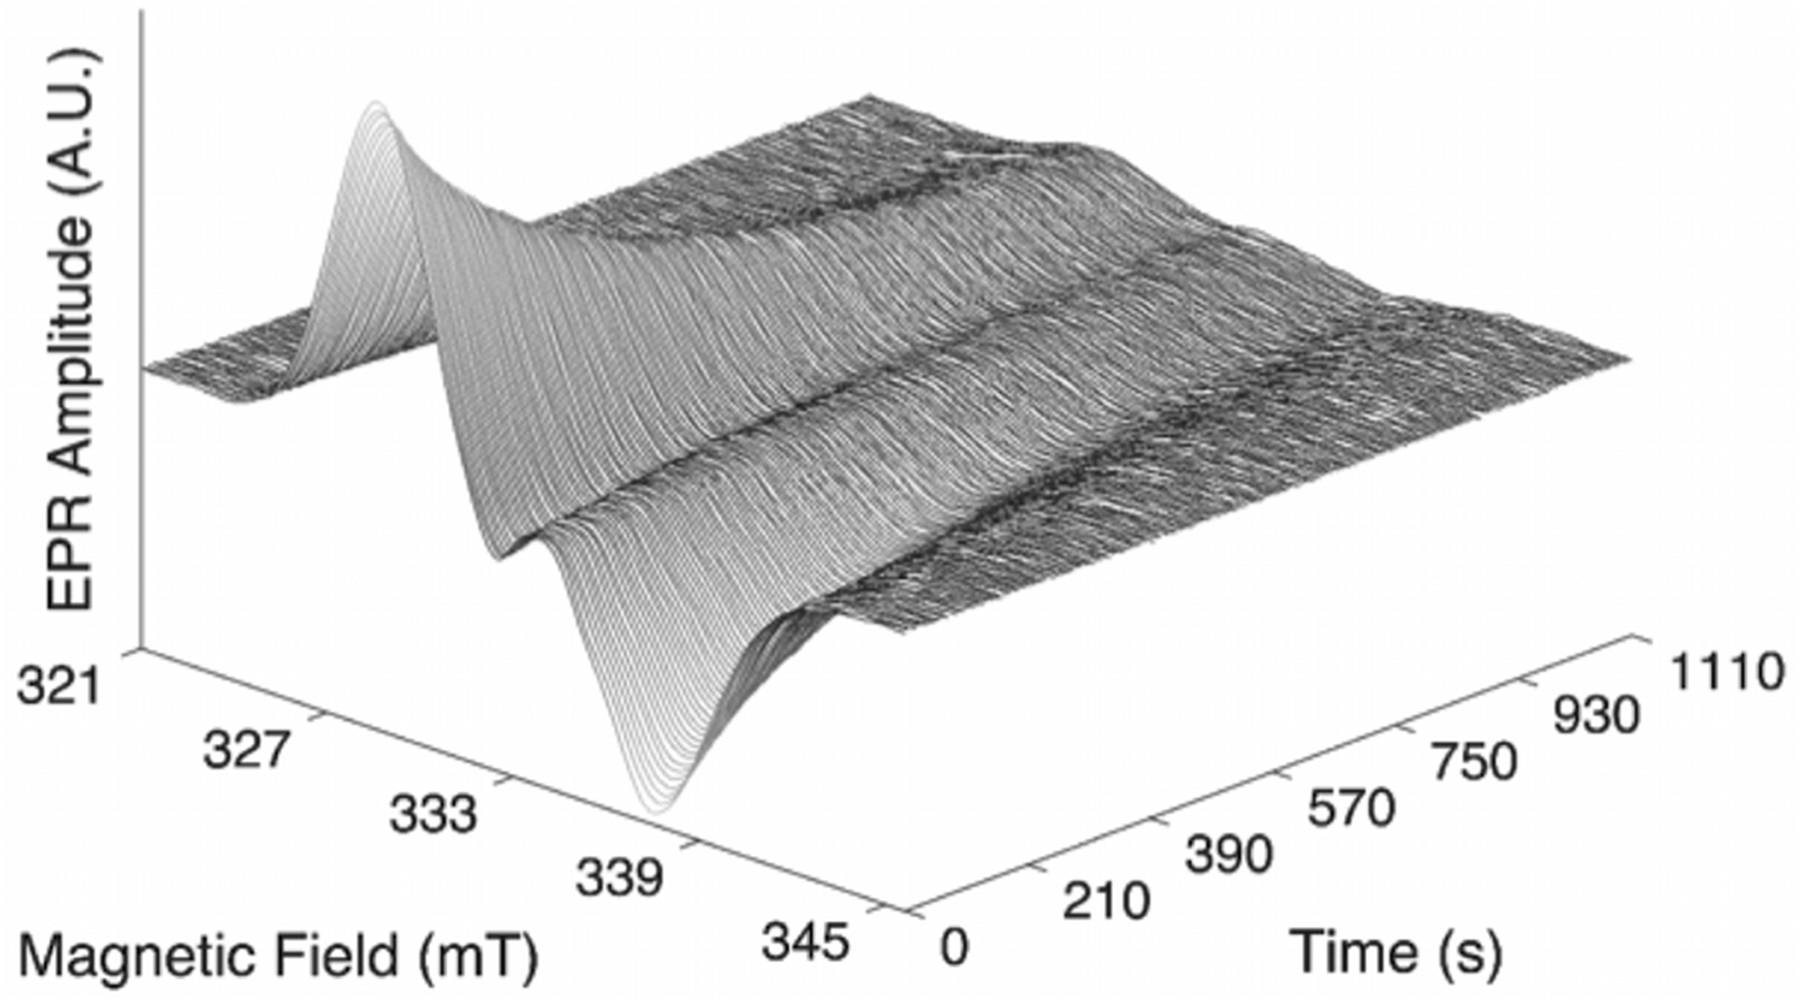
Time-dependence of the 2H-substrate radical EPR spectrum at 210 K. EPR conditions: microwave frequency, 9.338 GHz; microwave power, 20 mW; magnetic field modulation, 1.0 mT; modulation frequency, 100 kHz; amplitude represents moving average over 5 spectra, for 410 total spectra.
Figure 3.

Time-dependence of the EPR amplitude of the 2H-substrate radical at selected T values and overlaid best-fit mono- (T≥220 K) or biexponential functions (grey line). EPR amplitudes are normalized to the zero-time value.
Temperature-dependence of the observed substrate radical decay rate constants.
The 2H-substrate radical decay exhibited monoexponential kinetics for T≥220 K (observed rate constant, kobs) and biexponential kinetics for T<220 K (kobs,s and kobs,f). The values of kobs, kobs,s and kobs,f, and the component amplitudes, Aobs,s and Aobs,f, are presented in Table S1. Figure 4 shows the Arrhenius plot of the observed decay rate constants over 203 – 225 K for decay of the 2H-substrate radical. The piece-wise form of the Arrhenius plot over 203 – 225 K is comparable with that previously reported for the 1H-substrate radical decay,11 including the following domains: (1) T≥220 K, the decay is monoexponential; (2) 217≤T≤219 K, the decay is biexponential, with constant values of kobs,s and kobs,f to within the respective standard deviations, and constant values of Aobs,s and Aobs,f to within the respective standard deviations; (3) T≤214 K, the decay is biexponential, with descending values of kobs,s and kobs,f with decreasing T, and with approximately constant Aobs,s and Aobs,f values.
Figure 4.

Arrhenius plot of observed first-order rate constants for 2H-substrate radical decay, for the temperature range, 203 – 225 K. The mean kobs value for each temperature, and standard deviation, which represent at least three separate decay measurements on different samples, are shown.
DISCUSSION
Dual pathway model for substrate radical decay for T≤214 K.
The combined Arrhenius plots of the observed decay rate constants for the 2H-substrate radical and 1H-substrate radical9,11 over the T-range of 203 – 225 K are presented in Figure 5. The relations display a common piecewise pattern, but with a vertical offset, owing to an approximately 2-fold decrease in rate constant for the 2H-substrate radical decay. Previously, the biexponential decay of the aminoethanol 1H-substrate radical at T≤214 K was accounted for by a minimal microscopic kinetic model of a series 3-state, 2-step mechanism, involving a “slow” step of interconversion between two substrate radical states, S1• and S2• followed by a “fast” step of first-order reaction from S2• that formed diamagnetic product, PH (Figure 6A).11 In this series model, S1• and S2• represent different protein configurational states that are distinguished by a protein configurational change, and their interconversion (microscopic rate constants, k12, k21) thus proceeds with no making or breaking of covalent bonds or significant electron orbital rehybridization. The canonical chemical steps of RR and HT (radical rearrangement, hydrogen transfer; Figure 1)1,14 are collapsed under the single step, S2• → PH. This microscopic model is not consistent with the 2H-substrate radical decay results: Fitting of the Arrhenius dependences requires a significant IE on k12 and k21, for the H-isotope-insensitive S1•, S2• interconversion (Supporting Text, Figure S2, Table S2). Thus, the series model (Figure 6A) does not account for the 1H/2H IEobs on both the slow and fast phases of substrate radical decay.
Figure 5.

Arrhenius plot of 2H- and 1H-substrate radical first-order decay rate constants, with linear fits and extrapolations. Data for 203 – 219 K show mean values of kobs,s (open symbols) and kobs,f (filled symbols) for 2H (circles, blue) and 1H (squares, black) and standard deviations, from at least three measurements on separate samples. Data for monoexponential decay are shown for 2H (diamonds, blue) or 1H (triangles, black). Linear fits to the data in the 207–214 K region are shown as solid lines, and extrapolations are shown as dotted lines.
Figure 6.

Kinetic mechanisms for the decay of the substrate radical in EAL for the range of temperatures, 203 to 225 K. (A) Series, single decay pathway model.11 (B) Dual, parallel pathway model. Proposed temperature-dependence of interconversion of the progenitor states, S1• and S2•, is depicted by cloak color on k12, k21 step: blocked, red; free, green. Relative depth of green cloak color represents proposed probability of pathway for 2H-substrate radical decay.
In the revised microscopic model (Figure 6B), the substrate radical decays through two pathways at T≤214 K, starting from either S1• (Pathway 1; corresponding to the slow decay component, kobs,s) or from S2• (Pathway 2; corresponding to the fast decay component, kobs,f). This model successfully accounts for the observed 1H/2H IEobs on both kobs,s and kobs,f, because both pathways involve chemical, bond-making/bond-breaking steps. Each pathway proceeds through the same formal sequence of substrate to product radical rearrangement [S1• → P1• or S2• → P2•; forward and reverse microscopic rate constants, kSP,i, kPS,i, respectively, (where i=1, 2)] and subsequent hydrogen transfer, HT (P1• → PH1 or P2• → PH2; microscopic rate constants, kHT, i). The inability to detect P• by EPR spectroscopy places a limit on the ratio of populations, P•/S•, of <10−3,30 which is consistent with the difference in energy between P• and S• of 5–9 kcal/mol, calculated by ab initio methods31,32,33 (corresponding to P•/S• <10−5, over the experimental T-range). This condition allows the steady-state assumption for the population of P• during the decay (dP•/dt≈0), which leads to analytical expressions for kobs,s and kobs,f for S• → P• → PH, in terms of the microscopic rate constants, for Pathways 1 and 2:26
| Eq. 3 |
| Eq. 4 |
The effective first-order rate constants, kobs,s and kobs,f in Eqs. 3 and 4 are consistent with the observed single-exponential decay kinetics of S1• (Pathway 1) and S2• (Pathway 2).
Over 207–214 K, the amplitudes for decay through Pathway 1 and Pathway 2 are relatively constant (2H, Aobs,f=0.6 ±0.2; 1H, Aobs,f=0.4 ±0.1). In contrast, the ratio of kobs,f/kobs,s increases with decreasing T from 214 to 207 K (2H, kobs,f/kobs,s changes from 2.5 to 6.5; 1H, kobs,f/kobs,s changes from 3.3 to 5.7). These features are consistent with the generation of a constant proportion of S1• and S2• by the cryotrapping procedure, and the presence of this proportion, as the initial state for substrate radical decay, at each T-value. The T-independent slow and fast amplitudes in the 207 – 214 K range, and the divergent behavior of the decay rates and amplitudes outside of this range for both the 2H- and 1H-substrate radical (described below), are not consistent with a significant rate of interconversion of S1• and S2•. This leads to the assumption that k12, k21<<kSP. The decays through Channels 1 and 2 are thus considered to proceed independently, at T≤214 K (Figure 6B).
2H-substrate radical decay is partially rate-determined by both hydrogen atom transfer and radical rearrangement over 207–214 K.
The 1H/2H IEint on HT2 in EAL is estimated as 25,13 based on a consideration of the 1H/3H IEobs of 107, and the semi-classical Swain-Schaad relation.19 This value is consistent with 1H/2H IE values reported for hydrogen transfers in the adenosylcobalamin-dependent enzymes, methylmalonyl-CoA mutase (≥20)34 and glutamate mutase (28).35 The IEobs over 207–214 K for Pathway 1 (IEobs,s=1.9 ±0.4) and Pathway 2 (IEobs,f=2.2 ±0.1) are an order of magnitude lower than 25. Using the assumptions that: (1) the step, S• → P•, is hydrogen isotope-independent, (2) IEint=25 for HT [kHT(1H)=25kHT(2H], and (3) the IEobs,s=1.9, the ratio of Eq. 3 [(kobs,s(1H)/kobs,s(2H)] gives an estimated kPS,1/kHT,1 for the slow Pathway 1 decay of 0.97 (calculation details, Supporting Information). For the fast Pathway 2 decay, the estimated kPS,2/kHT,2 is 1.3. Thus, kPS and kHT are comparable for the 2H-substrate radical decay, which indicates that both HT and RR contribute to rate determination of the S1• and S2• decays for the 2H-substrate over the range, 207–214 K.
1H-substrate radical decay is rate-determined by only radical rearrangement over 207–214 K.
The ratio, kPS/kHT, is calculated for the 1H-substrate radical decay, by using the above assumptions, yielding values of (kPS,1/kHT,1)=0.039 and (kPS,2/kHT,2)=0.053 for decay through Pathways 1 and 2, respectively (calculation details, Supporting Information). Thus, for 1H-substrate radical decay, kPS/kHT<<1, indicating that HT is significantly faster than RR, and Eqs. 3 and 4 become kobs,s≈kSP,1 and kobs,f≈kSP,2. The decay of the 1H-substrate radical over the range 207–214 K is thus considered to be rate-determined by the RR step.
Arrhenius dependences of 2H- and 1H-substrate radical decay over 207–214 K.
Eqs. 3 and 4 were used to fit the T-dependence of kobs,s and kobs,f for the 2H-substrate radical decay and 1H-substrate radical decay over 207–214 K. For the 1H-substrate decay, in accord with the assumptions, kobs,s=kSP,1 and kobs,f=kSP,2, the corresponding Arrhenius parameters from linear fits of kobs,s and kobs,f represent kSP,1 and kSP,2 (Figure 5, Table S3). For the 2H-substrate radical decay, the T-dependence of kobs,s and kobs,f was accounted for by using Eqs. 3 and 4 and the following assumptions: (1) The corresponding kSP(1H, T) was used to represent kSP(2H, T). (2) Arrhenius expressions for kPS and kHT for Pathways 1 and 2 were used in the ratio, kPS/kHT, with two resulting adjustable parameters, (Ea,HT – Ea,PS) and APS/AHT (calculation details, Supporting Information; values, Table S3). Figure 5 shows linear fits of the 2H substrate radical decay data over 207–214 K. The excellent fits support the model, and the tenets that HT makes: (1) no contribution to 1H-substrate radical decay, and (2) a partial rate-limiting contribution to 2H-substrate radical decay.
Figure 7 depicts the kinetic relationships among the S•, P• and PH states in terms of intermediate and transition states on a free energy diagram. The diagram shows graphically the origin of the relatively small IEobs: The HT barrier for 1H-substrate radical decay lies below the barrier for 2H-substrate. For the 2H-substrate radical decay, the IEint=25 raises the barrier for HT by 1.3 kcal/mol, which makes it comparable to the barrier for RR.
Figure 7.

Free energy diagram of states and barriers involved in the radical rearrangement process in EAL over the T-range of 203–219 K, illustrating the proposed origin of the partial 1H/2H isotope effects. The scheme is general, for 1H- and 2H-substrate radical decay through Pathway 1 and Pathway 2 (i=1, 2). Relative free energy levels of equilibrium states and barriers are derived from activation parameters from the fitting of the substrate radical decay over 207–214 K. Changes in free energy equivalent to the intrinsic 1H/2H isotope effect (IEint), and representative energy level of P• relative to S• (ΔES•/P•) are shown.30–33
Kinetics in the plateau region, T = 217 – 219 K.
Over 217–219 K, the 2H-substrate radical decay is well-fit by the biexponential function, and the IEobs,s=2.3 ±0.2 and IEobs,f=2.3 ±0.4 are comparable to those for the 207–214 K region. This suggests that the decay mechanisms for the 1H- and 2H-substrate radicals proposed for the 207–214 K range extend to 217–219 K. However, extrapolation of the linear fits of kobs,s and kobs,f for the 2H- and 1H-substrate radical decays to the 217–219 K range (Figure 5), shows that the measured biexponential decay rate constants lie below the extrapolated values, and by comparable factors, at 217 K: For kobs,s, the ratio of extrapolated/measured values is 1.9 ±0.5 (1H) and 2.1 ±0.4 (2H), and for kobs,f, 1.5 ±0.2 (1H) and 1.4 ±0.2 (2H). The lowered kobs values distinguish 217–219 K as a separate regime of the decay kinetics, as recognized previously.11 In addition, there is a shift in the mean normalized amplitudes from 207–214 K to 217–219 K (Table S1) that favors the fast component. The shift is statistically significant for 1H-substrate [mean Aobs,f,207–214 K = 0.37 ±0.07, mean Aobs,f,217–219 K = 0.60 ±0.04], but just within one standard deviation for 2H-subtrate [mean Aobs,f,207–214 K = 0.59 ±0.16, mean Aobs,f,217–219 K = 0.77 ±0.06].
Different causes of the relatively small, 1.4- to 2.1-fold lowering of the measured versus extrapolated kobs,s and kobs,f in the 217–219 K region (relative to the extrapolations from low T) have been considered, but a model remains elusive. Configurational relaxation of the protein on the time-scale of radical decay, possibly arising from a kinetic bottleneck to configurational relaxation during cryotrapping, was addressed by allowing samples to partially decay at 217–219 K, followed by T-step to 210 K, and measurement of decay kinetics. In these samples, the decay kinetics characteristic of 210 K (Table S1) were reproduced, which indicates that protein configurational relaxation during cryotrapping is detectably complete, and thus, that there is no additional, irreversible relaxation upon return to 217–219 K. Protein relaxation is also not consistent with the biexponential kinetics for 217–219 K, because relaxation during decay would be expected to produce a distribution of rate constants,36 necessitating a power law or stretched exponential form of the decay curve. The absence of an effect on kobs values from variation of dwell time in the 217–219 K region by changing the rate of cooling during cryotrapping, over a range of milliseconds to seconds, is also inconsistent with a significant time-dependent (dynamic) protein relaxation effect.8
Kinetic bifurcation, T=219 – 220 K.
Figure 5 identifies 220 K as the lowest T value, for which the decay is monoexponential, for both the 2H- and the 1H-substrate radicals. The transition from biexponential to monoexponential decay kinetics with increasing T is explained, in the context of the parallel decay pathway model in Figure 6B, by an abrupt decrease in the free energy barrier that separates S1• and S2•. This creates a single substrate radical state, S•, which, however, decays from configurations that correspond to S2• at T>219 K (Figure 6B). The proposed decay from S2• implies an absence of decay from S1•, which is supported by the trend toward a dominant S2• population, with increasing T (k12>k21 at T>219 K). The model implies that kSP,2>kSP,1, and leads to the proposal that S2• represents the native state that enables and conducts the RR reaction, consistent with previous proposals,11,12 and as considered further in Conclusions.
The IEobs values for the monoexponential decays at 220 and 223 K, of 1.9 and 1.8, respectively, are comparable with the values observed over 207–219 K, which suggests that the same basic mechanism and rate-limiting steps at low T values are present in the monoexponential regime: The 1H-substrate radical decay rate is throttled by the RR step, and the 2H-substrate radical decay is rate-limited by contributions from both RR and HT.
CONCLUSIONS
The hierarchy of states and pathways identified by the combination of 1H/2H isotope effects and T-dependence is depicted in Figure 8. Three distinct regions of low-T kinetic behavior are resolved: 207 – 214, 217 – 219, and 220 – 225 K. The 207 – 214 K region shows linear, Arrhenius dependence of the rate constants on T, and leads to the principal conclusion of this work: The slow and fast observed decay rate constants (kobs,s, kobs,f) correspond to two parallel pathways of substrate radical reaction, originating from two distinct states, S1• (Pathway 1) and S2• (Pathway 2). The slow and fast decay components of the 1H-substrate radical are both rate-determined by the RR reaction. The slow and fast decay components of the 2H-substrate radical are both rate-determined by partial contributions of RR and HT reactions, because hydrogen transfer with 2H raises the free energy barrier for HT to the level of the barrier for RR. The kobs values at 217–219 K diverge from the extrapolated Arrhenius behavior over 207–214 K. Above 219 K, Arrhenius dependence resumes, but with a single decay component. Through the dramatic changes in the T-dependence of kobs among the different regions, IEobs remains approximately uniform at ~2, indicating that the kinetic mechanisms for 1H- (rate limitation by RR) and 2H- (rate limitation by RR and HT) substrate radical decay are maintained.
Figure 8.

Hierarchy of resolved states and pathways, and their emergence from manipulation of temperature and substrate hydrogen isotope in EAL. The regions of T-dependence of the kinetics are depicted, at left. Red octagon indicates block of S1•, S2• interconversion, orange circle indicates contribution to rate limitation of decay, and green circle indicates no rate limitation, for the radical rearrangement (RR) and hydrogen transfer (HT) steps.
The two-pathway model for reaction of the aminoethanol substrate radical (Figures 6B and 8) aligns with the model proposed for 2-aminopropanol substrate radical decay.12 For the 2-aminopropanol substrate radical, low-T reaction proceeds along a destructive pathway from S1•, to form an uncoupled free radical and cob(II)alamin, and along a parallel productive pathway from S2• to diamagnetic products. The progenitor states were proposed to represent EAL protein configurational states, arranged in series in the native reaction, that are specialized for the distinctive functions of substrate radical capture (S1•) and rearrangement-enabling (S2•), respectively.12 For aminoethanol substrate, the free energy barrier to S1•→S2• protein configuration conversion is relatively low from physiological T values down to 220 K and reaction to form diamagnetic products occurs solely from S2•. Below 220 K, a free energy barrier arises to S1•→S2• conversion, the lifetime of S1• is prolonged, and direct reaction of S1• to form diamagnetic products occurs through a non-native, “spillover” pathway. In EAL at physiological temperatures, this potentially deleterious pathway is averted by the fast protein configurational dynamics that guide the S1• → S2• transition.
Supplementary Material
ACKNOWLEDGMENT
The authors appreciate discussions with Ms. Alina Ionescu.
Funding Sources
This work was supported by National Institute of Diabetes, Digestive and Kidney Diseases (NIDDK) of the National Institutes of Health (NIH) (Grant R01-DK054514). The Bruker E500 EPR spectrometer was funded by the NIH National Center for Research Resources (Grant RR17767) and by Emory University.
Footnotes
Supporting Information.
The Supporting Information is available free of charge on the ACS Publications website at DOI: 10.1021/acs.biochem._. Supporting Text: Application of series three-state, two-step kinetic model to fit the 2H-substrate decay; Estimation of relative values of kPS and kHT, and application to develop expressions for kobs for 2H- and 1H-substrate radical decays. Supporting Figures: EPR spectrum of the aminoethanol-generated cob(II)alamin-substrate radical pair prepared with deuterated substrate (2H-substrate); Arrhenius plot of microscopic rate constants obtained for the series, three-state, two-step microscopic (single-pathway decay) model, overlaid on the observed rate constants for the series, for the 2H-subtrate radical decay. Supporting Tables: Observed first-order rate constant and amplitude parameters for the fit of mono- and biexponential functions to the cob(II)alamin-substrate radical pair decays at different temperatures for 2H-substrate; Microscopic rate constant and amplitude parameters for the fit of the series 3-state, 2-step microscopic model (single pathway decay model) to the cob(II)alamin-2H-substrate radical pair decay kinetics at different temperatures; Arrhenius parameters from fitting the temperature dependence of observed rate constants for slow and fast components of the 1H- and 2H-substrate radical decay (two pathway model), over 207–214 K.
The authors declare no competing financial interest.
REFERENCES
- [1].Toraya T (2003) Radical Catalysis in Coenzyme B12-Dependent Isomerization (Eliminating) Reactions. Chem. Rev 103, 2095–2127. [DOI] [PubMed] [Google Scholar]
- [2].Frey PA (2010) Cobalamin coenzymes in enzymology In Comprehensive Natural Products II Chemistry and Biology (Mander L, and Lui H-W, Eds.), pp 501–546, Elsevier, Oxford UK. [Google Scholar]
- [3].Roof DM; Roth JR (1988) Ethanolamine Utilization in Salmonella-Typhimurium. J Bacteriol 170, 3855–3863. [DOI] [PMC free article] [PubMed] [Google Scholar]
- [4].Banerjee R (2017) Introduction to the Thematic Minireview Series: Host-microbiome metabolic interplay. J. Biol. Chem 293, 8544–8545. [DOI] [PMC free article] [PubMed] [Google Scholar]
- [5].Thiennimitr P; Winter SE; Winter MG; Xavier MN; Tolstikov V; Huseby DL; Sterzenbach T; Tsolis RM; Roth JR; Bäumler AJ (2011) Intestinal inflammation allows Salmonella to use ethanolamine to compete with the microbiota. Proc. Natl. Acad. Sci 108, 17480–17485. [DOI] [PMC free article] [PubMed] [Google Scholar]
- [6].Staib L; Fuchs TM (2014) From food to cell: nutrient exploitation strategies of enterpathogens. Microbiology 160, 1020–1039. [DOI] [PubMed] [Google Scholar]
- [7].Anderson CJ; Kendall MM (2017) Salmonella enterica Serovar Typhimurium strategies for host adaptation. Front. Microbiol 8, 1983. [DOI] [PMC free article] [PubMed] [Google Scholar]
- [8].Wang M; Zhu C; Kohne M; Warncke K (2015) Resolution and characterization of chemical steps in enzyme catalytic sequences by using low-temperature and time-resolved, full-spectrum EPR spectroscopy in fluid cryosolvent and frozen solution systems. Meth. Enzymol 563, Part A, 59–94. [DOI] [PMC free article] [PubMed] [Google Scholar]
- [9].Zhu C; Warncke K (2008) Reaction of the Co-II-Substrate Radical Pair Catalytic Intermediate in Coenzyme B-12-Dependent Ethanolamine Ammonia-Lyase in Frozen Aqueous Solution from 190 to 217 K. Biophys. J 95, 5890–5900. [DOI] [PMC free article] [PubMed] [Google Scholar]
- [10].Zhu C; Warncke K (2010) Kinetic Isolation and Characterization of the Radical Rearrangement Step in Coenzyme B12-Dependent Ethanolamine Ammonia-Lyase. J. Am. Chem. Soc 132, 9610–9615. [DOI] [PMC free article] [PubMed] [Google Scholar]
- [11].Kohne M; Zhu C; Warncke K (2017) Two dynamical regimes of the substrate radical rearrangement reaction in B12-dependent ethanolamine ammonia-lyase resolve contributions of native protein configurations and collective configurational fluctuations to catalysis. Biochemistry-Us 56, 3257–3264. [DOI] [PMC free article] [PubMed] [Google Scholar]
- [12].Ucuncuoglu N; Warncke K (2018) Protein configurational states guide radical rearrangement catalysis in ethanolamine ammonia-lyase. Biophys. J 114, 2775–2786. [DOI] [PMC free article] [PubMed] [Google Scholar]
- [13].Bandarian V; Reed GH (1999) Ethanolamine Ammonia-Lyase In Chemistry and Biochemistry of B12 (Banerjee R, Ed.), pp 811–833, John Wiley and Sons, New York. [Google Scholar]
- [14].Babior BM (1982) Ethanolamine ammonia-lyase In B12, Volume 2 (Dolphin D, Ed.), pp 263–287, Wiley, New York. [Google Scholar]
- [15].Warncke K; Utada AS (2001) Interaction of the Substrate Radical and the 5’-Deoxyadenosine-5’-Methyl Group in Vitamin B12 Coenzyme-Dependent Ethanolamine Deaminase. J. Am. Chem. Soc 123, 8564–8572. [DOI] [PubMed] [Google Scholar]
- [16].LoBrutto R; Bandarian V; Magnusson OT; Chen X; Schramm VL; Reed GH (2001) 5’-Deoxyadenosine contacts the substrate radical intermediate in the active site of ethanolamine ammonia-lyase: 2H and 13C electron nuclear double resonance studies. Biochemistry-Us 40, 9–14. [DOI] [PubMed] [Google Scholar]
- [17].Bandarian V; Reed GH (2000) Isotope effects in the transient phases of the reaction catalyzed by ethanolamine ammonia-lyase: Determination of the number of exchangeable hydrogens in the enzyme-cofactor complex. Biochemistry-Us 39, 12069–12075. [DOI] [PubMed] [Google Scholar]
- [18].Weisblat DA; Babior BM (1971) Mechanism of action of ethanolamine ammonia-lyase, a B12-dependent enzyme. 8. Further studies with compounds labled with isotopes of hydrogen - identification and some properties of the rate-limiting step. J. Biol. Chem 246, 6064–6071. [PubMed] [Google Scholar]
- [19].Swain CG; Stivers EC; Reuwer JF; Schaad LJ (1958) Use of hydrogen isotope effects to identify the attacking nucleophile in the enolization of ketones catalyzed by acetic acid. J. Am. Chem. Soc 80, 5885–5893. [Google Scholar]
- [20].Essenberg MK; Frey PA; Abeles RH (1971) Studies on the mechanism of hydrogen transfer in the coenzyme B12 dependent dioldehydratase reaction. J. Am. Chem. Soc 93, 1242–1251. [DOI] [PubMed] [Google Scholar]
- [21].Faust LP; Connor JA; Roof DM; Hoch JA; Babior BM (1990) AdoCbl-dependent ethanolamine amino-lyase from Salmonella typhimurium. J. Biol. Chem 265, 12462–12466. [PubMed] [Google Scholar]
- [22].Faust LP; Babior BM (1992) Overexpression, purification and some properties of AdoCbl-dependent ethanolamine amino-lyase from Salmonella typhimurium. Arch. Biochem. Biophys 294, 50–54. [DOI] [PubMed] [Google Scholar]
- [23].Kaplan BH; Stadtman ER (1968) Ethanolamine Deaminase a Cobamide Coenzyme-Dependent Enzyme .I. Purification Assay and Properties of Enzyme. J Biol Chem 243, 1787–1793. [PubMed] [Google Scholar]
- [24].Hollaway MR; Johnson AW; Lappert MF; Wallis OC (1980) The number of functional sites per molecule of the adenosylcobalamin-dependent enzyme, ethanolamine deaminase, as determined by a kinetic method. Eur. J. Biochem 111, 177–188. [DOI] [PubMed] [Google Scholar]
- [25].Bandarian V; Reed GH (1999) Hydrazine cation radical in the active site of ethanolamine ammonia-lyase: Mechanism-based inactivation by hydroxyethylhydrazine. Biochemistry-Us 38, 12394–12402. [DOI] [PubMed] [Google Scholar]
- [26].Moore JW; Pearson RG (1981) Kinetics and Mechanism, Wiley and Sons, New York. [Google Scholar]
- [27].Boas JF; Hicks PR; Pilbrow JR; Smith TD (1978) Interpretation of electron spin resonance spectra due to some B12-dependent enzyme reactions. J. Chem. Soc. Faraday Trans 2 74, 417–431. [Google Scholar]
- [28].Canfield JM; Warncke K (2002) Geometry of Reactant Centers in the CoII-Substrate Radical Pair State of Coenzyme B12-Dependent Ethanolamine Deaminase Determined by using Orientation-Selection-ESEEM Spectroscopy. J. Phys. Chem. B 106, 8831–8841. [DOI] [PubMed] [Google Scholar]
- [29].Ke SC (2003) Spin-spin interaction in ethanolamine deaminase. Biochim. Biophys. Acta 1620, 267–272. [DOI] [PubMed] [Google Scholar]
- [30].Wang M; Warncke K (2008) Kinetic and Thermodynamic Characterization of CoII-Substrate Radical Pair Formation in Coenzyme B12-Dependent Ethanolamine Ammonia-Lyase in a Cryosolvent System by using Time-Resolved, Full-Spectrum Continuous-Wave Electron Paramagnetic Resonance Spectroscopy. J. Am. Chem. Soc 130, 4846–4858. [DOI] [PubMed] [Google Scholar]
- [31].Wetmore SD; Smith DM; Bennet JT; Radom L (2002) Understanding the Mechanism of Action of B12-Dependent Ethanolamine Ammonia-Lyase: Synergistic Interactions at Play. J. Am. Chem. Soc 124, 14054–14065. [DOI] [PubMed] [Google Scholar]
- [32].Semialjac M; Schwartz H (2003) Computational study on mechanistic details of the aminoethanol rearrangement catalyzed by the vitamin B12-dependent ethanolamine ammonia lyase: His and Asp/Glu acting simultaneously as catalytic auxilliaries. J. Org. Chem 68, 6967–6983. [DOI] [PubMed] [Google Scholar]
- [33].Sandala GM; Smith DM; Radom L (2005) Divergent mechanisms of suicide inactivation for ethanolamine ammonia-lyase. J. Am. Chem. Soc 127, 8856–8864. [DOI] [PubMed] [Google Scholar]
- [34].Chowdhury S; Banerjee R (2000) Evidence for quantum mechanical tunneling in the coupled cobalt-carbon bond homolysis-substrate radical generation catalyzed by methylmalonyl-CoA mutase. J. Am. Chem. Soc 122, 5417–5418. [Google Scholar]
- [35].Marsh NEN; Ballou DP (1998) Coupling of cobalt-carbon bond homolysis and hydrogen atom abstraction in adenosylcobalamin-dependent glutamate mutase. Biochemistry-Us 37, 11864–11872. [DOI] [PubMed] [Google Scholar]
- [36].Agmon N (2004) Coupling of protein relaxation to ligand binding and migration in myoglobin. Biophys. J 87, 1537–1543. [DOI] [PMC free article] [PubMed] [Google Scholar]
Associated Data
This section collects any data citations, data availability statements, or supplementary materials included in this article.