

Abstract
The temperature-dependent structure and dynamics of two concentric solvent phases, the protein-associated domain (PAD) and mesodomain, that surround the protein, ethanolamine ammonia-lyase (EAL) from Salmonella typhimurium in frozen polycrystalline aqueous solution are addressed by using electron paramagnetic resonance (EPR) spectroscopy of the paramagnetic nitroxide spin probe, TEMPOL, over the temperature (T) range, 195–265 K. Dimethyl sulfoxide (DMSO; added at 0.5, 2.0 and 4.0 % v/v), and present at the maximum freeze concentration at T≤245 K, varies the volume of the interstitial aqueous-DMSO mesodomain (Vmeso), relative to a fixed PAD volume (VPAD). The increase in Vmeso/VPAD from 0.8 to 6.0 is quantified by the partitioning of TEMPOL between the two phases. As Vmeso/VPAD is increased, Arrhenius parameters for activated TEMPOL rotational motion in the mesodomain remain uniform, while the parameters for TEMPOL in the PAD show a progressive transformation toward the mesodomain values (higher-mobility). An order-disorder transition (ODT) in the PAD is detected by exclusion of TEMPOL from the PAD into the mesodomain. The ODT T value is systematically lowered by increased Vmeso/VPAD (from 215 to 200 K), and PAD ordering kinks the mesodomain Arrhenius dependence. Thus, there is reciprocity in PAD-mesodomain solvent coupling. The results are interpreted as a dominant influence of ice-boundary confinement on PAD solvent structure and dynamics, that is transmitted through the mesodomain, and which decreases with mesodomain volume at increased added DMSO. The systematic tuning of PAD and mesodomain solvent dynamics by variation of added DMSO is an incisive approach for resolution of contributions of protein-solvent dynamical coupling to EAL catalysis.
Graphical Abstract

INTRODUCTION
The configurational states characteristic of a native, folded protein monomer or subunit at room temperature (T) are linked by a hierarchy of fluctuations among positions of the polypeptide backbone, and amino acid side chains and substituents.1–2 The presence of solvent water is necessary to enable the native protein configurational fluctuations.3 In the dehydrated state, amplitudes of protein motions are severely suppressed.4 Study of partially hydrated protein powder samples by using scattering techniques and dielectric spectroscopy indicate that graded addition of water up to a hydration level (h, g water/g protein) of ~0.5 increases the amplitudes of a broad spectrum of collective and local motions,4–5 that are akin to the α- and β-fluctuations, respectively, that are described for glass-forming solutions. At h~2, a two water molecule-thick, “protein hydration layer” (~6 Å) surrounds the protein, which is sufficient to support basic native protein functions, such as small-molecule migration through the interior.1 The presence of additional, “bulk” water around the hydration layer enables larger-scale configurational fluctuations of the protein, which allow small molecule ingress/egress.1 Reciprocally, unique structural and dynamical characteristics of the protein hydration water extend into the bulk phase.6–7 Understanding the interplay of protein, hydration and bulk solvent dynamics is essential for molecular-mechanistic description of the chemical steps,8–9 and conformational steps that bracket them,10–11 in enzyme catalysis. Here, we address the dynamics of two distinct solvent components that surround the protein, ethanolamine ammonia-lyase (EAL; EC 4.3.1.7),12 from Salmonella typhimurium, by using electron paramagnetic resonance (EPR) spectroscopy of the paramagnetic nitroxide (aminoxyl) spin probe, TEMPOL,13 in a frozen polycrystalline aqueous solution system14 over the wide temperature (T) range of 195–265 K. Dimethyl sulfoxide (DMSO) cosolvent (added prior to freezing at 0.5, 1.0,14 2.0, and 4.0 % v/v) is used to manipulate the solvent dynamics.
During freezing of the low-concentration DMSO solutions, an interstitial mesodomain15–17 is created by the exclusion of DMSO from the growing ice crystallite domains. TEMPOL is also excluded from the ice domains.14, 18 As T descends, the cosolvent concentration in the mesodomain is elevated to the maximum freeze-concentration, which corresponds to the eutectic point in the melting temperature-composition dependence.15 For aqueous-DMSO solutions, the maximum freeze-concentration is 65% v/v.19 The aqueous-DMSO in the low-T mesodomain forms a high-viscosity (η) fluid in the T-range of 195–265 K.20 Values of η of 14 – 340 cP over 263 – 218 K, and a calorimetrically-determined glass transition temperature of Tg=145 K, are reported for bulk aqueous 65% v/v DMSO solutions.20 Previous measurements of the T-dependence of TEMPOL spin probe rotational mobility in frozen solutions in the presence and absence of EAL and added 1% v/v DMSO resolved two solvent components that surround the protein:14 (1) a protein-associated domain (PAD; proposed to correspond to the protein hydration layer), characterized by relatively low TEMPOL mobility, and (2) an aqueous-DMSO mesodomain phase that concentrically envelops the PAD, characterized by relatively high TEMPOL mobility. The assignment of the PAD solvent phase was based on the direct dependence of its volume on varied EAL concentration, with no PAD component observed in the absence of EAL.14 The mesodomain solvent phase assignment reflected the near-identical T-dependence of TEMPOL mobility in the absence and presence of EAL.14
The X-band EPR spin probe approach has previously been used to characterize structure and dynamics of mesodomains in frozen, bulk polycrystalline aqueous–sucrose,18 aqueous-glycerol,21 and sub-phases in other solvent mixtures,22 in the absence of protein. TEMPOL rotational motion leads to averaging of the unpaired electron (S=1/2) g- and electron-14N (I=1) dipolar hyperfine- anisotropies, and a consequent narrowing of the EPR lineshape,13 which is quantified by the rotational correlation time (τc) obtained from spectral simulations. X-band, continuous wave-EPR is sensitive to TEMPOL tumbling motion in the τc range of ~10−11 (rapid limit) to 10−7 s (defined as the rigid limit).22
Here, we use added DMSO concentrations of 0.5, 2.0 and 4.0 % v/v to vary the volume of the mesodomain (Vmeso), relative to a fixed PAD volume (VPAD) over a range of Vmeso/VPAD from 0.8 to 6.0. TEMPOL rotational motion for each condition is addressed by EPR spectrscopy and simulations over the T-range of 200 – 265 K. The increase in Vmeso/VPAD is characterized by a simple partitioning relation for TEMPOL between the two phases, which supports the model of concentric PAD and mesodomain solvent layers around EAL. An order-disorder transition (ODT) in the PAD is detected, based on exclusion of TEMPOL from the PAD and into the mesodomain. The T-dependent TEMPOL rotational motion in the PAD is facilitated, and the transition T value for the ODT is lowered, by increased Vmeso/VPAD. The results are accounted for in a model of the protein-PAD-mesodomain-ice system, in which solvent-ordering confinement effects23–25 of the ice boundary and the sub-ODT hydration layer are modulated by the volume of the intervening mesodomain, which is systematically dependent on the amount of added DMSO. The evidenced persistence of local and collective solvent fluctuations in the mesodomain into the cryo-T regime rationalizes the native catalytic performance of EAL under comparable conditions in frozen aqueous solutions.26–29 The systematic tuning of PAD and mesodomain solvent dynamics by variation of added DMSO is an incisive approach that can be applied to resolve contributions of protein-solvent dynamical coupling to EAL catalysis.
EXPERIMENTAL METHODS
Sample preparation.
All chemicals were purchased from commercial sources, including DMSO (purity, ≥99.9%; EMD Chemical), and deionized water was used (resistivity, 18.2 MΩ·cm; Nanopure system, Siemens). The EAL protein from S. typhimurium was obtained from an Escherichia coli overexpression systems and purified as described,30–31 with modifications.29 The specific activity of purified EAL with aminoethanol as substrate was 20 μmol/min/mg (T=298 K, P=1 atm), as determined by using the coupled assay with alcohol dehydrogenase and NADH.32 Protein samples included 10 mM potassium phosphate buffer (pH 7.5), 20 μM EAL protein, and 0.2 mM TEMPOL spin probe (4-hydroxy-TEMPO, Sigma-Aldrich; added from a freshly-prepared stock solution in water) in a final volume of 0.3 ml. When present, DMSO was added to 0.5, 2.0, and 4.0% v/v, respectively, relative to the final, 0.3 ml volume of the EPR sample. The EPR samples were prepared aerobically, on ice in small vials, mixed, and loaded into 4 mm outer diameter EPR tubes (Wilmad-LabGlass). The samples were frozen by immersion in isopentane solution at T=140 K. This method has a characteristic cooling rate of 10 K/s.29 Samples were transferred to liquid nitrogen for storage. Samples without EAL protein were prepared by the same methods, in 2 mm outer diameter EPR tubes.
Continuous-wave EPR spectroscopy.
Continuous-wave EPR measurements were performed by using a Bruker E500 ElexSys EPR spectrometer and ER4123SHQE X-band cavity resonator as described.14 EPR acquisition parameters: Microwave frequency, 9.45 GHz; microwave power, 0.2 mW; magnetic field modulation, 0.2 mT; modulation frequency, 100 kHz; acquisition number, 4–8 spectra were averaged at each T value.
EPR Spectrum Simulations.
The EPR spectrum of TEMPOL in the random-orientation samples arises from the electron Zeeman interaction (defined by the g tensor) and the interaction of the unpaired electron spin (S=1/2) with the nitroxide 14N nucleus (I =1), which produces three dominant spectral features, that correspond to electron spin-spin transitions between the ms=±1/2 electron spin energy levels, among mI=0, ± 1 nuclear spin energy levels.13 Simulations of the continuous-wave-EPR spectra were performed by using the Chili algorithm in the program, EasySpin,33 with a common set of g tensor and 14N hyperfine tensor parameters, as described.14 Briefly, simulations required one component for solution-only (-EAL) samples and two components for samples with EAL. For the solution-only samples, the simulations were performed by variation of the rotational correlation time (τc) and the corresponding intrinsic line width (“lw” parameter, in EasySpin). The two-component simulations were performed by variation of the correlation times and weights for the slow-motional (τc,s; normalized weight, Ws) and fast-motional (τc,f; normalized weight, Wf) components, and the corresponding intrinsic line widths. Comparisons of one- and two-component simulations for representative types of line shapes are shown in Figure S1. The X-band, CW-EPR spin probe approach is sensitive to TEMPOL reorientational motion in the τc range of ~10−11 (rapid reorientation limit) to 10−7 s (defined as the rigid limit).22
RESULTS
Temperature dependence of the TEMPOL EPR line shape in frozen aqueous solution with EAL.
The effect of T on the EPR line shape of the TEMPOL spin probe at different representative values from the complete addressed range of 200–265 K is shown in Figure 1 for the EAL, added 0.5, 2.0 and 4.0% v/v DMSO conditions. For all DMSO concentrations, the rigid-limit, powder pattern line shape is observed at the lowest T value, and at the highest T values, the widths of the mI lines narrow, and the overall spectral width approaches twice the value of the 14N isotropic hyperfine coupling constant (2Aiso=3.4 mT=96 MHz). The transition from the rigid-limit, powder pattern line shape to initial motional-narrowed spectra, that represent averaging of the g-tensor and electron-nuclear dipolar anisotropy by rotational, tumbling motion of the TEMPOL, occurs at different T values, that decrease with added DMSO concentration. Likewise, the T values at which significant line-narrowing occurs, owing to rapid tumbling, also decrease with added DMSO concentration. Therefore, the line shapes in Figure 1 qualitatively show that increased added DMSO shifts the onset and trend of increased tumbling rate to lower T values.
Figure 1.

Temperature dependence of the TEMPOL EPR spectrum (black), in the presence of EAL, at different added % v/v DMSO, and overlaid two-component EPR simulations (dashed, red). (A) 0.5%. (B) 2%. (C) 4%. The spectra are normalized to the central peak-to-trough amplitude. Alignment along the magnetic field axis corresponds to the microwave frequency at 200 K.
Temperature dependence of the TEMPOL rotational correlation times and normalized component weights in frozen aqueous solution with EAL.
The EPR spectra were simulated33 to quantify the temperature dependence of the rotational mobility in terms of the τc and normalized W values of TEMPOL mobility components (Table I). The T-dependence of τc in the presence of EAL at 0.5, 2.0, and 4.0 % v/v DMSO displays two-component behavior, where the two components are characterized by a relatively small τc value (denoted as the “fast” tumbling component, τc,f) and a relatively large τc value (denoted as the “slow” tumbling component, τc,s). The dependence of logτc on T in Figure 2 (data are presented in Tables S1–S3) is divided into four regions, as follows: Region I: Both logτc values lie above the tumbling detection criterion, of logτc>−7.0. Region II: A fast-tumbling population is present, with logτc,f≤–7.0 and decreasing with T, along with a rigid population (simulated logτc,s>–7.0). The T value, at which the logτc,f and logτc,s values meet the criterion for detectable tumbling of ≤–7.0, TII/III, marks the boundary of Region II and Region III. The TII/III value decreases with increasing % v/v DMSO, as previously reported for 1.0 versus 0% v/v DMSO.14 Region III: Both fast- and slow-tumbling populations are present, with logτc,f and logτc,s continuing to decrease with T. Figure 2 shows that, for all % v/v DMSO conditions, the normalized weights of the slow component (Ws) and fast component (Wf) display a transition, that is centered near the boundary of Region II and Region III (at TII/III), at which Ws joins Wf as a detectable tumbling component (Table 1). With increasing T across the transition, there is a shift in population from Wf to Ws. At T>TII/III, Wf and Ws are constant in Region III. Region IV: The T dependence displays a kink, followed by a subtle trend of increased proportion of Wf, for all DMSO concentrations for T>245 K.
Table 1.
Arrhenius parameters obtained from the temperature-dependence of the rotational correlation times of TEMPOL at 0.5, 1.0, 2.0 and 4.0 % v/v DMSO, in Region III.
| Ea (kcal/mol) | |||
|---|---|---|---|
| DMSO (% v/v) | +EAL PAD | +EAL mesodomain | -EAL mesodomain |
| 0.5 | 13 ±0.61 | 8.5 ±0.20 | 8.6 ±0.39 |
| 1.0 | 11 ±0.73 | 9.0 ±0.32 | 8.7 ±0.28 |
| 2.0 | 9.2 ±0.40 | 7.9 ±0.23 | 9.0 ±0.42 |
| 4.0 | 9.0 ±0.31 | 8.5 ±0.12 | 8.5 ±0.22 |
| -log[τc,0 (s)] | |||
| DMSO (% v/v) | +EAL PAD | +EAL Mesodomain | -EAL Mesodomain |
| 0.5 | 20 ±0.57 | 17 ±0.19 | 17 ±0.37 |
| 1.0 | 19 ±0.70 | 17 ±0.30 | 17 ±0.27 |
| 2.0 | 17 ±0.39 | 16 ±0.22 | 17 ±0.40 |
| 4.0 | 17 ±0.31 | 17 ±0.12 | 16 ±0.21 |
Figure 2.
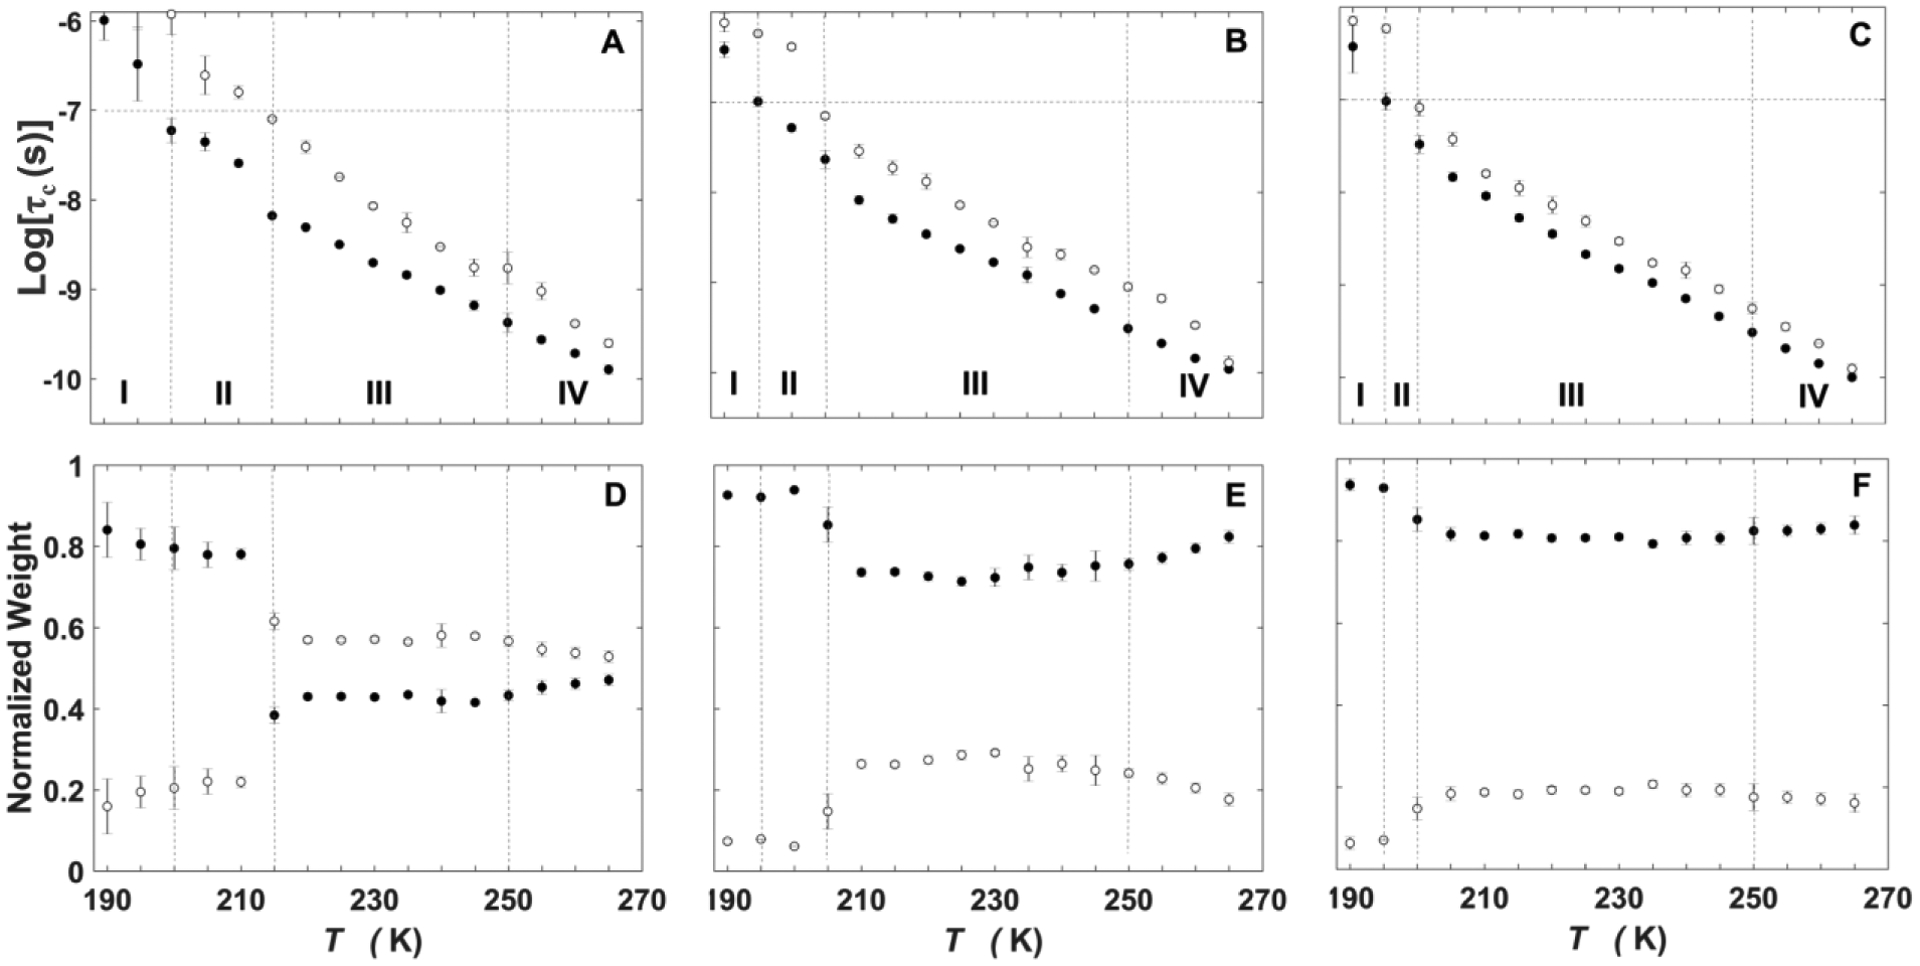
Temperature dependence of the rotational correlation time of TEMPOL and normalized mobility component weights, in the presence of EAL, at different added % v/v DMSO. Rotational correlation time: (A) 0.5%. (B) 2%. (C) 4%. Horizontal line represents upper limit of logτc = −7.0 for detection of tumbling motion. Normalized component weight: (D) 0.5%. (E) 2%. (F) 4%. In each panel, solid circles represent the fast component (logτc,f, Wf) and open circles represent the slow component (logτc,s, Ws). Error bars represent standard deviations for three separate determinations.
Temperature dependence of the TEMPOL spectral line shape in the absence of EAL: 0.5, 2.0 and 4.0 % v/v DMSO.
Frozen aqueous solutions with 0.5, 2.0 and 4.0 % v/v DMSO, in the absence of EAL (–EAL condition), yielded characteristic three-line TEMPOL EPR spectra at all T values (Figure 3). A single component is observed, as reported previously for 1.0% v/v DMSO in the absence of EAL.14 For all DMSO concentrations, the trend of transformation of the rigid-limit, powder pattern line shape to the motionally-averaged spectrum at higher T values, that was observed for the +EAL samples, is reproduced.
Figure 3.

Temperature dependence of the TEMPOL EPR spectrum (black), in the absence of EAL, at different added % v/v DMSO, and overlaid EPR simulations (dashed red lines). (A) 0.5%. (B) 2%. (C) 4%. The spectra are normalized to the central peak-to-trough amplitude. Alignment along the magnetic field axis corresponds to the microwave frequency at 200 K.
Temperature dependence of the TEMPOL rotational correlation times and normalized component weights in solution, in the absence of EAL.
The EPR spectra for 0.5, 2.0 and 4.0 % v/v DMSO in the –EAL condition (Figure 3) were simulated by using a single mobility component (single τc value; data are presented in Tables S4–S6). As shown in Figure 4, the T-dependences of logτc,f (+EAL) and logτc (-EAL) are comparable for each condition. The results indicate that the Wf components in the 0.5, 2.0 and 4.0 % v/v DMSO, +EAL conditions are associated with a DMSO-aqueous mesodomain phase, as concluded previously for the 1.0% v/v DMSO condition.14 The logτc,s values are distinct from the monotonic logτc values obtained for the –EAL condition (Figure 4), indicating that Ws represents a different TEMPOL environment. This pattern has been previously reported in 1.0% v/v DMSO solution in the presence and absence of EAL, where it was established, from the linear dependence of Ws on EAL concentration, that the Ws component originates from the PAD.14
Figure 4.
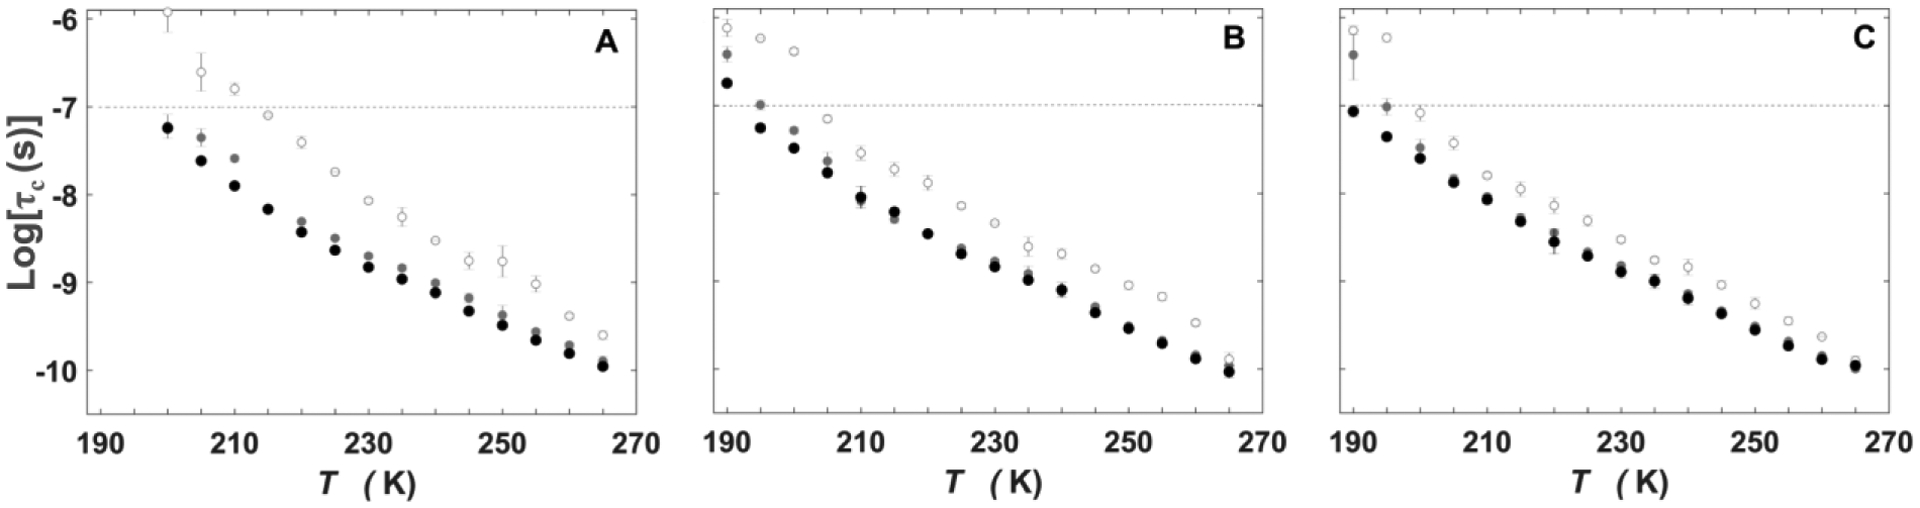
Temperature dependence of the rotational correlation time of TEMPOL, in the absence and presence of EAL, at different added % v/v DMSO. (A) 0.5%. (B) 2%. (C) 4%. In each panel, black solid circles represent the single component, –EAL (logτc), and grey solid (fast, logτc,f) and open (slow, logτc,s) represent components, +EAL. Horizontal line represents upper limit of τc for detection of tumbling motion. Error bars represent standard deviations for three separate determinations.
DISCUSSION
Added DMSO resides in the mesodomain.
The Wf and Ws values are constant in Region III at each value of added % v/v DMSO (Figure 2). As the added DMSO increases, the constant value of Wf increases, as Ws compensatorially decreases. This indicates that Vmeso increases with added DMSO, relative to VPAD. Previously, VPAD was shown to be linearly dependent on EAL concentration, and thus, independent of the relative value of Vmeso, at added 1.0 % v/v DMSO.14 This is consistent with the previouly characterized exclusion of DMSO from the protein hydration layer, promoting the “preferential hydration” condition, which favors the native state of folded proteins.34 A folded state of EAL in the DMSO-mesodomain system is supported by native cofactor-protein interactions35 and function36–37 at low T values in fluid, bulk aqueous-DMSO (41 and 50 % v/v) solution. Based on these considerations, we propose that Vmeso increases relative to VPAD, as the added DMSO is increased, and that the larger reservoir of mesodomain recruits a higher proportion of TEMPOL, by mass-action. This model is quantified by using the following expression, that relates the measured Wf and Ws values to the partition coefficient (P) of TEMPOL between the mesodomain and PAD, and the volumes of the two solvent components:
| (1) |
The volume of the mesodomain is dependent on the volume of added DMSO (VDMSO) as:
| (2) |
where γmeso is a proportionality constant, that accounts for the hydration of DMSO in the mesodomain. Combination of eq 1 and eq 2 gives:
| (3) |
A linear relation between Ws/Wf and 1/VDMSO, consistent with eq 3, is verified (Figure 5). Therefore, a negligible proportion of the added DMSO resides in the PAD, and added DMSO contributes primarily to an increase in Vmeso. From the slope of the linear relation, PVPAD/γmeso=1.9 μL. The value of γmeso is related to the maximum freeze-concentration of aqueous-DMSO solution, which is 65% v/v.19 Thus, for γmeso=1/0.65, PVPAD=2.9 μL.
Figure 5.
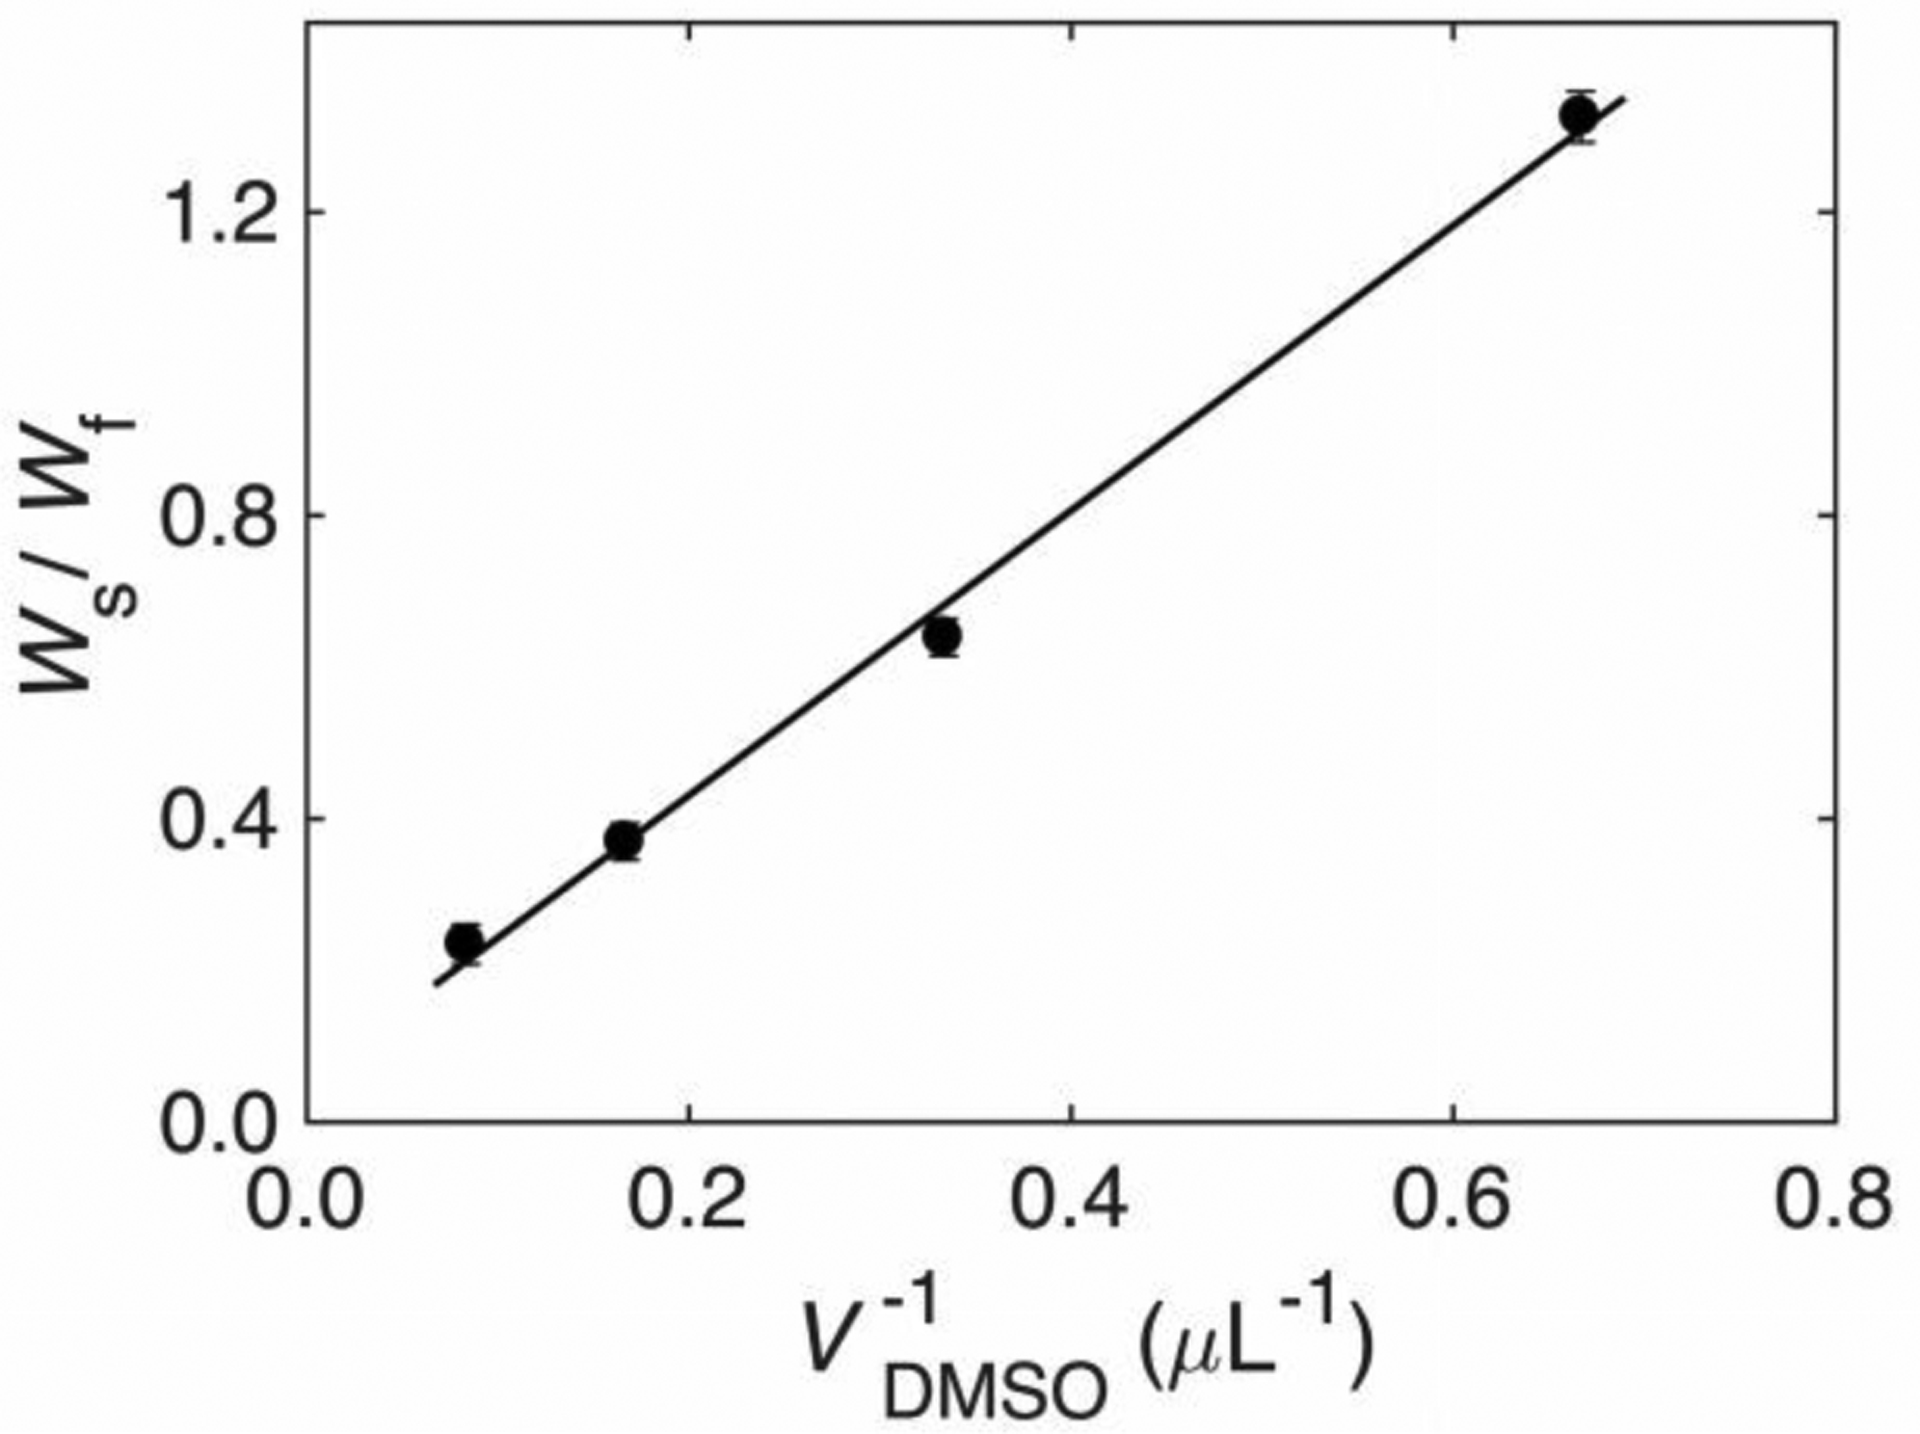
Dependence of the ratio of the slow- and fast-tumbling component weights on the inverse concentration of added DMSO in Region III, and overlaid best-fit linear relation. Error bars represent standard deviations for three data sets. Parameters: slope, 1.89 ±0.17 μL; y-intercept, 0.051 ±0.067 (R2=0.9963).
Estimation of the relative dimensions of mesodomain and PAD.
The demonstrated association of PAD with EAL, and the facile exchange of TEMPOL between PAD and mesodomain, led to the model of concentric PAD and mesodomain layers around EAL.14 We now refine this model, and estimate the mean thickness, t, of these layers. For the representative condition of added 2.0% v/v DMSO, a value of Vmeso=6.0 μL/0.65, or 9.2 μL is obtained from eq 2. The accessible surface area of the EAL oligomer of 1.3×10⁵ Å2 is calculated38 by using the X-ray crystallographic structure39 –based model for the S. typhimurium oligomer.40 The experimental condition of 20 μM EAL oligomer (3.0 mg per EPR sample), corresponds to 4.0×10¹⁵ EAL, based on a molecular mass, 4.88×10⁵ g/mol41.38 An assumed thickness of the protein hydration layer of approximately two water molecules, or tPAD=6 Å,1 leads to an estimated VPAD=3.1 μL for a planar equivalent of the accessible surface area.14 Thus, from the relation, PVPAD=2.9 μL, P is near unity. The estimated mean mesodomain thicknesses, tmeso, for added 0.5, 1.0,14 2.0, and 4.0 % v/v DMSO are approximately 5, 9, 18 and 36 Å, respectively, thus covering a range from tmeso<tPAD to tmeso>tPAD. The simple, uniform thickness, planar layer model captures global features of the solvent environment around EAL, but ignores the topography and heterogeneous properties (e.g., polarity, charge, hydrogen-bonding) of the EAL protein surface,39–40 which might lead to solvent clustering and regions of varying layer thickness.
Resolution of an order-disorder transition in the protein-associated domain.
The abrupt decrease in Ws and compensating increase in Wf, in the direction of decreasing T at the Region II/III boundary, is proposed to represent a transition from a disordered to ordered state of the PAD. (This type of transition is most commonly referred to as an “order-disorder transition,” and thus, in the sense of word sequence, it is defined for the direction of change from ordered to disordered. We thus refer to the proposed transition in the PAD as an order-disorder transition, ODT. In the direction of decreasing T, the PAD changes from a disorded to an ordered state. In the direction of increasing T, the PAD changes from an ordered to a disordered state.). The change in W values is not expected from extrapolation of the constant, Region III values of Ws and Wf across TII/III into Region II, and it occurs over a T-range for which both logτc,s and logτc,f are ≤−7.0 (Figure 2). Detectability of τc,f extends into Region II. Therefore, the change in W values is not an artifact of exceeding the mobility-detection bandwidth of the spin-probe EPR technique at X-band. We propose that the change in weights, quantified as ΔWs=Ws,II – Ws,III, where Ws,II and Ws,III are the slow component weights in Regions II (ordered PAD) and III (disordered PAD), arises from partial exclusion42 of TEMPOL from the PAD, owing to increased solvent order in the PAD. The change in weight can be expressed as:
| (4) |
where the exclusion coefficient, ε, represents the normalized weight component of TEMPOL that is excluded from the PAD and transferred into the mesodomain. Values of ΔWs, Ws,II, Ws,III, and ε are collected in Table S7. The mean value of ε for the different % v/v DMSO conditions is 0.70 ±0.07. Thus, 70% of the TEMPOL in the disordered PAD is excluded, upon decreasing T through the ODT at TII/III. Independence of the value of ε from added DMSO provides additional support for a constant PAD volume and properties at the different added % v/v DMSO.
Mechanism of coupling of TEMPOL rotational motion to solvent motions.
The rotational correlation time of a probe molecule in a bulk solution of smaller solvent molecules typically displays a high-T regime characterized by direct dependence on the solvent viscosity, η (Debye-Stokes-Einstein behavior).43–44 As T decreases, the exponential T-dependence of η45 leads to a rapid increase in η, and Arrhenius (logτc versus 1/T) plots over the full T-range display concave-up curvature. At high η values, decoupling of probe rotation and collective solvent motions leads to independence of τc and η.43–44 This breakdown of Debye-Stokes-Einstein behavior is signalled by a linear Arrhenius dependence. For nitroxide and other small spin probes in bulk aqueous-cosolvent fluids, divergence from Debye-Stokes-Einstein behavior begins at logτc ≈ −8.5.43–44 The large η values (>10 cP) for aqueous-DMSO at the maximum freeze-concentration for the T values of Region III (Figure S2) are consistent with the T values associated with Debye-Stokes-Einstein behavior breakdown.20 Confinement can also suppress η-coupled collective solvent motions, which could lead to deviations from Debye-Stokes-Einstein behavior.46 Figures 6 and 7 show that the logτc versus 1/T dependences in Region III for TEMPOL in the PAD and mesodomain in the presence of EAL are linear. Therefore, τc is independent of η in each phase in Region III, in accord with expectation. Although collective solvent motions, similar to α-fluctuations observed in super-cooled fluids,47 exist in confined systems,48 the η-independent TEMPOL rotational motion does not represent collective solvent motions on the time-scale corresponding to the X-band EPR detection bandwidth, τc ~10−11–10−7 s. Rather, TEMPOL rotational motion reports on mesodomain and PAD solvent structure and dynamics through their effects on localized motions of single solvent molecules (β-fluctuations),1, 45 or small clusters (Johari-Goldstein β-fluctuations),49–50 that influence the properties of the solvent “cage,” that surrounds TEMPOL.
Figure 6.
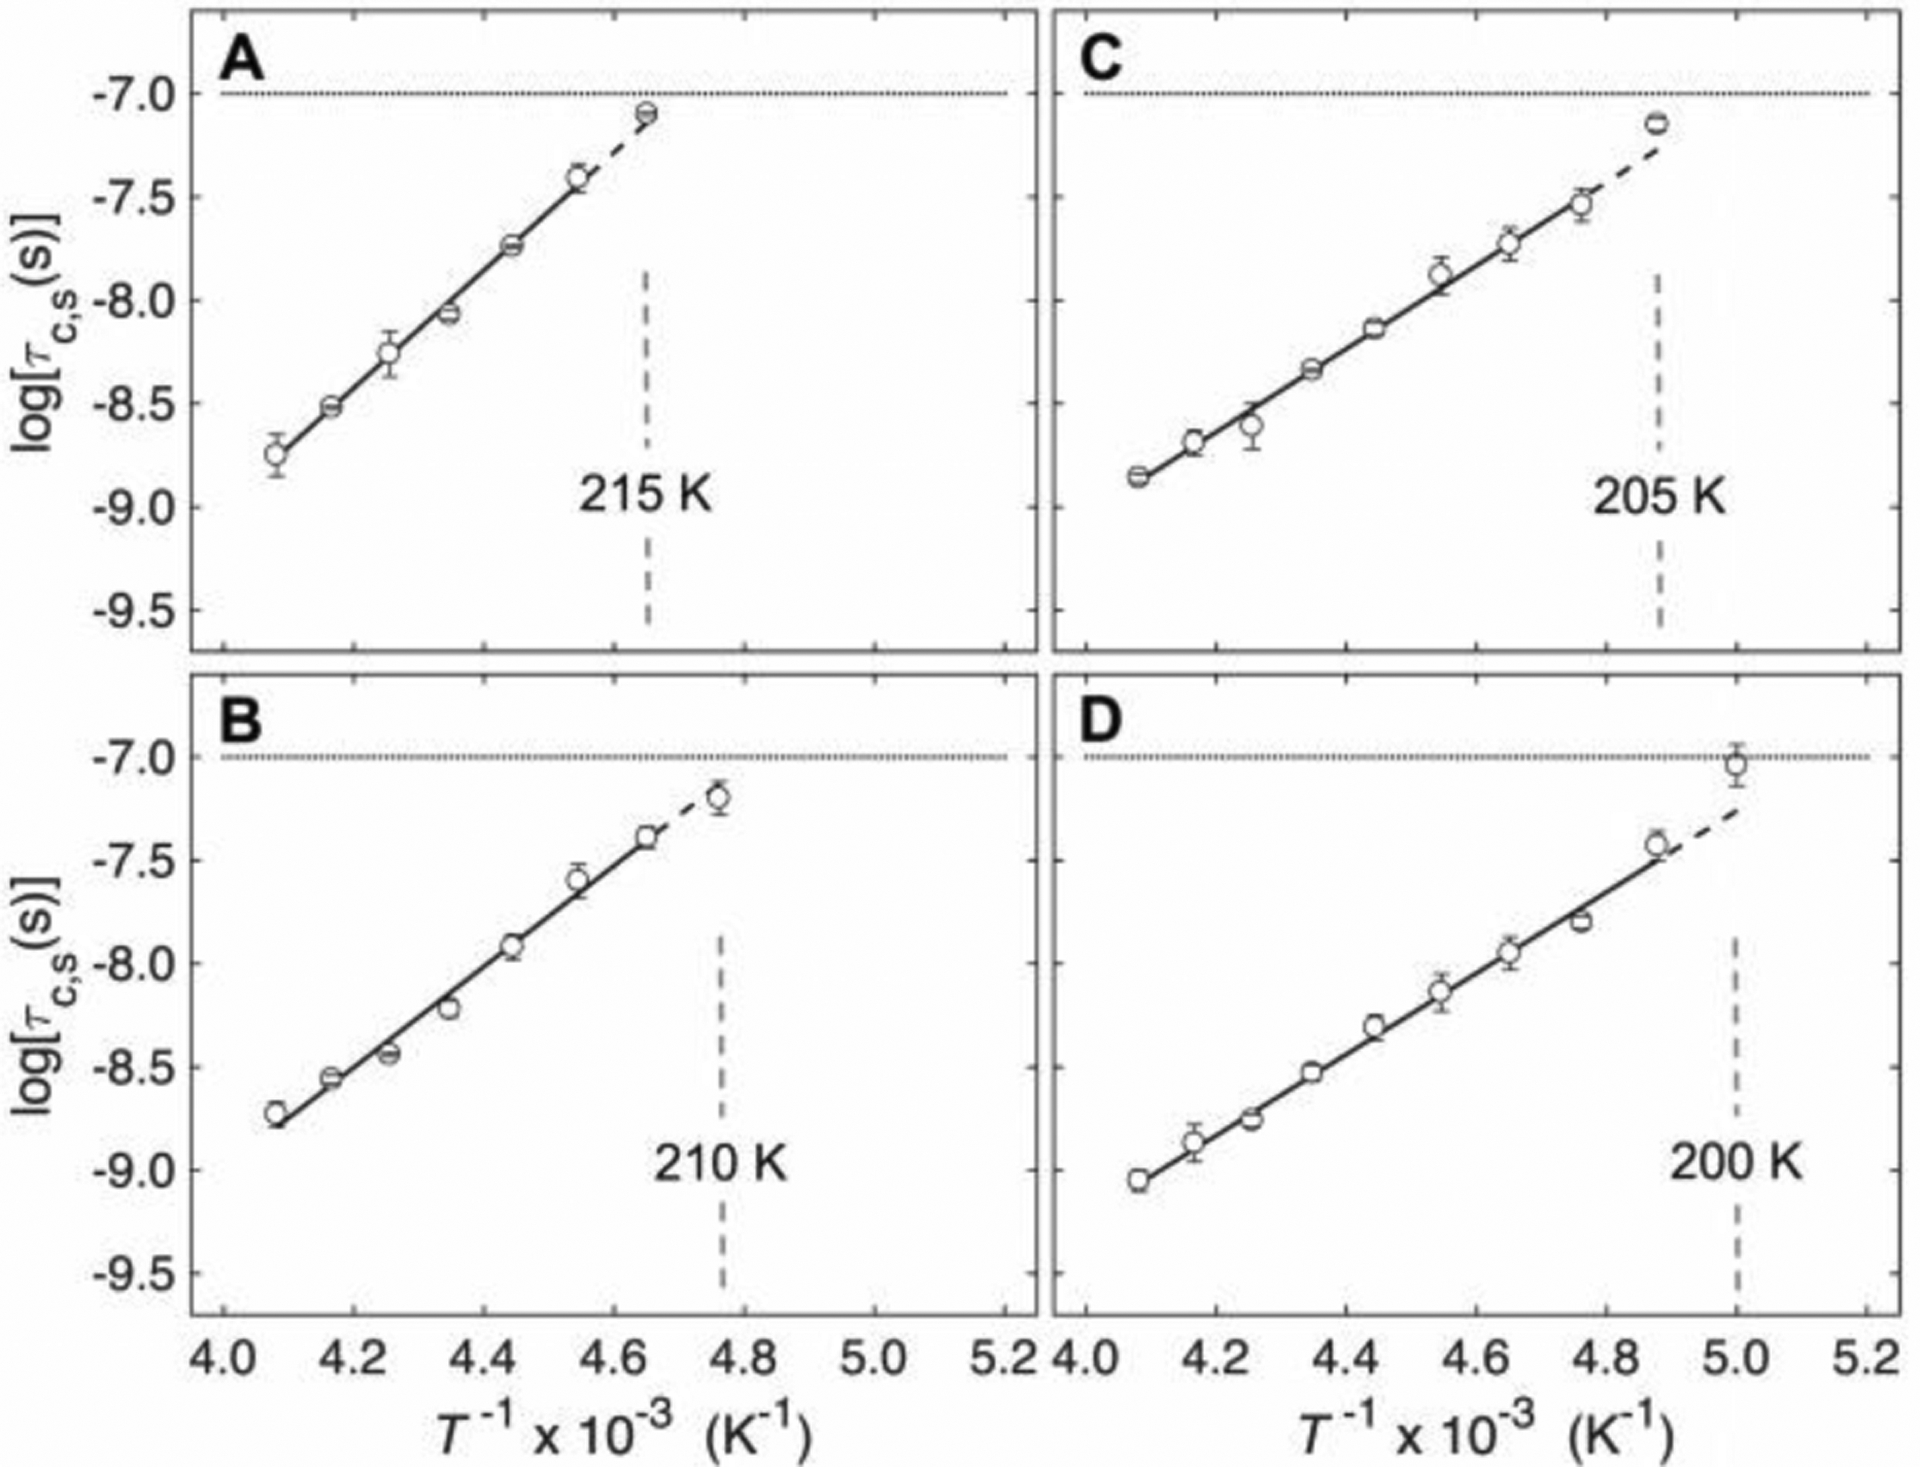
Arrhenius dependence of rotational correlation times for TEMPOL in the PAD (τc,s) at different added % v/v DMSO. (A) 0.5%. (B) 1.0%.14 (C) 2%. (D) 4%. Vertical dashed line represents TII/III for the ODT. Linear fit for Region III (solid line) and extrapolation into Region II (T<TII/III; dashed line) are shown. Horizontal line represents upper limit of τc for detection of tumbling motion. Error bars correspond to standard deviations for three separate experiments at each temperature. R2 values for linear fit: 0.5 (0.9955), 1.0 (0.9871), 2.0 (0.9923), 4.0 (0.9939).
Figure 7.

Arrhenius dependence of rotational correlation times for TEMPOL in the mesodomain in the presence of EAL (τc,f) at different added % v/v DMSO. (A) 0.5%. (B) 1.0%.14 (C) 2%. (D) 4%. Vertical dashed line represents TII/III for the ODT. Linear fit for (Region III, solid line) and extrapolation into Region II (T<TII/III; dashed line) are shown. Horizontal line represents upper limit of τc for detection of tumbling motion. Error bars correspond to standard deviations for three separate experiments at each temperature. R2 values for linear fit: 0.5 (0.9988), 1.0 (0.9963), 2.0 (0.9966), 4.0 (0.9990).
Temperature-dependence of spin probe mobility in mesodomain and PAD in Region III.
To quantify the T-dependences of τc under the different conditions, the Arrhenius equation is used to fit the data in Region III (Figures 6, 7 and 8):
| (5) |
The PAD and mesodomain data and fits are also presented in a combined plot (Figure S3). In eq 5, τc,0 is the correlation time in the high-T limit, R is the gas constant, and Ea represents a mean energy barrier to probe reorientation. The logτc,0 and Ea values from linear fits of the Region III data in Figure 6 (PAD, τc,s) and Figure 7 (mesodomain, τc,f) are provided in Table 1. The Arrhenius parameters for TEMPOL rotational motion in the mesodomain are essentially independent of % v/v DMSO (Ea=8.5 ±0.50 kcal/mol; logτc,0= −16.8 ±0.45). In contrast, Ea for the PAD decreases with increasing % v/v DMSO, and approaches the value for the mesodomain. The kink and increase in slope at T≤TII/III for the mesodomain in Figure 7 reveals a correlation between the ODT in the PAD and the rotational dynamics of TEMPOL in the mesodomain.
Figure 8.

Arrhenius dependence of rotational correlation times for TEMPOL in the mesodomain in the absence of EAL (τc) at different added % v/v DMSO. (A) 0.5%. (B) 1.0%.14 (C) 2%. (D) 4%. Vertical dashed arrows denote position of TII/III in the +EAL system. Linear fit for Region III (solid line) and extrapolation into Region II (T<TII/III; dashed line) are shown. Horizontal line represents upper limit of τc for detection of tumbling motion. Error bars correspond to standard deviations for three separate experiments at each temperature. R2 values for linear fit: 0.5 (0.9957), 1.0 (0.9968), 2.0 (0.9914), 4.0 (0.9968).
Arrhenius plots for TEMPOL in the aqueous-DMSO mesodomain in the absence of EAL are shown in Figure 8 (parameters, Table 1). The Arrhenius parameters for the –EAL condition at each % v/v DMSO value in Region III, and the mean values (Ea =8.7 ±0.2 kcal/mol; logτc,0= −17.1 ±0.20), are the same as for the +EAL condition, to within one standard deviation. The linear Region III relations continue into Region II for 2.0 and 4.0 % v/v DMSO, which confirms that the abrupt kink at TII/III and sharp slope increase at T < TII/III in the presence of EAL arise from an effect on the mesodomain from the ODT in the PAD. The slight increase in slope observed in Region II for 0.5 and 1.0 % v/v DMSO is explained as arising from an ice boundary confinement effect, which is amplified by the proximity of TEMPOL to the ice boundary, owing to a larger ice-mesodomain interfacial area to mesodomain volume ratio for the lower % v/v DMSO conditions, in the absence of EAL.
The mean values for Ea of 8.7 and 8.9 kcal/mol for the +EAL and –EAL mesodomain are comparable to Arrhenius activation energies of 8–10 kcal/mol, that have been assigned to solvent β-fluctuations in other aqueous solvent systems.47, 51 This is consistent with the enabling of TEMPOL rotational motion by localized fluctuations of the caging solvent.
Conclusions
Model for the protein-PAD-mesodomain-ice system.
The interpretation of the TEMPOL-detected structural and dynamical properties of the protein-PAD-mesodomain-ice system in Regions II and III as a function of added DMSO and T leads to a model, that is depicted in Figure 9. Three key features of this model are: (1) The rigid ice boundary exerts the dominant solvent-structuring (ordering) confinement effect in the system, in Region III. This confinement effect is mediated through the mesodomain. The confinement effect on the PAD decreases with increased distance from the ice boundary, as the mesodomain thickness increases from an estimated 5 to 36 Å for 0.5 to 4.0 % v/v DMSO. This is quantified by the decreases in Ea and logτc,0 for TEMPOL in the PAD (corresponding to τc,s), with increasing added DMSO. At added 4.0% v/v DMSO, the Ea and logτc,0 values for the PAD and mesodomain are the same, to within two standard deviations. This suggests that the ice boundary confinement of the PAD is vanishing at 4.0% v/v DMSO, and further, that the solvent structure and motions in PAD and mesodomain, that enable TEMPOL reorientation, have common features. (2) TEMPOL rotational motion in the viscous aqueous-DMSO mesodomain is decoupled from solvent viscosity in Regions II and III (beyond the Debye-Stokes-Einstein limit). (3) TEMPOL, free in the mesodomain, migrates to regions of lowest solvent ordering, in Region III. Therefore, the mean position of TEMPOL in Region III is closer to the disordered PAD interface, than to the ice boundary. These three features of the model are depicted in Figure 9. As a consequence of model features (2) and (3), the TEMPOL logτc,f (+EAL) values in the mesodomain in Region III are comparable, and thus relatively independent of the ice boundary confinement effects, at the different added % v/v DMSO. Features (2) and (3) also account for the same values of Ea and logτc,0 for TEMPOL reorientation in the +EAL and –EAL mesodomains. Although the sensitivity of mesodomain TEMPOL rotational motion (logτc,f) to the degree of ice-boundary confinement propagated through the mesodomain is relatively low, the influence of the confinement is detected, through the effects on TEMPOL rotational motion (logτc,s) in the PAD, and the change in TII/III of the ODT.
Figure 9.
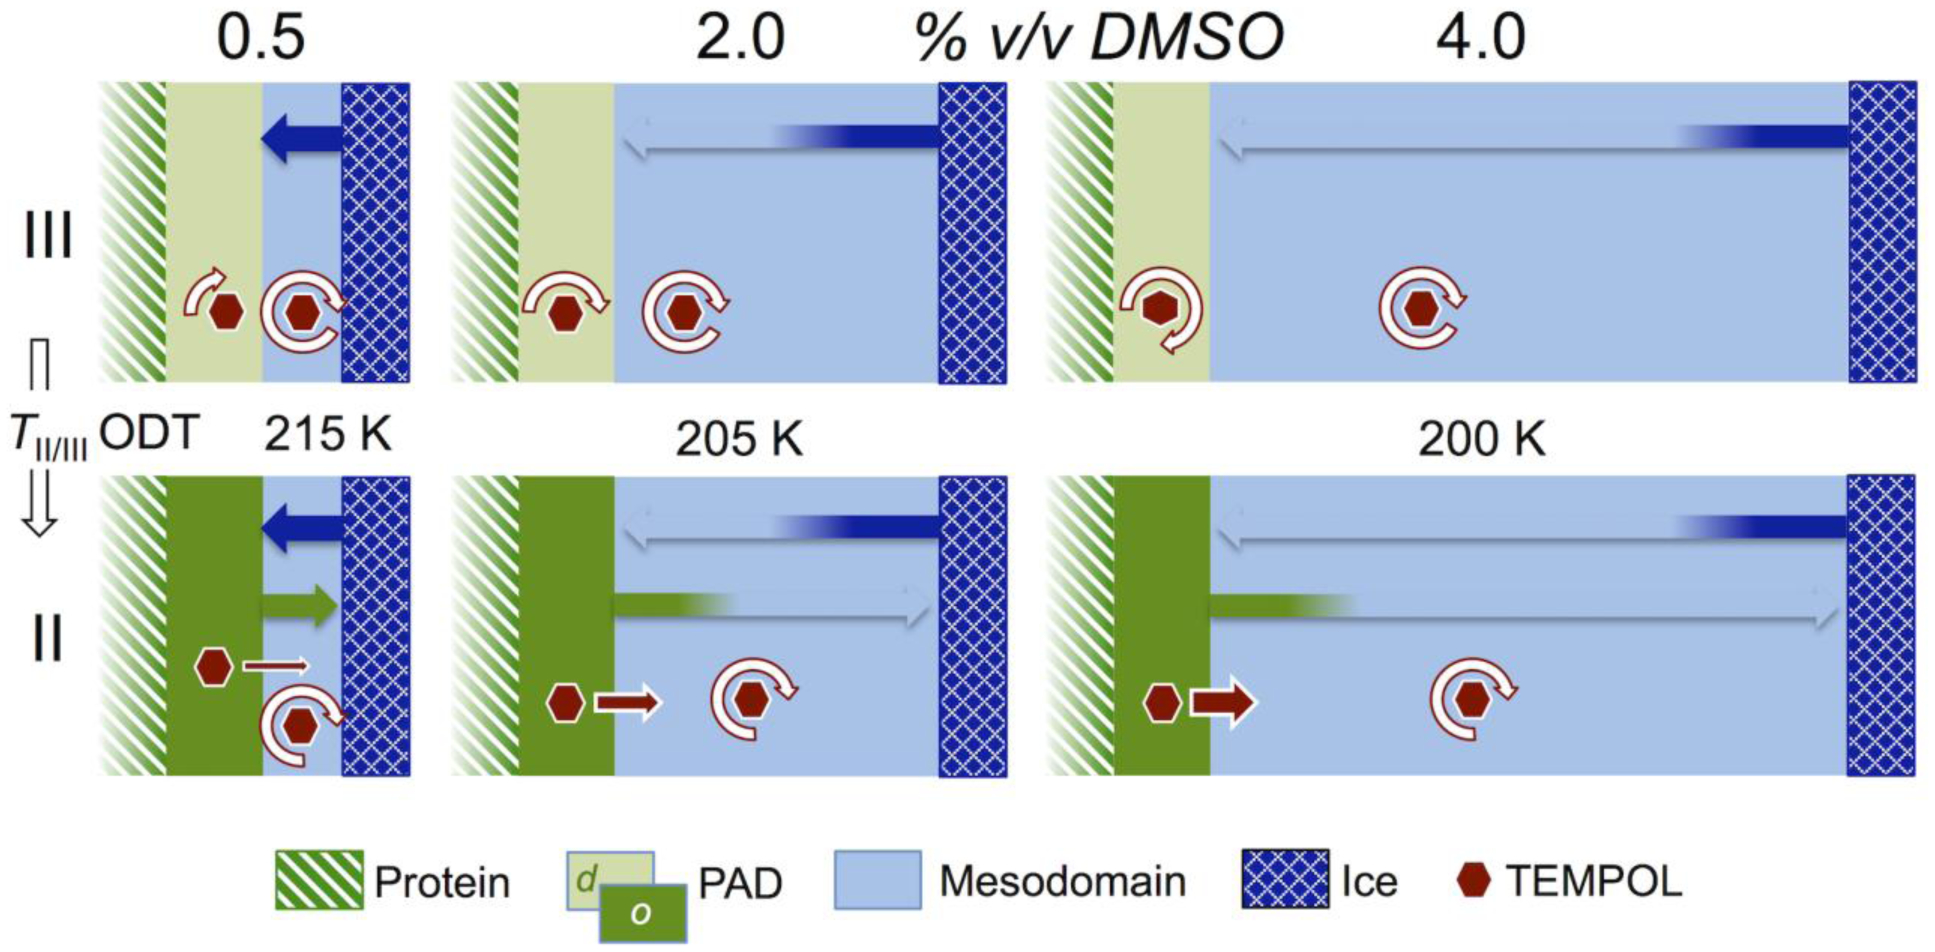
Model for the temperature-dependence of solvent dynamical and confinement effects in the protein-PAD-mesodomain-ice system, that give rise to the observed TEMPOL EPR spin probe rotational mobility and phase partitioning, as a function of added % v/v DMSO, in Regions II and III, and effect of the ODT at TII/III. Key shows color-pattern identification of phases and ordered-disordered state of the PAD. Broad arrows depict the spatial extent of confinement effects, from the ice boundary and the PAD, that are mediated through the mesodomain. The relative rotational mobility of TEMPOL is depicted by length of circular white arrows. Exclusion of TEMPOL from the PAD at the ODT is depicted by linear red arrows, whose size represents amount of TEMPOL excluded.
Origin of the ODT.
TEMPOL exclusion from the PAD at the ODT in the direction of decreasing T suggests that the PAD undergoes a change in structure. The decrease in TII/III with increasing added DMSO is consistent with the increase in mesodomain volume, and consequent diminishing confinement, from the receding ice boundary. The estimated spatial extent of strong ice boundary confinement, which must be propagated over mean mesodomain shell t-values of ≤9 Å, suggests the existence of collective solvent motions. This is consistent with the length scale of a few tens of Ångströms for cooperatively-rearranging solvent domains, that are involved in the α-process in molecular liquids.52 The range of TII/III of 200–215 K is comparable to values of a liquid-liquid phase transition (LLT), observed for water at a confinement dimension of ~20 Å.53 By analogy with the proposal for the mechanistic origin of the LLT,53 the ODT may arise from protein surface-induced ordering of the water in the PAD, through an increase in water-water hydrogen bond order.
Two-way transmission of solvent structure and dynamics at the PAD-mesodomain boundary.
At T≤TII/III, the ordering of the PAD introduces a relatively strong, local structuring effect on the mesodomain, which is manifested as a kink and increased Arrhenius plot slope for τc,f (Figure 7). Our model proposes that this relatively strong, local effect is revealed, because TEMPOL in the mesodomain is localized, on average, relatively near to the PAD/mesodomain boundary. The reciprocal confinement effect of PAD on mesodomain, relative to the mesodomain-mediated ice boundary confinement effect on the PAD, demonstrates a two-way coupling of solvent structure and dynamics, across the PAD-mesodomain interface.
Relation to EAL enzyme catalysis.
The persistence of EAL-mediated reactions with native kinetic parameters at the T values that correspond to Regions II and III and below,26–28 is consistent with the results presented here: The mesodomain maintains a reservoir of solvent fluctuations, that couple to PAD and protein fluctuations, to enable the reactions that take place in the protein interior. In the case of the EAL activity measurements in frozen solutions at cryogenic-T values,26–28 the mesodomain is created by the added substrates, aminoethanol or 2-aminopropanol, which like DMSO, behave as cryo-cosolvents.54 The nuanced control of PAD and mesodomain solvent structure and dynamics, and their mutual coupling, by added DMSO will be used to further characterize the coupling of solvent structure and dynamics to the kinetics of individual reaction steps in EAL catalysis.
Supplementary Material
ACKNOWLEDGMENTS
The authors appreciate discussions with Mr. Wei Li and Drs. Connie B. Roth, Xinru Huang and Justin Burton. This work was supported by the National Institute of Diabetes and Digestive and Kidney Diseases (NIDDK) of the National Institutes of Health (NIH) (grant R01 DK054514). The Bruker E500 EPR spectrometer was funded by the National Center for Research Resources of the NIH (grant RR17767), and by Emory University.
Footnotes
Supporting Information
The Supporting Information is available free of charge on the ACS Publications website.
Supporting figures presenting one- and two-component simulations of EPR spectra, the temperature dependence of aqueous DMSO viscosity in bulk solution at the maximum freeze concentration, and combination Arrhenius plot of PAD and mesodomain TEMPOL correlation times; Supporting tables presenting the logτc and W values at the measured temperatures for % v/v DMSO values of 0.5, 2.0, and 4.0, for the +EAL and –EAL conditions
The authors declare no competing financial interest.
REFERENCES
- (1).Frauenfelder H; Chen G; Berendzen J; Fenimore PW; Jansson H; McMahon BH; Stroe IR; Swenson J; Young RD, A unified model of protein dynamics. Proc. Natl. Acad. Sci 2009, 106, 5129–5134. [DOI] [PMC free article] [PubMed] [Google Scholar]
- (2).Lewandowski JR; Halse ME; Blackledge M; Emsley L, Direct observation of hierarchical protein dynamics. Science 2015, 348, 578–581. [DOI] [PubMed] [Google Scholar]
- (3).Vitkup D; Ringe D; Petsko GA; Karplus M, Solvent mobility and the protein ‘glass’ transition. Nat. Struct. Biol 2000, 7, 34–38. [DOI] [PubMed] [Google Scholar]
- (4).Panagopoulou A; Kyritsis A; Sabater i Serra R; Gomez Ribellez JL; Shinyashiki N; Pissis P, Glass transition and dynamics in BSA-water mixtures over wide ranges of composition studied by thermal and dielectric techniques. Biochim. Biophys. Acta 2011, 1814, 1984–1996. [DOI] [PubMed] [Google Scholar]
- (5).Nakanishi M; Sokolov AP, Protein dynamics in a broad frequency range: Dielectric spectroscopy studies. J. Non-Cryst. Solids 2015, 407, 478–485. [Google Scholar]
- (6).Ebbinghaus S; Kim SJ; Heyden M; Yu X; Heugen U; Gruebele M; Leitner DM; Havenith M, An extended dynamical hydration shell around proteins. Proc. Natl. Acad. Sci 2007, 104, 20749–20752. [DOI] [PMC free article] [PubMed] [Google Scholar]
- (7).Heyden M; Tobias D,J, Spatial dependence of protein-water collective hydrogen-bond dynamics. Phys. Rev. Lett 2013, 111, 2181011–2181015. [DOI] [PubMed] [Google Scholar]
- (8).Olsson MHM; Parson WW; Warshel A, Dynamical contributions to enzyme catalysis: critical tests of a popular hypothesis. Chem. Rev 2006, 106, 1737–1756. [DOI] [PubMed] [Google Scholar]
- (9).Fan Y; Cembran A; Ma S; Gao J, Connecting protein conformational dynamics with catalytic function as illustrated in dihydrofolate reductase. Biochemistry 2013, 52, 2036–2049. [DOI] [PMC free article] [PubMed] [Google Scholar]
- (10).Boehr DD; McElheny D; Dyson HJ; Wright PE, The dynamic energy landscape of dihydrofolate reductase catalysis. Science 2006, 313, 1638–1642. [DOI] [PubMed] [Google Scholar]
- (11).Henzler-Wildman KA; Lei M; Thai V; Kerns SJ; Karplus M; Kern D, A hierarchy of timescales in protein dynamics is linked to enzyme catalysis. Nature 2007, 450, 913–916. [DOI] [PubMed] [Google Scholar]
- (12).Toraya T, Radical catalysis in coenzyme B12-dependent isomerization (eliminating) reactions. Chem. Rev 2003, 103 (6), 2095–2128. [DOI] [PubMed] [Google Scholar]
- (13).Wertz JE; Bolton JR, Electron Spin Resonance. Chapman and Hall: New York, 1986. [Google Scholar]
- (14).Nforneh B; Warncke K, Mesodomain and protein-associated solvent phases with temperature-tunable (200–265 K) dynamics surround ethanolamine ammonia-lyase in globally polycrystalline aqueous solution containing dimethyl sulfoxide. J. Phys. Chem. B 2017, 121, 11109–11118. [DOI] [PMC free article] [PubMed] [Google Scholar]
- (15).Mackenzie AP; Derbyshire W; Reid DS, Nonequilibrium Freezing Behavior of Aqueous Systems. Philos T Roy Soc B 1977, 278, 167–189. [DOI] [PubMed] [Google Scholar]
- (16).Franks F, Freeze-drying of bioproducts: putting principles into practice. Eur J Pharm Biopharm 1998, 45, 221–229. [DOI] [PubMed] [Google Scholar]
- (17).Franks F, Scientific and technological aspects of aqueous glasses. Biophys. Chem 2003, 106, 251–261. [DOI] [PubMed] [Google Scholar]
- (18).Chen H; Sun L; Warncke K, Heterogeneous ordered-disordered structure of the mesodomain in frozen sucrose-water solutions revealed by multiple electron paramagnetic resonance spectroscopies. Langmuir 2013, 29, 4357–4365. [DOI] [PMC free article] [PubMed] [Google Scholar]
- (19).Rasmussen DH; Mackenzie AP, Phase diagram for the system water-dimethylsulphoxide. Nature 1968, 220, 1315–1317. [DOI] [PubMed] [Google Scholar]
- (20).Schichman SA; Amey RL, Viscosity and local liquid structures in dimethylsulfoxide-water mixtures. J. Phys. Chem 1971, 75, 98–102. [Google Scholar]
- (21).Banerjee D; Bhat SV, Vitrification, relaxation and free volume in glycerol-water binary liquid mixture: Spin probe ESR studies. J. Non-Cryst. Solids 2009, 355, 2433–2438. [Google Scholar]
- (22).Banerjee D; Bhat SN; Bhat SV; Leporini D, ESR evidence for 2 coexisting liquid phases in deeply supercooled bulk water. Proc. Natl. Acad. Sci 2009, 106, 11448–11453. [DOI] [PMC free article] [PubMed] [Google Scholar]
- (23).Rittigstein P; Priestley RD; Broadbelt LJ; Torkelson JM, Model polymer nanocomposites provide an understanding of confinement effects in real nanocomposites. Nature Materials 2007, 6, 278–282. [DOI] [PubMed] [Google Scholar]
- (24).Baglay RR; Roth CB, Local glass transition temperature Tg(z) of polystyrene next to different polymers: Hard vs. soft confinement. J. Chem. Phys 2017, 146, 203307. [DOI] [PubMed] [Google Scholar]
- (25).Swenson J; Teixeira J, The glass transition and relaxation behavior of bulk water and a possible relation to confined water. J. Chem. Phys 2010, 132, 014508. [DOI] [PubMed] [Google Scholar]
- (26).Zhu C; Warncke K, Reaction of the Co-II-substrate radical pair catalytic intermediate in coenzyme B-12-dependent ethanolamine ammonia-lyase in frozen aqueous solution from 190 to 217 K. Biophys. J 2008, 95, 5890–5900. [DOI] [PMC free article] [PubMed] [Google Scholar]
- (27).Kohne M; Zhu C; Warncke K, Two dynamical regimes of the substrate radical rearrangement reaction in B12-dependent ethanolamine ammonia-lyase resolve contributions of native protein configurations and collective configurational fluctuations to catalysis. Biochemistry 2017, 56, 3257–3264. [DOI] [PMC free article] [PubMed] [Google Scholar]
- (28).Ucuncuoglu N; Warncke K, Protein configurational states guide radical rearrangement catalysis in ethanolamine ammonia-lyase. Biophys. J 2018, 114, 2775–2786. [DOI] [PMC free article] [PubMed] [Google Scholar]
- (29).Wang M; Zhu C; Kohne M; Warncke K, Resolution and characterization of chemical steps in enzyme catalytic sequences by using low-temperature and time-resolved, full-spectrum EPR spectroscopy in fluid cryosolvent and frozen solution systems. Meth. Enzymol 2015, 563, Part A, 59–94. [DOI] [PMC free article] [PubMed] [Google Scholar]
- (30).Faust LP; Babior BM, Overexpression, purification, and some properties of the AdoCbl-dependent ethanolamine ammonia-lyase from Salmonella-typhimurium. Arch Biochem Biophys 1992, 294 (1), 50–54. [DOI] [PubMed] [Google Scholar]
- (31).Faust LRP; Connor JA; Roof DM; Hoch JA; Babior BM, Cloning, sequencing, and expression of the genes encoding the adenosylcobalamin-dependent ethanolamine ammonia-lyase of Salmonella-typhimurium. J Biol Chem 1990, 265 (21), 12462–12466. [PubMed] [Google Scholar]
- (32).Kaplan BH; Stadtman ER, Ethanolamine deaminase: a cobamide coenzyme-dependent enzyme. I. purification, assay and properties of enzyme. J Biol Chem 1968, 243 (8), 1787–1793. [PubMed] [Google Scholar]
- (33).Stoll S; Schweiger A, EasySpin, a comprehensive software package for spectral simulation and analysis in EPR. J. Magn. Reson 2006, 178, 42–55. [DOI] [PubMed] [Google Scholar]
- (34).Arakawa T; Kita Y; Timasheff SN, Protein precipitation and denaturation by dimethyl sulfoxide. Biophys. Chem 2007, 131, 62–70. [DOI] [PubMed] [Google Scholar]
- (35).Robertson WD; Wang M; Warncke K, Characterization of protein contributions to cobalt-carbon bond cleavage catalysis in adenosylcobalamin-dependent ethanolamine ammonia-lyase by using photolysis in the ternary complex. J. Am. Chem. Soc 2011, 133, 6968–6977. [DOI] [PMC free article] [PubMed] [Google Scholar]
- (36).Wang M; Warncke K, Kinetic and thermodynamic characterization of CoII-substrate radical pair formation in coenzyme B12-dependent ethanolamine ammonia-lyase in a cryosolvent system by using time-resolved, full-spectrum continuous-wave electron paramagnetic resonance spectroscopy. J. Am. Chem. Soc 2008, 130, 4846–4858. [DOI] [PubMed] [Google Scholar]
- (37).Wang M; Warncke K, Entropic origin of cobalt-carbon bond cleavage catalysis in adenosylcobalamin-dependent ethanolamine ammonia-lyase. J. Am. Chem. Soc 2013, 135, 15077–15084. [DOI] [PMC free article] [PubMed] [Google Scholar]
- (38).Ahmad S; Gromiha M; Fawareh H; Sarai A, ASAView: database and tool for solvent accessibility representation in proteins. BMC Bioinformatics 2004, 5, 51. [DOI] [PMC free article] [PubMed] [Google Scholar]
- (39).Shibata N; Tamagaki H; Hieda N; Akita K; Komori H; Shomura Y; Terawaki S; Mori K; Yasuoka N; Higuchi Y; Toraya T, Crystal structures of ethanolamine ammonia-lyase complexed with coenzyme B-12 analogs and substrates. J Biol Chem 2010, 285, 26484–26493. [DOI] [PMC free article] [PubMed] [Google Scholar]
- (40).Bovell AM; Warncke K, Structure model of Salmonella typhimurium ethanolamine ammonia-lyase directs a rational approach to the assembly of the functional [(EutB-EutC)2]3 oligomer from isolated subunits. Biochemistry 2013, 52, 1419–1428. [DOI] [PMC free article] [PubMed] [Google Scholar]
- (41).Robertson WD; Bovell AM; Warncke K, Development of a protein-integrated, cobalt-corrin catalyst for hydrogen production under green conditions. J. Biol. Inorg. Chem 2013, 18 (6), 701–713. [DOI] [PMC free article] [PubMed] [Google Scholar]
- (42).Timasheff SN, Protein-solvent preferential interactions, protein hydration, and the modulation of biochemical reactions by solvent compounds. Proc. Natl. Acad. Sci 2002, 99, 9721–9726. [DOI] [PMC free article] [PubMed] [Google Scholar]
- (43).Goldman SA; Bruno GV; Polnaszek CF; Freed JH, Anisotropic rotational reorientation and slow tumbling in liquid and frozen media. J. Chem. Phys 1972, 56, 716–735. [Google Scholar]
- (44).Sato H; Bottle SE; Blinco JP; Micallef AS; Eaton GR; Eaton SS, Electron spin-lattice relaxation of nitroxyl radicals in temperature ranges that span glassy solutions to low viscosity liquids. J. Magn. Reson 2008, 191, 66–77. [DOI] [PMC free article] [PubMed] [Google Scholar]
- (45).Angell CA, Formation of glasses from liquids and biopolymers. Science 1995, 267, 1924–1935. [DOI] [PubMed] [Google Scholar]
- (46).Schiro G; Cupane A; Vitrano E; Bruni F, Dielectric relaxations in confined hydrated myoglobin. J. Phys. Chem. B 2009, 113, 9606–9613. [DOI] [PubMed] [Google Scholar]
- (47).Cerveny S; Alegria A; Colmenero J, Universal features of water dynamics in solutions of hydrophilic polymers, biopolymers, and small gass-forming materials. Phys. Rev. E 2008, 77, 031803. [DOI] [PubMed] [Google Scholar]
- (48).Faraone A; Liu L; Mou C-Y; Yen C-W; Chen S-H, Fragile-to-strong liquid transition in deeply supercooled confined water. J. Chem. Phys 2004, 121, 10843–10846. [DOI] [PubMed] [Google Scholar]
- (49).Goldstein M, The past, present, and future of the Johari-Goldstein relaxation. J. Non-Cryst. Solids 2011, 357, 249–250. [Google Scholar]
- (50).Liu YH; Fujita T; Aji DPB; Matsuura M; Chen MW, Structural origins of Johari-Goldstein relaxation in a metallic glass. Nat. Comm 2014, 5, 1–7. [DOI] [PubMed] [Google Scholar]
- (51).Fenimore PW; Frauenfelder H; McMahon BH; Young RD, Bulk-solvent and hydration-shell fluctuations, similar to alpha- and beta-fluctuations in glasses, control protein motions and functions. Proc. Natl. Acad. Sci 2004, 101 (40), 14408–14413. [DOI] [PMC free article] [PubMed] [Google Scholar]
- (52).Sillescu H, Heterogeneity at the glass transition: a review. J. Non-Cryst. Solids 1999, 243, 81–108. [Google Scholar]
- (53).Chen S-H; Mallamace F; Mou C-Y; Broccio M; Corsaro C; Faraone A; Liu L, The violation of the Stokes-Einstein relation in supercooled water. Proc. Natl. Acad. Sci 2006, 103, 12974–12978. [DOI] [PMC free article] [PubMed] [Google Scholar]
- (54).Douzou P, Cryobiochemistry: An Introduction. Academic Press: New York, 1977. [Google Scholar]
Associated Data
This section collects any data citations, data availability statements, or supplementary materials included in this article.