Abstract
Introduction
Metformin is an ideal candidate to treat the liver tumor with insulin resistance because of its good performance in the treatment of type 2 diabetes and the advantage in cancer therapy. We aim to develop a delivery system with higher efficiency than free drug.
Methods
Metformin-bovine serum albumin (met-BSA) nanoparticles (NPs) were prepared using the anti-solvent precipitation method with a stabilizer of BSA for particle growth. The therapeutic effect of the drug was tested by the insulin-resistant HepG2 cells and C57BL/6J mice at a glucose starvation condition. The interaction mechanism of the drug and the protein during the formation of the NPs was tested using a series of spectroscopy.
Results
Metformin and BSA formed nonporous and spherical particles of about 200 nm with proper lognormal distribution and thermostability. The cellular uptake, as well as the anti-liver cancer activities of met-BSA, was enhanced dramatically compared with the free drug. The thermodynamic studies suggested that the weak binding of metformin to BSA was governed by hydrogen bonds and van der Waals forces. Moreover, the results of synchronous, circular dichroism (CD) and three-dimensional fluorescence demonstrated that the BSA skeleton and chromophore microenvironments were changed in the presence of metformin.
Conclusion
Therefore, met-BSA has been proved as a simple yet effective therapeutic agent for cancer with insulin resistance, promising for future clinic translations in cancer treatment.
Keywords: liver cancer, metformin, bovine serum albumin, nanoparticle, spectroscopy
Introduction
Over the last 50 years, people in developing countries like China have experienced a dramatic change in the quality of life. Diet is the most typical example, which is evidenced by high-calorie food; however, this is also related to an increasing tendency of hepatoma, as well as type 2 diabetes. In the previous study, epidemiological research generally supported the assumption that factors connected with insulin resistance or diabetes are related to an increased risk of hepatoma.1 In turn, hepatoma is related to coffee consumptions and physical activities, which are known for its capacity to lowing the type 2 diabetes risks. The mechanism of these processes can be explained by the resistance of insulin, and the resulting chronic hyperinsulinemia combined with increasing bio-available insulin-like growth factor 1 (IGF1) stimulated tumor growth.2 Metformin is widely used for the treatment of type 2 diabetes, especially for overweight people. This traditional medication is used to decrease hepatic glucose production.3 In recent years, metformin has been explored for the advantage in cancer therapy. CD8+ tumor-infiltrating lymphocytes was found to be a target of metformin.4 Metformin may exhibit a direct inhibitory effect on cancer cells by targeting mammalian target of rapamycin signaling and anabolic processes.5 In more recent research, Elgendy et al suggested that the method of intermittent fasting could reduce tumor glucose levels, sensitize tumors to metformin, and significantly reduce tumor growth.6 Thus, metformin is an ideal candidate to treat the liver tumor with insulin resistance.
Finding a suitable carrier that delivers the drugs and targets the tumor blood vessels’ leaky vasculature passively is a practical way to make the chemotherapeutics effectively.7 Serum albumin is a typical model protein, and because it can bind with various ligands, it is also called a multifunctional carrier protein of plasma.8–10 Due to these characteristics, bovine serum albumin (BSA) is usually made into nanoparticles (NPs), which are biodegraded and tractable to be prepared in specific sizes. BSA NPs that were modified with lactoferrin and hyaluronic acid were studied for targeted delivery to cancer cells.11,12 BSA NPs with different surface charges were tested, and among all the shells, positively-charged BSA nanocarriers showed higher cellular uptake.13 These findings have encouraged many groups to work on the surface modification of BSA NPs for specific target delivery. Successful albumin nanoformulations in the clinical market are Abraxane (albumin-paclitaxel NPs)14 and Aldoxorubicin (albumin-doxorubicin NPs).14,15 Although particle size is also an important parameter of the drug carrier, investigations on BSA nanoparticles have been focused mainly on surface modification.
Zu et al developed a response surface methodology to produce a vinblastine sulfate carrier system using BSA. After optimization, a BSANP with an average diameter of 156.6 nm and drug entrapment and loading efficiencies of 84.83% and 42.37%, respectively, was obtained.
It has been revealed that metformin has a high affinity to serum albumin.16,17 Jose,18 and Sharma19 have tried to conduct in vitro studies to document the cellular effects of the drug-BSA NPs as well as the binding insight of metformin and BSA; however, the curative effect is not desirable, and the drug formation mechanisms are far from being elucidated. Also, these studies did not perform systematic safety evaluations, which may restrict their clinic applications. Therefore, a metformin nanosystem with improved safety and ease of production would be of great value.
In the present work, metformin-BSA (met-BSA) complexes were prepared using an antisolvent precipitation method to improve dissolution, and their therapeutic efficacy was tested using a human insulin-resistant liver cancer cell line as well as H22 liver tumor-bearing mice with insulin resistance. Multi-spectroscopic approaches, including circular dichroism (CD), three-dimensional (3D) fluorescence spectroscopy, steady-state/synchronous fluorescence, were used for investigating the interactions of metformin with BSA in vitro under the simulative physiological conditions (the ionic strength is 0.1, pH=7.4). It was expected that this study would provide new insight into the drug-NP pharmaceutics on the procedures of drug delivery, which makes an impact on the physicochemical properties and dramatically improves the therapeutic effect in vivo.
Materials and Methods
Materials
Metformin was purchased in Alfa Aesar (Thermofisher Ltd., MA, USA). BSA, phosphate buffer salts, and methanol were all purchased from Sigma (Merck Chemicals Ltd., Darmstadt, Germany). All reagents used in this study were above analytical reagent grade, and no further purification was made before use. Samples were treated with 0.1 M phosphate buffer solution for dissolving (pH 7.4). Ultrapure water was used throughout the tests. All the drug stock solutions were prepared in methanol, and 5% methanol was used to maintain an anti-solvent environment in the drug-BSA systems for spectroscopic characterization.
NP Preparation
Metformin (200 mg) was dissolved in methanol (10 mL) and then injected into deionized water (200 mL) rapidly. After the addition of BSA (4 mg/mL), the mixed solution was pre-cooled to 5 °C with mechanical stirring at 600 rpm, and the final molar ratio of drug:protein was 25:1. After anti-solvent precipitation, the complexes of met-BSA were obtained by filtering a mixed solution through a 0.45-μm membrane. Besides, the residual solvent was removed by using a vacuum oven overnight. The as-prepared solution was filtered with membranes with pore sizes of 0.12 and 0.3 μm to obtain uniform NPs of about 200 nm.
Morphology of the as-Prepared NPs
The images of the transmission electron microscope (TEM) were used to acquire the shape and size of the met-BSA. The 300 meshes carbon-coated copper grid was cast with several drops of met-BSA and vacuum-dried without further staining. JEOL JEM 1011, with an accelerating voltage of 100 kV was used to obtain the TEM images of all the samples. Size statistics were performed using a Nano Measurer V1.3 software package.
Size Measurement
For the measurement of the hydrodynamic radii (Rh) of the protein complexes, dynamic light scattering (DLS) was conducted applying Laser Spectroscatter 201 (RiNA). The measuring experiments were conducted with a 689 nm incident beam at a fixed angle of 900. Measurements of each sample were made for 10 times with a 20 seconds acquisition time. The values of Rh were calculated according to the results of the autocorrelation analysis of scattered light intensity, which is based on the translation diffusion coefficient by the following Stokes-Einstein formula:
 |
where T is the temperature, D represents the diffusion coefficient, KB represents Boltzmann constant, η represents the water viscosity, and d represents the diameter.
The Thermostability Measurement
The VP-DSC microcalorimeter (Micro Cal, Northampton, MA) was used to conduct the differential scanning calorimetry (DSC). Before the experiments, a mild vacuum was used for degassing the protein and buffering solutions. Samples were prepared in 20 mM sodium phosphate buffer at a pH of 7.4. The DSC measurements of BSA (18 mM, metformin was 270 mM) were performed in the range of 305 to 375 K at a scanning rate of 50 K h−1.
Cytotoxicity and Cellular Uptake
According to the method of Zang,20 HepG2 cells (bought from Vital River Lab Animal Technology Co., Ltd., Beijing) were incubated with 10−7 M insulin for 24 h to build the insulin-resistant cell model HepG2/IR. The cytotoxic effects of the drugs in different formulations were evaluated in HepG2/IR and L02 cells (bought from Vital River Lab Animal Technology Co., Ltd., Beijing). Briefly, the cells at a density of 2 × 10³ per well in 200 μL of low glucose culture medium were seeded into 96 well plates. Following this, the increasing concentrations of metformin from 0 μM to 50 μM or met-BSA dissolved in DMSO were imposed on cells for varying times and were processed for the MTT assay. Each of the treatment conditions was conducted with vehicle controls. The DMSO concentration in the culture medium was under 0.15%. The percentage (%) of living cells was estimated by the different decrease of absorbance at 570 nm between treated groups and control groups. Cells were freeze-thawed three times to lyse and release the drug. The cell lysate was analyzed to obtain the concentration of drugs by an Agilent 1220 high-performance liquid chromatography (HPLC). The results were presented as mean ± standard deviation (n = 5).
Animal Models and Experimental Design
Eight-week-old H22 tumor-bearing C57BL/6J male mice with insulin resistance were purchased from the School of Medicine, Tsinghua University, China. Insulin tolerance and glucose uptake rate assays were used to validate the animal model. In each experiment, mice were allocated to the following 3 groups randomly (n=6): vehicle group (sterile ultrapure water, 20mL/kg), metformin group (0.1 g/kg), and met-BSA group (0.1 g/kg equivalent weight of drug). In all the groups, mice were firstly fasted for 24 h, after which a period of 15 h of feeding was conducted, and metformin was administered, followed by a subsequent 9 h fasting before the feeding cycle. The intake of food and body weight of each mouse was recorded at 18:00 of Days 3, 5, and 7. On Day 7, cervical dislocation was used to kill the mice under the premise of anesthesia. The tumors were collected and weighed. The inhibition rate of the tumor was measured by the formula below:
 |
All animal procedures were conducted under Shandong Cancer Hospital affiliated to Shandong University Research Guidelines for the Care and Use of Laboratory Animals (No. 7904223), and all the animals were randomly assigned to cohorts when used.
Mechanisms of BSA and Metformin Interaction
An FP-6200 spectrofluorometer (JASCO UK Ltd., Great Dunmow, Essex, UK) with excitation of chromophore residues at 280 nm was used and all the samples were measured with 5 nm excitation and 5 nm emission slits. The emission spectrum was recorded between 290 and 420 nm with a 120 nm/min scanning speed. The absorption of the complex within the studied concentration range was not high enough for the correction of inner filter effects. Synchronous and 3D fluorescence spectra were recorded under similar settings.
With the addition of a various amount of metformin, the CD studies of BSA were conducted by using a JASCO-J815 spectropolarimeter. The spectra were recorded in a 1 cm path-length cuvette with nitrogen protection. The scan speed was 100 nm/min, and auto-response time was applied for all measurements. An average of 2 scans was conducted on each spectrum.
Statistical Analysis
Data were expressed as the mean ± standard deviation and were compared using the Student’s t-tests, with P values <0.05 considered statistically significant.
Results and Discussion
Characterization of the Met-BSA NP Drug
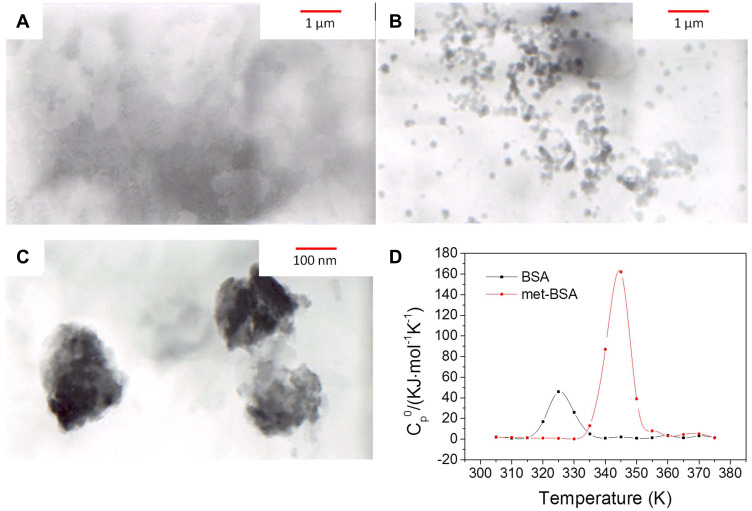
Fluorescence resonance light scattering spectra and TEM were applied for the analysis of the formation of nearly globular aggregates after precipitation with BSA (Figure S1, supplementary data; and Figure 1A–C). According to TEM images, the shape of BSA NPs was approximately spherical with a size of 197 ± 24 nm. The results of the average diameter of the particles obtained by TEM and DLS were consistent with each other. The time-dependent fluctuations in the scattering light intensity were conducted by DLS. The diffusion coefficient was determined by intensity fluctuations, which reflected the size through the application of the Stokes-Einstein equation. It is recorded that Rh of BSA was 5.87 nm in the native state and 232 nm in the form of met-BSA, demonstrating an increment in size after complexation.
Figure 1.
(A–C), Transmission electron microscopy (TEM) images of bovine serum albumin (BSA), metformin-BSA (met-BSA) and enlarged met-BSA, respectively. (D) is the differential scanning calorimetry (DSC) result. c(BSA) = 1 ×10⁻⁶ M; c(metformin)= 2.5×10⁻⁵ M.
DSC makes it possible to investigate thermal transitions in solution, and this technology was applied in the research of energetics of protein-drug complex stability and the effect of metformin on the thermal stability of BSA. BSA unfolded cooperatively, exhibiting a single endothermic peak with a melting temperature of 325.6 K (Figure 1D). When binding to metformin, the thermal stability of the protein was remarkably enhanced, and the melting temperature (Tm) of BSA also enhanced to 344.0 K. Therefore, BSA was stabilized (Tm) by 18.4 K under a saturating condition, the result revealed that binding to metformin played an important role in stabilizing the protein structure against thermal unfolding.21
Cytotoxicity Profiles and Cellular Uptake
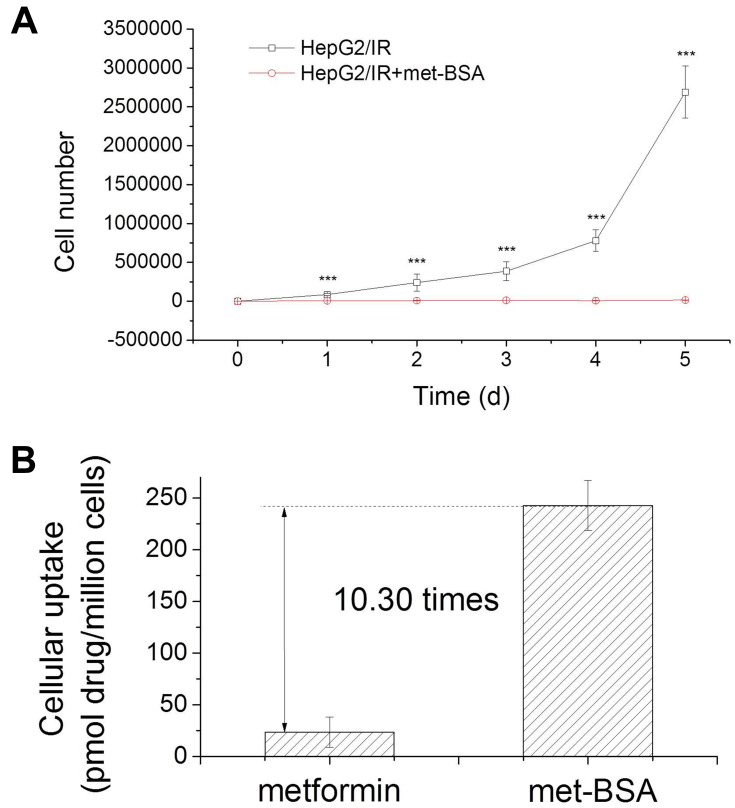
MTT assay was applied for the determination of in vitro anticancer activity of metformin and met-BSA.22 Insulin resistant liver cancer cells were processed with metformin or met-BSA, and cell viability was estimated. IC50 values were given in Table 1, representing the concentration that was required to inhibit growth by 50%. The IC50 for metformin at 48 h was 5.88 ± 0.96 μM, and that for met-BSA was 0.82 ± 0.04 μM. Besides, the cytotoxicity of met-BSA to normal human liver cells L02 was further assessed. The IC50 value of met-BSA in the L02 (normal liver cell line) was 7.22±1.76 μM, and this value was about 9 times higher than that in the HepG2/IR cancer cell lines (IC50 = 0.82 ± 0.04 μM). More evidence for the induction of cell cycle arrest by met-BSA was provided by cell proliferation experiments. As shown in Figure 2A, met-BSA obviously inhibited the proliferation of HepG2/IR cells at concentrations as low as 0.2 μM.
Table 1.
The Measured IC50 Values for Metformin and Met-BSAa and the Cellular Uptake of the Two Drugs
| Compound | IC50 (μM) | Uptake (pmol/106 Cells) | |
|---|---|---|---|
| HepG2/IR | L02 | HepG2/IR | |
| Metformin | 5.88 ± 0.96 | 16.8±2.53 | 23.58±14.61 |
| Met-BSA | 0.92 ± 0.04 | 7.22±1.76 | 242.8±24.00 |
Note: aMetformin-bovine serum albumin.
Figure 2.
Cytotoxicity profiles of the drugs: (A), metformin-bovine serum albumin (met-BSA) can inhibit proliferation in HepG2/insulin resistance (HepG2/IR) cells at 0.2 μM; (B), HepG2/IR cellular uptake of metformin and met-BSA. ***Stands for p<0.005.
HepG2/IR cancer cells were treated with 4 μM of metformin or met-BSA for 5 h to obtain the extent of cellular uptake. The whole-cell concentration of metformin was then measured by HPLC. As expected, the results (Figure 2B, Table 1) indicated that the encapsulation of metformin in BSA NPs remarkably enhanced the uptake of cells. The met-BSA taken up by the HepG2/IR cells was 10 times more effective than metformin. Notably, from metformin to met-BSA, the cellular uptake increased for 10.3-fold accompanied by a 7.3-fold increase (data not shown) in cytotoxicity, indicated that the increment in cytotoxicity might be attributed to the increment in uptake.
In vivo Evaluation of the Antitumor Activity
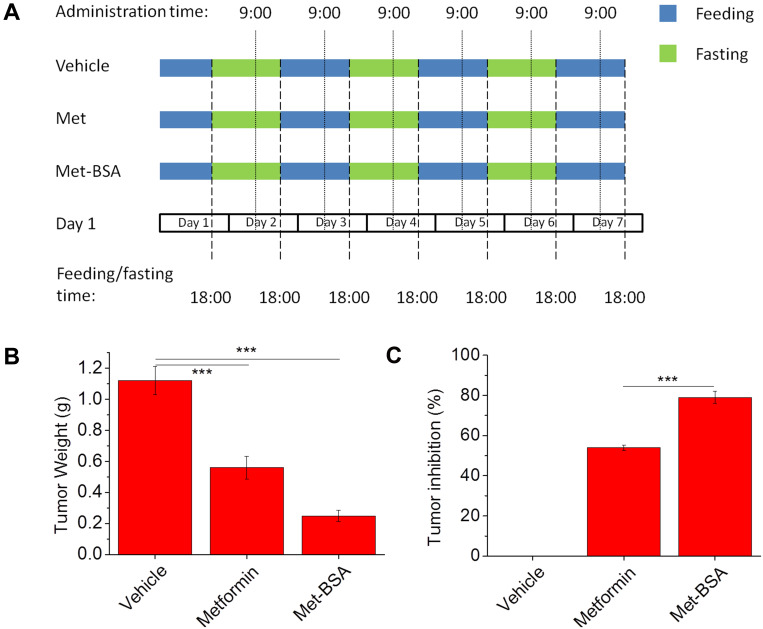
A method of tumor-bearing mice as an animal model was used to assess the in vivo antitumor activity of the drug, and the protocol was shown in Figure 3A. Figure 3B and C show the weights and inhibition rates of the tumor, respectively. The average tumor weight of vehicle control was about 1.20±0.09 g when the tumors were excised and weighed on Day 7. On the contrary, the treatment of metformin and met-BSA effectively suppressed the growth of tumors (***p<0.005) with tumor inhibition rates of 50.0% and 77.7%, respectively, compared with the vehicle control. Besides, the met-BSA treatment also showed a significantly higher effect than metformin (p<0.005).
Figure 3.
(A) Schematic representation of the experimental design displaying the feeding protocols and timing of drug administration in different experimental groups. Effects of metformin and metformin-bovine serum albumin (met-BSA) on tumor (B) weight and (C) inhibition rate. Data were presented as mean ± standard deviation (n=6). ***Stands for p<0.005.
Side effects of the treatments were assessed by body weight and food intake of mice (Tables S1 and S2). Hair loss, cachexia, loss of body weight, and reduction of food-intake were found in mice after inoculated the ascetic tumor cells, and the result indicated the consequences of the H22 liver tumor growth. Along with the decrease of the tumor weights, the bodyweight of both metformin and met-BSA treated mice decreased substantially. Similarly, decreases of food-intake were observed in all the groups at Days 3, 5, and 7. Notably, the food intake of mice in metformin and met-BSA groups was significantly reduced from the first day of exposure (Day 3). These data suggested that both metformin and met-BSA caused some side effects. Diarrhea and nausea were common side effects. However, the body weight recovered on Day 7, from which we deduced met-BSA inhibited tumor growth and avoided the side effects induced by the free drug to some extent. Although the body eight decreased markedly, however in chemotherapy, prolonging the survival of patients is crucial, and this may be achieved by long-term administration of the NPs if its severe side effects are suppressed. On day 30 of exposure, 2 out of 6 mice were dead while no death occurred on met and met-BSA groups. This result, as well as the bodyweight recovery, demonstrated the advantages of the met-BSA drug.
The elimination half-life of the drug is 4–8.7 hours. This is quite short compared with other anti-hepatoma drugs like sorafenib and lenvatinib, which has elimination half-lives of 25–48 and 28 hours, respectively.23,24 However, once encapsulated in protein NPs, the elimination half-life and bioavailability may be significantly enhanced, as revealed by the cellular experiments. To make clear of the structure of the drug-BSA NP, we carried out the following tests.
Fluorescence Spectroscopy of the Drug-BSA System
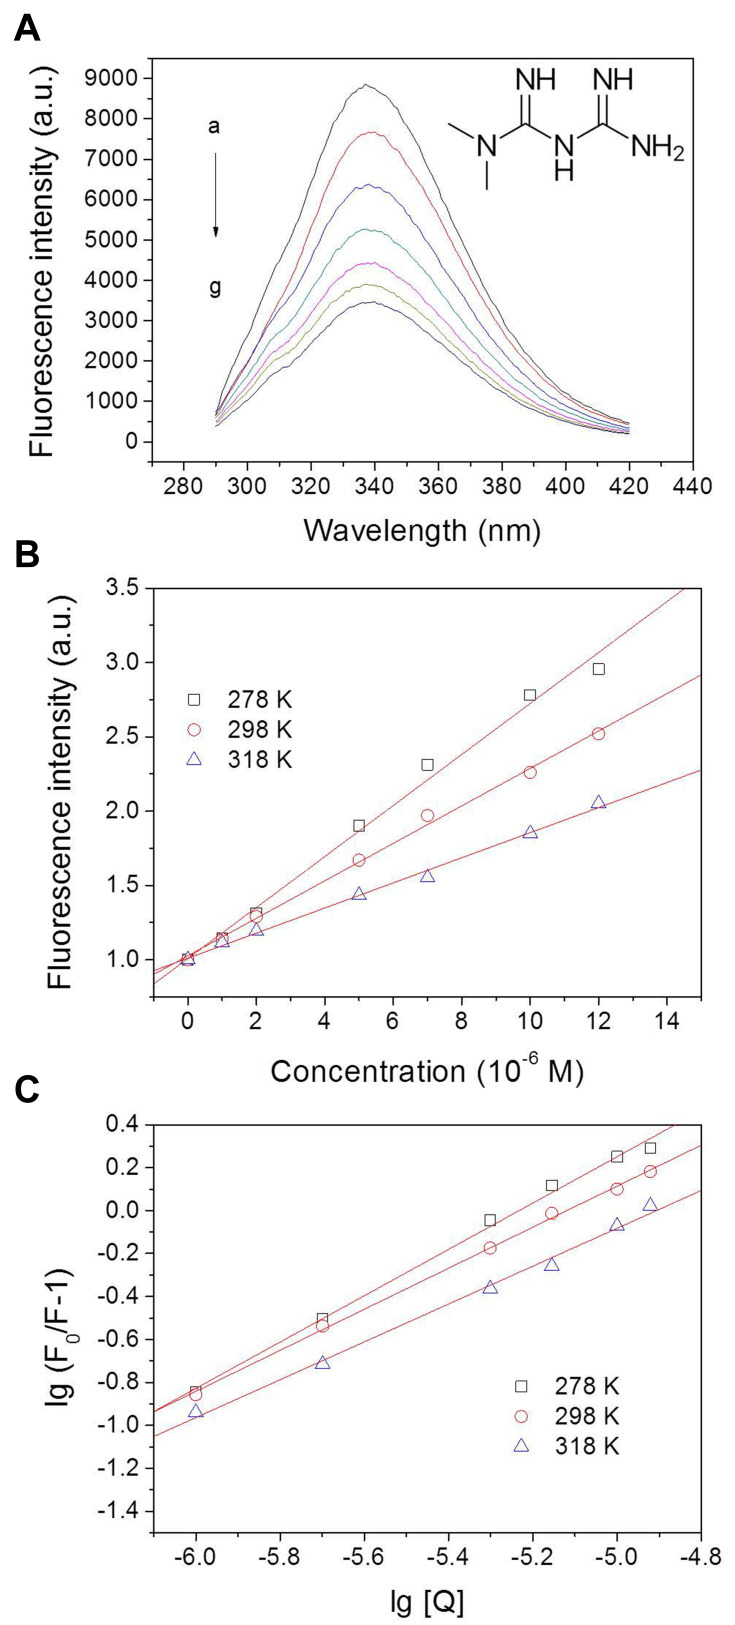
The fluorescence method is an efficient way to study the interaction of small molecules with proteins. By using this method, intermolecular distances, binding constants, binding sites, binding mode, and binding mechanisms could be obtained. BSA showed a strong fluorescence emission peak at 337 nm, while metformin was almost non-fluorescent (Figure S2). 5% of methanol used in the drug-protein system did not cause alteration on the protein spectrum (Figure S2). As shown in Figure 4A, the fluorescence intensities of BSA decreased clearly with increasing metformin concentrations, suggesting that metformin interacted with BSA and interfered with the fluorophores.25
Figure 4.
Fluorescence intensity of bovine serum albumin (BSA) with the addition of different concentrations of metformin at 298 K (A) with arbitrary unit (a.u.); and Stern-Volmer (B) and Hill (C) plots for BSA interacting with metformin at 278 K, 298 K, and 318 K. Conditions: pH 7.4; c(BSA) = 1 ×10⁻⁶ M; c(metformin, a-g): 0, 1, 2, 5, 7, 10, and 12×10−6 M. Inset of A shows the molecular structure of metformin. lg = log10.
The quenching mechanisms are generally categorized into dynamic mechanisms or static mechanisms. Protein combines with quencher forms a ground-state complex, which is called static quenching. Correspondingly, dynamic quenching explains a process that the protein and the quencher come into contact under the excited state.26 In quest of the quenching mechanism of BSA by metformin, the Stern–Volmer formula has been used for analysis (Figure 4B):27
 |
where F0 refers to the fluorescence intensities at the maximum wavelength of BSA alone and F denotes the fluorescence intensities at the maximum wavelength with the addition of metformin; the biomolecular quenching rate constant (M−1 s−1) is represented by Kq; τ0 represents the fluorescence lifetime of biomolecule without quencher, which is 6.4 × 10⁻⁹ s for BSA,28 and [Q] refers to the quencher concentration. The values of Stern–Volmer quenching constant KSV decreased with the increase of temperature, which revealed the formation of a complex (static quenching) (Table 2). The maximum dynamic quenching constant for biomolecule-quencher systems is about 2.0 × 10¹⁰ M−1 s−1, while the Kq values obtained here were within the range of 1012−1014 M−1.−129 Therefore, we believe that the drug−protein binding was associated with the static mechanism. Thereby, the Hill equation30 was used for calculating the number of binding sites (n) as well as the binding constant (KA) of metformin on BSA (Figure 4C):
 |
Table 2.
Stern–Volmer Quenching Constants, Binding Parameters, and Thermodynamic Parameters of the BSAa-Metformin System at Different Temperatures
| T(K) | Stern–Volmer Quenching Constants | Binding Parameters | Thermodynamic Parameters | ||||||
|---|---|---|---|---|---|---|---|---|---|
| Kq (M−1 s−1) | KSV (M−1) | Pearson’s r | KA (M−1) | n | Pearson’s r | ΔG (J·mol−1) | ΔS(J·mol−1·K−1) | ΔH (J·mol−1) | |
| 278 | 2.68×10¹³ | 1.72×10⁵ | 0.9960 | 4.41×10⁵ | 1.08 | 0.9979 | −3.01×10⁴ | ||
| 298 | 1.97×10¹³ | 1.26×10⁵ | 0.9985 | 7.82×10⁴ | 0.956 | 0.9992 | −2.79×10⁴ | −94.03 | −5.61×10⁴ |
| 318 | 1.32×10¹² | 8.45×10⁴ | 0.9978 | 2.12×10⁴ | 0.882 | 0.9971 | −2.63×10⁴ | ||
Note: aBovine serum albumin.
The values of KA, which were obtained at the three temperatures, were displayed in Table 2. The binding constant values showed a decreased trend with the increase of temperature, which suggested that there was a destabilization of the BSA–metformin complex under higher temperature. The values of KA decreased from 4.41 × 10⁵ to 2.12 × 10⁴ M−1 while the temperature was raised from 278 to 318 K. It can be speculated that the binding constant should be at a 104 M−1 scale at body temperature (310 K), which is a moderate binding event. Additionally, the results of the calculation for “n” values were close to 1, revealing that there was one major binding site for the drug towards BSA.
The Determination of the Acting Force Between Metformin and BSA
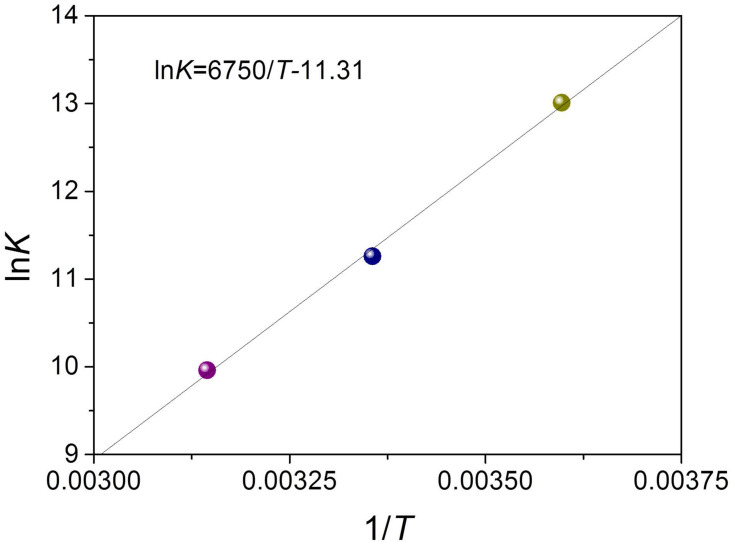
Van der Waals forces, hydrophobic interactions, hydrogen bonds, and electrostatic forces were the dominant forces between the drug and protein. The thermodynamic parameters, including entropy change (ΔS), free energy change (ΔG), and enthalpy change (ΔH) of the reaction, are necessary for determining the acting force. According to the results of fluorescence analysis, it indicated that the temperature governed the binding constant, and the thermodynamic process was associated with the formation of the complex. Hence, to investigate the acting forces of metformin-BSA, the thermodynamic parameters were calculated by the van’t Hoff and Gibbs equations:31
 |
 |
where K refers to association constant at the corresponding temperature, T represents the absolute temperature, and R is the gas constant. lnK and 1/T were obtained from the intercept and slope in the linear plot, respectively, which further generated ΔS and ΔH (Figure 5 and Table 2). The Gibbs equation was applied to measure the free energy change (ΔG). From Table 2, the negative values of ΔH, ΔS, and ΔG revealed a spontaneous process of binding, and hydrogen binding along with the van der Waals forces dominated the binding reaction of metformin–BSA according to the Ross’s and Subramanian’s views.32,33
Figure 5.
van’t Hoff plot for bovine serum albumin (BSA)-metformin system. ln = loge.
Synchronous Fluorescence Spectra
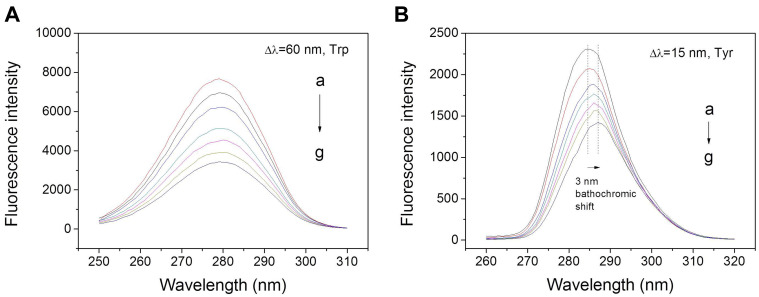
Synchronous fluorescence spectroscopy was applied to assess the conformational changes in BSA when it binds with metformin. This approach primarily investigated the microenvironment of the fluorophore moieties by measuring the data of emission. The distinction between excitation and emission wavelengths (Δλ) determined the intensity and shape of synchronous fluorescence spectra, where Δλ = 15 nm provided information of Tyr and Δλ = 60 nm provided information of Trp.34,35 The effect of metformin on synchronous fluorescence of Tyr made systematic quenching reach a significant bathochromic shift at the maximum emission of 3 nm (Figure 6B), but there was almost no shift for Trp (Figure 6A). Thus, it appears that the interaction of metformin resulted in greater exposure of Tyr to the solvent. Meanwhile, there was almost little shift occurred in the maximum emission wavelength of Δλ = 60 nm, indicating that no transform occurred in the microenvironment adjacent to the Trp residues. Hence, binding with metformin resulted in the transformation of the polarity around Tyr residues, while there was no change around Trp residues.36–38
Figure 6.
Synchronous fluorescence spectra of metformin with BSA with Δλ = 60 (A) or 15 (B) nm at 298 K. Protein concentrations and drug concentration are consistent with the steady-state fluorescence study.
Conformational Studies by CD and 3D Fluorescence Spectroscopy
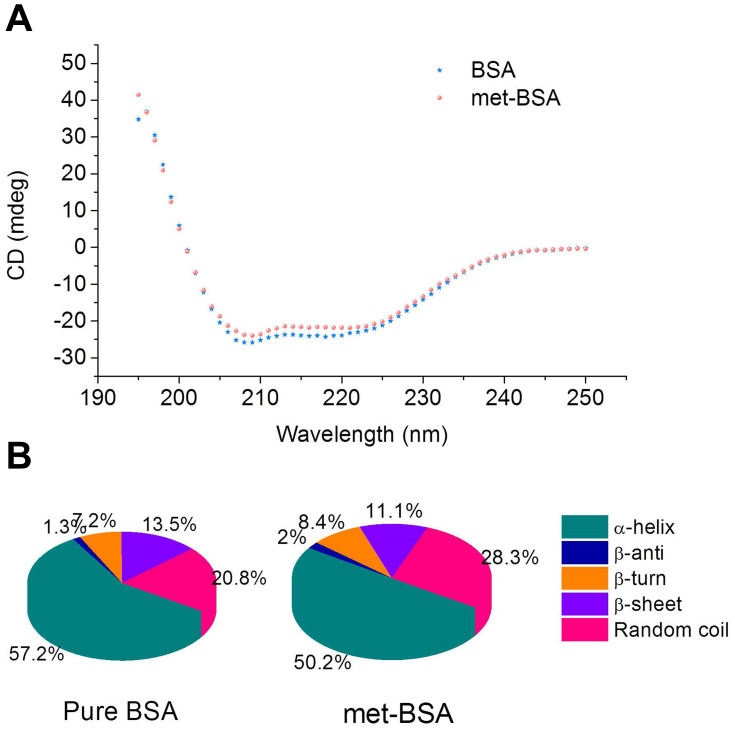
CD spectroscopy was applied to monitor the content of the secondary structure of the protein.39 Figure 7A shows the CD spectra of BSA with the addition of metformin of a 1:25 molar ratio, which was in line with the molar ratio in drug preparation. The CD spectrum of native BSA showed two characteristic negative peaks at 208 nm and 222 nm. The occurrence of a negative absorption band at 208 nm was because of the π → π* transition of carbonyl groups in polypeptide chains, and the other band at around 222 nm is associated with the n → π* transition of the carbonyl group.40 After being encapsulated with metformin, the CD spectrum of BSA showed a gradual loss in intensities of the 222 nm and 208 nm bands, indicating the loss of α-helical structure (from 57.2 to 50.2%, Figure 7B) with the accompanying increase of random coil content (from 20.8 to 28.3%).
Figure 7.
(A) CD (circular dichroism) spectra of bovine serum albumin (BSA) in the absence and presence of metformin. The concentrations of BSA and metformin were 2×10⁻⁷ and 5×10⁻⁶ M, respectively. (B) The secondary structural components of pure BSA and metformin-BSA (met-BSA).
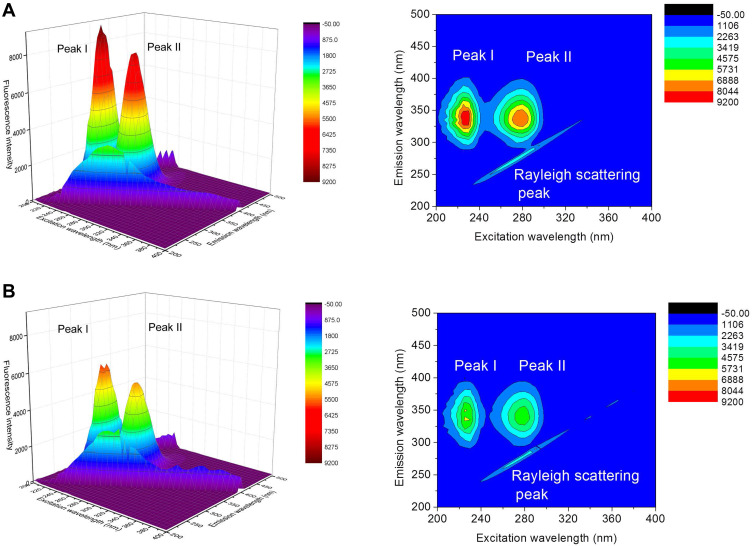
More detailed information on the protein configuration change can be provided by 3D fluorescence. Figure 8 shows the 3D spectra of BSA (A) and met-BSA (B). Peak I (λex= 225.0 nm and λem= 335.0 nm) represented the fluorescence properties of the BSA polypeptide backbone structure on account of the π → π* transition of C=O, and it could reflect the changes of the protein conformation. Peak II (λex= 280.0 nm and λem= 336.0 nm) reflected the microenvironment of Trp and Tyr residues, which was the result of n → π* transition. A significant decrease of fluorescence intensity was found in Peak I (37.5%) and Peak II (33.7%) in the presence of metformin in BSA solution (Table 3). Accompanied by the fluorescence quenching, the changes in fluorescence intensity of Peaks I and II of BSA occurred, which suggested a complex of metformin and BSA. Besides, the microenvironment and conformation of both the skeleton and the fluorophores of BSA were changed.
Figure 8.
3D and corresponding contour fluorescence spectra of pure bovine serum albumin (BSA) (A) and BSA-metformin (B) mixture. Conditions: pH 7.4; c(BSA) = 1 ×10⁻⁶ M; c(metformin) = 2.5×10⁻⁵ M.
Table 3.
Three-Dimensional Fluorescence Spectral Characteristics of BSAa-Metformin System
| Peaks | BSA | BSA-Metformin | ||||
|---|---|---|---|---|---|---|
| Peak Position λex/λem (nm/nm) | Stokes Δλ (nm) | Fluorescence Intensity | Peak Position λex/λem (nm/nm) | Stokes Δλ (nm) | Fluorescence Intensity | |
| I | 225/335 | 110 | 9184 | 230/330 | 100 | 5741 |
| II | 280/335 | 55 | 7973 | 280/335 | 55 | 5285 |
Note: aBovine serum albumin.
Energy Transfer from the Protein to the Drug
Since the Förster non-irradiative energy transfer (FRET) is another important factor of fluorescence quenching, which should not be ignored. Consequently, we explored whether the non-irradiative energy transfer occurred between metformin and BSA. The distance between the chromophore of protein and the drug molecule was enabled to obtained by energy transfer, which could be evidence confirming the formation of the metformin–BSA complex. Following FRET, the energy transfer efficiency mainly depends on the factors below: (1) sufficient overlap of the donor (BSA) emission spectrum with the acceptor’s (metformin) absorption spectrum, (2) the relative orientation of the acceptor and the donor dipoles and (3) the distance of the acceptor with the donor.41 In this section, we measured the emission spectrum of BSA–metformin as well as the UV–vis spectrum of metformin. From Figure S3, a large overlap was observed between the absorption spectrum of metformin and the BSA–metformin fluorescence spectrum. The energy transfer efficiency (E) from BSA to metformin could be calculated with an equation as follows:42
 |
where F and F0 refer to the fluorescence spectrum intensities of BSA with and without the addition of metformin, respectively. r represents the distance of the acceptor (metformin) with the donor (BSA), and R0 represents the critical distance when the transfer efficiency equals 50%, which was expressed and calculated using the following formula:43
 |
where k2 represents the spatial orientation factor of the dipole, which is 2/3 in the protein-ligand interaction system; Φ refers to the fluorescence quantum yield of BSA, which is 0.24; N represents the refractive index of the protein-ligand solution, which is 1.36 here; and J equals the integral of the overlap between the fluorescence emission spectrum of BSA and absorption spectrum of metformin, which was expressed by the formula bellow:44
 |
where F(λ) equals the fluorescence intensity of the BSA at the wavelength of λ, ε(λ) equals to the molar absorption coefficient of the drug at the corresponding wavelength. According to the equations above, these constants were calculated as: J = 3.5 × 10⁻¹³ cm3 L/mol, E = 0.23, R0 = 4.9 nm, r = 5.7 nm. The value of r was found to be smaller than 8 nm, manifesting that it is of a high probability that the energy transfers from BSA to metformin.45 This phenomenon meets the requirement of the occurrence of the Förster non-irradiative resonance energy transfer. Moreover, r was found to be greater than R0, suggesting that the intrinsic fluorescence of BSA quenched by metformin follows the mechanism of static quenching.
Conclusions
In summary, we proposed the successful development of a novel BSA NP with complexation of metformin prepared by anti-solvent precipitation. The compound displayed excellently in vitro anticancer activity, which showed 6.4 times higher activity than pure metformin in insulin-resistant liver cancer cell lines for a 48h study. Besides, the in vivo study showed significant inhibition of met-BSA on the liver tumor growth in mice. This study further illuminated the interaction between BSA and the metformin complex by applying TEM, DLS, DSC, fluorescence, and CD spectroscopy under the physiological conditions. The result of fluorescence spectroscopy suggested a probable mechanism of the interaction was a static quenching process, and van der Waals forces along with H-bonding played the leading role in moderating the met-BSA complex. Moreover, the study of 3D fluorescence and CD quantitative analysis indicated that the interaction induced a conformational change to the secondary structures of BSA. This study aims to provide valuable information for the development and application of drug-protein complexes in biomedical sciences.
Acknowledgments
The authors thank Dr. Josh A. Bartlett of the Department of Chemistry, Pennsylvania State University, for editing the manuscript. This work was supported by grants from the Medical and Technologic Development Project of Shandong Province (2011QZ028, 2017-218).
Disclosure
The authors report no conflicts of interest in this work.
References
- 1.El–Serag HB, Hampel H, Javadi F. The association between diabetes and hepatocellular carcinoma: a systematic review of epidemiologic evidence. Clin Gastroenterol Hepatol. 2006;4(3):369–380. doi: 10.1016/j.cgh.2005.12.007 [DOI] [PubMed] [Google Scholar]
- 2.Hassan MM, Curley SA, Li D, et al. Association of diabetes duration and diabetes treatment with the risk of hepatocellular carcinoma. Cancer. 2010;116(8):1938–1946. doi: 10.1002/cncr.24982 [DOI] [PMC free article] [PubMed] [Google Scholar]
- 3.Rena G, Hardie DG, Pearson ER. The mechanisms of action of metformin. Diabetologia. 2017;60(9):1577–1585. doi: 10.1007/s00125-017-4342-z [DOI] [PMC free article] [PubMed] [Google Scholar]
- 4.Eikawa S, Nishida M, Mizukami S, Yamazaki C, Nakayama E, Udono H. Immune-mediated antitumor effect by type 2 diabetes drug, metformin. Proc National Acad Sci. 2015;112(6):1809–1814. doi: 10.1073/pnas.1417636112 [DOI] [PMC free article] [PubMed] [Google Scholar]
- 5.Sośnicki S, Kapral M, Węglarz L. Molecular targets of metformin antitumor action. Pharmacol Rep. 2016;68(5):918–925. doi: 10.1016/j.pharep.2016.04.021 [DOI] [PubMed] [Google Scholar]
- 6.Elgendy M, Cirò M, Hosseini A, et al. Combination of hypoglycemia and metformin impairs tumor metabolic plasticity and growth by modulating the PP2A-GSK3β-MCL-1 Axis. Cancer Cell. 2019;35(5):798–815. doi: 10.1016/j.ccell.2019.03.007 [DOI] [PubMed] [Google Scholar]
- 7.Gianak O, Pavlidou E, Sarafidis C, Karageorgiou V, Deliyanni E. Silk fibroin nanoparticles for drug delivery: effect of bovine serum albumin and magnetic nanoparticles addition on drug encapsulation and release. Separations. 2018;5(2):25. [Google Scholar]
- 8.Zhao XC, Liu RT, Chi ZX, Teng Y, Qin PF. New insights into the behavior of bovine serum albumin adsorbed onto carbon nanotubes: comprehensive spectroscopic studies. J Phys Chem B. 2010;114(16):5625–5631. doi: 10.1021/jp100903x [DOI] [PubMed] [Google Scholar]
- 9.He XM, Carter DC. Atomic structure and chemistry of human serum albumin. Nature. 1992;358(6383):209. doi: 10.1038/358209a0 [DOI] [PubMed] [Google Scholar]
- 10.Sheng F, Wang Y, Zhao X, Tian N, Hu H, Separation LP. Identification of anthocyanin extracted from mulberry fruit and the pigment binding properties toward human serum albumin. J Agric Food Chem. 2014;62(28):6813–6819. doi: 10.1021/jf500705s [DOI] [PubMed] [Google Scholar]
- 11.Su Z, Xing L, Chen Y, et al. Lactoferrin-modified poly (ethylene glycol)-grafted BSA nanoparticles as a dual-targeting carrier for treating brain gliomas. Mol Pharm. 2014;11(6):1823–1834. doi: 10.1021/mp500238m [DOI] [PubMed] [Google Scholar]
- 12.Chen Z, Chen J, Wu L, et al. Hyaluronic acid-coated bovine serum albumin nanoparticles loaded with brucine as selective nanovectors for intra-articular injection. Int J Nanomedicine. 2013;8:3843. doi: 10.2147/IJN.S50721 [DOI] [PMC free article] [PubMed] [Google Scholar]
- 13.Choi J-S, Meghani N. Impact of surface modification in BSA nanoparticles for uptake in cancer cells. Colloids Surf B Biointerfaces. 2016;145:653–661. doi: 10.1016/j.colsurfb.2016.05.050 [DOI] [PubMed] [Google Scholar]
- 14.Miele E, Spinelli GP, Miele E, Tomao F, Tomao S. Albumin-bound formulation of paclitaxel (Abraxane® ABI-007) in the treatment of breast cancer. Int J Nanomedicine. 2009;4:99. [DOI] [PMC free article] [PubMed] [Google Scholar]
- 15.Chawla SP, Papai Z, Mukhametshina G, et al. First-line aldoxorubicin vs doxorubicin in metastatic or locally advanced unresectable soft-tissue sarcoma: a phase 2b randomized clinical trial. JAMA oncol. 2015;1(9):1272–1280. doi: 10.1001/jamaoncol.2015.3101 [DOI] [PubMed] [Google Scholar]
- 16.Leboffe L, Di Masi A, Polticelli F, Trezza V, Ascenzi P. Structural basis of drug recognition by human serum albumin. Curr Med Chem. 2019;26. doi: 10.2174/0929867326666190320105316 [DOI] [PubMed] [Google Scholar]
- 17.Rahnama E, Mahmoodian-Moghaddam M, Khorsand-Ahmadi S, Saberi MR, Chamani J. Binding site identification of metformin to human serum albumin and glycated human serum albumin by spectroscopic and molecular modeling techniques: a comparison study. J Biomol Struct Dyn. 2015;33(3):513–533. doi: 10.1080/07391102.2014.893540 [DOI] [PubMed] [Google Scholar]
- 18.Jose P, Sundar K, Anjali C, Ravindran A. Metformin-loaded BSA nanoparticles in cancer therapy: a new perspective for an old antidiabetic drug. Cell Biochem Biophys. 2015;71(2):627–636. doi: 10.1007/s12013-014-0242-8 [DOI] [PubMed] [Google Scholar]
- 19.Sharma D, Ojha H, Pathak M, et al. Spectroscopic and molecular modelling studies of binding mechanism of metformin with bovine serum albumin. J Mol Struct. 2016;1118:267–274. doi: 10.1016/j.molstruc.2016.04.030 [DOI] [Google Scholar]
- 20.Zang M, Zuccollo A, Hou X, et al. AMP-activated protein kinase is required for the lipid-lowering effect of metformin in insulin-resistant human HepG2 cells. J Biol Chem. 2004;279(46):47898–47905. doi: 10.1074/jbc.M408149200 [DOI] [PubMed] [Google Scholar]
- 21.Michnik A. Thermal stability of bovine serum albumin DSC study. J Therm Anal Calorim. 2003;71(2):509–519. doi: 10.1023/A:1022851809481 [DOI] [Google Scholar]
- 22.Ursini CL, Cavallo D, Fresegna AM, et al. Comparative cyto-genotoxicity assessment of functionalized and pristine multiwalled carbon nanotubes on human lung epithelial cells. Toxicol Vitro. 2012;26(6):831–840. doi: 10.1016/j.tiv.2012.05.001 [DOI] [PubMed] [Google Scholar]
- 23.Twohig P, Rivington J. Sorafenib-induced acute pancreatitis: case report and review of the literature. J Gastrointest Cancer. 2019;50(1):137–142. doi: 10.1007/s12029-017-9980-3 [DOI] [PubMed] [Google Scholar]
- 24.Oikonomopoulos G, Aravind P, Sarker D. Lenvatinib: a potential breakthrough in advanced hepatocellular carcinoma? Future Oncol. 2016;12(4):465–476. doi: 10.2217/fon.15.341 [DOI] [PubMed] [Google Scholar]
- 25.Klajnert B, Bryszewska M. Fluorescence studies on PAMAM dendrimers interactions with bovine serum albumin. Bioelectrochemistry. 2002;55(1):33–35. doi: 10.1016/S1567-5394(01)00170-0 [DOI] [PubMed] [Google Scholar]
- 26.Dubeau S, Bourassa P, Thomas TJ, Tajmir-Riahi HA. Biogenic and synthetic polyamines bind bovine serum albumin. Biomacromolecules. 2010;11(6):1507–1515. doi: 10.1021/bm100144v [DOI] [PMC free article] [PubMed] [Google Scholar]
- 27.Zhao X, Hao F, Lu D, Liu W, Zhou Q, Jiang G. Influence of the surface functional group density on the carbon-nanotube-induced α-chymotrypsin structure and activity alterations. ACS Appl Mater Interfaces. 2015;7(33):18880–18890. doi: 10.1021/acsami.5b05895 [DOI] [PubMed] [Google Scholar]
- 28.Kumaran R, Ramamurthy P. Denaturation mechanism of BSA by urea derivatives: evidence for hydrogen-bonding mode from fluorescence tools. J Fluoresc. 2011;21(4):1499–1508. doi: 10.1007/s10895-011-0836-0 [DOI] [PubMed] [Google Scholar]
- 29.Bourassa P, Hasni I, Tajmir-Riahi HA. Folic acid complexes with human and bovine serum albumins. Food Chem. 2011;129(3):1148–1155. doi: 10.1016/j.foodchem.2011.05.094 [DOI] [PubMed] [Google Scholar]
- 30.Zhao X, Liu R, Teng Y, Liu X. The interaction between Ag(+) and bovine serum albumin: A spectroscopic investigation. Sci Total Environ. 2011;409(5):892–897. doi: 10.1016/j.scitotenv.2010.11.004 [DOI] [PubMed] [Google Scholar]
- 31.Belatik A, Hotchandani S, Bariyanga J, Tajmir-Riahi H. Binding sites of retinol and retinoic acid with serum albumins. Eur J Med Chem. 2012;48:114–123. doi: 10.1016/j.ejmech.2011.12.002 [DOI] [PubMed] [Google Scholar]
- 32.Ross PD, Subramanian S. Thermodynamics of protein association reactions: forces contributing to stability. Biochemistry. 1981;20(11):3096–3102. doi: 10.1021/bi00514a017 [DOI] [PubMed] [Google Scholar]
- 33.Belatik A, Hotchandani S, Carpentier R, Tajmir-Riahi H-A. Locating the binding sites of Pb (II) ion with human and bovine serum albumins. PLoS One. 2012;7(5):e36723. doi: 10.1371/journal.pone.0036723 [DOI] [PMC free article] [PubMed] [Google Scholar]
- 34.Zhao X, Lu D, Hao F, Liu R. Exploring the diameter and surface dependent conformational changes in carbon nanotube-protein corona and the related cytotoxicity. J Hazard Mater. 2015;292:98–107. doi: 10.1016/j.jhazmat.2015.03.023 [DOI] [PubMed] [Google Scholar]
- 35.Xu C, Zhao X, Wang L, Zhang X, Wang Y, Lan J. Protein conjugation with gold nanoparticles: spectroscopic and thermodynamic analysis on the conformational and activity of serum albumin. J Nanosci Nanotechnol. 2018;18(11):7818–7823. doi: 10.1166/jnn.2018.15215 [DOI] [Google Scholar]
- 36.Bekale L, Agudelo D, Tajmir-Riahi HA. Effect of polymer molecular weight on chitosan-protein interaction. Colloids Surf B. 2015;125:309–317. doi: 10.1016/j.colsurfb.2014.11.037 [DOI] [PubMed] [Google Scholar]
- 37.Chanphai P, Tajmir-Riahi H. Tea polyphenols bind serum albumins: A potential application for polyphenol delivery. Food Hydrocoll. 2019;89:461–467. doi: 10.1016/j.foodhyd.2018.11.008 [DOI] [Google Scholar]
- 38.Debia NP, Saraiva MT, Martins BS, et al. Synthesis of amino acid-derived 1, 2, 3-triazoles: development of a nontrivial fluorescent sensor in solution for the enantioselective sensing of a carbohydrate and bovine serum albumin interaction. J Org Chem. 2018;83(3):1348–1357. doi: 10.1021/acs.joc.7b02852 [DOI] [PubMed] [Google Scholar]
- 39.Zhao X, Lu D, Q S L, et al. Hematological effects of gold nanorods on erythrocytes: hemolysis and hemoglobin conformational and functional changes. Adv Sci. 2017;4(12):1700296. doi: 10.1002/advs.201700296 [DOI] [PMC free article] [PubMed] [Google Scholar]
- 40.Zhao X, Sheng F, Zheng J, Liu R. Composition and stability of anthocyanins from purple solanum tuberosum and their protective influence on Cr(VI) targeted to bovine serum albumin. J Agric Food Chem. 2011;59(14):7902–7909. doi: 10.1021/jf2011408 [DOI] [PubMed] [Google Scholar]
- 41.Hussein BHM. Spectroscopic studies of 7, 8-dihydroxy-4-methylcoumarin and its interaction with bovine serum albumin. J Lumin. 2011;131(5):900–908. doi: 10.1016/j.jlumin.2010.12.021 [DOI] [Google Scholar]
- 42.Paramaguru G, Kathiravan A, Selvaraj S, Venuvanalingam P, Renganathan R. Interaction of anthraquinone dyes with lysozyme: evidences from spectroscopic and docking studies. J Hazard Mater. 2010;175(1–3):985–991. doi: 10.1016/j.jhazmat.2009.10.107 [DOI] [PubMed] [Google Scholar]
- 43.Zhou XM, Yang Q, Xie XY, et al. NMR, multi-spectroscopic and molecular modeling approach to investigate the complexes between CI Acid Orange 7 and human serum albumin in vitro. Dyes Pigm. 2012;92(3):1100–1107. doi: 10.1016/j.dyepig.2011.08.012 [DOI] [Google Scholar]
- 44.Anand U, Jash C, Boddepalli RK, Shrivastava A, Mukherjee S. Exploring the Mechanism of Fluorescence Quenching in Proteins Induced by Tetracycline. J Phys Chem B. 2011;115(19):6312–6320. doi: 10.1021/jp2008978 [DOI] [PubMed] [Google Scholar]
- 45.Lu DW, Zhao XC, Zhao YC, et al. Binding of Sudan II and Sudan IV to bovine serum albumin: comparison studies. Food Chem Toxicol. 2011;49(12):3158–3164. doi: 10.1016/j.fct.2011.09.011 [DOI] [PubMed] [Google Scholar]


