Abstract
Aeration in biological nutrient removal (BNR) processes accounts for nearly half of the total electricity costs at many wastewater treatment plants. Even though conventional BNR processes are usually operated to have aerated zones with high dissolved oxygen (DO) concentrations, recent research has shown that nitrification can be maintained using very low-DO concentrations (e.g., below 0.2 mg O2/L), and therefore, it may be possible to reduce energy use and costs in BNR facilities by decreasing aeration. However, the effect of reduced aeration on enhanced biological phosphorus removal (EBPR) is not understood. In this study, we investigated, at the pilot-scale level, the effect of using minimal aeration on the performance of an EBPR process. Over a 16-month operational period, we performed stepwise decreases in aeration, reaching an average DO concentration of 0.33 mg O2/L with stable operation and nearly 90% phosphorus removal. Under these low-DO conditions, nitrification efficiency was maintained, and nearly 70% of the nitrogen was denitrified, without the need for internal recycling of high nitrate aeration basin effluent to the anoxic zone. At the lowest DO conditions used, we estimate a 25% reduction in energy use for aeration compared to conventional BNR operation. Our improved understanding of the efficiency of low-DO BNR contributes to the global goal of reducing energy consumption during wastewater treatment operations.
Keywords: Accumulibacter, BNR, Dissolved oxygen, EBPR, Energy reduction, Nitrification
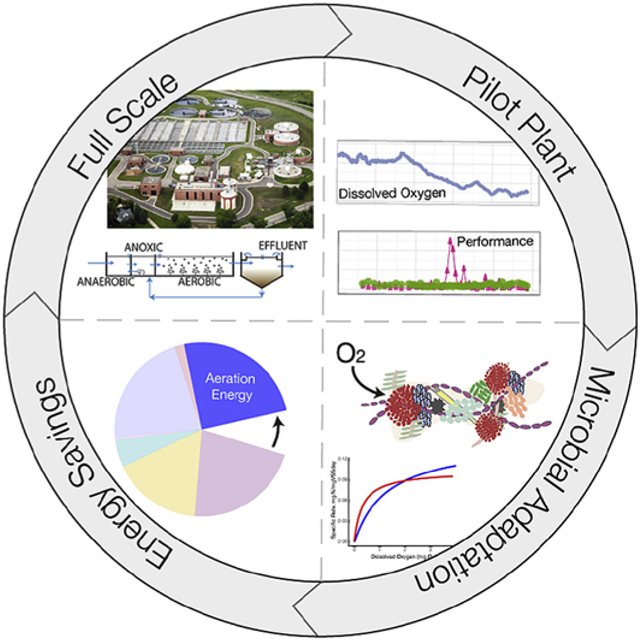
Graphical Abstract
1. Introduction
Traditional high-rate biological nutrient removal (BNR) processes operate with extensive aeration to ensure efficient nitrification and phosphorus (P) removal. Since aeration is one of the most energy intensive activities at BNR facilities, accounting for 30–60% of total energy consumption (Appelbaum, 2002), a reduction in aeration intensity without negatively impacting nutrient removal is desirable.
It is well established that simultaneous nitrification and denitrification (SND) occurs in extended aeration processes in zones having low dissolved oxygen (DO) concentrations (Daigger and Littleton, 2014). For instance, oxidation ditch-type reactors have been shown to achieve up to 50% total nitrogen removal in sections of the process with low aeration (Bertanza, 1997, Park et al., 2002). Membrane bioreactors have also been efficiently operated with low-DO to achieve SND (Giraldo et al., 2011, Littleton et al., 2013). More recent operational approaches such as ammonia-based aeration control (Amand and Carlsson, 2012, Amand et al., 2013, Rieger et al., 2014) have also been shown to effectively achieve SND at low-DO.
Recent experiments have demonstrated that achieving efficient low-DO nitrification requires adaptation of the microbial communities in the activated sludge. Although nitrification ceased when samples from a conventional activated sludge plant were transferred to low-DO conditions (0.2 mg O2/L), nitrification capacity of the sludge was restored after prolonged exposure of the culture to this low-DO environment (Fitzgerald et al., 2015). When DO was slowly reduced in a bench-scale system, nitrification rates were not impacted; however, the adaptation of nitrifying organisms to low-DO conditions was dependent on the sludge age of the system (Liu and Wang, 2013).
Although nitrification at low-DO has been well documented, from lab-scale to full-scale, studies reporting long-term enhanced biological phosphorus removal (EBPR) at low-DO are infrequent. Efficient operation of lab-scale EBPR systems with DO in the aerated zone maintained below 0.45 mg O2/L has been reported (Camejo et al., 2016, Li et al., 2008, Zheng et al., 2009). In addition, kinetic batch experiments suggest that polyphosphate accumulating organisms (PAO) have a higher affinity for oxygen than glycogen accumulating organisms (GAO), and therefore, that low-DO operation may favor PAO activity (Carvalheira et al., 2014).
In this project we studied the effect of steady reductions in aeration in a high-rate BNR pilot plant that simulated the University of Cape Town (UCT)-type configuration used at the Nine Springs Wastewater treatment plant (WWTP) (Madison, WI). The pilot plant, fed primary effluent from the full-scale facility and operated for a period of 16 months, initially simulated high aeration conditions, and then underwent stepwise decreases in aeration. We show that it was possible to achieve efficient nitrification and EBPR with average DO of 0.33 mg O2/L, and that the process maintained efficient nutrient removal when aeration was decreased in a stepwise manner. Batch kinetic experiments of nitrification and P uptake at a range of DO concentrations were performed to evaluate the adaptation of the microbial community to minimal aeration. In addition, we assessed the succession in nitrifying and P removing organisms as a result of decreasing DO with 16S rRNA gene sequencing analysis.
2. Materials and methods
2.1. Continuous flow pilot-scale reactor description and operation
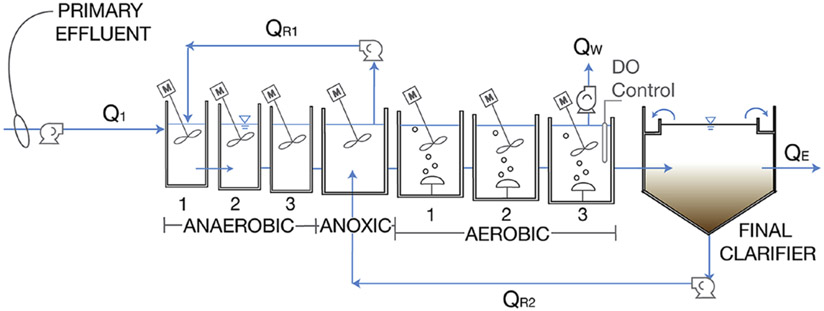
A continuous flow pilot-scale treatment train was seeded from the Nine Springs WWTP (Madison, WI) and was configured to mimic the full-scale process (Fig. 1), which operates as a modified UCT without internal nitrate recycle (since this plant is not required to achieve denitrification). The full-scale Nine Springs WWTP operates with a solids retention time (SRT) and a hydraulic retention time (HRT) of approximately 10 days and 17 hours (h), respectively. The DO in the full-scale aerobic zone reaches concentrations greater than 2.0 mg O2/L. The operational parameters for the pilot- and full-scale plants are summarized in Table S1.
Figure 1.
Continuous flow pilot-scale treatment train operated as a modified UCT process without nitrate recycling, simulating the configuration of the full-scale Nine Springs WWTP. The anaerobic (3 tanks), anoxic (1 tank), and aerobic (3 tanks) portions of the system were equipped with mechanical mixers. The internal recycle (QR1) returned biomass to the beginning of the system from the anoxic tank. Return activated sludge (QR2) was recycled from the bottom of the clarifier to the anoxic zone. Wasting (Qw) occurred from the last aerobic tank.
The anaerobic, anoxic, and aerobic portions of the pilot reactor consisted of seven tanks with a combined total volume of 495 gallons (1870 L). Each tank was equipped with a mechanical mixer. In addition, the system included a secondary clarifier with a total volume of 268 gallons (1010 L). Primary effluent from the full-scale WWTP was directly used as influent to the pilot-scale treatment train. The influent flow rate varied in the range of 1200–1340 gallons per day (GPD) (4.54–5.08 m3/d) and produced a hydraulic retention time of approximately 9–10 h. The anaerobic recycle was maintained at an equivalent flow rate to the influent flow, simulating the operational condition at the full-scale plant. Return activated sludge (RAS) was pumped to the anoxic zone at an average of 2190 GPD (8.28 m3/d). The solids retention time (SRT) was maintained at an average of 10 ± 3.4 days by wasting mixed liquor from the third aerobic tank.
DO was measured in real-time using an optical probe connected to a DO controller (YSI IQ SensorNet FDO Optical DO sensor and YSI IQ SensorNet 182 controller, Yellow Springs, OH) and interfaced to a desktop computer. Data acquisition was performed using LABVIEW (National Instruments, Austin, TX) with DO concentrations recorded every 20 min. Air was provided, from a tap off of the air supply to the full-scale treatment plant, through a fine-bubble membrane diffuser (Sanitaire Silver Series II, Brown Deer, WI) installed at the base of each aerobic tank. Airflow was controlled by direct-reading variable area flow meters (King Instrument Co, Garden Grove, CA) and set at approximately 1.5 SCFM (43 L/min), 1.0 SCFM (28 L/min), and 0.5 SCFM (14 L/min) for the first, second, and third aerobic tanks, respectively. The DO meter maintained a pre-selected maximum DO concentration set point in one of the tanks, and air supply to all of the aerated tanks was controlled via a single solenoid valve.
The reactor was operated in three different phases. In the first phase (days 0–181), DO was maintained relatively high (i.e., average of 0.51 mg O2/L in the first tank, 0.72 mg O2/L in the second tank, and 1.11 mg O2/L in the third tank). Subsequently, DO concentrations in the aerated tanks were steadily decreased in the second operational phase (days 182–365), with at least 3 weeks of operation in between DO reductions. During the third operational phase (days 366–493), the reactor was allowed to stabilize at the lowest DO conditions achieved (i.e., averages of 0.23, 0.48, and 0.28 mg O2/L in the first, second, and third tank, respectively).
2.2. Sample preparation and analysis
Grab samples of primary effluent and pilot plant effluent were collected approximately 2–3 times per week. Grab samples from each tank in the pilot plant were collected weekly. Approximately 15 mL of each sample was immediately filtered through a 0.45-μm membrane filter (Nitrocellulose Membrane Filters, EMD Millipore Corp., Darmstadt, Germany) and the filtrate stored at 4 °C until further analysis. The remaining unfiltered sample was used for solids measurement and DNA extraction.
Total suspended solids (TSS), volatile suspended solids (VSS), phosphate (PO43−), total ammoniacal nitrogen (TAN; NH4+-N plus NH3-N), and Total Kjeldahl Nitrogen (TKN) were conducted following standard methods (Rice et al., 2012). Nitrite (NO2−-N) and nitrate (NO3−-N) were measured with high performance liquid chromatography (HPLC) using a Restek Ultra Aqueous C18 column (Restek Corporation, Bellefonte, PA) and detection by UV at 214 nm in a Shimadzu HPLC system (Shimadzu Scientific Instruments, Columbia, MD).
2.3. Kinetic tests
Nitrification, denitrification, and P uptake experiments were performed in 3-L batch reactors using sludge from the pilot- and full-scale reactors. Activated sludge was collected from the anaerobic zone, stored anaerobically for 20–30 min during transport to the laboratory, and subsequently equilibrated to room temperature.
During ammonia oxidation and P uptake experiments, air was pumped into the reactors through an air bubble stone with DO monitored and controlled every 0.1 min. Targeted DO concentrations were between 0.1 and 4.0 mg O2/L. Measured substrate utilization rates during the batch experiments were normalized by the VSS concentrations. The effect of DO concentration was simulated using a Monod kinetic model (Monod, 1949). Air was not supplied during denitrification experiments. Instead, either sodium nitrite or sodium nitrate were added to create initial nitrite and nitrate concentrations of approximately 20 mg N/L.
2.4. Floc and microcolony size measurements
Full-scale plant and pilot plant floc and microcolony sizes were measured and compared to determine impacts from low-DO operation. A detailed summary of this analysis is described in section 3.1 of the supplementary document.
2.5. 16S ribosomal RNA gene tag sequencing
High-throughput sequencing of 16S rRNA gene fragments was used to analyze the microbial communities in samples from the pilot- and full-scale plants. Links to the raw sequence data and sample metadata described in this study can be accessed through the NCBI BioProject database using the accession PRJNA358610. During the 16-months of pilot plant operation, a total of 53 and 51 grab samples were collected from the pilot- and full-scale plants, respectively. Biomass sample collection began on day 120 of pilot plant operation and continued on a weekly basis through day 490. DNA was extracted using Power® Soil DNA Isolation Kit (MoBIO Laboratories, Carlsbad, CA). Extracted DNA was quantified using a NanoDrop spectrophotometer (Thermo Fisher Scientific, Waltham, MA) and stored at −20 °C. Barcoded PCR primers F515/R806 (Caporaso et al., 2012) were used to amplify the V4 hypervariable region of the 16S rRNA gene. Purified amplicons were pooled in equimolar quantities and sequenced on an Illumina MiSeq sequencer (Illumina, San Diego, CA), using pair-end 250 base pair kits, at the Cincinnati Children’s Hospital DNA core facility.
Files containing paired-end reads were quality trimmed and filtered with Sickle Paired End (‘sickle pe’) using the Sanger fastq file quality type and default minimum length and quality thresholds (Joshi and Fass, 2011). The quality trimmed paired-end reads were merged with Fast Length Adjustment of Short Reads (FLASH) version 1.2.11 using default parameters (Magoc and Salzberg, 2011). Then, the merged reads were aligned, filtered, and binned into operational taxonomic units (OTU) with 97% identity using the standard QIIME protocol (Caporaso et al., 2010). USEARCH version 6.1 was used for OTU picking and chimera detection (Edgar, 2010). The representative sequences from each OTU were taxonomically classified using the MIDas-DK database (McIlroy et al., 2015).
To identify and compare core taxa, OTUs were summarized and normalized at the genus level using a QIIME workflow script (i.e., ‘summarize_taxa_through_plots.py’). To analyze the dataset further, the OTU table along with associated metadata and representative sequences, were imported, stored, and subset using version 1.14.0 of the Phyloseq package (McMurdie and Holmes, 2013) and the R statistical framework, version 3.2.4 (R Core Team, 2016). Comparisons of relative abundance between samples during ordination and dendrogram analysis were made after the dataset was rarefied to an even depth (9693 reads per sample) and filtered to remove low abundance OTUs (i.e., less than 3 sequences). The Bray-Curtis method (Bray and Curtis, 1957) was used to compute the dissimilarity matrices for downstream principle coordinate analysis (PCoA). PCoA ordination was calculated and plotted onto two axes using Phyloseq functions (e.g., ‘ordinate’ and ‘plot_ordination’). Analysis of similarities (ANOSIM), with 999 permutations, was used to statistically test whether there were significant differences between groups (full-scale, and pilot plant operational phases 1, 2, and 3) shown in the PCoA ordination (Clarke, 1993). Graphics were generated with the ggplot2 (Wickham, 2009) and gplots R packages (Warnes et al., 2016). Representative sequences were further classified using the Basic Local Alignment Search Tool (BLAST) (Johnson et al., 2008). Multiple sequence alignments were performed using the Geneious global alignment with free end gaps in Geneious version 9.1.2 (Kearse et al., 2012). Consensus phylogenetic trees were produced using the Neighbor-Joining method on a Tamura-Nei genetic distance model with a bootstrap resampling method in Geneious (Kearse et al., 2012).
2.6. Energy savings calculations
Aeration energy requirements were determined for the full-scale and pilot-scale systems using existing data from the Nine Springs WWTP. A detailed summary of this analysis is described in section 3.2 of the supplementary document.
3. Results
3.1. Reactor performance during step reductions in aeration
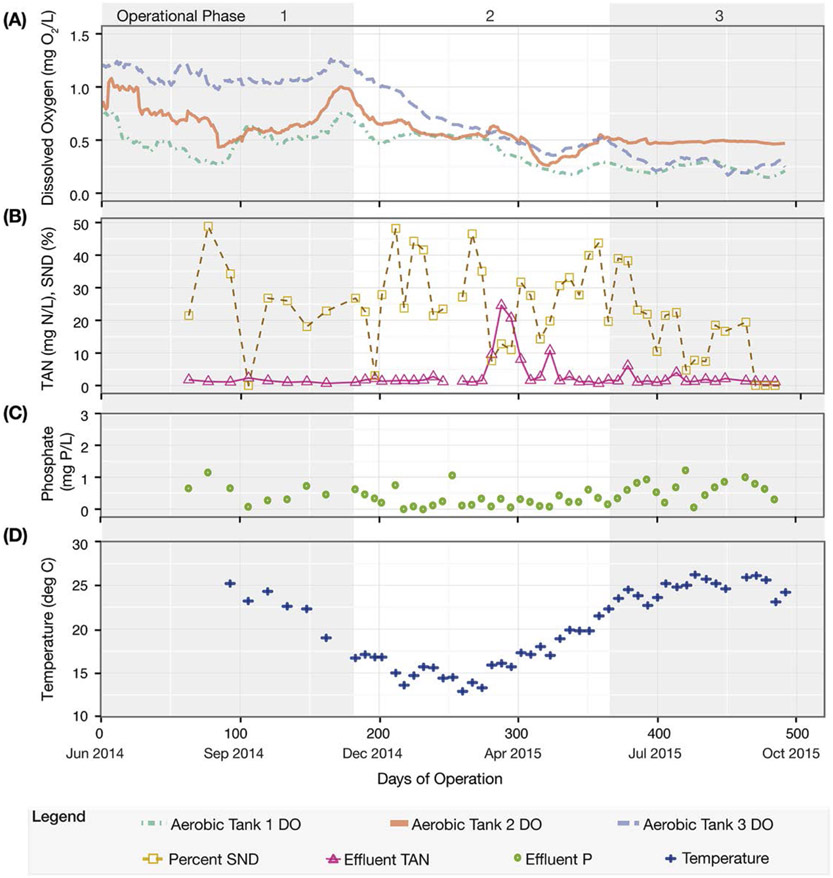
Over all three operational phases, the influent phosphate (P) concentration was 6.5 ± 1.9 mg PO43−-P/L. Influent TKN and TAN was 38 ± 5.7 mg TKN/L and 32 ± 5.7 mg NH3-N/L, respectively. During the first operational phase (day 0–181, Fig. 2), average DO concentrations in the three aerated tanks were 0.51 ± 0.28, 0.72 ± 0.44, and 1.11 ± 0.28 mg O2/L, respectively. Effluent P was 0.55 ± 0.33 mg PO43−-P/L toward the end of this operational period, resulting in an average P removal efficiency of 90 ± 7%. Effluent TKN and TAN concentrations were 1.3 ± 0.51 mg TKN/L and 0.75 ± 0.54 mg NH3-N/L, resulting in removal efficiencies of 96% and 98%, respectively.
Figure 2.
Pilot plant performance during the three operational phases. (A) Dissolved oxygen (DO), represented as a 20-point moving average time series from the three aerobic tanks. (B) Effluent Total Ammoniacal Nitrogen (TAN) and percent of simultaneous nitrification and denitrification (SND). (C) Effluent phosphate (P). (D) Activated sludge temperature.
The second operational phase (days 182–365, Fig. 2) was characterized by a steady decrease in the DO concentrations in the three aerated tanks. P removal remained stable during this period of operation, with effluent concentrations of 0.30 ± 0.24 mg PO43−-P/L, corresponding to a 95 ± 3% P removal efficiency. During this phase, nitrogen removal was sensitive to mechanical disruptions in plant operation. For instance, at day 284, the pilot plant experienced an overflow event that resulted in significant loss of biomass and a decrease in the nitrification efficiency for approximately 18 days (Fig. 2B). Less severe mechanical disruptions occurred at days 278 and 314, which were also followed by temporary decreases in nitrification efficiency. To accelerate the recovery of nitrification in the reactor after these operational upsets, biomass wasting was temporarily discontinued. Excluding the days where nitrification was impacted by operational failure, the TKN and TAN effluent concentrations were an average of 1.5 ± 0.52 mg TKN/L and 0.55 ± 0.54 mg NH3-N/L over this intermediate period of operation.
During the final 127 days of operation (day 366–493), a constant DO concentration was maintained in each of the three aerated tanks (average 0.23 ± 0.13, 0.48 ± 0.12, and 0.28 ± 0.25 mg O2/L, respectively). P removal efficiencies were at 89 ± 9%, with effluent P concentrations of 0.77 ± 0.62 mg PO43−-P/L. TKN and TAN removal efficiencies were greater than 96%, with effluent concentrations at an average of 1.4 ± 0.30 mg TKN/L (excluding two days impacted by minor mechanical disruptions, at days 379 and 414) and 0.13 ± 0.11 mg NH3-N/L, respectively.
3.2. Extent of simultaneous nitrification and denitrification (SND) during reactor operation
The total nitrogen removal efficiency was high during the operation of the reactor (70± 10%). While influent TKN concentrations were 38 ± 5.7 mg TKN/L over all three phases of operation, effluent nitrate plus nitrite concentrations (nitrite below detection limit most of the time) were 8.6 ± 1.7 mg N/L, 8.0 ± 1.9 mg N/L, and 10 ± 1.4 mg N/L for each of the three operational phases, respectively. This level of nitrogen removal was consistently higher than observed in the full-scale plant during the same period of operation, which had an average monthly effluent nitrate plus nitrite concentration of 20 ± 1.4 mg N/L. The difference could be due to denitrification improvements in either the anoxic tank (Fig. 1) or in the low-DO tanks (via SND). Using the difference of TKN in the anoxic stage and total nitrogen in the effluent as a proxy for SND in the plant, we estimated the extent of SND throughout the study (Fig. 2B). This metric fluctuated widely, with sampling days in which minimal SND was observed (e.g., days 197 and 471–492) and days when SND was higher than 40% (e.g., days 212, 267 and 358). During the last operational phase, when DO was the lowest, the variability decreased, and SND was markedly lower than in the earlier two phases. Nonetheless, the total nitrogen removal, which includes SND plus denitrification in the anoxic tank, remained high (68± 6%) during the third operational phase.
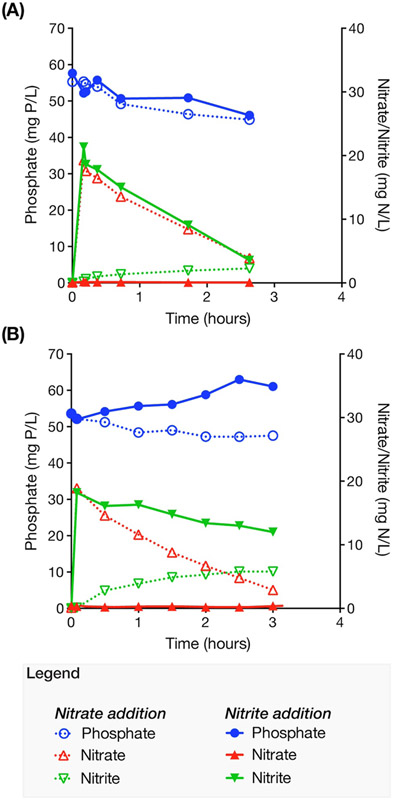
In order to evaluate the potential contribution of denitrifying polyphosphate accumulating organisms (DPAO) to SND in the reactor, we performed batch tests to detect P uptake in the presence of nitrate or nitrite, and in the absence of oxygen (Fig. 3). Fig. 3A shows that at the end of the first operational phase denitrification was possible using nitrate or nitrite as electron acceptors. Approximately 8.8 mg N/L of nitrate and 14 mg N/L of nitrite were denitrified with simultaneous P uptake, at rates of 1.4 and 0.81 mg P h−1 gVSS−1, respectively. After stable low-DO operation (Fig. 3B), a similar extent of denitrification was observed when nitrate was the electron acceptor (i.e., 7.3 mg N/L denitrified), with a P uptake rate of 0.99 mg P h−1 gVSS−1. In contrast, denitrification decreased by a factor of 2.4 when nitrite was the electron acceptor (i.e., 5.9 mg N/L denitrified) and no P uptake was observed. For comparison, the measured P uptake rate in the pilot plant during stable low-DO operation was 5.0 ± 1.9 mg P h−1 gVSS−1, which is approximately five times greater than observed in the nitrate test. Thus, the results suggest that the majority of the P removal in the pilot plant was not associated with DPAO, and therefore, that DPAO were not significant contributors to SND in the reactor.
Figure 3.
Batch experiments of anoxic phosphorus uptake in the presence of nitrate or nitrite, (A) during high-DO operation, and (B) after stable low-DO operation.
3.3. Microbial adaptation to low-DO
The effect of DO on nitrification and P uptake was studied using batch experiments. For comparison, ammonia oxidation and P uptake experiments were performed with samples from the full-scale Nine Springs WWTP and the pilot plant during the third operational phase, when DO was at the lowest levels used.
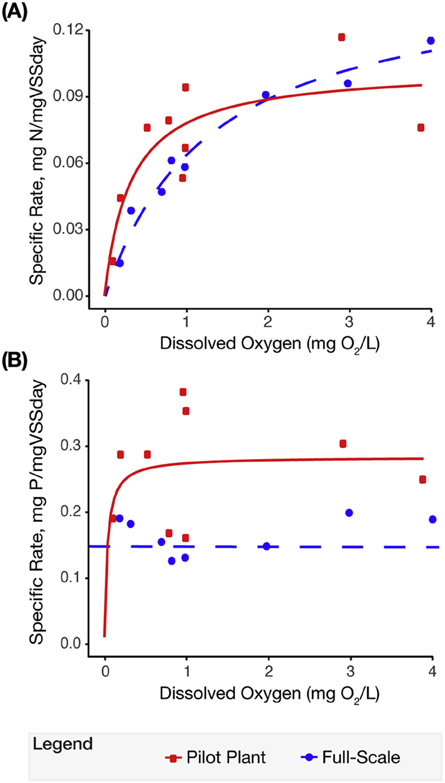
The maximum specific ammonia oxidation rates were 0.11 and 0.10 mg N/mg VSS-d for the full-scale and pilot-scale samples, respectively, whereas the half saturation constants were 1.38 and 0.30 mg O2/L for the full-scale and the pilot plant (Fig. 4A; Table 1). Thus, the adaptation of the ammonia oxidizing microbial community to low-DO in the pilot plant was reflected in the observed half saturation constant, which was an order of magnitude lower at low-DO conditions compared to full-scale operation. Additionally, in these experiments, ammonia was completely oxidized to nitrate, demonstrating that the nitrite oxidizing community was also adapted to the low-DO conditions. This is consistent with the pilot plant operation, where nitrite was rarely detected and nitrate was continuously produced throughout the three phases of operation.
Figure 4.
Comparison of specific rate of ammonia oxidation of activated sludge from the full-scale plant, and from the pilot-scale plant, after stable low-DO operation. Points represent experimental measurements of specific rates at different DO concentrations. Lines represent the best-fit of a Monod kinetic model to the experimental data. (B) Specific rates of phosphorus uptake of activated sludge from the full-scale plant and from the pilot-scale plant after stable low-DO operation (phase 3). Symbols represent experimental measurements of specific rates at different DO concentrations. A Monod kinetic model (solid line) could only be fitted to the data from the pilot-scale plant. A dashed line represents the average maximum specific rate for the full-scale plant.
Table 1.
Best-fit Monod kinetic parameters for ammonia oxidation and phosphorus uptake from the full-scale plant and from the pilot-scale plant after stable low-DO operation.
| Units | Sample Analyzed |
|||
|---|---|---|---|---|
| Full-Scale | Pilot Plant Operational Phase 3 | |||
| Average VSS | mg/L | 930 ± 270 | 1640 ± 600 | |
| Ammonia Oxidation | qmax | mg/mgVSSday | 0.11 ± 0.010 | 0.10 ± 0.013 |
| KDO | mg O2/L | 1.38 ± 0.23 | 0.30 ± 0.14 | |
| R2 | none | 0.98 | 0.80 | |
| Phosphorus Uptake | qmax | mg/mgVSSday | 0.16 ± 0.018 | 0.36 ± 0.058 |
| KDO | mg O2/L | – | 0.091 ± 0.085 | |
| R2 | none | – | 0.32 | |
A similar kinetic analysis was performed to evaluate the effect of DO on P uptake under various DO concentrations (Fig. 4B). Interestingly, the specific rate of P uptake in samples from the full-scale and pilot-scale plants did not change as a function of DO. A half saturation constant could only be determined for the pilot plant (KDO = 0.09 mg O2/L), whereas the Monod model was not adequate to represent the effect of oxygen on P uptake in samples from the full-scale plant. However, the maximum specific P uptake rate in samples from the pilot plant was roughly twice the uptake rate that of the full-scale samples (Table 1). Thus, polyphosphate accumulating organisms (PAO) had a high affinity for oxygen in both plants, and adaptation to low-DO was reflected in higher uptake rates and not in higher oxygen affinity.
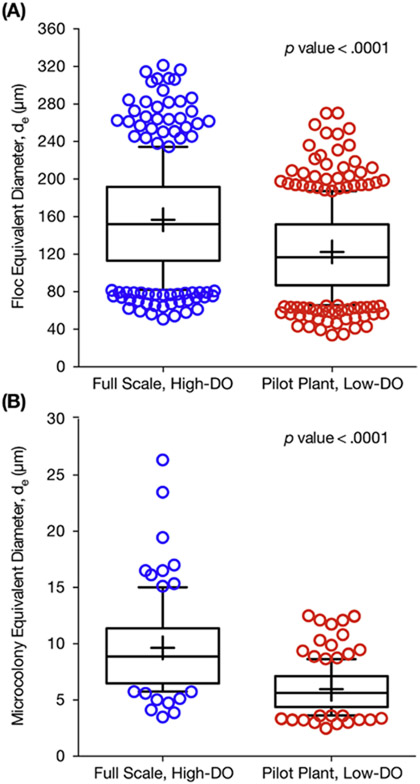
In activated sludge, floc and microcolony sizes can impact a microorganisms apparent affinity for substrates, such as oxygen, due to diffusion gradients (Picioreanu et al., 2016). In order to determine whether the observed oxygen affinity could have been influenced by changes in mass transfer limitations, we measured the size distribution of activated sludge flocs and of ammonia oxidizing bacteria (AOB) microcolonies. After reducing DO, the median floc and AOB microcolony sizes decreased and overall size distribution narrowed (Fig. 5). Median floc equivalent diameter in the full-scale and pilot-scale plant were 152 μm (interquartile range, IQR = 113–192 μm) and 117 μm (IQR = 87–151 μm), respectively (Fig. 5A). Median AOB microcolony equivalent diameter in the full-scale and pilot-scale plant were 8.9 μm (IQR = 6.5–11.4 μm) and 5.6 μm (IQR = 4.4–7.1 μm), respectively (Fig. 5B). While median floc size decreased by only 20% after low-DO operation, this decrease was statistically significant (p < 0.0001 two tailed, Mann-Whitney U = 43,309) (Mann and Whitney, 1947). Additionally, median AOB microcolony size decreased by nearly 40% in the low-DO pilot plant (p < 0.0001 two-tailed, Mann-Whitney U = 2464). Therefore, the observed higher affinity for oxygen in the pilot-scale plant may be partially explained by a reduction in mass transfer limitations within the flocs and the AOB microcolonies.
Figure 5.
Box plots comparing (A) floc size distribution (by median), and (B) AOB microcolony size distribution (by median) for the full-scale plant operating with high DO concentrations and the pilot plant during low-DO operation. The upper and lower bounds of the boxes represent the 25th and 75th percentiles, the whiskers denote the 10th and 90th percentiles, the circular symbols are the outliers, and the plus symbol represents the mean.
3.4. Microbial community composition and dynamics
Next-generation 16S rRNA sequencing was performed with samples from the pilot and full-scale plants to gain further insight into the microbial populations responsible for nitrification and EBPR under low-DO conditions. A total of 2.7 million reads from 53 pilot plant samples and 2.2 million reads from 51 full-scale samples passed all quality checks and were distributed across 76,452 OTUs defined at 97% sequence identity. The core taxa (i.e., populations that were always present) in both plants were identified by initially binning OTUs into groups based on identical taxonomic assignments, which resulted in a total of 53 phyla, 138 classes, and 1383 genera representing all OTUs. Using a mean relative abundance greater than 0.5% as the cut off to define abundant core taxa, 45 genera from the full-scale plant, representing 65% of the total reads, were considered the abundant high-DO core taxa, while 37 genera were categorized as the abundant low-DO core taxa, and accounted for 69% of the total reads from the pilot plant during the final phase of operation. Twenty-five genera were core taxa common to both plants. The 30 most abundant core taxa for the pilot and full-scale plants are shown in Fig. 6.
Figure 6.
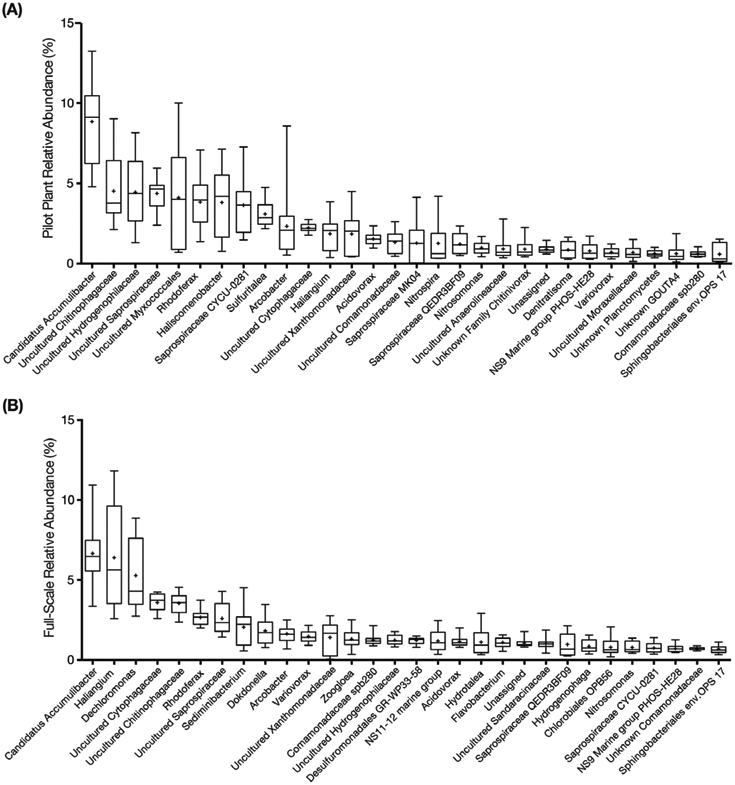
Box plots of the 30 most abundant core taxa classified at the genus level (by median) for (A) Pilot plant, and (B) Full-scale plant during the low-DO operational phase (phase 3). The names in the horizontal axis are the lowest assigned taxonomic rank. The upper and lower bounds of the boxes represent the 25th and 75th percentiles, the whiskers denote the maximum and minimum values, and the plus symbol represents the mean.
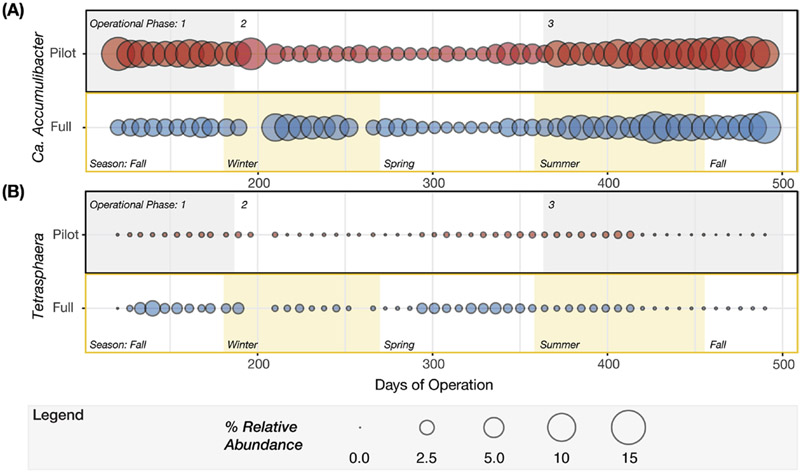
Candidatus Accumulibacter phosphatis (Ca. Accumulibacter) was the most abundant organism detected in both plants (Fig. 6), with mean relative abundances of 5.9± 3.5% and 4.5± 2.4% in the pilot- and full-scale plants, respectively. At the genus-level, although there was seasonal variation of Ca. Accumulibacter, with lower abundance in winter and spring (Fig. 7A), the low-DO of the pilot plant did not negatively impact its relative abundance (8.9± 2.6% and 6.7± 1.9% in pilot and full-scale). Given its high relative abundance, this PAO was likely responsible for most of the P removal in both plants. The genus Tetrasphaera, recently described as containing PAO contributing to P removal in WWTPs (Nguyen et al., 2011), was detected but with mean relative abundances of 0.48± 0.46% in full-scale and 0.14± 0.12% in the pilot plant (Fig. 7B), below the cut off criteria for core taxa and at least an order of magnitude lower than Ca. Accumulibacter. Moreover, GAO were also detected, but also at low abundance. Candidatus Competibacter, Defluviicoccus, and Propionivibrio were present at mean relative abundances less than 0.2%.
Figure 7.
Balloon plots representing temporal variation in relative abundance of genera known to perform phosphorus cycling in EBPR reactors, (A) Candidatus Accumulibacter and (B) Tetrasphaera. For each genus, the pilot plant is described in the upper panel and full-scale plant in the lower panel. Relative abundance was determined based on the entire community. The shaded areas in the upper panels denote the three operational phases, whereas the shaded areas in the lower panels indicate the meteorological seasons between days 120 and 490 of pilot plant operation.
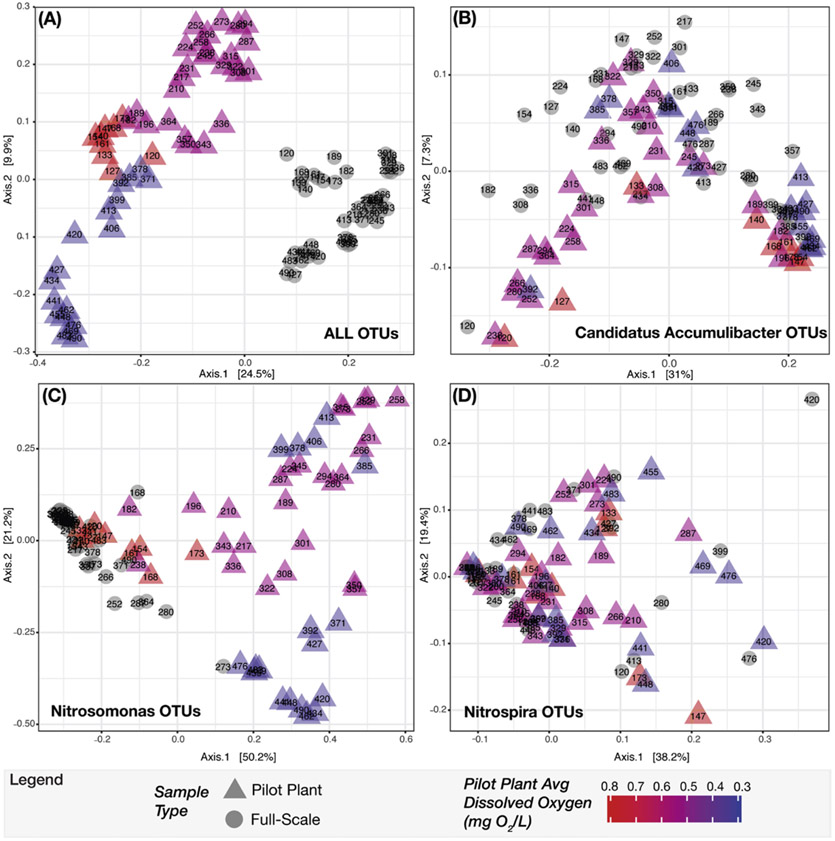
To further compare and evaluate the relationship of Ca. Accumulibacter among samples from both plants, PCoA ordination was performed (Fig. 8). When all OTUs are included, and samples are categorized into four groups (full-scale, and pilot plant operational phase 1, 2 and 3), the analysis indicates that the overall microbial communities were different (ANOSIM P = 0.001, R = 0.83, notu = 8944) (Fig. 8A). Here, the R test statistic >0.75 indicates that the groups are “well separated” (Ramette, 2007). In contrast, when only OTUs classified as Ca. Accumulibacter are used in the analysis, a scattered distribution is obtained, without major differentiation between sample groups (ANOSIM P = 0.002, R = 0.13, notu = 603) (Fig. 8B). Although the p-value suggests that the differences are statistically significant, the R test statistic <0.25 corresponds to “barely separable” groups (Ramette, 2007). Further analysis of OTUs classified as Ca. Accumulibacter revealed that only two of these OTUs were consistently present in the two plants over the entire period of the study (Fig. S1). The representative sequences of these two prevalent Ca. Accumulibacter OTUs (i.e., denovo7 and denovo50 in Fig. S1) had 99% and 97% sequence identity to Ca. Accumulibacter Clade IIA str. UW-1 (Garcia Martin et al., 2006), but the 16S rRNA sequence information was not sufficient to further classify the OTUs into the polyphosphate kinase-based clades that are traditionally used for Ca. Accumulibacter classification (McMahon et al., 2007).
Figure 8.
Principle coordinate analysis (PCoA) ordination of next-generation sequence data comparing sample composition between full-scale and pilot-scale plants using Bray-Curtis dissimilarity matrices. Full-scale samples and pilot plant samples are represented as circles and triangles, respectively. The sample label represents the day of pilot plant operation that the sample was collected. The color gradient denotes the average DO for the pilot plant samples during each operational phase. (A) PCoA with all OTUs from the rarefied and filtered dataset considered. (B) PCoA with OTUs classified as the genera Candidatus Accumulibacter, and with relative abundance calculated using only the total number of reads in the Ca. Accumulibacter specific OTUs. (C) PCoA with relative abundance calculated using only the Nitrosomonas specific OTUs. (D) PCoA with relative abundance calculated using only the Nitrospira specific OTUs. (For interpretation of the references to colour in this figure legend, the reader is referred to the web version of this article.)
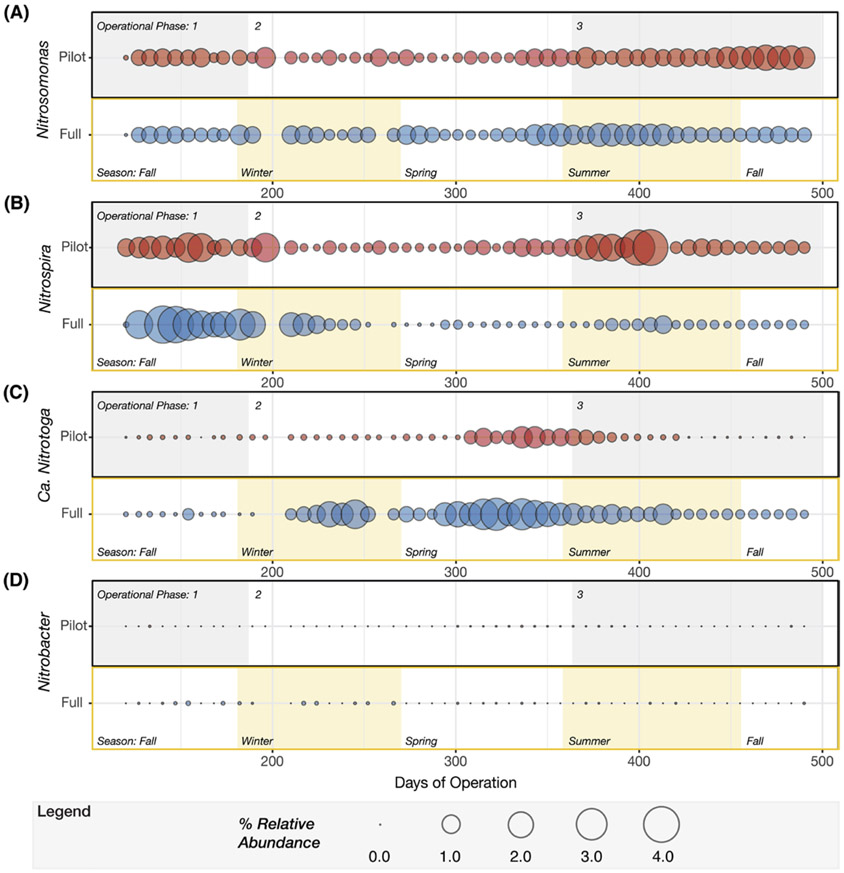
The genus Nitrosomonas was the most abundant AOB detected in both plants (Fig. 6). During the third phase of operation, the mean relative abundance of Nitrosomonas in the pilot- and full-scale plants was 1.0± 0.36% and 0.79± 0.33%, respectively. Other AOB, such as Nitrosomonadaceae, Nitrosospira and Nitrosococcus, as well as ammonia oxidizing archaea (AOA) were infrequently detected with very low relative abundance (Nitrosomonadaceae less than 0.03%, Nitrosospira and Nitrosococcus less than 0.001%, AOA less than 0.0005%) in both plants. While temporal variations of Nitrosomonas in the full- and pilot-scale plants were not distinguishable at the genus level (Fig. 9A), PCoA ordination revealed that the Nitrosomonas community in the pilot plant was similar to full-scale at the beginning of the pilot plant operation, but diverged as the DO decreased (ANOSIM P = 0.001, R = 0.73, notu = 45) (Fig. 8C). Here, the R test statistic >0.5 indicates that the groups are “separated but overlapping” (Ramette, 2007). Further analysis of OTUs classified as Nitrosomonas revealed one OTU (i.e., denovo56 in Fig. S2) was dominant in the full-scale plant over the entire time series and in the pilot plant during the first operational phase, but decreased in abundance in the pilot plant as the DO was decreased (Fig. S2). At the lower DO, other Nitrosomonas OTUs (i.e., denovo201 and denovo166) became enriched (Fig. S2) in the pilot plant. A phylogenetic analysis based on the 16S rRNA gene sequences (Fig. 10) indicated that denovo56 shared a 99.3% sequence identity with Nitrosomonas sp. Nm86 (AY123798.1), denovo201 shared a 99.3% sequence identity with Nitrosomonas sp. JL21 (AB000700.1) and Nitrosomonas sp. Nm59 (AY123811.1), whereas denovo166 shared 99.6% sequence identity with N. oligotropha strain Nm45 (NR_104820.1).
Figure 9.
Balloon plots representing temporal variation in relative abundance of bacterial genera that participate in nitrification, (A) Nitrosomonas, (B) Nitrospira, (C) Candidatus Nitrotoga, and (D) Nitrobacter. For each genus, the pilot plant is described in the upper panel and full-scale plant in the lower panel. Relative abundance was determined based on the entire community. The shaded areas in the upper panels denote the three operational phases whereas the shaded areas in the lower panels indicate the meteorological seasons between days 120 and 490 of pilot plant operation.
Figure 10.
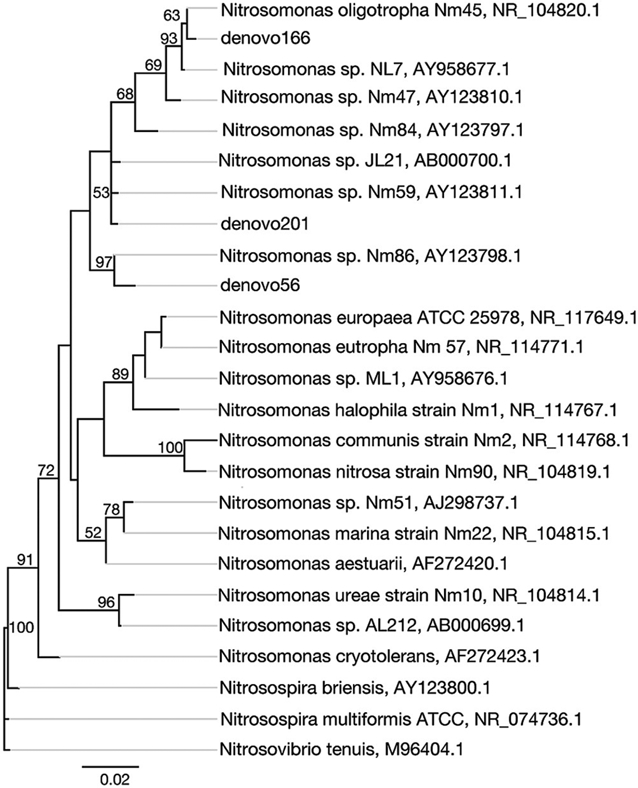
Neighbor-joining consensus tree generated from an alignment of published 16S rRNA sequences and sequences retrieved in this study, rooting with Nitrosovibrio. Bootstrap values, shown at the nodes where the value was greater than 50, are based on 10,000 trials. The scale bar indicates a 2% sequence difference. Accession numbers are presented after the sequence names.
Nitrospira was the most abundant nitrite oxidizing bacteria (NOB) in the pilot plant and was one of the top 30 core taxa, but was not in the top 30 taxa in the full-scale plant (Fig. 6). During the final operational phase, the mean relative abundance of Nitrospira was 1.30± 1.2% and 0.25± 0.17% in the pilot- and full-scale plants, respectively. In the full-scale plant, Nitrospira and Candidatus Nitrotoga (Ca. Nitrotoga) had alternating abundances (Fig. 9B and C). Ca. Nitrotoga was also detected in the pilot plant on a majority of the sampling days; however, this population was greater than 0.1% abundance only between days 308 and 392. In addition, Nitrobacter populations were not significant NOB to either plant (Fig. 9D). Despite the increased abundance of Nitrospira in the pilot plant, the scattered distribution of all high-DO and low-DO sample points in the PCoA did not reveal a diverging NOB population in response to changes in DO (ANOSIM P = 0.002, R = 0.18, notu = 29) (Fig. 8D). Again, although the p-value suggests that the differences are statistically significant, the R test statistic <0.25 corresponds to “barely separable” groups (Ramette, 2007). One Nitrospira OTU (i.e. denovo17) was consistently the dominant Nitrospira in both plants (Fig. S3). The 16S rRNA of this OTU had 100% sequence identity to N. defluvii (NR_074700.1) (Fig. S4).
3.5. Energy savings
Since an outcome of successfully operating a high-rate BNR process with minimal aeration is a reduction in energy, we performed an analysis of energy savings under the scenario of reducing DO at the Nine Springs WWTP. In this analysis, the current Nine Springs WWTP full-scale aeration energy usage was calculated and compared to energy usage in various DO scenarios.
The present-day full-scale operation uses aeration that results in averages of 0.9 mg O2/L, 2.9 mg O2/L and 4.3 mg O2/L in the first, second, and third zones of the aerated tanks, respectively. The calculated aeration energy requirement to maintain these DO concentrations at full-scale was 12,440,000 kWh/year (Table S2), which was within 1% of independent calculations described in a recent energy baseline study (Schroedel Jr. and Wirtz, 2014).
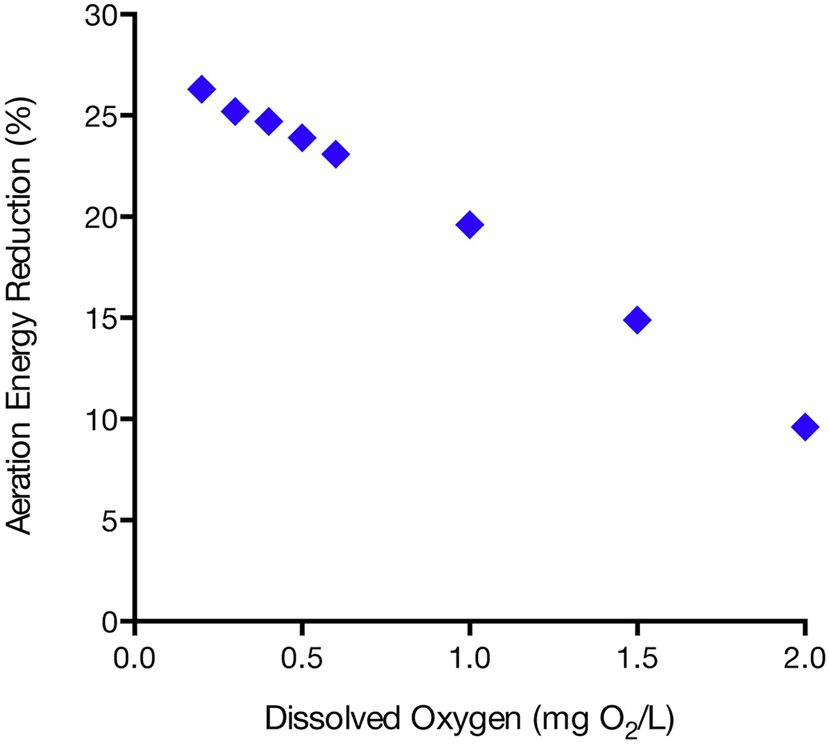
The DO scenarios used in this study (Fig. 11) assumed one DO concentration across the entire aerated portion of the treatment train. If the DO were to be consistently controlled at 2 mg O2/L, without any other changes or upgrades to the aeration system, a potential 10% aeration energy savings could be realized. Furthermore, if the plant were to operate with the lower DO conditions used in the pilot plant (e.g., maintaining an average DO concentration of 0.33 mg O2/L, as was the case in the third phase of operation), nearly 25% in aeration energy savings could be achieved. This level of energy reduction correlates with savings of approximately $262,000 in electricity costs per year (Table S2). This calculation assumes that the WWTP will maintain their current blower efficiency (63%) at the lower air flow rates. Additional savings could be realized from equipment upgrades, and if SND in the low-DO tanks could be stabilized and maintained at a predictable level.
Figure 11.
Estimated energy use reductions at the Nine Springs WWTP for 8 different DO scenarios.
4. Discussion
Achieving energy neutral or energy positive operation of a WWTP often requires a combination of increasing energy production and reducing energy consumption (Kroiss and Cao, 2014). To increase energy production, facilities receive external organic waste to augment biogas generation (Gao et al., 2014, Gómez et al., 2006), use alternative sources of renewable energy, such as solar or wind power (Argaw, 2003, Chae and Kang, 2013), or redirect the majority of the wastewater organics to the anaerobic digester via enhanced primary settling (Jenicek et al., 2013, Remy et al., 2014, Zaborowska et al., 2016). Decreasing energy consumption relies on upgrading equipment to more energy efficient technology (Appelbaum, 2002), reducing heat losses (Chae and Kang, 2013), and minimizing pumping of biosolids, liquid streams, and air supplies (Hoppock and Webber, 2008). Some of these approaches can be constrained by the treatment objectives at the WWTP. For instance, redirecting organics to the anaerobic digester may not be possible if efficient EBPR is required, as organics are needed to enrich for PAOs that efficiently perform the EBPR cycle.
A number of studies have shown that decreasing air delivery into the activated sludge basin is an effective approach to reduce energy use, especially in plants that do not have stringent P removal requirements, or plants that use chemical precipitation for P removal (Amand and Carlsson, 2012, Zaborowska et al., 2016). However, there is a paucity of information regarding the performance of EBPR under reduced aeration, and more importantly, the effect of reduced aeration in BNR systems that require efficient and simultaneous biological nitrogen and P removal has only been studied at the bench-scale (Camejo et al., 2016, Zheng et al., 2009). Thus, to fill these knowledge gaps we used a pilot-scale system to gradually transform a high-rate and high-DO BNR process to high-rate and low-DO conditions. The pilot-scale plant received primary effluent from the adjoining full-scale plant (Nine Springs WWTP, Madison, WI) and experienced the same temporal variability in chemical composition and temperature as the full-scale plant.
During 16 months of operation, aeration was gradually reduced in the pilot plant until the average DO was 0.33 mg O2/L. Over this entire operational period, which included one winter season (Fig. 2), there was stable EBPR performance and nearly 90% P removal. In addition, once low-DO conditions were reached, nitrification efficiency was maintained with nearly 70% of the nitrogen denitrified without the need for internal recycling of sludge. Throughout low-DO operation, the average TKN removal efficiency was greater than 96%, not including days of mechanical disruption that temporarily decreased nitrification performance. EBPR performance was not impacted by these mechanical disruptions, and complete nitrification was regained by temporarily discontinuing normal wasting procedures.
Given the efficient performance of the pilot plant, we carried out additional experiments to evaluate the microbial communities enriched in the plant and to elucidate factors that make low-DO high-rate BNR possible. Regarding EBPR efficiency, the collective results suggest that there were no major changes on the PAO performing EBPR as the plant underwent the transition from high to low-DO. Interestingly, the kinetic experiments showed that the PAO present at high-DO already had high affinity for oxygen (Fig. 4), and after low-DO operation in the pilot plant, the observed oxygen half saturation constant for PAO (KDO = 0.09 mg O2/L) was remarkably low. This observed half saturation constant is nearly 70% less than the value determined for a Ca. Accumulibacter enrichment (KDO = 0.27 mg O2/L) (Carvalheira et al., 2014), and 55% less than the typical value used in activated sludge modeling (KDO = 0.20 mg O2/L, ASM2d) (Henze et al., 2000). Even after long-term low-DO operation, results from the PCoA analysis (Fig. 8) did not reveal any divergence in Ca. Accumulibacter in the two plants and the 16S rRNA tag sequencing revealed the predominance of two Ca. Accumulibacter OTUs that remained dominant through the three operational phases (Fig. S1). The only observation that may reflect an adaptation to low-DO is the higher specific P uptake rate observed in the pilot plant (Fig. 4).
The possibility of denitrifying PAO (DPAO) being enriched in low-DO BNR operation has been proposed (Camejo et al., 2016), although the identity of Ca. Accumulibacter able to denitrify remains controversial (Camejo et al., 2016, Flowers et al., 2009, Kim et al., 2013, Oehmen et al., 2010, Zeng et al., 2003). There also remains uncertainty about the preferred electron acceptor, with some reports suggesting that certain DPAO can only reduce nitrite (Guisasola et al., 2009, Kim et al., 2013), others suggesting that nitrate is preferentially used (Hu et al., 2003, Jiang et al., 2006), and more recently, that some DPAO may simultaneously use oxygen and oxidized forms of nitrogen as electron acceptors in low-DO conditions (Camejo et al., 2016). Since Camejo et al. demonstrated the greatest P uptake when nitrate and oxygen were simultaneously present, it is possible these PAO may have contributed to SND within the aerobic zone of the pilot plant (Camejo et al., 2016). However, the extent of SND in the pilot plant was measured, but not found to be stable (Fig. 2). Furthermore, the measured capacity of PAO to denitrify (Fig. 3) in the pilot plant did not support a high enrichment of DPAO. Overall, these results are consistent with PAOs with high affinity for oxygen being responsible for most of the P removal at low-DO conditions.
In regards to low-DO nitrification, the experimental results suggest a change in the AOB community in response to decreasing DO. The kinetic experiments showed an increase in observed oxygen affinity (Fig. 4). The measured increase in oxygen affinity may be influenced by a reduction in mass transfer limitations due to smaller flocs and smaller AOB microcolonies (Fig. 5), as well as the change in the predominant AOB. The PCoA analysis describes a diverging Nitrosomonas community (Fig. 8), and the OTU-level analysis reveals a transition from a dominant Nitrosomonas OTU at high-DO conditions to two other OTUs at low-DO (Fig. S2). The identification of Nitrosomonas as the most abundant AOB in the full- and pilot-scale plants is consistent with this AOB being prevalent in wastewater treatment even under low-DO conditions (Bellucci et al., 2011, Park and Noguera, 2004, Park and Noguera, 2007). In particular, the enrichment of an N. oligotropha-related OTU (Fig. 10) agrees with this AOB lineage having high affinity for oxygen (Bellucci et al., 2011, Gieseke et al., 2001, Park and Noguera, 2007). The absence of AOA, which have been described as important in low-DO oxidation ditch reactors (Park et al., 2006), but not found in low-DO enrichments from the Nine Springs WWTP (Fitzgerald et al., 2015) supports the hypothesis that AOA are not needed to achieve efficient low-DO nitrification in BNR systems (Fitzgerald et al., 2015).
With the level of resolution afforded by the 16S rRNA tag sequencing, we found no evidence of NOB variations as a result of low-DO (Fig. 8), since the Nitrospira abundance in the reactor remained relatively constant throughout the pilot plant operation. The 16S rRNA partial sequence of the abundant NOB OTU had 100% identity to N. defluvii. This result is consistent with earlier evidence that NOB related to N. defluvii are able to successfully perform nitrite oxidation at low-DO conditions (Park and Noguera, 2008).
Overall, these results give confidence that high-rate BNR systems can be successfully operated with low-DO, confirming that this approach is suitable for reducing energy consumption at WWTPs. We estimated that reducing DO at the Nine Springs WWTP to the conditions used in the pilot plant could represent an approximate 25% reduction in energy use without compromising effluent quality. This reduction would mostly be achieved by the increase in oxygen transfer efficiency from the larger DO gradient generated when maintaining low-DO, since we did not take into consideration the reduction in oxygen requirements due to improved denitrification nor any potential change in the standard oxygen transfer efficiency (see Supplementary Document). Further reductions in energy use could theoretically be accomplished by aeration equipment upgrades. Although these calculations are specific to the Nine Springs WWTP, they reflect the likely scenario of many WWTPs with aging infrastructure that first implemented high-rate BNR decades ago. For such plants, retrofitting to high-rate low-DO BNR may be an attractive option that contributes to the quest for energy neutrality during wastewater treatment.
5. Conclusions
Slow step-wise oxygen reductions were identified as a strategy to transition a conventional high-rate high-DO BNR process to high-rate low-DO BNR operation.
Successful low-DO nitrification combined with low-DO P removal was demonstrated at the pilot-scale, with average DO concentrations as low as 0.33 mg O2/L and average effluent TKN, TAN, and P concentrations at 1.4 ± 0.30 mg TKN/L, 0.13 ± 0.11 mg TAN/L, and 0.77 ± 0.62 mg PO43−-P/L, respectively. Furthermore, TKN, TAN, and P removal efficiencies at low-DO were an average of 96%, 99%, and 89%, respectively.
Adaptation of nitrifiers to low-DO conditions resulted in an observed higher affinity for oxygen (KDO = 0.30 mg O2/L) compared to high-DO nitrification (KDO = 1.38 mg O2/L), which may have been attributed to a decrease in mass transfer limitations in the smaller floc and AOB microcolonies (Fig. 5), and a change in the dominant AOB population (Fig. S2).
PAO in the high-DO full-scale plant exhibited a remarkably high affinity for oxygen. Adaptation of PAO to low-DO conditions was indicated through much higher specific rate of P uptake when compared to PAO from the full-scale plant.
Up to an estimated 25% decrease in aeration energy requirements may be achieved if the full-scale plant converts from high-rate high-DO BNR to high-rate low-DO BNR. Additional reductions could be achieved with upgrades to high efficiency aeration equipment.
Supplementary Material
Highlights.
High-rate BNR operated with low oxygen shows efficient N and P removal.
Smaller flocs and AOB microcolonies likely reduced mass transfer limitations.
AOB adaptation to low DO was reflected in a lower observed half saturation constant.
PAO adaptation to low DO was reflected in higher phosphorus uptake rates.
Acknowledgements
This work was partially supported by funding from the National Science Foundation (CBET-1435661) and the Madison Metropolitan Sewerage District. This work is also supported by the National Science Foundation Graduate Research Fellowship Program under Grant No. DGE-1256259. We thank Jackie Bastyr-Cooper for her assistance in the lab with training, protocols and equipment, and Rodolfo Perez for his help setting up the DO monitoring and control system. We greatly appreciate Alexandria Sabarots for her support with the batch kinetic experiments and Elizabeth Erb for her dedication to collect and record detailed microcolony size data. We also thank Bradley Glisczinski, Tyler Gates, Brian Owen, Sam Acker, Diana Barrera, Matthew Dysthe, Rahim Ansari, Cassie Ganos, Kate Dapolito, and Randy Abilmona for support with laboratory analysis and reactor operation, and Michael Elk for technical support with next-generation 16S rRNA tag sequencing. The U.S. Environmental Protection Agency, through its Office of Research and Development, partially funded and collaborated in the research described herein. Any opinions expressed in this paper are those of the authors and do not reflect the views of the agency; therefore, no official endorsement should be inferred. Any mention of trade names or commercial products does not constitute endorsement or recommendation for use.
References
- Amand L, Carlsson B, Optimal aeration control in a nitrifying activated sludge process, Water Res., 46 (7) (2012), pp. 2101–2110, 10.1016/j.watres.2012.01.023 [DOI] [PubMed] [Google Scholar]
- Amand L, Olsson G, Carlsson B, Aeration control - a review, Water Sci. Technol, 67 (11) (2013), pp. 2374–2398, 10.2166/wst.2013.139 [DOI] [PubMed] [Google Scholar]
- Appelbaum B, Water and Sustainability: U.S. Electricity Consumption for Water Supply & Treatment - the Next Half Century, EPRI, Palo Alto, CA: (2002), p. 1006787, http://www.circleofblue.org/wp-content/uploads/2010/08/EPRI-Volume-4.pdf [Google Scholar]
- Argaw N, Renewable Energy in Water and Wastewater Treatment Applications, National Renewable Energy Laboratory (2003), NREL/SR-500–30383, http://www.nrel.gov/docs/fy03osti/30383.pdf [Google Scholar]
- Bellucci M, Ofiteru ID, Graham DW, Head IM, Curtis TP, Low-dissolved-oxygen nitrifying systems exploit ammonia-oxidizing bacteria with unusually high yields, Appl. Environ. Microbiol, 77 (21) (2011), pp. 7787–7796, 10.1128/AEM.00330-11 [DOI] [PMC free article] [PubMed] [Google Scholar]
- Bertanza G, Simultaneous nitrification-denitrification process in extended aeration plants: pilot and real scale experiences, Water Sci. Technol, 35 (6) (1997), pp. 53–61, 10.1016/S0273-1223(97)00095-4 [DOI] [Google Scholar]
- Bray JR, Curtis JT, An ordination of the upland forest communities of Southern Wisconsin, Ecol. Monogr, 27 (4) (1957), pp. 325–349, 10.2307/1942268 [DOI] [Google Scholar]
- Camejo PY, Owen BR, Martirano J, Ma J, Kapoor V, Santo Domingo J, McMahon KD, Noguera DR, Candidatus Accumulibacter phosphatis clades enriched under cyclic anaerobic and microaerobic conditions simultaneously use different electron acceptors, Water Res., 102 (2016), pp. 125–137, 10.1016/j.watres.2016.06.033 [DOI] [PMC free article] [PubMed] [Google Scholar]
- Caporaso JG, Kuczynski J, Stombaugh J, Bittinger K, Bushman FD, Costello EK, Fierer N, Pena AG, Goodrich JK, Gordon JI, Huttley GA, Kelley ST, Knights D, Koenig JE, Ley RE, Lozupone CA, McDonald D, Muegge BD, Pirrung M, Reeder J, Sevinsky JR, Turnbaugh PJ, Walters WA, Widmann J, Yatsunenko T, Zaneveld J, Knight R, QIIME allows analysis of high-throughput community sequencing data, Nat. Methods, 7 (5) (2010), pp. 335–336, 10.1038/nmeth.f.303 [DOI] [PMC free article] [PubMed] [Google Scholar]
- Caporaso JG, Lauber CL, Walters WA, Berg-Lyons D, Huntley J, Fierer N, Owens SM, Betley J, Fraser L, Bauer M, Gormley N, Gilbert JA, Smith G, Knight R, Ultra-high-throughput microbial community analysis on the Illumina HiSeq and MiSeq platforms, ISME J., 6 (8) (2012), pp. 1621–1624, 10.1038/ismej.2012.8 [DOI] [PMC free article] [PubMed] [Google Scholar]
- Carvalheira M, Oehmen A, Carvalho G, Eusebio M, Reis MA, The impact of aeration on the competition between polyphosphate accumulating organisms and glycogen accumulating organisms, Water Res., 66 (2014), pp. 296–307, 10.1016/j.watres.2014.08.033 [DOI] [PubMed] [Google Scholar]
- Chae K-J, Kang J, Estimating the energy independence of a municipal wastewater treatment plant incorporating green energy resources, Energy Convers. Manag, 75 (2013), pp. 664–672, 10.1016/j.enconman.2013.08.028 [DOI] [Google Scholar]
- Clarke KR, Non-parametric multivariate analyses of changes in community structure, Aust. J. Ecol, 18 (1) (1993), pp. 117–143, 10.1111/j.1442-9993.1993.tb00438.x [DOI] [Google Scholar]
- Daigger GT, Littleton HX, Simultaneous biological nutrient removal: a state-of-the-art review, Water Environ. Res, 86 (3) (2014), pp. 245–257, 10.2175/106143013x13736496908555 [DOI] [PubMed] [Google Scholar]
- Edgar RC, Search and clustering orders of magnitude faster than BLAST, Bioinformatics, 26 (19) (2010), pp. 2460–2461, 10.1093/bioinformatics/btq461 [DOI] [PubMed] [Google Scholar]
- Fitzgerald CM, Camejo P, Oshlag JZ, Noguera DR, Ammonia-oxidizing microbial communities in reactors with efficient nitrification at low-dissolved oxygen, Water Res., 70 (2015), pp. 38–51, 10.1016/j.watres.2014.11.041 [DOI] [PMC free article] [PubMed] [Google Scholar]
- Flowers JJ, He S, Yilmaz S, Noguera DR, McMahon KD, Denitrification capabilities of two biological phosphorus removal sludges dominated by different “Candidatus Accumulibacter” clades, Environ. Microbiol. Rep, 1 (6) (2009), pp. 583–588, 10.1111/j.1758-2229.2009.00090.x [DOI] [PMC free article] [PubMed] [Google Scholar]
- Gao H, Scherson YD, Wells GF, Towards energy neutral wastewater treatment: methodology and state of the art, Environ. Sci. Process Impacts, 16 (6) (2014), pp. 1223–1246, 10.1039/c4em00069b [DOI] [PubMed] [Google Scholar]
- Garcia Martin H, Ivanova N, Kunin V, Warnecke F, Barry KW, McHardy AC, Yeates C, He S, Salamov AA, Szeto E, Dalin E, Putnam NH, Shapiro HJ, Pangilinan JL, Rigoutsos I, Kyrpides NC, Blackall LL, McMahon KD, Hugenholtz P, Metagenomic analysis of two enhanced biological phosphorus removal (EBPR) sludge communities, Nat. Biotechnol, 24 (10) (2006), pp. 1263–1269, 10.1038/nbt1247 [DOI] [PubMed] [Google Scholar]
- Gieseke A, Purkhold U, Wagner M, Amann R, Schramm A, Community structure and activity dynamics of nitrifying bacteria in a phosphate-removing biofilm, Appl. Environ. Microbiol, 67 (3) (2001), pp. 1351–1362, 10.1128/AEM.67.3.1351-1362.2001 [DOI] [PMC free article] [PubMed] [Google Scholar]
- Giraldo E, Jjemba P, Liu Y, Muthukrishnan S, Ammonia oxidizing archaea, AOA, population and kinetic changes in a full scale simultaneous nitrogen and phosphorus removal MBR, 2011 (13) (2011), pp. 3156–3168, 10.2175/193864711802721596, Proceedings of the Water Environment Federation, WEFTEC, Los Angeles, CA [DOI] [Google Scholar]
- Gómez X, Cuetos MJ, Cara J, Morán A, García AI, Anaerobic co-digestion of primary sludge and the fruit and vegetable fraction of the municipal solid wastes, Renew. Energy, 31 (12) (2006), pp. 2017–2024, 10.1016/j.renene.2005.09.029 [DOI] [Google Scholar]
- Guisasola A, Qurie M, Vargas M.d.M., Casas C, Baeza JA, Failure of an enriched nitrite-DPAO population to use nitrate as an electron acceptor, Process Biochem, 44 (7) (2009), pp. 689–695, 10.1016/j.procbio.2009.02.017 [DOI] [Google Scholar]
- Henze M, Gujer W, Mino T, van Loosdrecht MCM, Activated Sludge Models ASM1, ASM2, ASM2d and ASM3, IWA Publishing, London, UK: (2000), 10.1007/s13398-014-0173-7.2 [DOI] [Google Scholar]
- Hoppock D, Webber M, Energy needs and opportunities at POTWs in the United States, Proceedings of the American Society of Mechanical Engineers (ASME) 2nd International Conference on Energy Sustainability, Jacksonville, FL: (2008) [Google Scholar]
- Hu JY, Ong SL, Ng WJ, Lu F, Fan XJ, A new method for characterizing denitrifying phosphorus removal bacteria by using three different types of electron acceptors, Water Res., 37 (14) (2003), pp. 3463–3471, 10.1016/S0043-1354(03)00205-7 [DOI] [PubMed] [Google Scholar]
- Jenicek P, Kutil J, Benes O, Todt V, Zabranska J, Dohanyos M, Energy self-sufficient sewage wastewater treatment plants: is optimized anaerobic sludge digestion the key?, Water Sci. Technol, 68 (8) (2013), pp. 1739–1744, 10.2166/wst.2013.423 [DOI] [PubMed] [Google Scholar]
- Jiang Y, Wang B, Wang LIN, Chen J, He S, Dynamic response of denitrifying poly-P accumulating organisms batch culture to increased nitrite concentration as electron acceptor, J. Environ. Sci. Health, Part A, 41 (11) (2006), pp. 2557–2570, 10.1080/10934520600927930 [DOI] [PubMed] [Google Scholar]
- Johnson M, Zaretskaya I, Raytselis Y, Merezhuk Y, McGinnis S, Madden TL, NCBI BLAST: a better web interface, Nucleic Acids Res., 36 (Web Server issue) (2008), pp. W5–W9, 10.1093/nar/gkn201 [DOI] [PMC free article] [PubMed] [Google Scholar]
- Joshi N, Fass J, Sickle: a Sliding-window, Adaptive, Quality-based Trimming Tool for FastQ Files (Version 1.33) [Software], (2011), https://github.com/najoshi/sickle [Google Scholar]
- Kearse M, Moir R, Wilson A, Stones-Havas S, Cheung M, Sturrock S, Buxton S, Cooper A, Markowitz S, Duran C, Thierer T, Ashton B, Meintjes P, Drummond A, Geneious Basic: an integrated and extendable desktop software platform for the organization and analysis of sequence data, Bioinformatics, 28 (12) (2012), pp. 1647–1649, 10.1093/bioinformatics/bts199 [DOI] [PMC free article] [PubMed] [Google Scholar]
- Kim JM, Lee HJ, Lee DS, Jeon CO, Characterization of the denitrification-associated phosphorus uptake properties of “Candidatus accumulibacter phosphatis” clades in sludge subjected to enhanced biological phosphorus removal, Appl. Environ. Microbiol, 79 (6) (2013), pp. 1969–1979, 10.1128/aem.03464-12 [DOI] [PMC free article] [PubMed] [Google Scholar]
- Kroiss H, Cao Y, Jenkins D, Wanner J (Eds.), Activated Sludge – 100 Years and Counting, IWA Publishing, London: (2014), pp. 221–244, 10.2166/9781780404943 [DOI] [Google Scholar]
- Li H, Chen Y, Gu G, The effect of propionic to acetic acid ratio on anaerobic–aerobic (low dissolved oxygen) biological phosphorus and nitrogen removal, Bioresour. Technol, 99 (10) (2008), pp. 4400–4407, 10.1016/j.biortech.2007.08.032 [DOI] [PubMed] [Google Scholar]
- Littleton H, Wen J, Daigger G, Noguera DR, Strom P, Characterizing Activity of Deammonification, Nitrification, denitrification by AOB, AOA, NOB, anammox and heterotrophic denitrifier in full scale NPXpress MBR plants, 16 (2013) (2013), pp. 1880–1887, (Proceedings of the Water Environment Federation, WEFTEC, Chicago, IL: ) [Google Scholar]
- Liu G, Wang J, Long-term low DO enriches and shifts nitrifier community in activated sludge, Environ. Sci. Technol, 47 (10) (2013), pp. 5109–5117, 10.1021/es304647y [DOI] [PubMed] [Google Scholar]
- Magoc T, Salzberg SL, FLASH: fast length adjustment of short reads to improve genome assemblies, Bioinformatics, 27 (21) (2011), pp. 2957–2963, 10.1093/bioinformatics/btr507 [DOI] [PMC free article] [PubMed] [Google Scholar]
- Mann HB, Whitney DR, On a Test of whether one of two random variables is stochastically larger than the other, Ann. Math. Stat, 18 (1) (1947), pp. 50–60, http://www.jstor.org/stable/2236101 [Google Scholar]
- McIlroy SJ, Saunders AM, Albertsen M, Nierychlo M, McIlroy B, Hansen AA, Karst SM, Nielsen JL, Nielsen PH, MiDAS: the Field Guide to the Microbes of Activated Sludge, (2015), Database (Oxford) 2015, bav062 10.1093/database/bav062 [DOI] [PMC free article] [PubMed] [Google Scholar]
- McMahon KD, Yilmaz S, He S, Gall DL, Jenkins D, Keasling JD, Polyphosphate kinase genes from full-scale activated sludge plants, Appl. Microbiol. Biotechnol, 77 (1) (2007), pp. 167–173, 10.1007/s00253-007-1122-6 [DOI] [PubMed] [Google Scholar]
- McMurdie PJ, Holmes S, phyloseq: an R package for reproducible interactive analysis and graphics of microbiome census data, PLoS One, 8 (4) (2013), p. e61217, 10.1371/journal.pone.0061217 [DOI] [PMC free article] [PubMed] [Google Scholar]
- Monod J, The growth of bacterial cultures, Annu. Rev. Microbiol, 3 (1) (1949), pp. 371–394, 10.1146/annurev.mi.03.100149.002103 [DOI] [Google Scholar]
- Nguyen HT, Le VQ, Hansen AA, Nielsen JL, Nielsen PH, High diversity and abundance of putative polyphosphate-accumulating Tetrasphaera-related bacteria in activated sludge systems, FEMS Microbiol. Ecol, 76 (2) (2011), pp. 256–267, 10.1111/j.1574-6941.2011.01049.x [DOI] [PubMed] [Google Scholar]
- Oehmen A, Carvalho G, Freitas F, Reis MA, Assessing the abundance and activity of denitrifying polyphosphate accumulating organisms through molecular and chemical techniques, Water Sci. Technol, 61 (8) (2010), pp. 2061–2068, 10.2166/wst.2010.976 [DOI] [PubMed] [Google Scholar]
- Park HD, Noguera DR, Evaluating the effect of dissolved oxygen on ammonia-oxidizing bacterial communities in activated sludge, Water Res., 38 (14–15) (2004), pp. 3275–3286, 10.1016/j.watres.2004.04.047 [DOI] [PubMed] [Google Scholar]
- Park HD, Noguera DR, Characterization of two ammonia-oxidizing bacteria isolated from reactors operated with low dissolved oxygen concentrations, J. Appl. Microbiol, 102 (5) (2007), pp. 1401–1417, 10.1111/j.1365-2672.2006.03176.x [DOI] [PubMed] [Google Scholar]
- Park HD, Noguera DR, Nitrospira community composition in nitrifying reactors operated with two different dissolved oxygen levels, J. Microbiol. Biotechnol, 18 (8) (2008), pp. 1470–1474, https://www.ncbi.nlm.nih.gov/pubmed/18756110 [PubMed] [Google Scholar]
- Park HD, Regan JM, Noguera DR, Molecular analysis of ammonia-oxidizing bacterial populations in aerated-anoxic orbal processes, Water Sci. Technol, 46 (1–2) (2002), pp. 273–280, https://www.ncbi.nlm.nih.gov/pubmed/12216636 [PubMed] [Google Scholar]
- Park HD, Wells GF, Bae H, Criddle CS, Francis CA, Occurrence of ammonia-oxidizing archaea in wastewater treatment plant bioreactors, Appl. Environ. Microbiol, 72 (8) (2006), pp. 5643–5647, 10.1128/AEM.00402-06 [DOI] [PMC free article] [PubMed] [Google Scholar]
- Picioreanu C, Perez J, van Loosdrecht MC, Impact of cell cluster size on apparent half-saturation coefficients for oxygen in nitrifying sludge and biofilms, Water Res, 106 (2016), pp. 371–382, 10.1016/j.watres.2016.10.017 [DOI] [PubMed] [Google Scholar]
- R Core Team, R: a Language and Environment for Statistical Computing, R Foundation for Statistical Computing, Vienna, Austria: (2016), https://www.r-project.org/ [Google Scholar]
- Ramette A, Multivariate analyses in microbial ecology, FEMS Microbiol. Ecol, 62 (2) (2007), pp. 142–160, 10.1111/j.1574-6941.2007.00375.x [DOI] [PMC free article] [PubMed] [Google Scholar]
- Remy C, Boulestreau M, Lesjean B, Proof of concept for a new energy-positive wastewater treatment scheme, Water Sci. Technol, 70 (10) (2014), pp. 1709–1716, 10.2166/wst.2014.436 [DOI] [PubMed] [Google Scholar]
- Rice EW, Baird RB, Eaton AD, Clesceri LS, Standard Methods for the Examination of Water and Wastewater, American Public Health Association, American Water Works Association, Water Environment Federation, Washington, D.C: (2012), https://www.e-wef.org/Default.aspx?TabID=251&productId=17997 [Google Scholar]
- Rieger L, Jones RM, Dold PL, Bott CB, Ammonia-based feedforward and feedback aeration control in activated sludge processes, Water Environ. Res, 86 (1) (2014), pp. 63–73, 10.2175/106143013x13596524516987 [DOI] [PubMed] [Google Scholar]
- Schroedel R Jr., Wirtz RA, Energy Baseline and Optimization Roadmap Study, Brown and Caldwell in association with Strand Associates, 144146, (2014), http://www.madsewer.org/Portals/0/Planning/Sustainability/Final_Report Energy Study-Complete.pdf [Google Scholar]
- Warnes GR, Bolker B, Bonebakker L, Gentleman R, Huber W, Liaw A, Lumley T, Maechler M, Magnusson A, Moeller S, Schwartz M, Venables B, gplots: Various R Programming Tools for Plotting Data, (2016), https://cran.r-project.org/package=gplots [Google Scholar]
- Wickham H, ggplot2: Elegant Graphics for Data Analysis, Springer-Verlag, New York: (2009), 10.1007/978-0-387-98141-3 [DOI] [Google Scholar]
- Zaborowska E, Czerwionka K, Makinia J, Strategies for achieving energy neutrality in biological nutrient removal systems - a case study of the Slupsk WWTP (northern Poland), Water Sci. Technol (2016), 10.2166/wst.2016.564 [DOI] [PubMed] [Google Scholar]
- Zeng RJ, Lemaire R, Yuan Z, Keller J, Simultaneous nitrification, denitrification, and phosphorus removal in a lab-scale sequencing batch reactor, Biotechnol. Bioeng, 84 (2) (2003), pp. 170–178, 10.1002/bit.10744 [DOI] [PubMed] [Google Scholar]
- Zheng X, Tong J, Li H, Chen Y, The investigation of effect of organic carbon sources addition in anaerobic–aerobic (low dissolved oxygen) sequencing batch reactor for nutrients removal from wastewaters, Bioresour. Technol, 100 (9) (2009), pp. 2515–2520, 10.1016/j.biortech.2008.12.003 [DOI] [PubMed] [Google Scholar]
Associated Data
This section collects any data citations, data availability statements, or supplementary materials included in this article.


