

Key Points
Question
What is the discriminative accuracy of plasma phospho-tau217 (P-tau217) for differentiating Alzheimer disease from other neurodegenerative disorders?
Findings
In this cross-sectional study that included 1402 participants from 3 selected cohorts, plasma P-tau217 discriminated Alzheimer disease from other neurodegenerative diseases (area under the receiver operating characteristic curve of 0.89 in a neuropathologically defined cohort and 0.96 in a clinically defined cohort), with performance that was significantly better than established Alzheimer disease plasma- and MRI-based biomarkers but not significantly different from key CSF- or PET-based biomarkers.
Meaning
Although plasma P-tau217 was able to discriminate Alzheimer disease from other neurodegenerative diseases, further research is needed to validate the findings in unselected and diverse populations, optimize the assay, and determine its potential role in clinical care.
Abstract
Importance
There are limitations in current diagnostic testing approaches for Alzheimer disease (AD).
Objective
To examine plasma tau phosphorylated at threonine 217 (P-tau217) as a diagnostic biomarker for AD.
Design, Setting, and Participants
Three cross-sectional cohorts: an Arizona-based neuropathology cohort (cohort 1), including 34 participants with AD and 47 without AD (dates of enrollment, May 2007-January 2019); the Swedish BioFINDER-2 cohort (cohort 2), including cognitively unimpaired participants (n = 301) and clinically diagnosed patients with mild cognitive impairment (MCI) (n = 178), AD dementia (n = 121), and other neurodegenerative diseases (n = 99) (April 2017-September 2019); and a Colombian autosomal-dominant AD kindred (cohort 3), including 365 PSEN1 E280A mutation carriers and 257 mutation noncarriers (December 2013-February 2017).
Exposures
Plasma P-tau217.
Main Outcomes and Measures
Primary outcome was the discriminative accuracy of plasma P-tau217 for AD (clinical or neuropathological diagnosis). Secondary outcome was the association with tau pathology (determined using neuropathology or positron emission tomography [PET]).
Results
Mean age was 83.5 (SD, 8.5) years in cohort 1, 69.1 (SD, 10.3) years in cohort 2, and 35.8 (SD, 10.7) years in cohort 3; 38% were women in cohort 1, 51% in cohort 2, and 57% in cohort 3. In cohort 1, antemortem plasma P-tau217 differentiated neuropathologically defined AD from non-AD (area under the curve [AUC], 0.89 [95% CI, 0.81-0.97]) with significantly higher accuracy than plasma P-tau181 and neurofilament light chain (NfL) (AUC range, 0.50-0.72; P < .05). The discriminative accuracy of plasma P-tau217 in cohort 2 for clinical AD dementia vs other neurodegenerative diseases (AUC, 0.96 [95% CI, 0.93-0.98]) was significantly higher than plasma P-tau181, plasma NfL, and MRI measures (AUC range, 0.50-0.81; P < .001) but not significantly different compared with cerebrospinal fluid (CSF) P-tau217, CSF P-tau181, and tau-PET (AUC range, 0.90-0.99; P > .15). In cohort 3, plasma P-tau217 levels were significantly greater among PSEN1 mutation carriers, compared with noncarriers, from approximately 25 years and older, which is 20 years prior to estimated onset of MCI among mutation carriers. Plasma P-tau217 levels correlated with tau tangles in participants with (Spearman ρ = 0.64; P < .001), but not without (Spearman ρ = 0.15; P = .33), β-amyloid plaques in cohort 1. In cohort 2, plasma P-tau217 discriminated abnormal vs normal tau-PET scans (AUC, 0.93 [95% CI, 0.91-0.96]) with significantly higher accuracy than plasma P-tau181, plasma NfL, CSF P-tau181, CSF Aβ42:Aβ40 ratio, and MRI measures (AUC range, 0.67-0.90; P < .05), but its performance was not significantly different compared with CSF P-tau217 (AUC, 0.96; P = .22).
Conclusions and Relevance
Among 1402 participants from 3 selected cohorts, plasma P-tau217 discriminated AD from other neurodegenerative diseases, with significantly higher accuracy than established plasma- and MRI-based biomarkers, and its performance was not significantly different from key CSF- or PET-based measures. Further research is needed to optimize the assay, validate the findings in unselected and diverse populations, and determine its potential role in clinical care.
This cross-sectional study compares the accuracy of plasma tau phosphorylated at threonine 217 (P-tau217) levels vs other plasma-, MRI-, CSF-, and PET-based markers for distinguishing Alzheimer from other neurodegenerative diseases in 3 cohorts in Arizona, Sweden, and Columbia with or at risk for dementia.
Introduction
A major global challenge is the increasing prevalence of dementia, especially dementia caused by Alzheimer disease (AD). It is estimated that approximately 100 million people worldwide will have AD dementia in 2050.1 In the global action plan against dementia, the World Health Organization has specified improved diagnostics as a key area,2 since it is important for optimal disease management and treatment. Early, accurate, and biomarker-based diagnosis of AD will likely become even more important when disease-modifying treatments become available.3,4
Recent improvements in AD diagnostics include biomarkers that can identify its underlying disease pathologies (ie, β-amyloid [Aβ] and tau), using positron emission tomography (PET) or cerebrospinal fluid (CSF) analysis. Specifically Aβ-PET,5 tau-PET,6 the CSF Aβ42:Aβ40 ratio, and CSF tau phosphorylated at threonine 181 (P-tau181)7 have shown high diagnostic accuracy and been incorporated in the diagnostic framework for AD.8 Recently, CSF P-tau217 (phosphorylated at threonine 217) was found more accurate than CSF P-tau181.9 The global use of these biomarkers, however, is still limited because of high costs, insufficient availability, and invasive nature.10 There is therefore a great interest in blood-based biomarkers, and research on plasma Aβ42:Aβ40 ratio11,12 and P-tau18113,14 suggests potential value.
The main objective of this study was to determine the diagnostic accuracy of plasma P-tau217 for AD; both for discriminating clinically diagnosed AD dementia from other neurodegenerative diseases and neuropathologically defined AD from non-AD individuals. The accuracy of plasma P-tau217 was compared with other key plasma, CSF, PET, and magnetic resonance imaging (MRI) biomarkers for AD. Secondary objectives were to investigate the age at which plasma P-tau217 levels increase in autosomal-dominant AD and if plasma P-tau217 levels were associated with AD-like tau pathology, determined using neuropathology or tau-PET.
Methods
Participants and Clinical Assessments
Additional cohort descriptions can be found in the eMethods in the Supplement. All participants or their legal representatives provided written informed consent. Ethical approval was given by the Western Institutional Review Board of Puyallup, Washington (cohort 1), the Regional Ethical Committee in Lund, Sweden (cohort 2) or the institutional review board at the University of Antioquia, Colombia (cohort 3).
Cohort 1 (Arizona-Based Neuropathology Cohort)
Cohort 1 consisted of neuropathologically classified participants from an antemortem-postmortem donor cohort (the Arizona Study of Aging and Neurodegenerative Disorders/Brain and Body Donation Program) with dates of enrollment from May 2007 to January 2019.15 Plasma samples were collected 0.02 to 2.9 years prior to death. Neuropathological diagnosis of AD was based on National Institute on Aging–Reagan Institute (NIA-RI) criteria,16 which are dependent on the Consortium to Establish a Registry for Alzheimer Disease (CERAD) Aβ-plaque scores17 and Braak (neurofibrillary tau-tangle) stage.18 Participants with NIA-RI intermediate likelihood of AD (tangles in limbic regions [Braak III-IV] and moderate-to-frequent Aβ plaques) or high likelihood (tangles in neocortex [Braak V-VI] and moderate-to-frequent Aβ plaques)16 were categorized as having AD. “Non-AD” was used to describe participants with none-to-sparse Aβ plaques.17
Cohort 2 (Swedish BioFINDER-2 Study)
The participants from the prospective Swedish BioFINDER-2 study (NCT03174938) were recruited at Skåne University Hospital and the Hospital of Ängelholm in Sweden (dates of enrollment, April 2017-September 2019) and included cognitively unimpaired controls and patients with mild cognitive impairment (MCI), AD with dementia (fulfilling the Diagnostic and Statistical Manual of Mental Disorders [Fifth Edition] AD criteria19 and Aβ-positive), and various other neurodegenerative diseases. Cognitively unimpaired participants and participants with MCI were subdivided into Aβ-positive/negative participants as well as preclinical AD (Aβ-positive and tau-positive participants without cognitive impairment)8 and AD with MCI (Aβ-positive and tau-positive participants with MCI).8 See the eMethods in the Supplement for details on diagnostic criteria and eFigure 1 in the Supplement for the enrollment flowchart.
Cohort 3 (Colombian Autosomal-Dominant AD Registry)
Cohort 3 included cognitively unimpaired and impaired PSEN1 E280A mutation carriers and age- and sex-matched cognitively unimpaired noncarriers from the same kindred. They were enrolled and assessed in the Alzheimer Prevention Initiative Colombia Registry, with dates of enrollment from December 2013 to February 2017.20 Memory function was assessed using the CERAD 10-word delayed recall test scored from 0 (worst) to 10 (best),21 and global cognition was assessed with the Mini-Mental State Examination scored from 0 (worst) to 30 (best).
Plasma and CSF Sampling and Analysis
Blood samples were collected and handled as described in the eMethods in the Supplement. Concentrations of plasma P-tau217 (all 3 cohorts) were measured using immunoassays at Lilly Research Laboratories.13,22,23 Details of the plasma P-tau217 analysis and analysis of the other plasma and CSF biomarkers are described in the eMethods in the Supplement. All biomarker assays are summarized in eTable 1 in the Supplement. The plasma and CSF analyses were performed by technicians blinded to the clinical and imaging data.
Imaging Procedures in Cohort 2 (BioFINDER-2)
The procedures of MRI, tau-PET (using RO948 labeled with radioactive fluorine [18F])24 and Aβ-PET (using flutemetamol labeled with 18F) are described in the eMethods in the Supplement. All assessments of imaging and clinical data were performed blinded to plasma P-tau217 data.
Outcomes
Detailed definitions of all outcomes are described in the eMethods in the Supplement. The primary outcomes/reference standards were intermediate-to-high likelihood of AD vs non-AD according to neuropathology (cohort 1), or clinical AD dementia vs other neurodegenerative diseases (cohort 2). Neuropathological AD criteria were used, because these still represent the gold standard of AD diagnosis. However, a clinical, Aβ biomarker–supported AD dementia diagnosis better represents the tests’ accuracy in clinical practice and was therefore chosen as an additional primary outcome. A neuropathologically high likelihood of AD vs non-AD was used as secondary outcome to examine the discriminative accuracy of plasma P-tau217 for the most definite AD diagnosis. Tau tangle density at autopsy (cohort 1) and tau-PET or Aβ-PET status (cohort 2) were also used as secondary outcomes to examine the association of plasma P-tau217 with both neuropathological and in vivo state-of-the-art biomarkers for tau or Aβ pathology. Further secondary outcome included age at onset of increased plasma P-tau217 levels in autosomal-dominant AD (cohort 3) to examine how early the plasma P-tau217 levels change in familial AD. Exploratory outcomes included preclinical AD8 and AD with MCI (ie, prodromal AD)8 as reference standards (cohort 2).
Statistical Analysis
Participants with plasma P-tau217 values below the lower detection limit of the assay (0.48 pg/mL) were included in the main analysis (Supplement). A sensitivity analysis excluding these participants was also performed (Supplement). Correlation coefficients were calculated using Spearman rank tests. All group comparisons were adjusted for age and sex (and time between collection of plasma sample and death in cohort 1) in linear regression models using plasma P-tau217 levels as outcome. The primary method for examining the discriminative performance of the biomarkers was the area under the receiver operating characteristic curve (AUC). Significant differences between the AUCs were tested using DeLong statistics,25 and Bonferroni correction was applied to account for multiple comparisons. The correction was applied per research question/analysis (specified in each eTable in the Supplement). There were no missing biomarker data of included participants, except for Aβ-PET, which, per study design, was not performed on all participants. When using Aβ-PET as outcome, only those with Aβ-PET data were included. In cohort 2, the cases with missing biomarker data were not included in the study (eFigure 1 in the Supplement). In cohort 2, sensitivity, specificity, correctly classified participants (“accuracy”), and likelihood ratios were reported using biomarker cutoffs defined as the mean value +2 standard deviations in Aβ-negative controls. Cohort 1 had no control sample and therefore the cutoffs were instead established at the highest Youden Index (sensitivity + specificity – 1) when comparing AD with non-AD cases.
P<.05 (corrected, 2-sided) was considered statistically significant. SPM12 (Wellcome Department of Imaging Neuroscience, Institute of Neurology) was used for voxel-based analyses. SPSS version 26 (IBM) and R version 3.6.1 (R Foundation for Statistical Computing) were used for all other statistical analyses. Additional statistics are described in the eMethods in the Supplement.
Results
Participants
The neuropathology cohort (cohort 1) with antemortem plasma samples included 81 participants. Eighteen (22%) had intermediate likelihood and 16 (20%) had high likelihood of AD. These 34 (42%) comprised the AD group; of these, 27 had dementia. Forty-seven (58%) comprised the non-AD group. The BioFINDER-2 study (cohort 2) included 699 clinically diagnosed participants, of whom 301 (43%) were controls (ie, cognitively unimpaired), 178 (25%) had MCI, 121 (17%) had AD with dementia, and 99 (14%) had various other neurodegenerative diseases. The Colombian autosomal-dominant AD registry (cohort 3) included 622 participants, of whom 365 (59%) were PSEN1 mutation carriers and 257 (41%) age- and sex-matched noncarriers (controls). Among the mutation carriers, 259 (71%) were cognitively unimpaired and 106 (29%) cognitively impaired. Participant characteristics across all 3 cohorts are summarized in eTable 2 in the Supplement and cohort-wise characteristics in eTables 3-7 in the Supplement. The mean age was 83.5 (SD, 8.5) years in cohort 1, 69.1 (SD, 10.3) years in cohort 2, and 35.8 (SD, 10.7) years in cohort 3; 38% were women in cohort 1, 51% in cohort 2, and 57% in cohort 3. The diagnoses among the non-AD groups in cohort 1 and cohort 2 are described in eTables 8 and 9 in the Supplement.
Association Between Plasma P-tau217 and AD in the Neuropathology Cohort (Cohort 1)
For the primary outcome intermediate-to-high likelihood of AD vs non-AD, the AUC was 0.89 (95% CI, 0.81-0.97; 85% correctly classified) using plasma P-tau217 levels, which was significantly higher than the AUCs for plasma levels of P-tau181 (0.72 [95% CI, 0.60 to 0.84]; ∆AUC, 0.17 [95% CI, 0.04 to 0.30]; P = .04) and neurofilament light chain (NfL) (0.50 [95% CI, 0.37 to 0.63]; ∆AUC, 0.39 [95% CI, 0.26 to 0.52]; P < .001) (Figure 1; eFigure 2A and eTable 10 in the Supplement).
Figure 1. Plasma P-tau217 Concentrations in the Neuropathology Cohort (Cohort 1).

A, Correlations between plasma tau phosphorylated at threonine 217 (P-tau217) concentration and total tangle density score in the Alzheimer disease (AD; National Institute on Aging–Reagan Institute [NIA-RI] intermediate or high likelihood of AD) and non-AD (no or sparse β-amyloid plaques) groups. For participants in the AD group, Spearman ρ was 0.64 (P < .001); for those in the non-AD group there was no significant correlation (Spearman ρ = 0.15, P = .33). The tangle density score (x-axis; 0-15) is the sum of neurofibrillary tau-tangle density score (0-3) in standard regions of the frontal, temporal, and parietal lobes; hippocampal CA1; and entorhinal/transentorhinal regions (eMethods in the Supplement). Shaded areas indicate 95% confidence intervals around the regression lines. B, Antemortem plasma P-tau217 concentrations in the AD (NIA-RI intermediate or high likelihood of AD) (n = 34) and non-AD (no or sparse β-amyloid plaques) (n = 47) groups according to neuropathology.16 Box ends denote the 25th and 75th percentiles, and the horizontal line within each box represents the median. Whiskers extend to the upper and lower adjacent values or the most extreme points within 1.5 × interquartile range of the 25th and 75th percentiles. P < .001 for comparison of non-AD and AD groups. Corresponding receiver operating characteristic curve analyses are shown in eFigure 1A in the Supplement.
In secondary analyses that compared participants with high likelihood of AD vs non-AD, the AUC for plasma P-tau217 levels was 0.98 (95% CI, 0.94 to 1.00; 94% correctly classified), which was significantly higher than for plasma levels of P-tau181 (0.85 [95% CI, 0.76 to 0.95]; ∆AUC, 0.12 [95% CI, 0.04 to 0.20]; P = .003) and NfL (0.51 [95% CI, 0.35 to 0.67]; ∆AUC, 0.46 [95% CI, 0.31 to 0.61]; P < .001) (eFigure 2B and 2C and eTable 10 in the Supplement). Furthermore, antemortem plasma P-tau217 levels correlated significantly with the density of cortical tau-containing neurofibrillary tangles postmortem in AD (Spearman ρ = 0.64, P < .001), while there was no significant correlation in non-AD (Spearman ρ = 0.15, P = .33) (Figure 1).
Discriminative Accuracy of Plasma P-tau217 for AD vs Other Neurodegenerative Diseases in the BioFINDER-2 Study (Cohort 2)
The levels of plasma P-tau217 by diagnostic groups are shown in Figure 2A (P values for group comparisons are reported in eTable 11 in the Supplement). The AUCs for the primary clinical outcome of AD dementia vs other neurodegenerative diseases are shown in Figure 2, panels B and C; corresponding sensitivities, specificities, likelihood ratios, and accuracies are reported in the Table. For plasma P-tau217, 89% of the participants were correctly classified and the AUC was 0.96 (95% CI, 0.93 to 0.98), which was significantly higher than for plasma levels of P-tau181 (0.81 [95% CI, 0.74 to 0.87]; ∆AUC, 0.15 [95% CI, 0.10 to 0.21]; P < .001) and NfL (0.50 [95% CI, 0.42 to 0.58]; ∆AUC, 0.46 [95% CI, 0.38 to 0.50]; P < .001) and the MRI measures of cortical thickness of AD signature regions (0.78 [95% CI, 0.72 to 0.85]; ∆AUC, 0.17 [95% CI, 0.10 to 0.25]; P < .001) and hippocampal volume (0.74 [95% CI, 0.67 to 0.81]; ∆AUC, 0.22 [95% CI, 0.14 to 0.30]; P < .001) (Figure 2B; eTable 12 in the Supplement). However, the AUC of plasma P-tau217 was not significantly different from that of CSF P-tau217 (0.99 [95% CI, 0.98 to 1.00]; ∆AUC, –0.03 [95% CI, –0.06 to –0.01]; P = .15), CSF P-tau181 (0.90 [95% CI, 0.86 to 0.95]; ∆AUC, 0.05 [95% CI, 0.01 to 0.10]; P = .21) or tau-PET (0.98 [95% CI, 0.97 to 0.99]; ∆AUC, –0.02 [95% CI, –0.05 to 0.00]; P = .72) (Figure 2C; eTable 12 in the Supplement). Separate AUCs of plasma P-tau217 for discriminating AD dementia vs other specific neurodegenerative diseases, vs Aβ-negative controls and vs Aβ-negative MCI, are reported in the Table and in eFigure 3 in the Supplement. Overall, plasma P-tau217 had AUCs of 0.92 to 0.98 in these analyses.
Figure 2. Plasma P-tau217 in the BioFINDER-2 Study (Cohort 2).
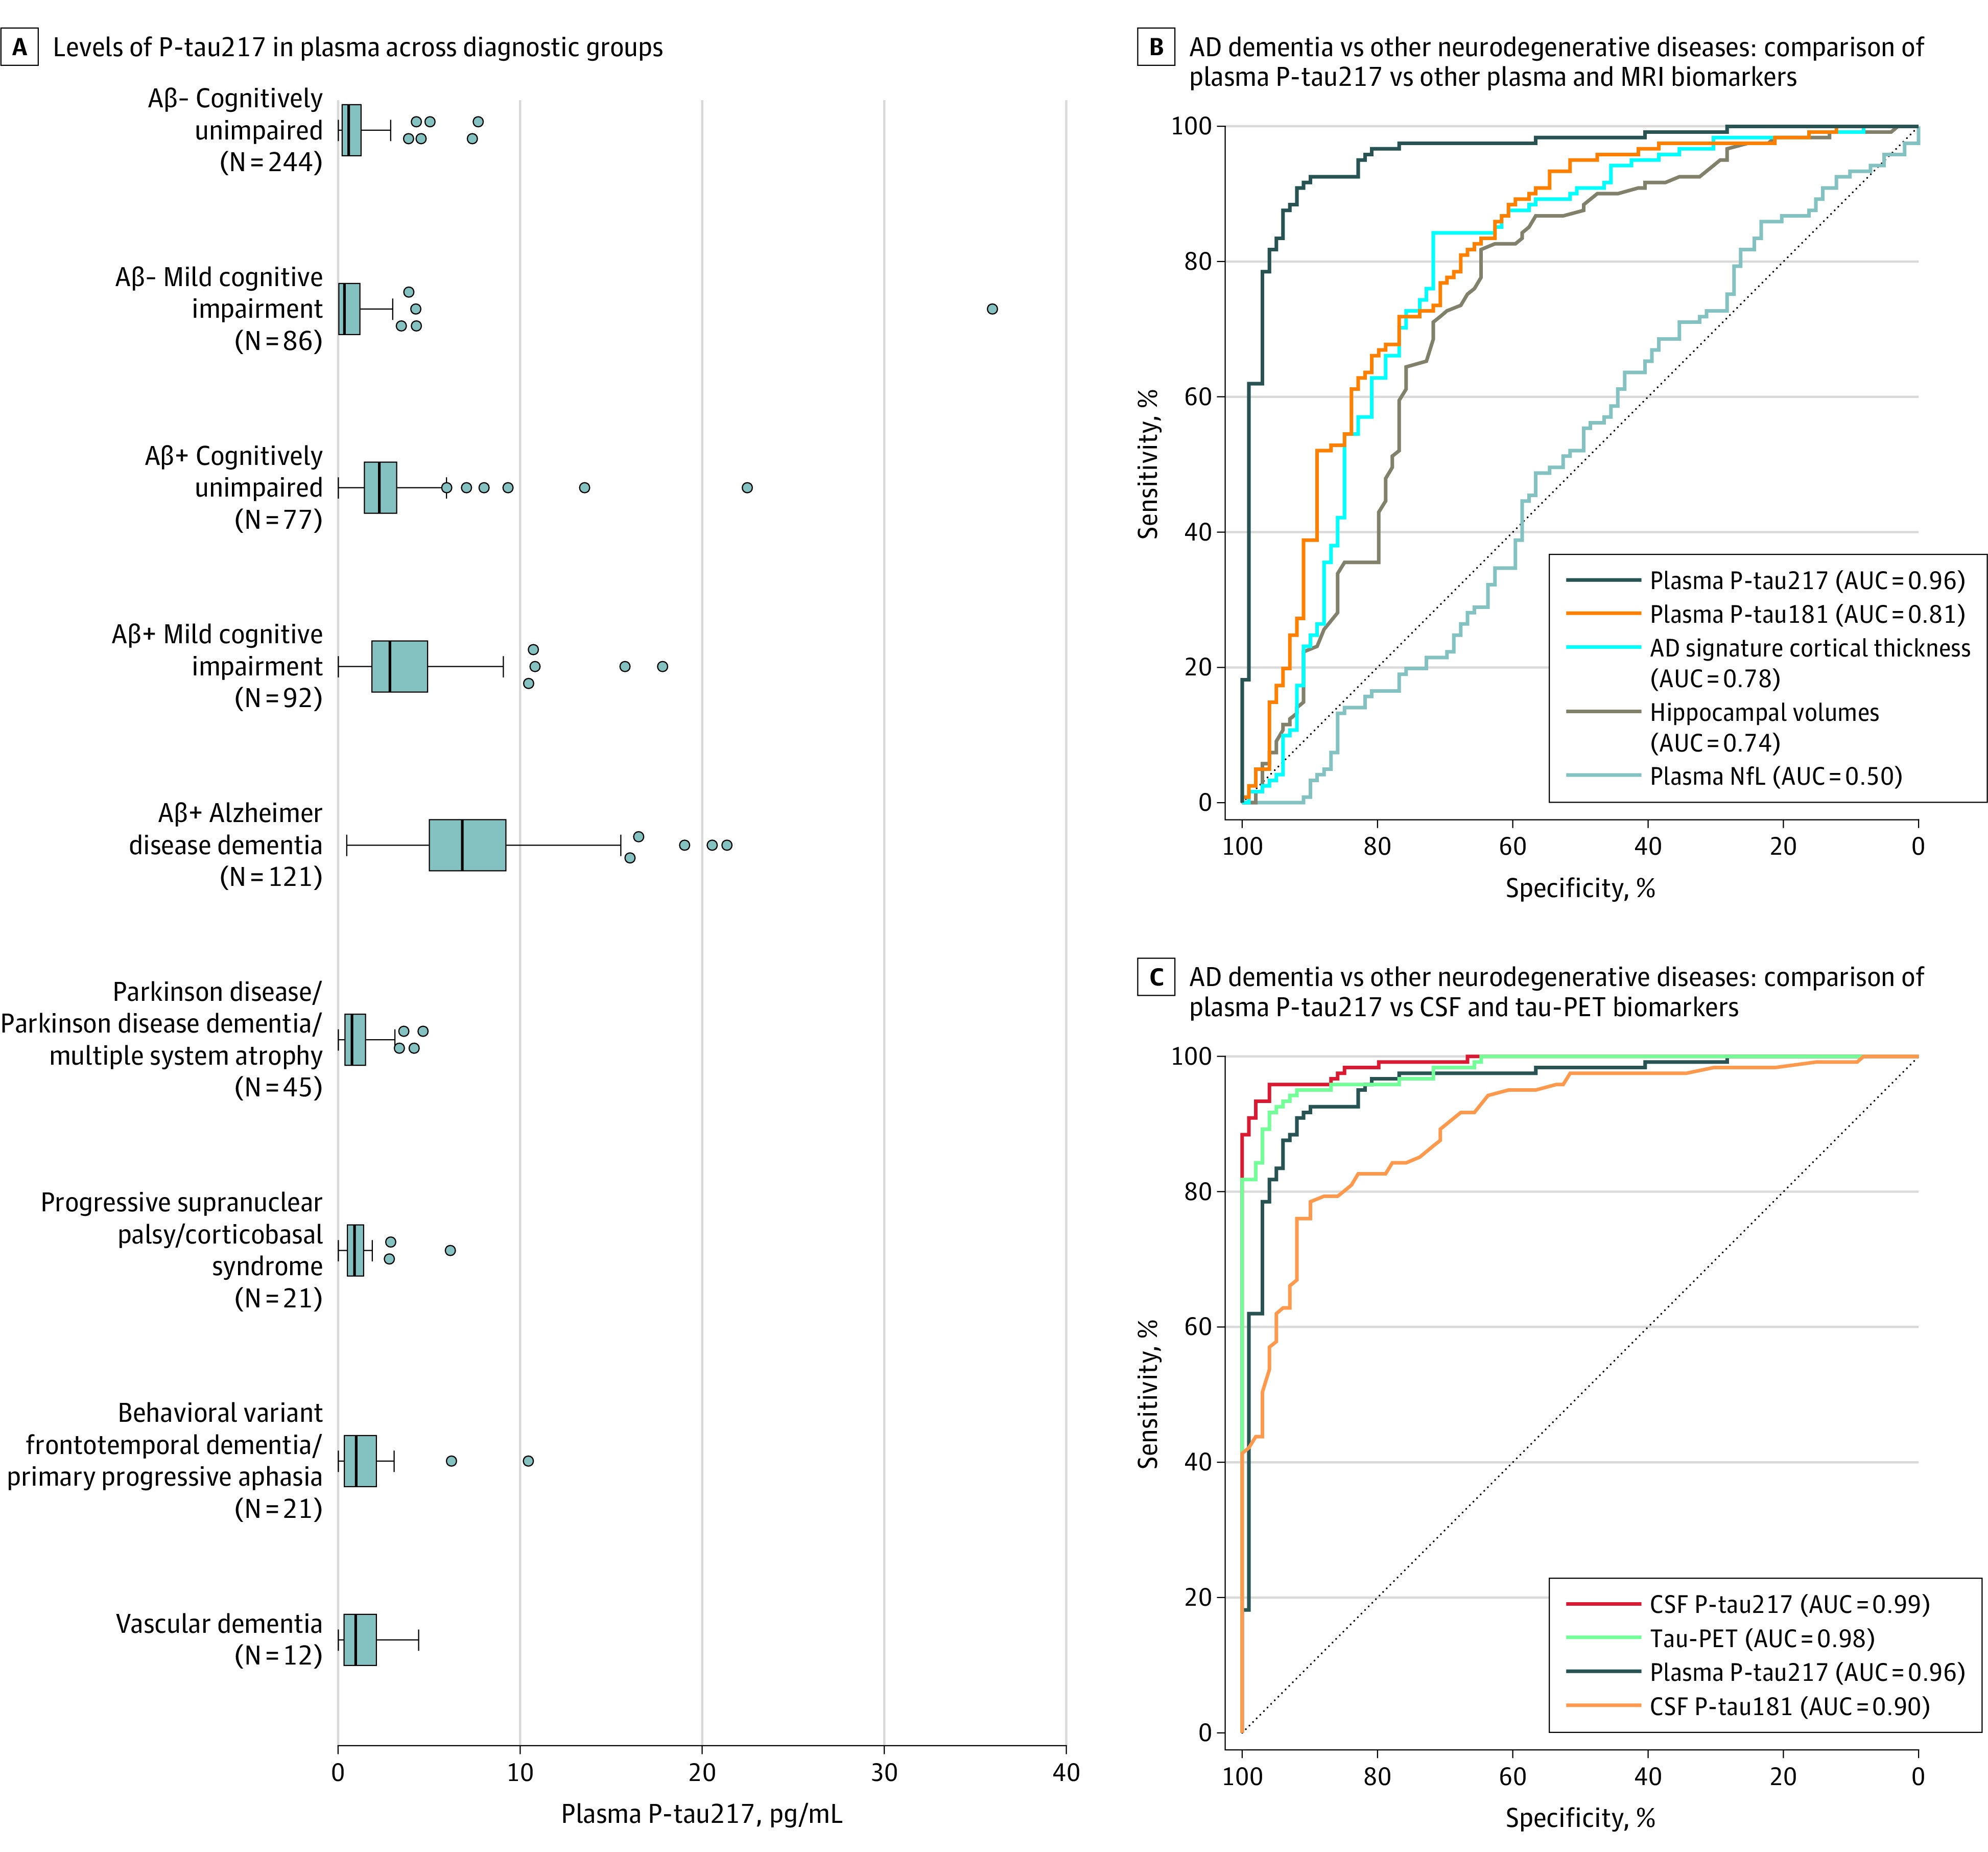
A, Plasma tau phosphorylated at threonine 217 (P-tau217) concentrations across the different diagnostic groups. P values from group comparisons are shown in eTable 11 in the Supplement. Box ends denote the 25th and 75th percentiles, the vertical lines are medians, and the whiskers extend to the upper and lower adjacent values or the most extreme points within 1.5 × interquartile range of the 25th and 75th percentiles. B and C show receiver operating characteristic (ROC) curve analyses with clinical Alzheimer disease (AD) dementia (n = 121) vs all other neurodegenerative diseases (n = 99) as reference standard comparing plasma P-tau217 with other plasma biomarkers and magnetic resonance imaging (MRI) (B); and comparing plasma P-tau217 with cerebrospinal fluid biomarkers and tau-PET (C). Statistical comparisons between areas under the ROC curve (AUCs) are reported in eTable 12 in the Supplement. Separate ROC curve analysis for AD dementia vs other specific diagnostic groups are shown in eFigure 3 in the Supplement. Aβ+ indicates β-amyloid positive; Aβ–, β-amyloid negative; CSF, cerebrospinal fluid; NfL, neurofilament light chain; PET, positron emission tomography.
Table. Diagnostic Performance of Plasma P-tau217 for Differentiating Alzheimer Disease From Other Neurodegenerative Diseases in the BioFINDER-2 Cohort (Cohort 2)a.
| AD dementia (n = 121) vs | No. | AUC (95% CI) | % (95% CI) | Likelihood ratio (95% CI) | ||
|---|---|---|---|---|---|---|
| Correctly classified participants | Specificity (at 93% sensitivity)b | Positive | Negative | |||
| All other neurodegenerative diseases | 99 | 0.96 (0.94-0.98)c | 89 (86-92) | 83 (77-89) | 5.4 (4.1-8.1) | 0.08 (0.03-0.12) |
| All Aβ-negative other neurodegenerative diseases | 84 | 0.96 (0.94-0.99) | 92 (89-95) | 89 (84-95) | 8.7 (5.9-16.8) | 0.06 (0.03-0.11) |
| All Aβ-positive other neurodegenerative diseases | 15 | 0.93 (0.89-0.96) | 88 (84-92) | 47 (25-67) | 1.8 (1.2-2.8) | 0.14 (0.06-0.28) |
| Behavioral variant of frontotemporal dementia or primary progressive aphasia | 21 | 0.92 (0.87-0.99) | 92 (88-95) | 81 (67-93) | 4.9 (2.9-12.7) | 0.09 (0.03-0.13) |
| Vascular dementia | 12 | 0.97 (0.94-0.99) | 92 (89-96) | 83 (67-100) | 5.6 (2.8-9.3) | 0.08 (0.03-0.13) |
| Parkinson disease or multiple system atrophy | 45 | 0.97 (0.95-0.99) | 90 (87-94) | 82 (74-92) | 5.3 (3.5-11.4) | 0.08 (0.03-0.12) |
| Progressive supranuclear palsy or corticobasal syndrome | 21 | 0.96 (0.93-0.99) | 92 (89-96) | 86 (75-100) | 6.5 (3.6-14.9) | 0.08 (0.03-0.12) |
| Aβ-negative mild cognitive impairment | 86 | 0.97 (0.96-0.99) | 93 (91-96) | 93 (89-98) | 13.4 (8.4-44.0) | 0.07 (0.03-0.11) |
| Aβ-negative controls | 224 | 0.98 (0.97-0.99) | 95 (93-97) | 96 (94-98) | 20.9 (14.4-43.1) | 0.07 (0.03-0.10) |
Abbreviations: Aβ, β-amyloid; AD, Alzheimer disease; AUC, area under the receiver operating characteristic curve; P-tau217, plasma tau phosphorylated at threonine 217.
The reference standard was clinical Alzheimer disease diagnosis vs other diseases/conditions (specified in the first column). A cutoff of greater than 2.5 pg/mL was used for plasma P-tau217, which was established using the mean +2 standard deviations in Aβ-negative control participants.
The predefined cutoff (2.5 pg/mL) produced a sensitivity of 93% for identifying AD and the sensitivity was consequently 93% in all analyses with AD vs other groups. The 95% CI for the sensitivity was 90%-97%.
The 95% CIs in the table were calculated using the percentile method (due to small sample sizes in some of the other neurodegenerative groups), which explains the small discrepancy in 95% CIs; 0.94-0.98 in this table and 0.93-0.98 in the text (from eTable 12 in the Supplement) when comparing with other biomarkers.
According to the updated diagnostic framework for AD diagnosis, AD can be diagnosed before the dementia stage if biomarkers provide evidence for both Aβ and tau pathologies.8 When using these criteria as exploratory outcomes, the preclinical AD and AD with MCI groups had significantly higher plasma P-tau217 levels than Aβ-negative controls and Aβ-negative MCI (eFigure 4A, eTable 13 in the Supplement). Plasma P-tau217 differentiated preclinical AD from Aβ-negative controls (AUC, 0.90 [95% CI, 0.85 to 0.94]) and AD with MCI (prodromal AD) from Aβ-negative MCI (AUC, 0.91 [95% CI, 0.86 to 0.95]). Comparisons of plasma P-tau217 with other biomarkers are shown in eFigure 4, panels B-E and in eTables 14 and 15 in the Supplement.
Relationship With Tau-PET, Aβ-PET, and CSF P-tau217 in the BioFINDER-2 Study (Cohort 2)
When examining tau-PET as a function of increasing plasma P-tau217 levels (eFigure 5A in the Supplement), a significant association was seen in Aβ-positive (r2 = 0.56, P < .001), but not Aβ-negative (r2 = 0.00, P = .53), participants. Voxel-wise associations with tau-PET and Aβ-PET are shown in eFigure 6, panels A-D in the Supplement, revealing that plasma P-tau217 levels were most strongly associated with the tau-PET signal in temporoparietal regions and with Aβ-PET in medial frontoparietal regions. Correlations with different tau-PET regions of interest and other biomarkers are reported in eTable 16 in the Supplement and the association with CSF P-tau217 in eFigure 5B and eTable 16 in the Supplement.
Plasma P-tau217 levels discriminated abnormal vs normal tau-PET status with an AUC of 0.93 (95% CI, 0.91 to 0.96; 86% correctly classified), which was significantly higher than the AUCs for plasma levels of P-tau181 (0.83 [95% CI, 0.80 to 0.87]; ∆AUC, 0.10 [95% CI, 0.06 to 0.13]; P < .001) and NfL (0.67 [95% CI, 0.63 to 0.72]; ∆AUC, 0.26 [95% CI, 0.21 to 0.30]; P < .001); for CSF levels of P-tau181 (0.85 [95% CI, 0.81 to 0.88]; ∆AUC, 0.09 [95% CI, 0.05 to 0.12]; P < .001) and Aβ42:Aβ40 ratio (0.90 [95% CI, 0.87 to 0.92]; ∆AUC, 0.04 [95% CI, –0.01 to 0.08]; P = .04); and for MRI measures of cortical thickness of AD signature regions (0.84 [95% CI, 0.81 to 0.88]; ∆AUC, 0.09 [95% CI, 0.04 to 0.13]; P < .001) and hippocampal volume (0.80 [95% CI, 0.77 to 0.84]; ∆AUC, 0.13 [95% CI, 0.08 to 0.17]; P < .001). However, the AUC of plasma P-tau217 was not significantly different from the AUC for CSF P-tau217 (0.96 [95% CI, 0.94 to 0.97]; ∆AUC, –0.02 [95% CI, –0.05 to 0.00]; P = .22) (Figure 3, panels A and C; eTable 17 in the Supplement).
Figure 3. Discriminative Accuracy of Plasma P-tau217 for Tau-PET and Aβ-PET in the BioFINDER-2 Study (Cohort 2).
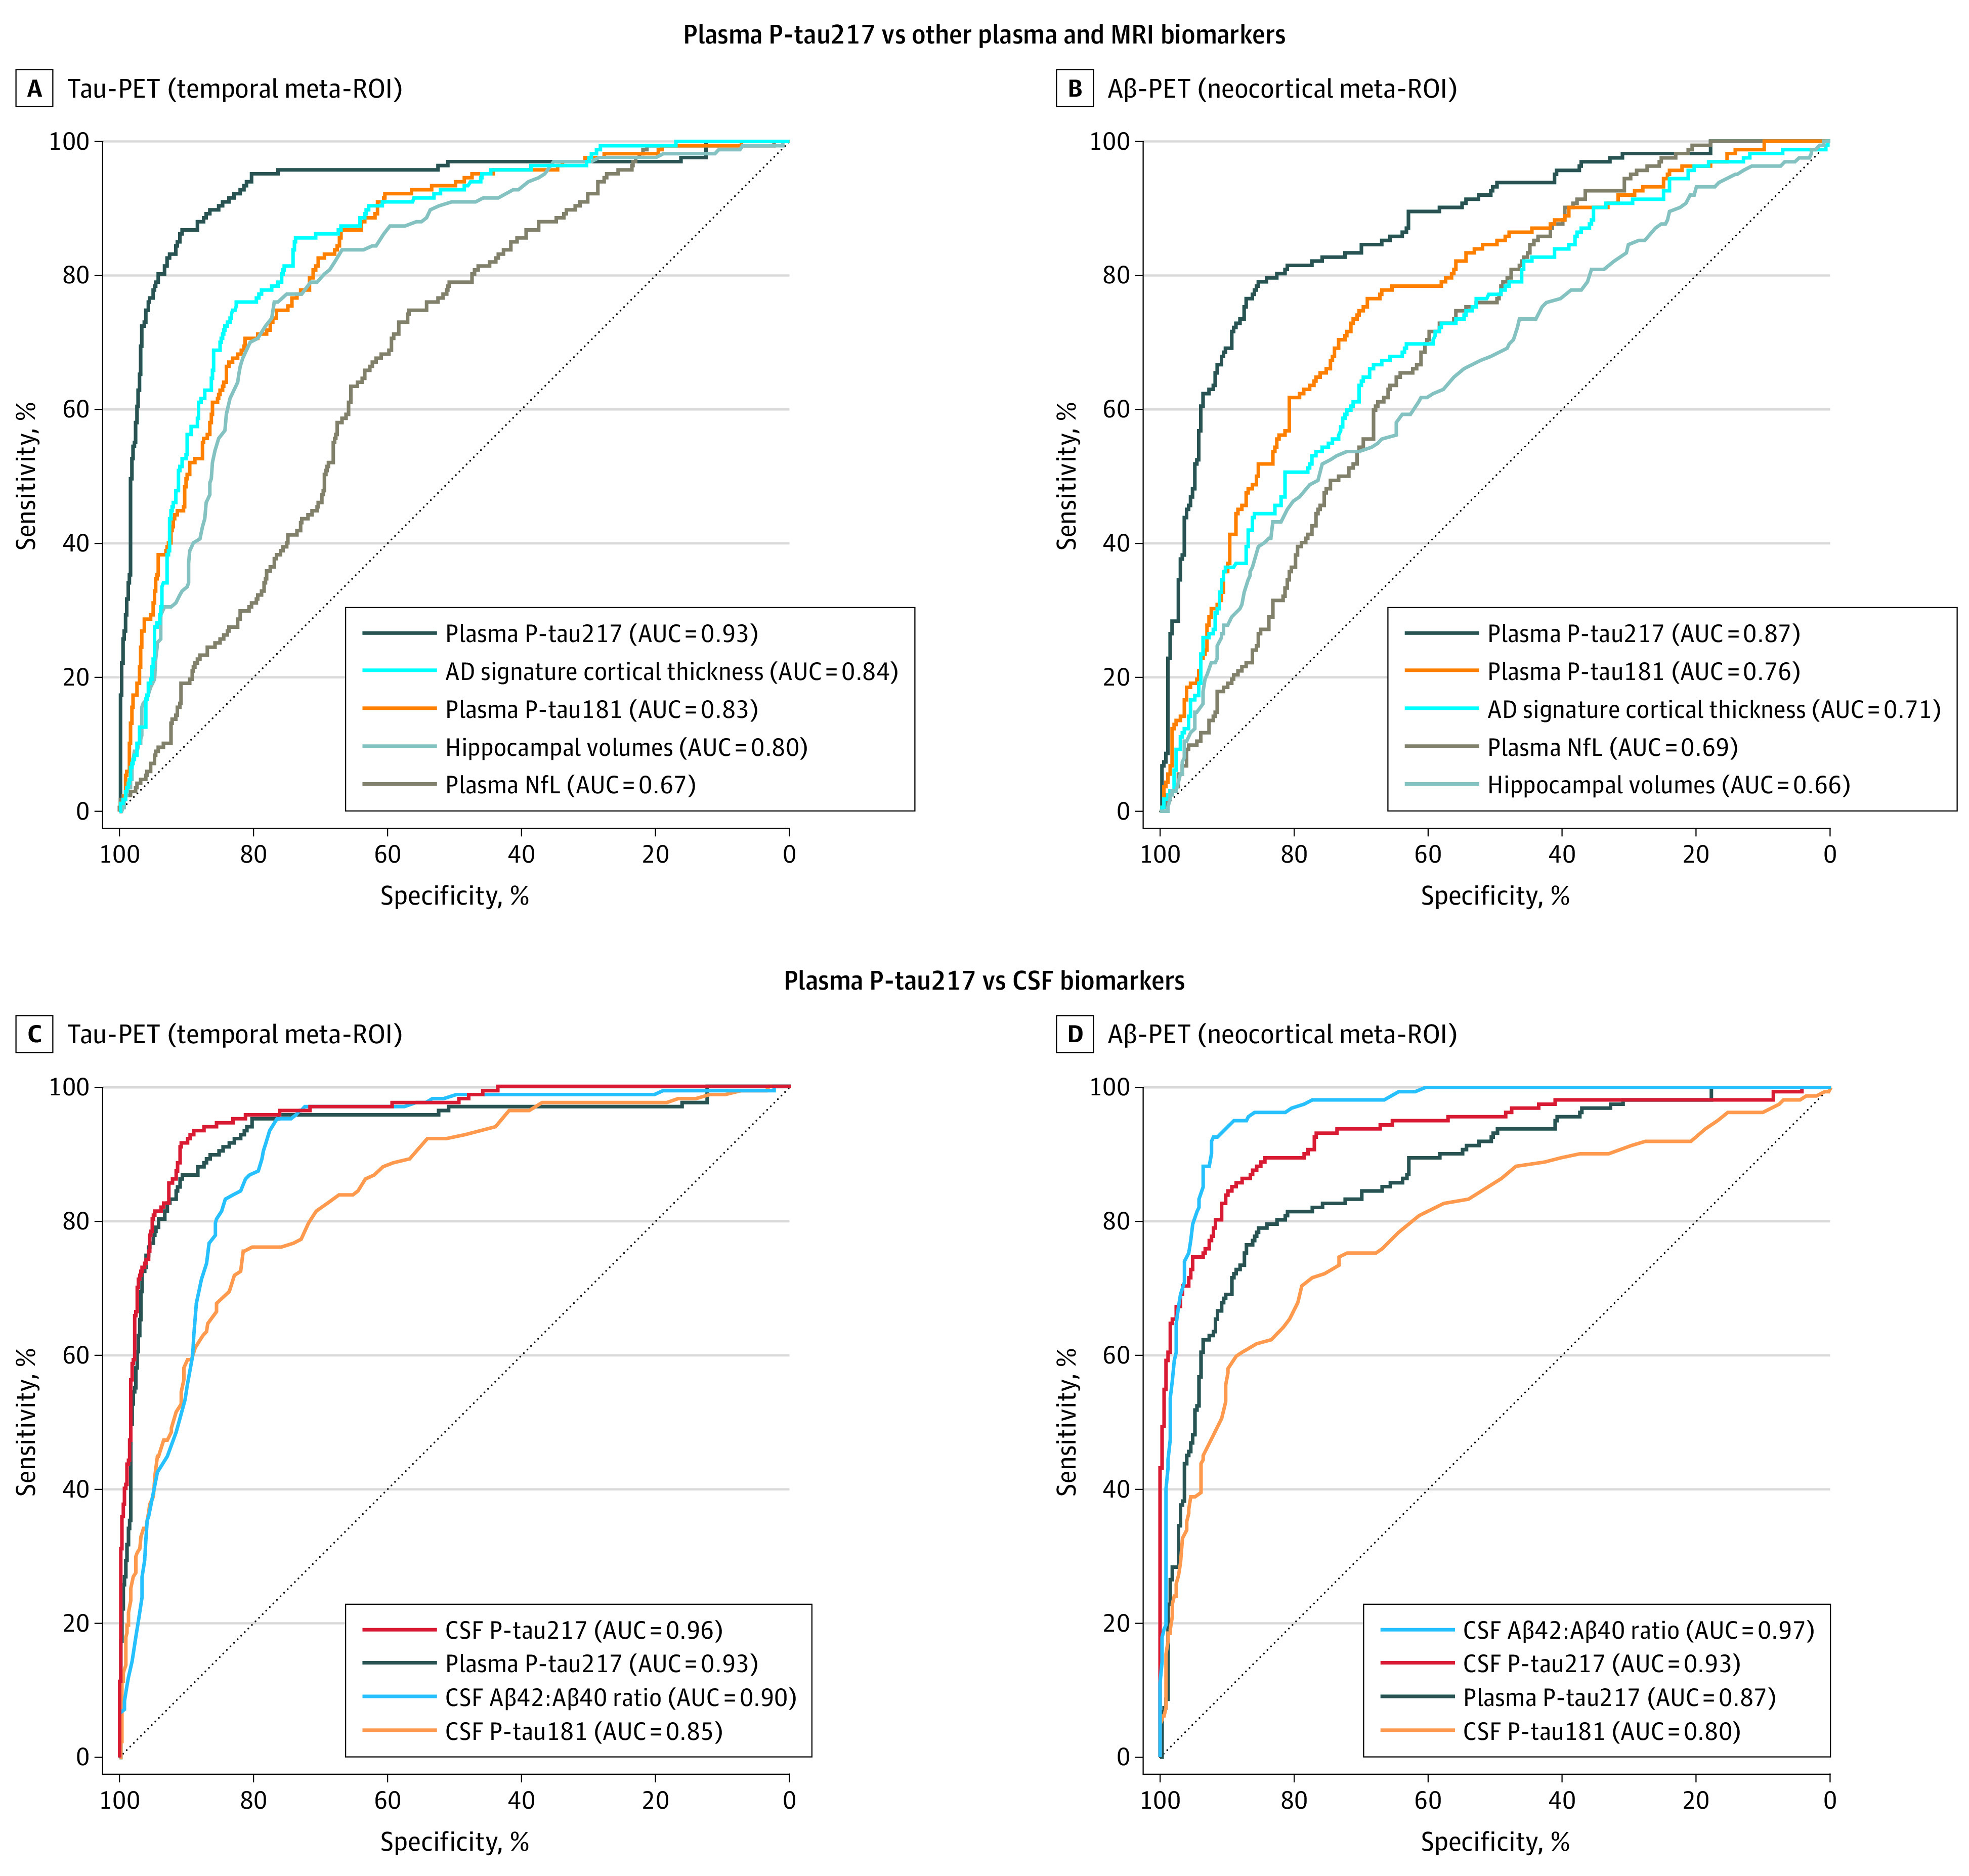
Receiver operating characteristic (ROC) curve analyses of plasma tau phosphorylated at threonine 217 (P-tau217) and other biomarkers using tau–positron emission tomography (PET) positivity in the temporal meta–region of interest (ROI) as reference standard (A and C; n = 699 [tau-PET–, n = 532; tau-PET+, n = 167]) and Aβ-PET positivity in the neocortical meta-ROI as reference standard (B and D; n = 488 [Aβ-PET–, n = 326; Aβ-PET+, n = 162]). The tau-PET and Aβ-PET cutoffs for abnormality were standardized uptake values ratio 1.36 and 0.53, respectively (eMethods in the Supplement). Plasma P-tau217 was compared with other plasma biomarkers and magnetic resonance imaging (A and B); and with cerebrospinal fluid (CSF) biomarkers (C and D). Comparisons between areas under the ROC curve (AUCs) with sensitivities and specificities are shown in eTables 17 and 18 in the Supplement. Aβ indicates β-amyloid; CSF, cerebrospinal fluid; NfL, neurofilament light chain.
Using Aβ-PET status as outcome (n = 488 [70%]), plasma P-tau217 discriminated abnormal vs normal scans (AUC, 0.87 [95% CI, 0.83 to 0.90]) significantly better than all other biomarkers (AUC range, 0.66-0.80) except CSF P-tau217 (0.93 [95% CI, 0.91 to 0.96]; ∆AUC, –0.06 [95% CI, –0.10 to –0.03]; P = .003) and CSF Aβ42:Aβ40 ratio (0.97 [95% CI, 0.95 to 0.98]; ∆AUC, –0.10 [95% CI, –0.05 to –0.14]; P < .001), which performed significantly better than plasma P-tau217 (Figure 3, panels B and D; eTable 18 in the Supplement).
Findings From the Autosomal-Dominant AD Cohort (Cohort 3)
Mean plasma P-tau217 concentrations were 1.9 pg/mL (95% CI, 1.4 to 1.8) in noncarriers, 4.5 pg/mL (95% CI, 4.1 to 5.0) in cognitively unimpaired mutation carriers, and 16.8 pg/mL (95% CI, 15.8 to 17.8) in cognitively impaired mutation carriers. Plasma P-tau217 levels increased by age in PSEN1 E280A mutation carriers, and a significant difference from noncarriers was seen at age 24.9 years (Figure 4; eFigure 7 in the Supplement), about 20 years before the mutation carriers’ median age of MCI onset.20 Plasma P-tau217 levels correlated significantly with lower Mini-Mental State Examination scores in cognitively impaired (Spearman ρ = –0.28, P = .02), but not unimpaired (Spearman ρ = –0.11; P = .16), carriers. Further, plasma P-tau217 levels correlated significantly with memory performance both in cognitively impaired (Spearman ρ = –0.34; P = .003) and unimpaired (Spearman ρ = –0.31; P < .001) mutation carriers.
Figure 4. Plasma P-tau217 and NfL Levels as a Function of Age in the Autosomal-Dominant Alzheimer Disease Kindred (Cohort 3).
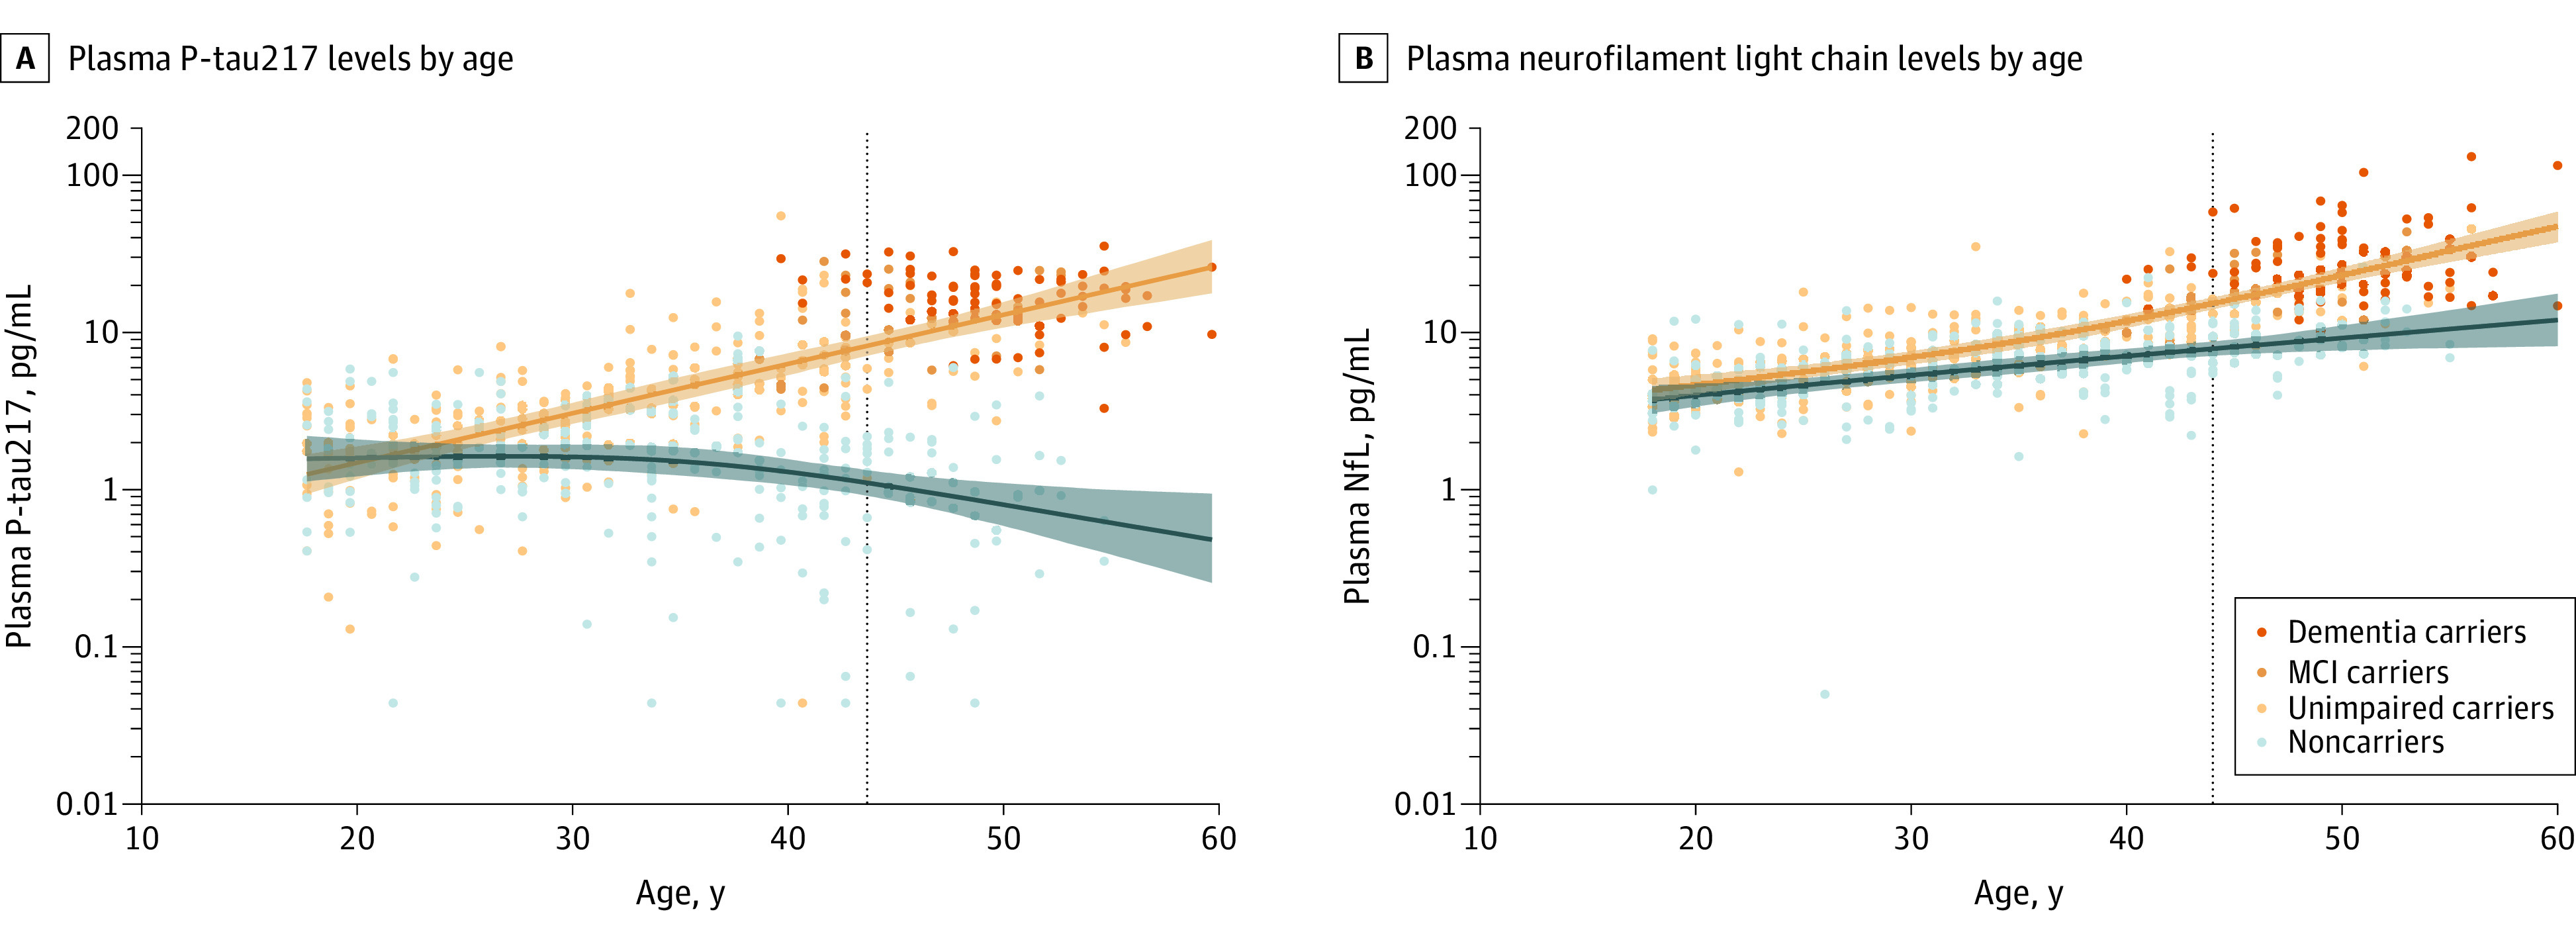
A and B, Plasma tau phosphorylated at threonine 217 (P-tau217) and neurofilament light chain (NfL) levels in PSEN1 E280A mutation carriers (orange) and noncarriers (blue) and as a function of age. Shaded areas indicate the 99% credible intervals around the spline model estimates. Vertical dotted lines indicate the median onset of mild cognitive impairment in mutation carriers (at age 44 years).20 The plasma NfL results are included for comparison with plasma P-tau217 and have partly been included in another analysis.26
Sensitivity Analyses
P-tau217 values below the lower detection limit of the assay are not thought to be attributable to measurement error or sample interference but are believed to be true low values. Nonetheless, the main analysis was repeated in all 3 cohorts excluding participants with plasma P-tau217 levels below detection (eMethods in the Supplement), which resulted in similar findings (eFigures 8-11 and eResults in the Supplement). We also investigated the potential added value of combining plasma P-tau217 with other plasma biomarkers (eTables 19 and 20 in the Supplement) or when using plasma ratios of P-tau217 to total tau (T-tau) or Aβ42 (eTables 10 and 12 in the Supplement) for discriminating AD vs non-AD in cohort 1 and cohort 2. No biomarker ratio or combination of biomarkers were significantly better than plasma P-tau217 alone.
Discussion
The main findings of this study were that plasma P-tau217 differentiated clinically diagnosed AD dementia from other neurodegenerative disorders (Figure 2, panels A-C; Table), and distinguished participants with neuropathologically defined AD from participants without diagnostic levels of AD histopathology (Figure 1; eFigure 2, panels A-C, and eTable 10 in the Supplement). Further, plasma P-tau217 had significantly higher diagnostic accuracy for clinical AD compared with plasma P-tau181, plasma NfL, and MRI measures and did not perform significantly differently compared with CSF P-tau181, CSF P-tau217, and tau-PET (eTable 12 in the Supplement). Additionally, plasma P-tau217 levels correlated with cerebral tau tangles (Figure 1) and discriminated abnormal vs normal tau-PET scans with significantly higher accuracy than plasma P-tau181, plasma NfL, CSF P-tau181, CSF Aβ42:Aβ40 ratio, and MRI measures (Figure 3, panels A and C). Plasma P-tau217 levels were significantly greater among PSEN1 mutation carriers, compared with noncarriers, from approximately age 25 years and older, which is 20 years prior to the estimated onset of MCI among mutation carriers.
The suggested advantage of using plasma P-tau217 over plasma P-tau181 is in agreement with findings comparing CSF levels of P-tau217 and P-tau181, which also show a higher discriminative accuracy of P-tau217 for AD vs other neurodegenerative diseases, tau-PET status, and Aβ-PET status.9,27 Recent studies have also suggested that CSF P-tau217 levels may change earlier than CSF P-tau181 levels in AD.28,29 Both plasma P-tau assays, however, performed well for detecting AD and significantly better than plasma T-tau and NfL as expected, given the performance of plasma T-tau30,31,32 and plasma NfL33,34,35 in previous studies. Further, the discriminative accuracy of plasma P-tau217 was not significantly different compared with using ratios to either plasma T-tau or Aβ42 (eTables 10 and 12 in the Supplement), which is probably explained by the much more altered levels of plasma P-tau217 in AD dementia vs non-AD conditions compared with the other 2 plasma biomarkers. Taken together, these results indicate that plasma P-tau217 might be useful in the differential diagnosis of patients with cognitive impairment, and future studies need to examine how this might improve case management and treatment of patients with symptomatic AD. Plasma P-tau217 might be especially useful at facilities with limited access to CSF or PET testing, such as in primary care and most memory clinics globally, including those in low- and middle-income countries, but assay development and validation in such settings are needed first.
Plasma P-tau217 levels were elevated already early in the disease process (during the presymptomatic stages) in both sporadic AD (Figure 2A; eFigure 4A in the Supplement) and in autosomal-dominant AD (Figure 4A; eFigure 7 in the Supplement). The results also supported that plasma P-tau217 might identify preclinical AD (eFigure 4, panels B and D, and eTable 14 in the Supplement). These findings suggest that plasma P-tau217 is an early marker of AD pathophysiology, which is similar to what has previously been shown for CSF P-tau, but in contrast to tau-PET, which changes mainly during the later stages of the disease.6,29,36,37 In the present study, plasma P-tau217 levels increased further during the symptomatic stages both in sporadic AD (Figure 2A; eFigure 4A and eTable 13 in the Supplement) and autosomal-dominant AD (Figure 4A; eFigure 7 in the Supplement).
Plasma P-tau217 correlated with cerebral tau pathology measured postmortem using neuropathology (Figure 1) or in life using tau-PET or CSF P-tau217 (eFigure 5 and eTable 16 in the Supplement). However, these correlations were only present in cases with evident Aβ pathology, indicating that the increase in plasma P-tau217 levels appears to be associated with Aβ pathology. The findings are in line with those from CSF studies suggesting that neurons exposed to Aβ pathology exhibit increased production and secretion of soluble tau, which occurs before increased tau-PET signal.29,38 Similarly, plasma P-tau217 levels were increased in AD but not in neurodegenerative diseases characterized by other types of cerebral tau pathology, including progressive supranuclear palsy and corticobasal syndrome (Figure 2A; eFigure 3, panels D and J in the Supplement). The specificity of P-tau217 to AD-related tau-pathology was also observed in the neuropathology cohort. Here, 91% of the participants without AD exhibited Braak stage III or greater tau pathology (eTables 3 and 8 in the Supplement), but the mean levels of plasma P-tau217 were still higher in the AD group vs this non-AD group and there was no correlation between plasma P-tau217 and tau pathology in the non-AD group (Figure 1).
Recently, tau-PET has been shown to perform very well in distinguishing AD dementia from other neurodegenerative diseases.6 In the present study, plasma P-tau217 and tau-PET did not perform significantly differently in distinguishing these groups (Figure 2C; eTable 12 in the Supplement). Further, the accuracy of plasma P-tau217 for discriminating between abnormal vs normal tau-PET scan findings was significantly higher than that of the most commonly used CSF P-tau biomarker, CSF P-tau181 (Figure 3C; eTable 17 in the Supplement). This highlights the potential use of P-tau217 as a substitute marker for tau-PET when regional cerebral tau analysis is not required.
Limitations
This study has several limitations. First, the study involved 3 selected cohorts, and the results should be validated in unselected primary care populations and ethnically more diverse populations. Second, the main analysis included participants with plasma P-tau217 concentrations too low to be accurately determined (ie, below the detection limit). However, the results were similar in a sensitivity analysis excluding these participants (eFigures 8-11 in the Supplement). Optimization of the sensitivity of the assay is currently ongoing. Third, the current assay is a research-grade assay. The next step is to develop a fully validated clinical-grade assay together with a certified reference material39 and establish universal cutoffs, before the assay can be used in clinical practice. Further, transfer of the assay to fully automated platforms may facilitate potential implementation in clinical practice worldwide. Fourth, the present design was cross-sectional, and to confirm the value of plasma P-tau217 levels as a marker of disease progression and to determine how early in the disease trajectory it starts to increase in sporadic AD, future studies should include longitudinal analyses of P-tau217. Fifth, although the group with other neurodegenerative diseases in cohort 2 was of adequate size (n = 99), the separate diagnostic groups were relatively small (n = 12-45) and the discriminative accuracy against a specific other neurodegenerative disease should be interpreted with caution. Sixth, established plasma and CSF assays were used, but discriminative differences between plasma P-tau217 and the other fluid biomarkers may to some degree depend on the assay design and platform used.
Conclusions
Among 1402 participants from 3 selected cohorts, plasma P-tau217 discriminated AD from other neurodegenerative diseases, with significantly higher accuracy than established plasma- and MRI-based biomarkers, and its performance was not significantly different from key CSF- or PET-based measures. Further research is needed to optimize the assay, validate the findings in unselected and diverse populations, and determine its potential role in clinical care.
eMethods
eResults
eFigures 1-11
eTables 1-20
eReferences
References
- 1.Brookmeyer R, Johnson E, Ziegler-Graham K, Arrighi HM. Forecasting the global burden of Alzheimer’s disease. Alzheimers Dement. 2007;3(3):186-191. doi: 10.1016/j.jalz.2007.04.381 [DOI] [PubMed] [Google Scholar]
- 2.Global Action Plan on the Public Health Response to Dementia 2017-2025. World Health Organization; 2017. [Google Scholar]
- 3.Abbasi J. Promising results in 18-month analysis of Alzheimer drug candidate. JAMA. 2018;320(10):965. doi: 10.1001/jama.2018.13027 [DOI] [PubMed] [Google Scholar]
- 4.Sevigny J, Chiao P, Bussière T, et al. The antibody aducanumab reduces Aβ plaques in Alzheimer’s disease. Nature. 2016;537(7618):50-56. doi: 10.1038/nature19323 [DOI] [PubMed] [Google Scholar]
- 5.Rabinovici GD, Gatsonis C, Apgar C, et al. Association of amyloid positron emission tomography with subsequent change in clinical management among Medicare beneficiaries with mild cognitive impairment or dementia. JAMA. 2019;321(13):1286-1294. doi: 10.1001/jama.2019.2000 [DOI] [PMC free article] [PubMed] [Google Scholar]
- 6.Ossenkoppele R, Rabinovici GD, Smith R, et al. Discriminative accuracy of [18F]flortaucipir positron emission tomography for Alzheimer disease vs other neurodegenerative disorders. JAMA. 2018;320(11):1151-1162. doi: 10.1001/jama.2018.12917 [DOI] [PMC free article] [PubMed] [Google Scholar]
- 7.Mattsson N, Zetterberg H, Hansson O, et al. CSF biomarkers and incipient Alzheimer disease in patients with mild cognitive impairment. JAMA. 2009;302(4):385-393. doi: 10.1001/jama.2009.1064 [DOI] [PubMed] [Google Scholar]
- 8.Jack CR Jr, Bennett DA, Blennow K, et al. NIA-AA research framework: toward a biological definition of Alzheimer’s disease. Alzheimers Dement. 2018;14(4):535-562. doi: 10.1016/j.jalz.2018.02.018 [DOI] [PMC free article] [PubMed] [Google Scholar]
- 9.Janelidze S, Stomrud E, Smith R, et al. Cerebrospinal fluid p-tau217 performs better than p-tau181 as a biomarker of Alzheimer’s disease. Nat Commun. 2020;11(1):1683. doi: 10.1038/s41467-020-15436-0 [DOI] [PMC free article] [PubMed] [Google Scholar]
- 10.Duits FH, Martinez-Lage P, Paquet C, et al. Performance and complications of lumbar puncture in memory clinics: results of the multicenter lumbar puncture feasibility study. Alzheimers Dement. 2016;12(2):154-163. doi: 10.1016/j.jalz.2015.08.003 [DOI] [PubMed] [Google Scholar]
- 11.Ovod V, Ramsey KN, Mawuenyega KG, et al. Amyloid β concentrations and stable isotope labeling kinetics of human plasma specific to central nervous system amyloidosis. Alzheimers Dement. 2017;13(8):841-849. doi: 10.1016/j.jalz.2017.06.2266 [DOI] [PMC free article] [PubMed] [Google Scholar]
- 12.Palmqvist S, Janelidze S, Stomrud E, et al. Performance of fully automated plasma assays as screening tests for Alzheimer disease–related β-amyloid status. JAMA Neurol. 2019;76(9):1060-1069. doi: 10.1001/jamaneurol.2019.1632 [DOI] [PMC free article] [PubMed] [Google Scholar]
- 13.Janelidze S, Mattsson N, Palmqvist S, et al. Plasma P-tau181 in Alzheimer’s disease: relationship to other biomarkers, differential diagnosis, neuropathology and longitudinal progression to Alzheimer’s dementia. Nat Med. 2020;26(3):379-386. doi: 10.1038/s41591-020-0755-1 [DOI] [PubMed] [Google Scholar]
- 14.Thijssen EH, La Joie R, Wolf A, et al. ; Advancing Research and Treatment for Frontotemporal Lobar Degeneration (ARTFL) Investigators . Diagnostic value of plasma phosphorylated tau181 in Alzheimer’s disease and frontotemporal lobar degeneration. Nat Med. 2020;26(3):387-397. doi: 10.1038/s41591-020-0762-2 [DOI] [PMC free article] [PubMed] [Google Scholar]
- 15.Beach TG, Adler CH, Sue LI, et al. Arizona study of aging and neurodegenerative disorders and brain and body donation program. Neuropathology. 2015;35(4):354-389. doi: 10.1111/neup.12189 [DOI] [PMC free article] [PubMed] [Google Scholar]
- 16.National Institute on Aging and Reagan Institute Working Group on Diagnostic Criteria for the Neuropathological Assessment of Alzheimer’s Disease Consensus recommendations for the postmortem diagnosis of Alzheimer’s disease. Neurobiol Aging. 1997;18(4)(suppl):S1-S2. [PubMed] [Google Scholar]
- 17.Mirra SS, Heyman A, McKeel D, et al. The Consortium to Establish a Registry for Alzheimer’s Disease (CERAD), II: standardization of the neuropathologic assessment of Alzheimer’s disease. Neurology. 1991;41(4):479-486. doi: 10.1212/WNL.41.4.479 [DOI] [PubMed] [Google Scholar]
- 18.Braak H, Braak E. Neuropathological stageing of Alzheimer-related changes. Acta Neuropathol. 1991;82(4):239-259. doi: 10.1007/BF00308809 [DOI] [PubMed] [Google Scholar]
- 19.Diagnostic and Statistical Manual of Mental Disorders (Fifth Edition). American Psychiatric Association; 2013. [Google Scholar]
- 20.Tariot PN, Lopera F, Langbaum JB, et al. ; Alzheimer’s Prevention Initiative . The Alzheimer’s Prevention Initiative Autosomal-Dominant Alzheimer’s Disease Trial: a study of crenezumab versus placebo in preclinical PSEN1 E280A mutation carriers to evaluate efficacy and safety in the treatment of autosomal-dominant Alzheimer’s disease, including a placebo-treated noncarrier cohort. Alzheimers Dement (N Y). 2018;4:150-160. [DOI] [PMC free article] [PubMed] [Google Scholar]
- 21.Morris JC, Heyman A, Mohs RC, et al. The Consortium to Establish a Registry for Alzheimer’s Disease (CERAD), I: clinical and neuropsychological assessment of Alzheimer’s disease. Neurology. 1989;39(9):1159-1165. doi: 10.1212/WNL.39.9.1159 [DOI] [PubMed] [Google Scholar]
- 22.Palmqvist S, Insel PS, Stomrud E, et al. Cerebrospinal fluid and plasma biomarker trajectories with increasing amyloid deposition in Alzheimer’s disease. EMBO Mol Med. 2019;11(12):e11170. doi: 10.15252/emmm.201911170 [DOI] [PMC free article] [PubMed] [Google Scholar]
- 23.Mielke MM, Hagen CE, Xu J, et al. Plasma phospho-tau181 increases with Alzheimer’s disease clinical severity and is associated with tau- and amyloid-positron emission tomography. Alzheimers Dement. 2018;14(8):989-997. doi: 10.1016/j.jalz.2018.02.013 [DOI] [PMC free article] [PubMed] [Google Scholar]
- 24.Leuzy A, Smith R, Ossenkoppele R, et al. Diagnostic performance of RO948 F 18 tau positron emission tomography in the differentiation of Alzheimer disease from other neurodegenerative disorders. JAMA Neurol. Published online May 11, 2020. doi: 10.1001/jamaneurol.2020.0989 [DOI] [PMC free article] [PubMed] [Google Scholar]
- 25.DeLong ER, DeLong DM, Clarke-Pearson DL. Comparing the areas under two or more correlated receiver operating characteristic curves: a nonparametric approach. Biometrics. 1988;44(3):837-845. doi: 10.2307/2531595 [DOI] [PubMed] [Google Scholar]
- 26.Quiroz YT, Zetterberg H, Reiman EM, et al. Plasma neurofilament light chain in the presenilin 1 E280A autosomal dominant Alzheimer’s disease kindred: a cross-sectional and longitudinal cohort study. Lancet Neurol. 2020;19(6):513-521. doi: 10.1016/S1474-4422(20)30137-X [DOI] [PMC free article] [PubMed] [Google Scholar]
- 27.Barthélemy NR, Bateman RJ, Hirtz C, et al. Cerebrospinal fluid phospho-tau T217 outperforms T181 as a biomarker for the differential diagnosis of Alzheimer’s disease and PET amyloid-positive patient identification. Alzheimers Res Ther. 2020;12(1):26. doi: 10.1186/s13195-020-00596-4 [DOI] [PMC free article] [PubMed] [Google Scholar]
- 28.Barthélemy NR, Li Y, Joseph-Mathurin N, et al. ; Dominantly Inherited Alzheimer Network . A soluble phosphorylated tau signature links tau, amyloid and the evolution of stages of dominantly inherited Alzheimer’s disease. Nat Med. 2020;26(3):398-407. doi: 10.1038/s41591-020-0781-z [DOI] [PMC free article] [PubMed] [Google Scholar]
- 29.Mattsson-Carlgren N, Andersson E, Janelidze S, et al. Aβ deposition is associated with increases in soluble and phosphorylated tau that precede a positive tau PET in Alzheimer’s disease. Sci Adv. 2020;6(16):eaaz2387. doi: 10.1126/sciadv.aaz2387 [DOI] [PMC free article] [PubMed] [Google Scholar]
- 30.Mattsson N, Zetterberg H, Janelidze S, et al. ; Alzheimer’s Disease Neuroimaging Initiative Investigators . Plasma tau in Alzheimer disease. Neurology. 2016;87(17):1827-1835. doi: 10.1212/WNL.0000000000003246 [DOI] [PMC free article] [PubMed] [Google Scholar]
- 31.Palmqvist S, Insel PS, Zetterberg H, et al. ; Alzheimer’s Disease Neuroimaging Initiative; Swedish BioFINDER study . Accurate risk estimation of β-amyloid positivity to identify prodromal Alzheimer’s disease: cross-validation study of practical algorithms. Alzheimers Dement. 2019;15(2):194-204. doi: 10.1016/j.jalz.2018.08.014 [DOI] [PMC free article] [PubMed] [Google Scholar]
- 32.Zetterberg H, Wilson D, Andreasson U, et al. Plasma tau levels in Alzheimer’s disease. Alzheimers Res Ther. 2013;5(2):9. doi: 10.1186/alzrt163 [DOI] [PMC free article] [PubMed] [Google Scholar]
- 33.Chatterjee P, Goozee K, Sohrabi HR, et al. Association of plasma neurofilament light chain with neocortical amyloid-β load and cognitive performance in cognitively normal elderly participants. J Alzheimers Dis. 2018;63(2):479-487. doi: 10.3233/JAD-180025 [DOI] [PubMed] [Google Scholar]
- 34.Mattsson N, Andreasson U, Zetterberg H, Blennow K; Alzheimer’s Disease Neuroimaging Intiative . Association of plasma neurofilament light with neurodegeneration in patients with Alzheimer disease. JAMA Neurol. 2017;74(5):557-566. doi: 10.1001/jamaneurol.2016.6117 [DOI] [PMC free article] [PubMed] [Google Scholar]
- 35.Zhou W, Zhang J, Ye F, et al. ; Alzheimer’s Disease Neuroimaging Initiative . Plasma neurofilament light chain levels in Alzheimer’s disease. Neurosci Lett. 2017;650:60-64. doi: 10.1016/j.neulet.2017.04.027 [DOI] [PubMed] [Google Scholar]
- 36.Gordon BA, Blazey TM, Christensen J, et al. Tau PET in autosomal dominant Alzheimer’s disease: relationship with cognition, dementia and other biomarkers. Brain. 2019;142(4):1063-1076. doi: 10.1093/brain/awz019 [DOI] [PMC free article] [PubMed] [Google Scholar]
- 37.Quiroz YT, Sperling RA, Norton DJ, et al. Association between amyloid and tau accumulation in young adults with autosomal dominant Alzheimer disease. JAMA Neurol. 2018;75(5):548-556. doi: 10.1001/jamaneurol.2017.4907 [DOI] [PMC free article] [PubMed] [Google Scholar]
- 38.Sato C, Barthelemy NR, Mawuenyega KG, et al. Tau kinetics in neurons and the human central nervous system. Neuron. 2018;97(6):1284-1298. [DOI] [PMC free article] [PubMed] [Google Scholar]
- 39.Kuhlmann J, Andreasson U, Pannee J, et al. ; IFCC Working Group on Standardization of CSF proteins (WG-CSF) . CSF Aβ1-42—an excellent but complicated Alzheimer’s biomarker—a route to standardisation. Clin Chim Acta. 2017;467:27-33. doi: 10.1016/j.cca.2016.05.014 [DOI] [PubMed] [Google Scholar]
Associated Data
This section collects any data citations, data availability statements, or supplementary materials included in this article.
Supplementary Materials
eMethods
eResults
eFigures 1-11
eTables 1-20
eReferences