

Summary:
Evidence suggests interplay among the three major risk factors for Alzheimer’s disease (AD): age, APOE genotype, and sex. Here, we present comprehensive datasets and analyses of brain transcriptomes and blood metabolomes from human apoE2, apoE3 and apoE4-targeted replacement mice across young, middle, and old ages with both sexes. We found that age had the greatest impact on brain transcriptomes highlighted by an immune module led by Trem2 and Tyrobp, whereas APOE4 was associated with upregulation of multiple Serpina3 genes. Importantly, these networks and gene expression changes were mostly conserved in human brains. Finally, we observed a significant interaction between age, APOE genotype, and sex on unfolded protein response pathway. In the periphery, APOE2 drove distinct blood metabolome profile highlighted by the upregulation of lipid metabolites. Our work identifies unique and interactive molecular pathways underlying AD risk factors providing valuable resources for discovery and validation research in model systems and humans.
Keywords: APOE, age, sex, transcriptomics, metabolomics, inflammation, Trem2, extracellular vesicles, Serpina3, lipid metabolism, Alzheimer’s disease
Graphical Abstract
eTOC Blurb:
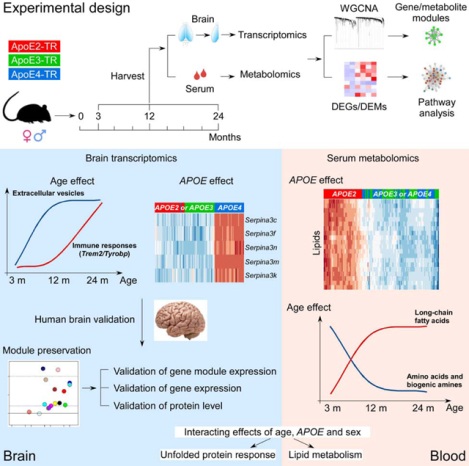
Zhao et al. present comprehensive datasets and analyses of brain transcriptomes and blood metabolomes from human apoE2-, apoE3- and apoE4-targeted replacement mice across young, middle, and old ages with both sexes. The study provides critical insight on the molecular pathways underlying three major Alzheimer’s risk factors age, APOE, and sex.
Introduction
Alzheimer’s disease (AD) is a devastating neurodegenerative disorder characterized by the extracellular deposition of amyloid-β (Aβ) as senile plaques and intracellular accumulation of pathological tau as neurofibrillary tangles in the brain (Blennow et al., 2006). Although the cause of sporadic AD is likely multifactorial, age is the greatest risk factor wherein 3% of people between the ages of 65–74, 17% of people between ages 75–84, and 32% of people aged 85 or older have AD (Brookmeyer et al., 1998; Hebert et al., 2013). The aging brain undergoes functional decline likely driven by decreased synaptic density and functions, and is associated with inflammation induced by the reactive glial cells including astrocytes (Boisvert et al., 2018) and microglia (Kang et al., 2018; Sala Frigerio et al., 2019); however, the exact comprehension of the molecular pathways underlying the link between aging and AD is still vague. In addition to age, it is well-documented that the apolipoprotein E (APOE) genotype (Bu, 2009; Yamazaki et al., 2019; Zhao et al., 2018a) and sex (Damoiseaux et al., 2012; Payami et al., 1994) substantially impacts the disease onset and development. The APOE4 gene allele is the strongest genetic risk factor for late-onset AD, whereas APOE2 is protective compared to the common APOE3 allele (Bu, 2009; Farrer et al., 1997). Carrying one copy of APOE4 increases the AD risk by 3–4 fold, and two copies by 10–15 fold compared to those carrying two copies of APOE3 (Holtzman et al., 2012; Loy et al., 2014; Michaelson, 2014). Indeed, around 65% of all AD patients have at least one copy of the APOE4 allele (Mayeux et al., 1998). Multiple Aβdependent and Aβ-independent mechanisms are likely involved in the risk determining effect of APOE polymorphism from human or mouse studies (Kanekiyo et al., 2014; Liu et al., 2017; Shinohara et al., 2016). Furthermore, epidemiological studies have demonstrated that women disproportionately suffer from dementia including AD, particularly in the elderly (Hebert et al., 2013; Mazure and Swendsen, 2016) and APOE4 carriers (Altmann et al., 2014; Farrer et al., 1997; Neu et al., 2017). Collectively, these emerging lines of evidence suggest that age, APOE genotype, and sex independently and/or interactively affect the pathogenesis of AD. Investigating the molecular pathways impacted by these factors is of paramount importance to developing therapeutic strategies for AD.
Heterogeneity in humans due to genetic diversity and the impact of environmental and life style differences limits the molecular study of disease mechanisms. Therefore, mouse models offer opportunities to study the effects of disease-related risk factors in a relatively pure genetic background within a controlled environment. In this study, we comprehensively profiled the brain transcriptomes and serum metabolomes of human apoE-targeted replacement (TR) mice, in which the murine Apoe gene locus is replaced with human APOE2, APOE3, or APOE4 gene (Sullivan et al., 1997), at different ages and in both sexes. These apoE-TR animal models have been extensively used to assess the role of apoE isoforms in brain homeostasis and aging (Zhao et al., 2017a) or pathogenesis of amyloid (Hu et al., 2015; Tachibana et al., 2019), tau (Shi et al., 2017; Zhao et al., 2018b), and α-synuclein (Davis et al., 2020; Zhao et al., 2020). To ensure availability of our transcriptomics and metabolomics datasets for widespread utilization, we established a user-friendly website (http://www.gbulab.com/). Additionally, all datasets described in this study are available to the research community through the Accelerating Medicines Partnership in Alzheimer’s Disease (AMP-AD) Knowledge Portal (https://ampadportal.org). Guided by these datasets, we identified promising candidates of genes, metabolites, gene/metabolite co-expression networks/modules, and molecular pathways influenced by age, APOE genotype, and sex.
Results
Profiling strategies of brain and serum samples from mouse models with different APOE genotype, age, and sex
We analyzed the cerebral cortex transcriptomics and serum metabolomics in male and female apoE2-TR, apoE3-TR and apoE4-TR mice at 3, 12 and 24 months of age (Experimental design in graphical abstract). In total, our analyses included 18 different experimental conditions (n = 7–8 mice per condition) for both transcriptomics and metabolomics. We first investigated how APOE genotype, age, sex and their interactions contributed to the variation in the transcriptomics and metabolomics profiles. Interestingly, age was the strongest factor for the brain transcriptomes (Figure 1A), whereas APOE genotype had the greatest influence on the serum metabolomes (Figure 1C). Consistent with the source of variation analyses, principal component analyses (PCA) revealed a clear separation of the brain samples of young age cohort (3 months) from those of middle age (12 months) and old age (24 months) cohorts (Figure 1B). Although the separation between male and female was also clear by PCA, the distinguished pattern disappeared after removing the sex chromosome genes (Figure S1). Among the serum samples, a clear separation was observed between the apoE2-TR mice and other apoE-TR mice (Figure 1D).
Figure 1: Global characterization of brain transcriptome and serum metabolome profiles of apoE-target replacement (TR) mice.
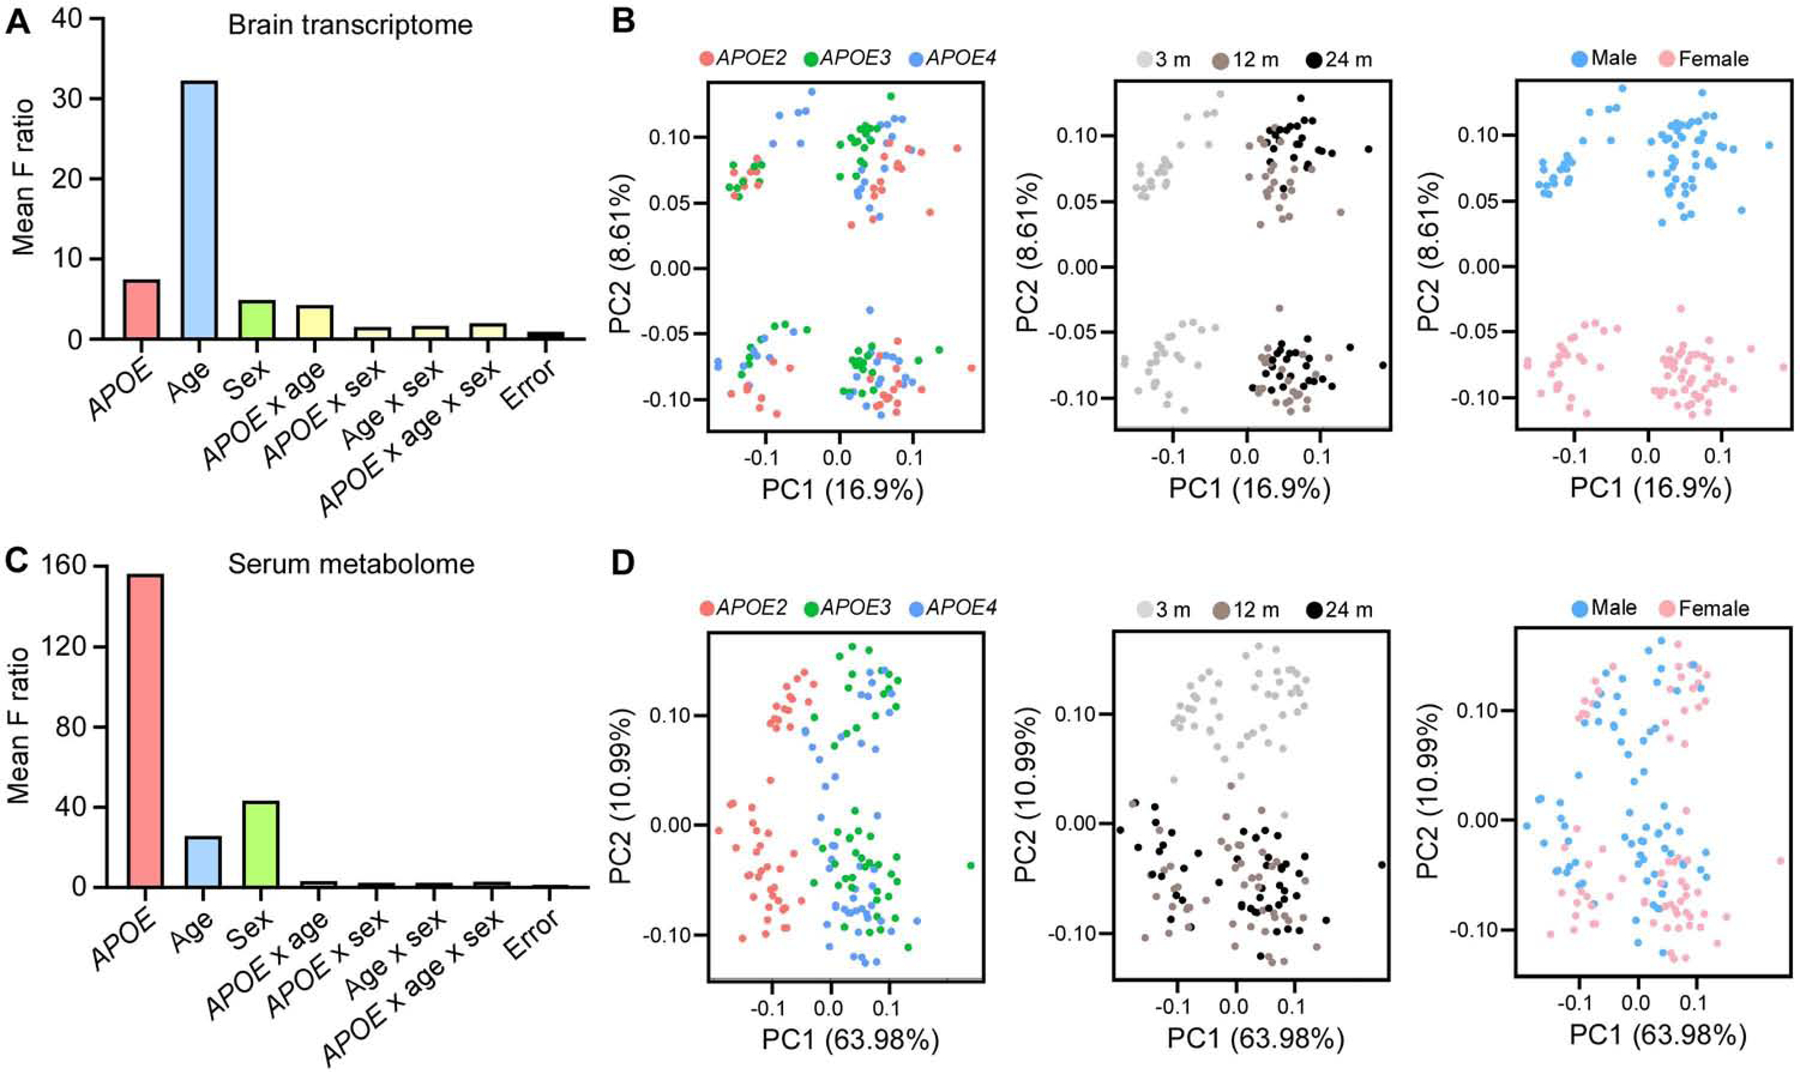
(A and C) The effects of APOE genotype, age, sex and their interactions on the variation of brain gene expression (A) and serum metabolite expression (C) in the study cohort (n = 7–8 mice/genotype/age/sex). (B and D) Sample-to-sample variation among brain transcriptomes (B) and serum metabolomes (D) revealed by principal component analysis (PCA). Each circle represents a sample, colored by APOE, age and sex, respectively.
Identification of gene modules associated with APOE genotype, age, and sex in the mouse brain
Next we identified the brain transcriptional signatures affected by APOE genotype, age, and sex. To place gene expression changes in a systems-level framework, we performed a weighted gene co-expression network analysis (WGCNA) (Langfelder and Horvath, 2008; Zhang and Horvath, 2005) on the brain transcriptomes. We identified 16 co-expression modules (Figure 2A, Table S1). Four modules were significantly correlated with APOE genotype, including lightcyan, tan, cyan, and yellow (P < 0.01) (Figure 2A). Among the four modules, two were upregulated (lightcyan and tan) and two were downregulated (cyan and yellow) in APOE4 genotype compared to APOE2 or APOE3 genotype (Figure 2A). Ten modules were significantly correlated with age, including eight upregulated (blue, pink, brown, tan, black, magenta, green, and greenyellow) and two downregulated modules (turquoise and red) (Figure 2A). One module, magenta, was significantly correlated with sex, and was upregulated in females compared to males (Figure 2A). Further network analysis of the eigengene and traits revealed strong correlations between the lighcyan module and APOE genotype; among the blue, pink modules and age; and between the black and brown modules (eigengene correlation of at least 0.5, Figure 2B–C).
Figure 2: Impact of APOE genotype, age and sex on gene co-expression networks of the mouse brain transcriptomes.
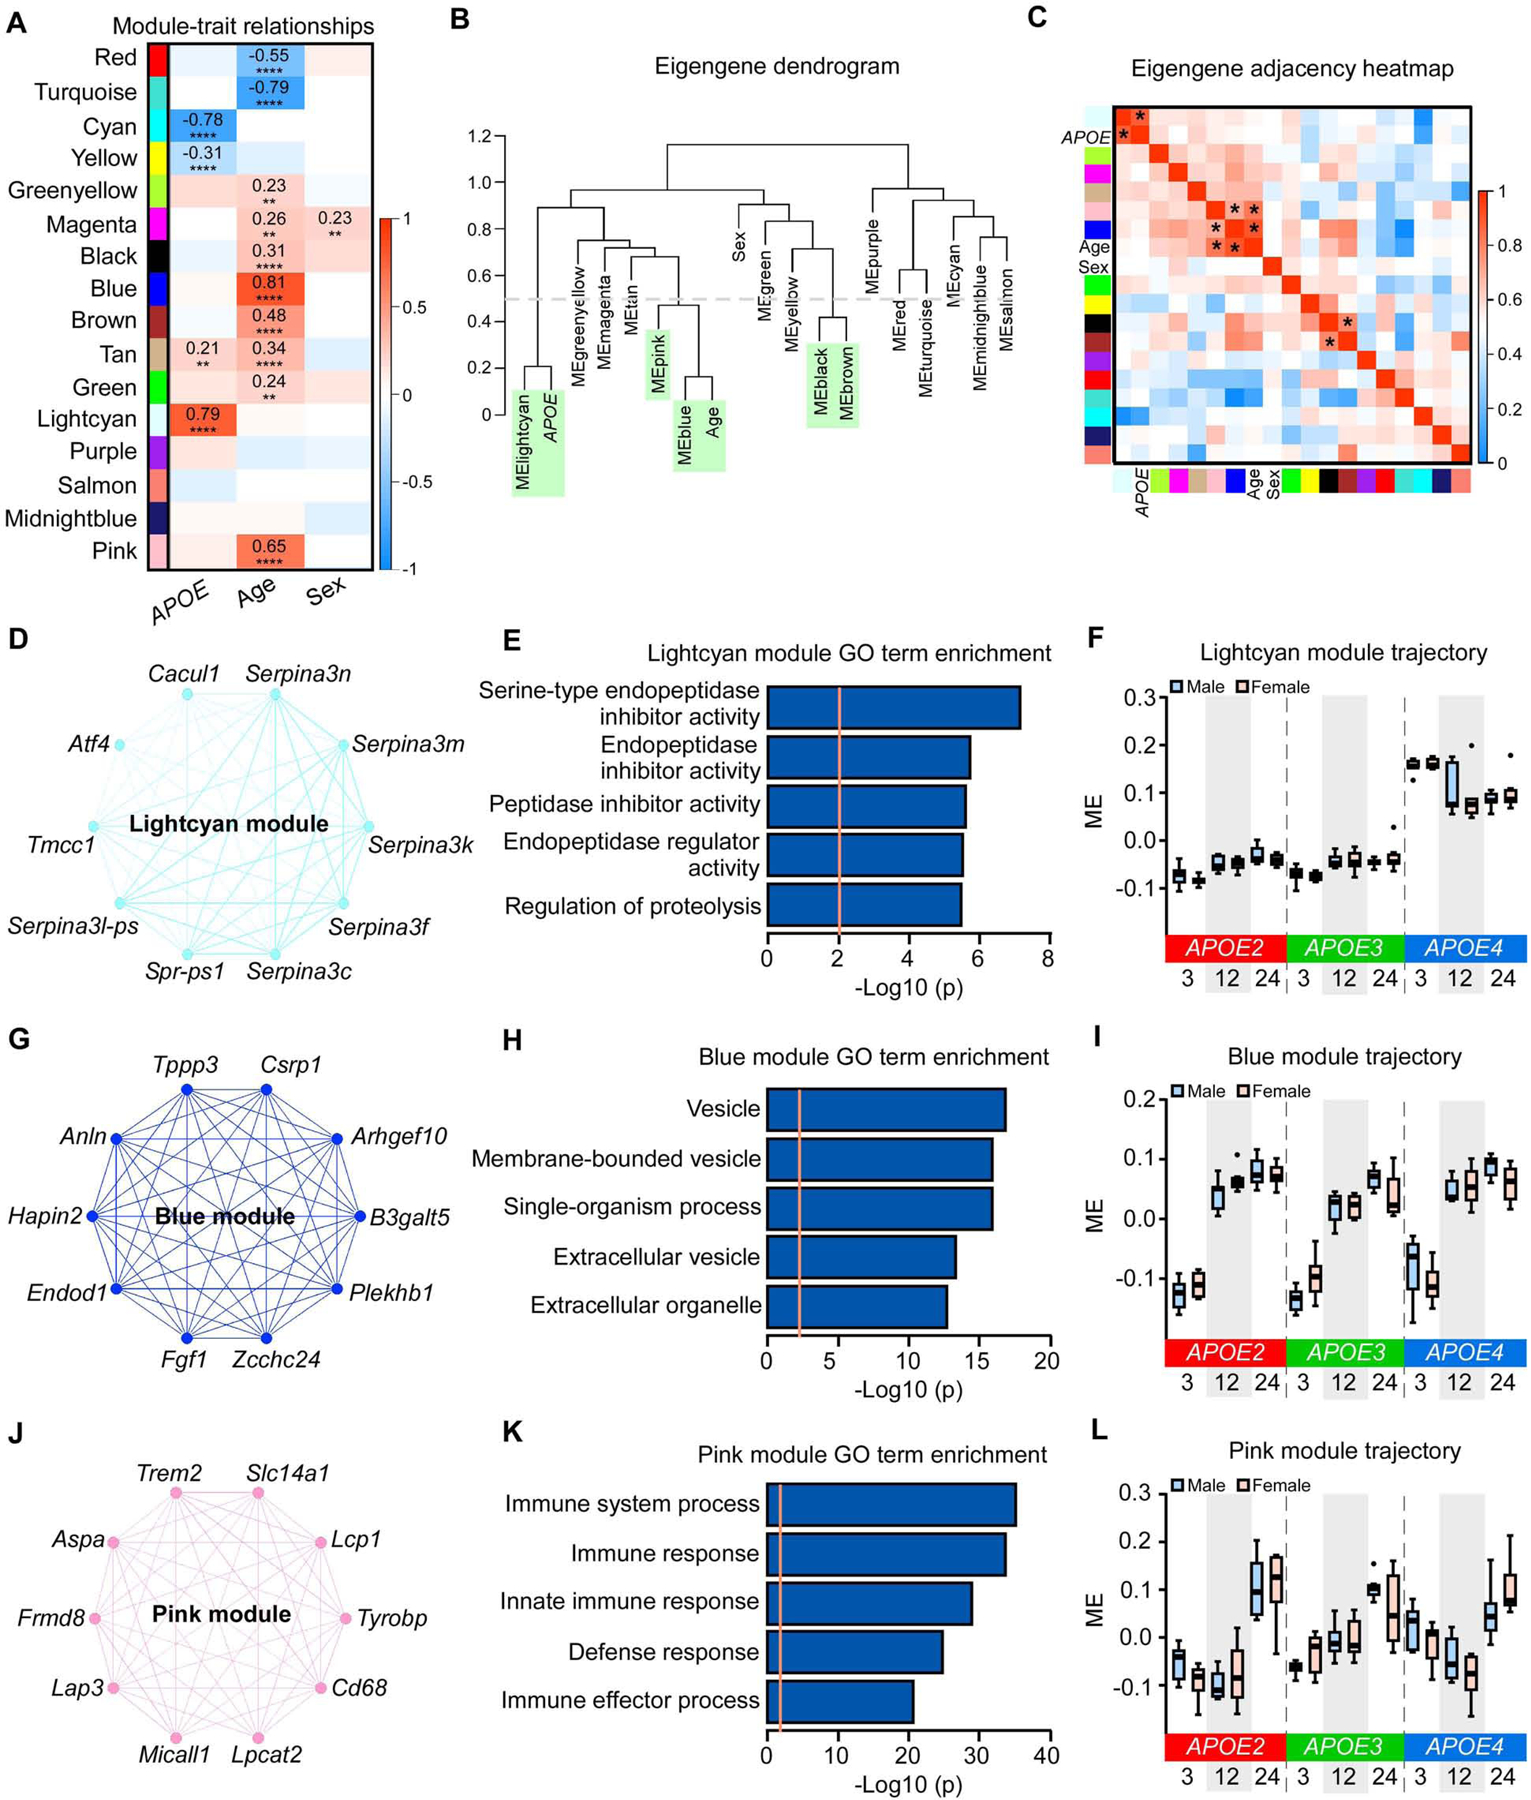
(A) The correlation between module eigengenes (MEs) and APOE genotype, age, and sex. The values in the heatmap are Pearson’s correlation coefficients. Stars represent significant correlations: **p < 0.01; ****p < 0.0001. Modules with positive values (orange) indicate positive correlation of MEs with APOE4 genotype, older age, or female; modules with negative values (blue) indicate negative correlation of MEs with these traits. (B) The ME network representing the relationships between modules and between modules and APOE genotype, age and sex. The y axis shows the dissimilarity of eigengenes. Modules and traits with dissimilarity score < 0.5 (grey dotted line, green shadow) are considered to be tightly correlated. (C) Heatmap of the eigengene adjacency matrix. Each row and column corresponds to one eigengene (labeled by module color) or a trait of interest. Within the heatmap, orange indicates positive correlation and blue indicates negative correlation. * indicates the correlation coefficient is above 0.5. (D, G, and J) Network plots of the top 10 genes with the highest intramodular connectivity (hub genes) in the lightcyan (D), blue (G), and pink (J) modules. (E, H, and K) The top 5 Gene Ontology (GO) terms enriched by 35 module genes in lightcyan module (E), 2628 module genes in the blue module (H), and 308 module genes in the pink module (K). The orange dotted line indicates the threshold of p = 0.01. (F, I, and L) MEs in the lightcyan (F), blue (I), and pink (L) modules across different APOE genotypes (APOE2, APOE3, and APOE4), ages (3, 12, and 24 months), and sexes (male and female). The upper and lower lines in the boxplots represent the maximum and minimum values after Tukey’s test. The center line represents the median. N = 7–8 mice/genotype/age/sex.
To better understand the modules associated with the APOE genotype, we performed functional annotation of these modules and identified the top 10 intramodular hub genes in each module. The top 10 hub genes in the lightcyan module were mainly from the Serpina3 gene family, including Serpina3c, Serpina3f, Serpina3k, Serpina3l-ps, Serpina3m, and Serpina3n (Figure 2D). Genes in this module were enriched for the regulation of endopeptidase inhibitor activity (Figure 2E). The module eigengene (ME) of the lightcyan module was upregulated in APOE4 compared to the APOE2 or APOE3 genotype (Figure 2F). Additionally, the cyan module, enriched for lysosome and purine deoxyribonucleoside monophosphate metabolic processes, was significantly downregulated in the APOE4 genotype (Figure S2A–C). The yellow and tan modules, enriched for RNA splicing and ribosome, respectively, were slightly upregulated in APOE4 genotype (Figure S2D–F; Figure S3D–F).
We further examined modules associated with aging. The blue module, significantly correlated with age, was upregulated at 12 and 24 months compared to 3 months (Figure 2I). Genes in this module were enriched for processes relating to extracellular vesicles (EVs) (Figure 2H). The top hub genes in this module are known to be detected in EVs, including Anln, Arhgef10, B3galt5, Csrp1, Endod1, Plekhb1, and Zcchc24 (Pathan et al., 2019) (Figure 2G). Furthermore, the pink module was also significantly correlated with aging, which was upregulated at 24 months compared to 3 and 12 months (Figure 2L). Genes in this module were enriched for immune response (Figure 2K), with top hub genes including Trem2, Tyrobp, and Cd68 (Figure 2J), all of which are involved in microglial functions and immune responses in the brain (Keren-Shaul et al., 2017; Ulland and Colonna, 2018). The turquoise and red modules, enriched for respiration chain and synaptic transmission, respectively, were significantly downregulated after 12 months of age (Figure S4A–F). The profiles of brown, tan, black, green, greenyellow, and magenta modules slightly increased with aging, and were enriched for amine biosynthetic process, ribosome, protein targeting to vacuole, intracellular membrane bounded organelle, EVs, and neurological system process, respectively (Figure S3A–R). The magenta module was also slightly elevated in female mice (Figure S3P–R).
To validate the top gene and pathway that were dysregulated by APOE4, we performed qPCR experiments to detect the expression of Serpina3n, which is the mouse orthologue of the human SERPINA3 gene (Horvath et al., 2005). We found significantly elevated Serpina3n mRNA levels in APOE4 mice at 3, 12, and 24 months of age (Figure 3A), consistent with the RNAseq results. The effect of APOE4 on elevating brain Serpina3n level was further confirmed by using in situ hybridization to stain Serpina3n mRNA (Figure 3B–C) and Western blotting to detect Serpina3n protein in an independent cohort of apoE animals (Figure 3D–E). To further test whether the effect of APOE4 on regulating Serpina3n is systematic or specific to the central nervous system, we assessed the Serpina3n level in the blood, as well as in the liver where Serpina3n is synthesized and secreted into the circulation (Baker et al., 2007). Interestingly, the blood Serpina3n level was not elevated but rather decreased in APOE4 mice compare to APOE3 mice, and this difference was exacerbated with aging (Figure 3F), whereas the mRNA and protein levels did not differ in the liver of APOE4 mice compared to APOE3 mice (Figure 3G–I). Together, these data suggest that the upregulation of Serpina3n by APOE4 is brain-specific.
Figure 3: Validation of Serpina3n upregulation by APOE4 and microglia activation by aging in the brain of apoE-TR mice.
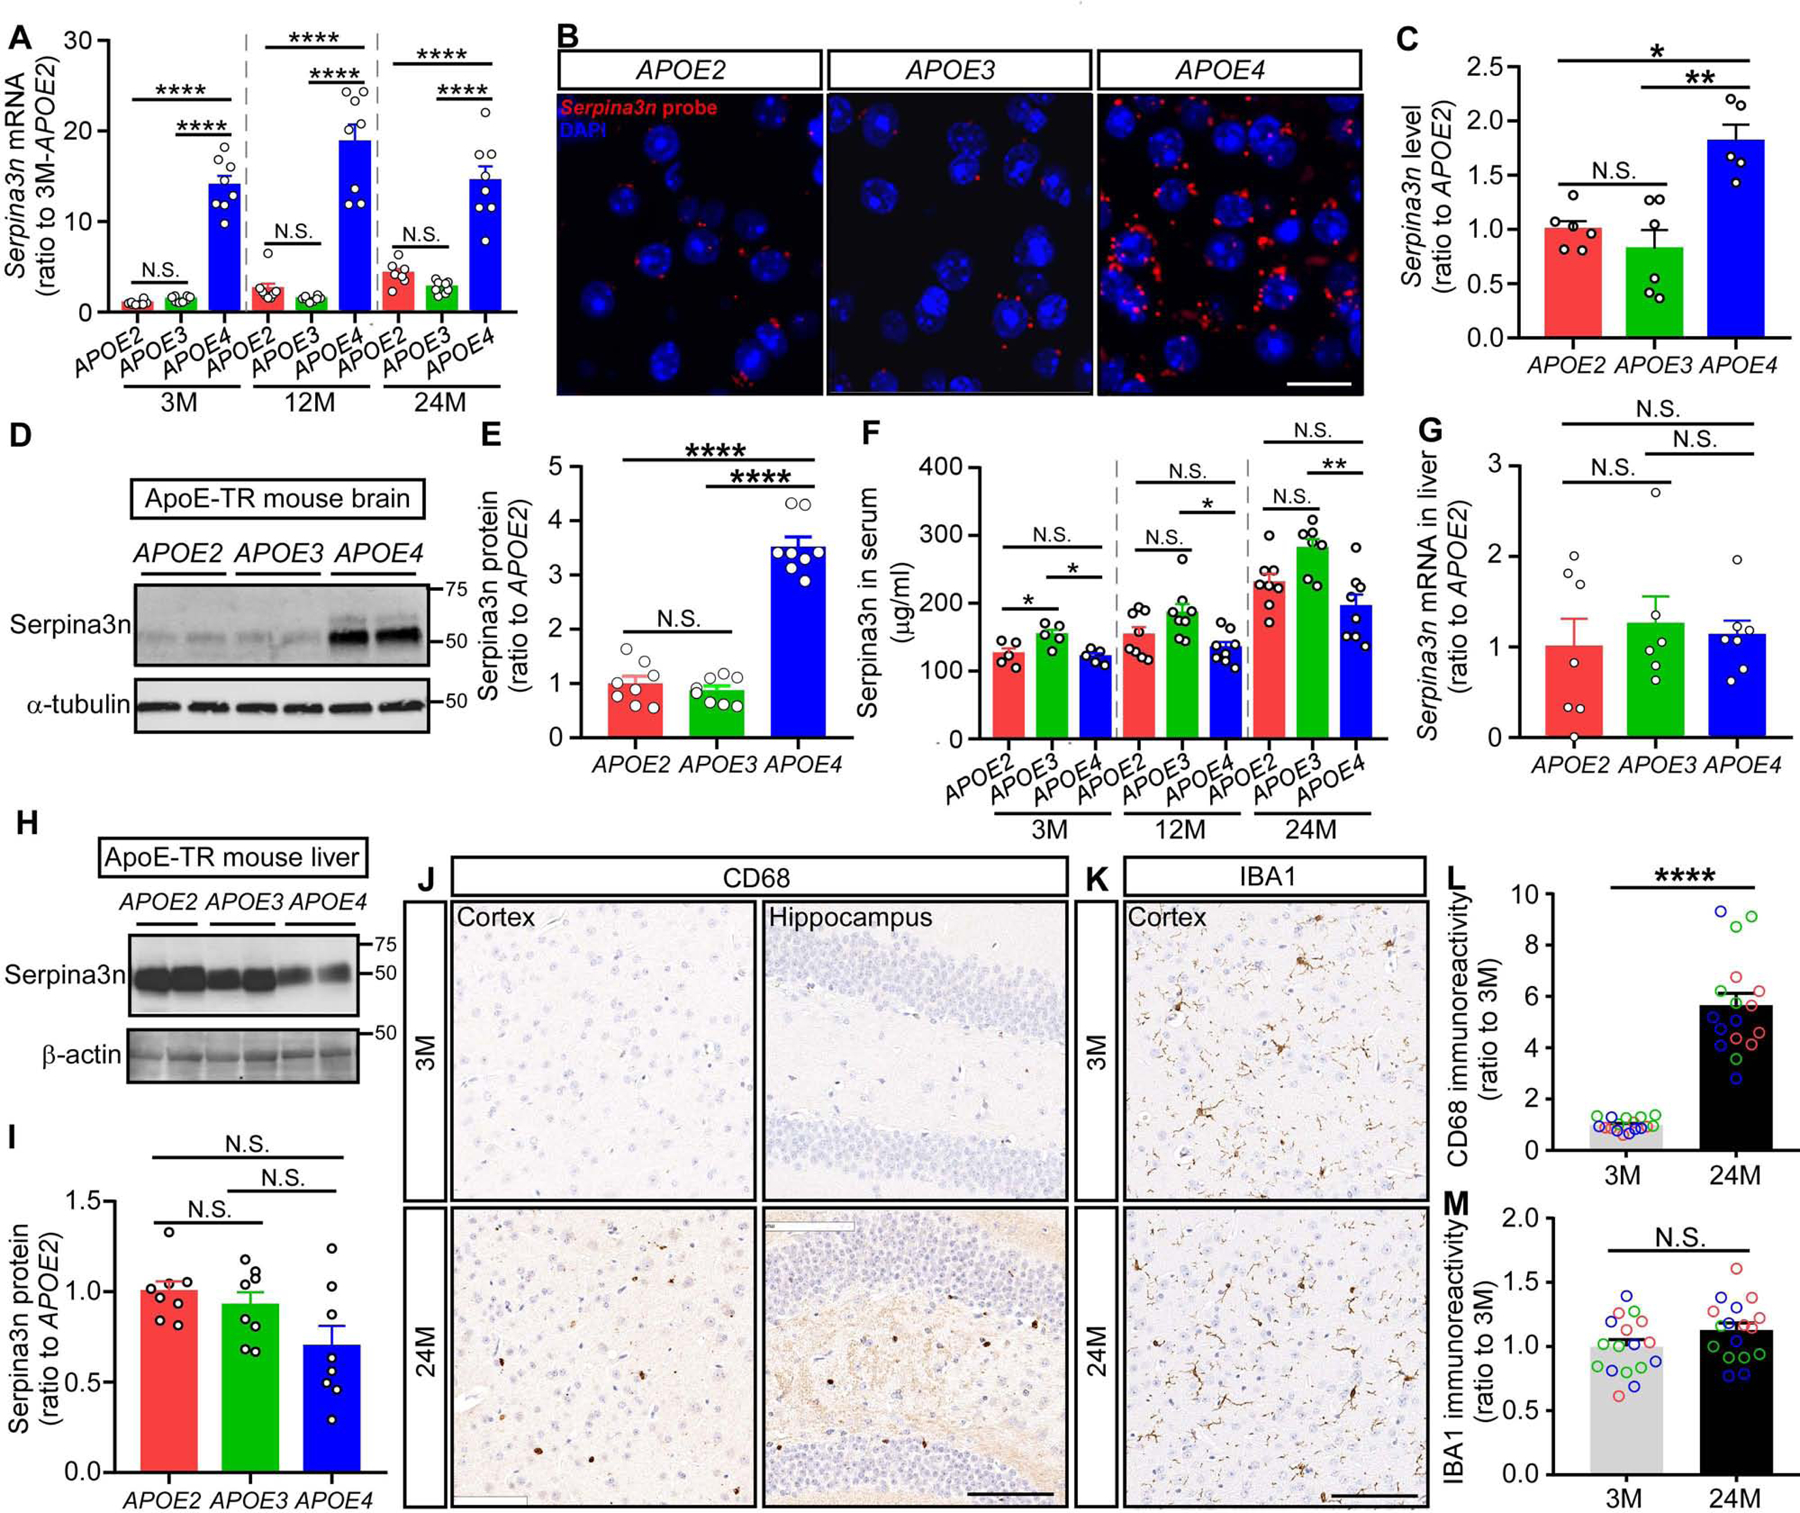
(A) The expression of Serpina3n at the mRNA level was detected by qPCR using RNA samples from the cortex of apoE-TR mice at different ages (n = 7–8 mice per APOE genotype per age group, mixed gender). Data are expressed as mean ± SEM relative to APOE2 mice at 3 months of age. One-way ANOVA was used to detect differences among APOE genotypes within each age group. (B and C) Brain sections were prepared from the apoE-TR mice (n = 5–6 mice per APOE genotype, mixed gender). The expression of Serpinas3n was visualized using RNAscope probes while nuclei were visualized with DAPI. Representative images were shown from each APOE genotype, respectively. Scale bar: 20 μm. The intensity of Serpina3n staining was quantified using ImageJ software and compared among APOE genotypes using one-way ANOVA. (D and E) Proteins from the cortex of apoE-TR mice were extracted using RIPA buffer. Serpina3n level was examined by Western blotting (n = 8 mice per group, mixed gender). Results were normalized to α-tubulin expression. Data are expressed as mean ± SEM relative to APOE2 mice. One-way ANOVA tests were used. (F) Serpina3n in the serum of apoE-TR mice was examined by ELISA (n = 5 mice per APOE genotype at 3 months of age, n = 7–8 mice per APOE genotype at 12 and 24 months of age, mixed gender). One-way ANOVA tests were used to detect difference among APOE genotypes within each age group. (G-I) The expression of Serpina3n at the mRNA and protein levels was evaluated in the liver of apoE-TR mice at 24 months of age by qPCR (G) or Western blotting (H and I) (n = 5–6 mice per group, mixed gender, RIPA fraction was used for the Western blotting experiment). The immunoblotting results were normalized to β-actin expression. Data are expressed as mean ± SEM relative to APOE2 mice. One-way ANOVA tests were used. (J-M) Brain sections were prepared from the apoE-TR mice at 3 and 24 months of age. Representative images are shown for the CD68 (J) and IBA1 (K) immunohistochemical staining at different brain regions. Scale bar, 100 μm. The immunoreactivity of CD68 (L) and IBA1 (M) staining in the region of cortex was evaluated by Aperio ImageScope (n = 17–18 mice per age group, mixed APOE genotype and gender). Red, green, and blue circles represent APOE2, APOE3 and APOE4 genotype, respectively. Data represent mean ± SEM relative to 3-month-old mice. Mann-Whitney tests were used. *p < 0.05; **p < 0.01; ****p < 0.0001; N.S., not significant.
Additionally, to validate the upregulated immune response with aging, we selected one of the hub genes in the pink module, Cd68, which encodes a lysosomal protein expressed at high levels by activated microglia and at low levels by resting microglia in the brain (Walker and Lue, 2015), and performed immunohistological staining with the brain slides from apoE-TR mice. Consistent with upregulated Cd68 mRNA with aging, we also found significantly higher CD68 immunoreactivity in the mouse brain at 24 months of age compared to those at 3 months of age (Figure 3J and L), whereas the general microglia marker ionized calcium binding adaptor molecule-1 (IBA1) (Walker and Lue, 2015) did not change significantly with aging (Figure 3K and M), confirming the aging effects on activating microglia.
Preservation of APOE genotype, age, and sex-related modules in human AD brains
We next assessed preservation of the APOE genotype, age, and sex-related modules in human post-mortem brain samples to validate their human relevance. We used the previously published RNA sequencing datasets of the prefrontal cortex from Religious Orders Study and Rush Memory and Aging Project (ROSMAP) (Bennett et al., 2018), and the temporal cortex and cerebellum from the Mayo Clinic (Allen et al., 2016; Allen et al., 2018b). We found that 8, 10, and 9 out of 16 mouse modules were preserved in the prefrontal cortex, temporal cortex and the cerebellum, respectively (Figure 4A, D, and G). As aging is the strongest risk factor for AD, we sought to assess whether the aging-related pink and blue mouse modules were also related to AD in humans. Interestingly, both the pink immune module and the blue EVs module were well-preserved in all three human brain datasets and significantly upregulated in AD cases compared to controls in the prefrontal cortex (Figure 4B and C) and the temporal cortex (Figure 4E and F), consistent with their upregulation with aging in mouse cortex (Figure 2G–L). In the cerebellum, the pink module did not change between AD and control (Figure 4I), but the blue module showed trending downregulation in AD cases, opposite of what we found in temporal cortex (Figure 4H). We further assessed whether the protein levels of these module genes were also affected by AD by analyzing a previously published proteomics dataset (Ping et al., 2018). Interestingly, the protein level of the pink immune module was significantly upregulated in AD cases compared to controls in the anterior cingulate gyrus and frontal cortex regions (Figure S5A), reflecting robust gene to protein association in immune response and AD in different cortical regions. However, the blue EVs module showed trending upregulation in the anterior cingulate gyrus but downregulation in frontal cortex (Figure S5B), indicating that the regulation of this module in AD might be dependent on brain regions. Taken together, our analyses show that the pink immune and blue EVs co-expression modules were conserved from mouse to human and dysregulated in AD, confirming that our findings are relevant to AD pathogenesis in humans.
Figure 4: Module preservation analyses between mouse and human samples.
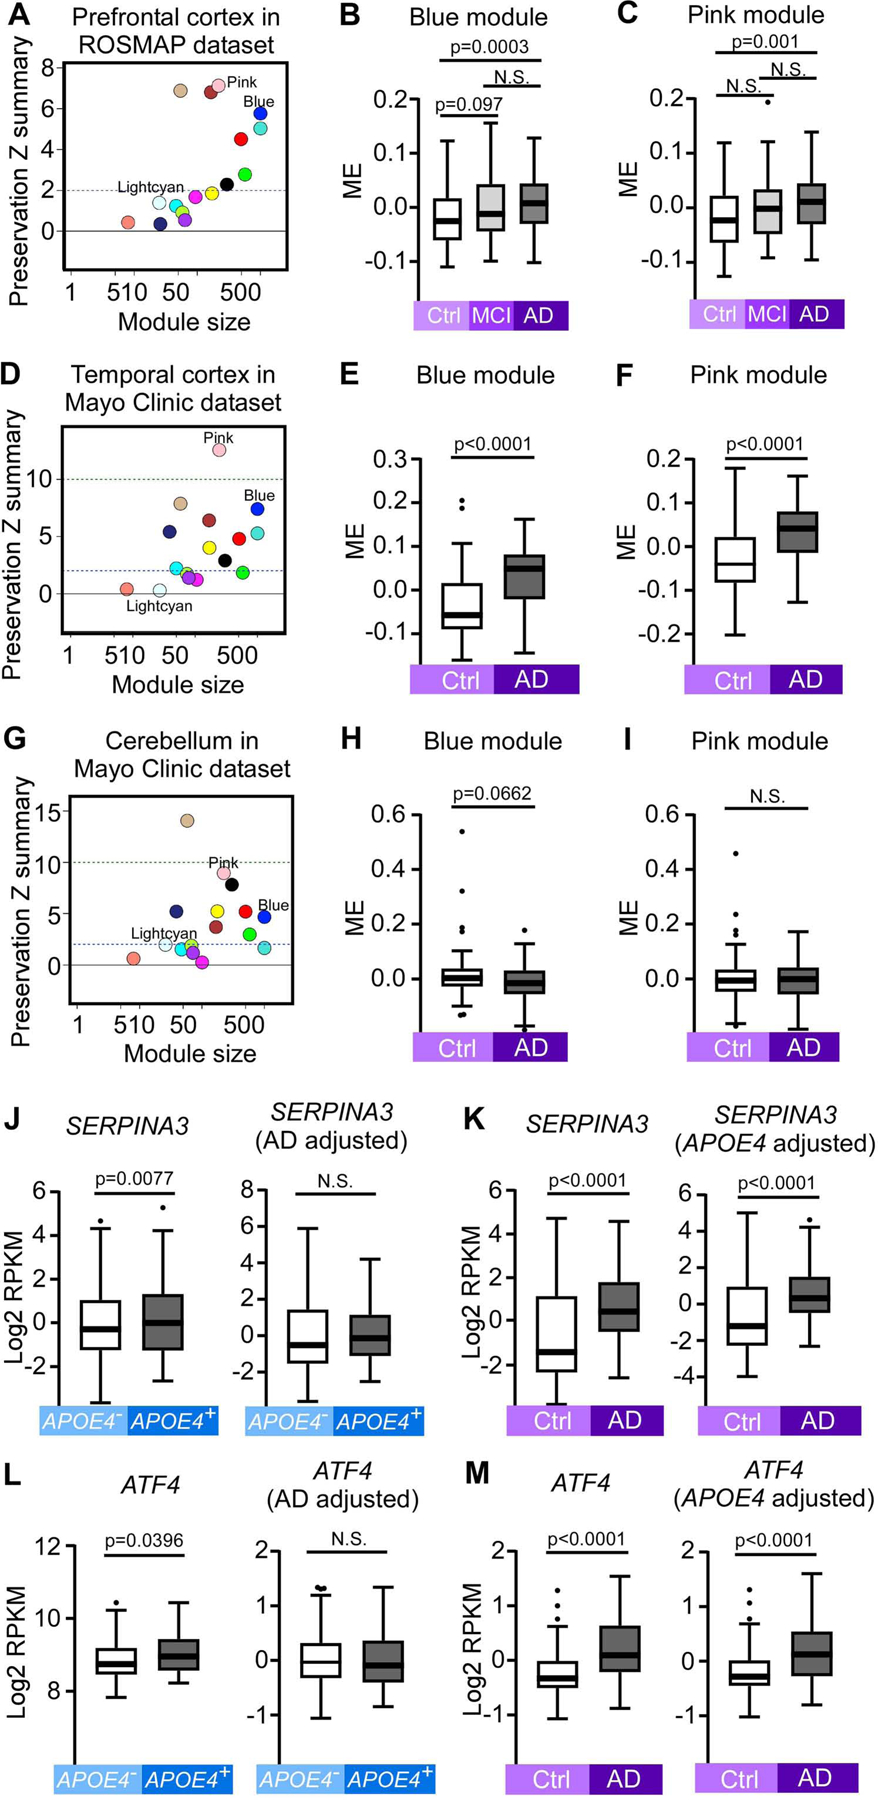
(A, D and G) Module preservation in the ROSMAP human prefrontal cortex (A, n = 313), Mayo clinic human temporal cortex (D, n = 159), and Mayo clinic human cerebellum (G, n = 158) datasets. Preservation Z summary between 2 and 10 indicates moderate preservation. Z summary >10 indicates strong preservation. (B and C) Blue (B) and pink (C) MEs in human control, MCI and AD samples in the ROSMAP prefrontal cortex dataset (n = 85 Ctrl, n = 78 MCI, and n = 150 AD). (E and F) Blue (E) and pink (F) MEs in human AD and controls samples in the Mayo Clinic temporal cortex dataset (n = 77 Ctrl and n = 82 AD). (H and I) Blue (H) and pink (I) MEs in human AD and controls samples in the Mayo Clinic cerebellum dataset (n = 76 Ctrl and n = 82 AD). (J-M) The gene expression levels (log2 transformed RPKM) of SERPINA3 and ATF4, two lightcyan module genes in the Mayo Clinic human temporal cortex dataset. (J, L) The expression levels of SERPINA3 (J) and ATF4 (L) between APOE4− (n = 108, including 69 Ctrl and 39 AD) and APOE4+ (n = 51, including 8 Ctrl and 43 AD) samples: left panel: expression values not adjusted by AD status; right panel: expression values adjusted by AD status. (K, M) The expression levels of SERPINA3 (K) and ATF4 (M) between AD (n = 82, including 39 APOE4− and 43 APOE4+) and Ctrl (n = 77, including 69 APOE4− and 8 APOE4+) samples: left panel: expression values not adjusted by APOE4 status; right panel: expression values adjusted by APOE4 status. In all box plots, the upper and lower lines in the boxplots represent the maximum and minimum values after Tukey’s test. The center line represents the median. P values were calculated by Mann-Whitney U tests.
The lightcyan module associated with APOE4 was not preserved in any of the three human RNA-seq datasets (Figure 4A, D, and G). This is likely due to the fact that humans only have one SERPINA3 protein-coding gene, whereas mice have ten protein-coding genes that are orthologous or paralogous to human SERPINA3 (Heit et al., 2013), six of which were hub genes in the lightcyan module (Figure 2D). Consequently, we examined the expression levels of SERPINA3 and ATF4, two mouse hub genes with human homologs. Interestingly, both SERPINA3 and ATF4 gene expression were significantly upregulated in APOE4 carriers compared to non-carriers in the temporal cortex (Figure 4J, L, left panel). Additionally, the expression of these two genes both showed upregulation in AD cases compared to controls (Figure 4K, M, left panel). However, the difference between APOE4 carriers and non-carriers disappeared after adjusting for AD status (Figure 4J, L, right panel), whereas the upregulation was still significant in AD versus control after adjusting for APOE4 status (Figure 4K, M, right panel), suggesting that the effects of AD pathology are stronger than APOE genotype, or that the APOE4 effects are AD-dependent in these human samples.
Identification of APOE genotype, age and sex-related differentially expressed genes (DEGs) and enriched pathways in the mouse brain
We then evaluated genes with significant differential expression among different APOE genotypes, ages, and sexes (Table S2). We found 189 downregulated and 213 upregulated DEGs in APOE2 versus APOE3 genotypes; 117 downregulated and 144 upregulated DEGs in APOE2 versus APOE4 genotype, and 97 downregulated and 112 upregulated DEGs in APOE3 versus APOE4 genotype (Bonferroni-corrected P < 0.05, |fold change| ≥ 1.2). Deferential expression among three APOE genotypes was observed in 1813 genes (Bonferroni-corrected P<0.05; Table S2; Figure S6A; Figure 5A–C). Hierarchical clustering of the top 20 genes successfully separated the samples by APOE genotype (Figure 5D; Figure S6B, D, and F). Among these DEGs, the Serpina3 family genes were upregulated in the APOE4 genotype compared to APOE2 or APOE3 genotype, consistent with our findings from WGCNA (Figure 2D–F). On the other hand, the expression levels of Wdfy1, Alkbh6, and Rdh13 were lower in APOE4 genotype. Wdfy1 and Alkbh6 were also hub genes in the cyan module, which was downregulated in APOE4 (Figure S2A–C). Additionally, the expression levels of Zc3h7b, Oscar, Thnsl1, and Tmc4 genes were downregulated in APOE3 compared to APOE2 or APOE4 genotype; the Xaf1, Ech1, and Nnt gene expression levels were upregulated whereas the expression levels of Olfr316, Lyrm7, Alox8, and Zfp14 were downregulated in APOE2 compared to APOE3 and APOE4 genotype (Figure 5D). The DEGs affected by APOE genotypes were significantly enriched in canonical pathways such as tRNA charging, IL-7 signaling, serotonin receptor signaling, GP6 signaling and eicosanoid signaling pathways (Figure 5E; Figure S6C, E, and G).
Figure 5: Differential gene expression and pathway analyses of the mouse brain transcriptomes.
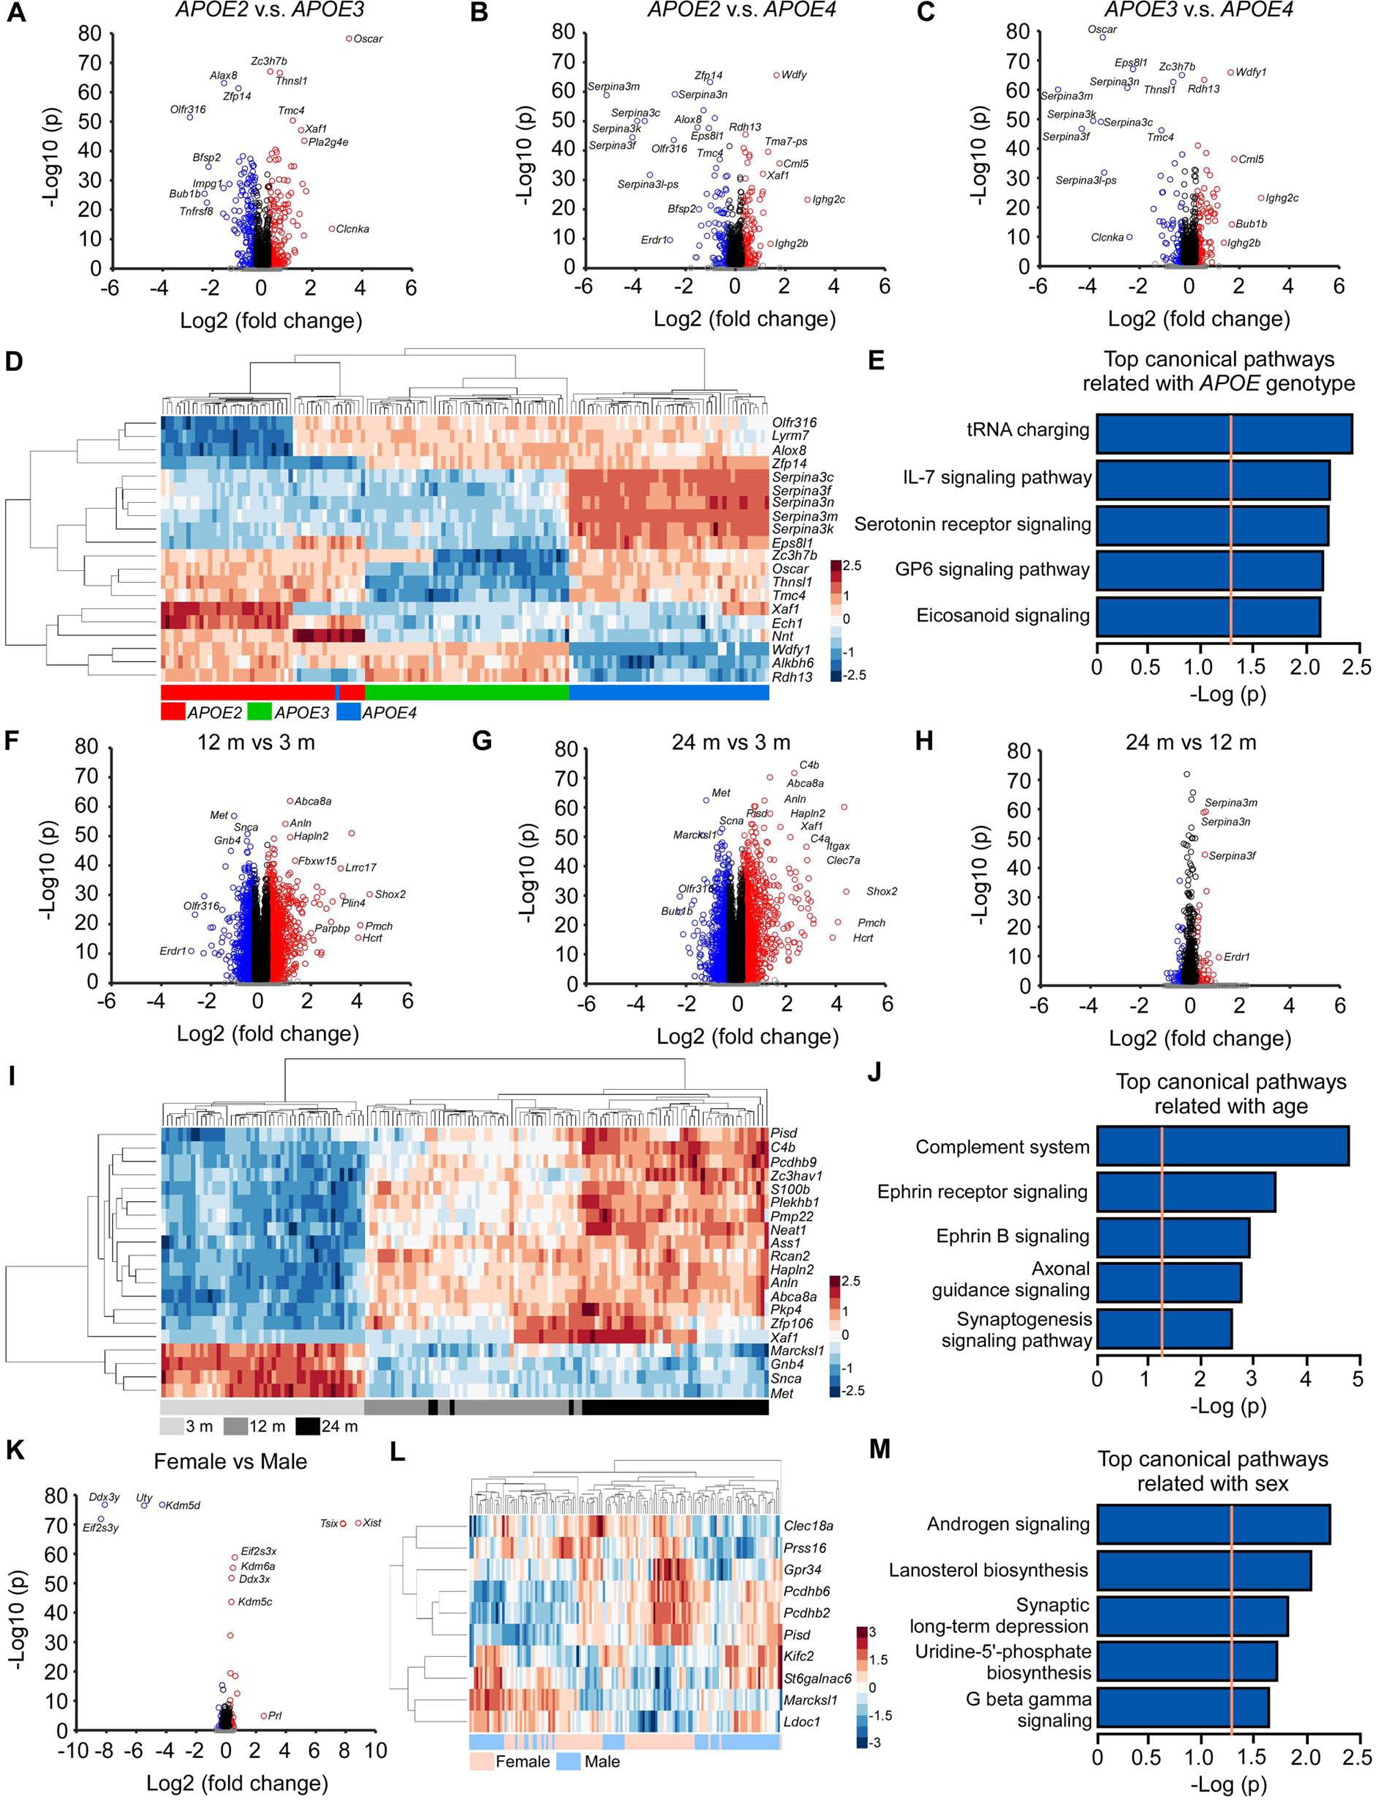
(A-C) Volcano plots of DEGs identified between the APOE2 and APOE3 (A), APOE2 and APOE4 (B), and APOE3 and APOE4 genotypes (C). The blue circles denote downregulated DEGs and the red circles denote upregulated DEGs in each comparison (Bonferroni-corrected p < 0.05 and |fold change| ≥ 1.2). The black circles denote genes with significant p values (Bonferroni-corrected p < 0.05) but |fold change| < 1.2, and the grey dots denote genes that did not meet either the p value or the fold change threshold. (D) Hierarchical clustering of the top 20 DEGs affected by APOE genotypes (Bonferroni-corrected p < 0.05). Each row corresponds to one gene and each column corresponds to one sample. (E) The top 5 pathways enriched by 1,011 DEGs affected by APOE genotypes (Bonferroni-corrected p < 0.0001). The orange dotted line indicates the threshold of p = 0.05. (F-H) Volcano plots of DEGs identified between the 12 and 3 months (F), 24 and 3 months (G), and 24 months and 12 months old mice (H). The color code of the circles is identical to figures A-C. (I) Hierarchical clustering of the top 20 DEGs affected by age (Bonferroni-corrected p < 0.05). (J) The top 5 canonical pathways enriched by the top 1,000 DEGs affected by age. (K) Volcano plot of DEGs identified between female and male mice. The color code of the circles is identical to figures A-C. (L) Hierarchical clustering of the top 10 DEGs affected by sex (the X- and Y-linked genes were excluded). (M) The top 5 pathways enriched by 102 DEGs affected by sex (Bonferroni-corrected p < 0.0001). N = 7–8 mice/genotype/age/sex.
When comparing different ages, we identified 10,244 DEGs among three ages (Table S2). Around 3,000 DEGs were found in 12 months versus 3 months, or 24 months versus 3 months, whereas the number of DEGs between 24 months and 12 months was below 500, suggesting that the most dramatic changes of the brain transcriptomes arise between 3 and 12 months of age (Figure 5F–H; Figure S6A). Furthermore, hierarchical clustering of the top 20 DEGs successfully separated the 3 months samples from those of the 12 and 24 months (Figure 5I; Figure S7A, C, and E). Among the top 20 DEGs, Marcksl1, Gbn4, Snca, and Met were downregulated whereas the other genes were upregulated with aging, including Pisd, C4b, Pcdhb9, Zc3hav1, S100b, Plekhb1, Pmp22, Neat1, Ass1, Rcan2, Hapln2, Anln, Abca8a, Pkp4, Zfp106, and Xaf1. Although not in the top 20 DEG list, several Serpina3 family genes were upregulated at 24 months compared to 12 months of age. The DEGs affected by age were significantly enriched in canonical pathways such as the complement system and ephrin receptor signaling (Figure 5J; Figure S7B, D, and F).
We next compared gene expression between sexes, and identified 16 downregulated and 29 upregulated DEGs in female versus male mice (Table S2; Figure S6A; Figure 5K). The DEGs were significantly enriched in pathways such as androgen signaling, lanosterol biosynthesis, and synaptic long-term depression (Figure 5M). Hierarchical clustering of the top 10 DEGs (without genes on X or Y chromosome) did not successfully separate the samples according to sex (Figure 5L), indicating that these genes may also be regulated by other factors such as age or APOE genotype.
To validate the expression of these DEGs, we selected six top genes associated with either APOE genotype (Serpina3n, Wdfy1, and Alkbh6) or age (C4b, Pcdhb9, and Plekhb1), and performed qPCR analyses using the same samples used for RNAseq. We found significant correlation between the values from RNAseq and qPCR for each individual sample (Figure S8A–F), confirming the consistency between these two techniques. Further analysis using qPCR results showed significant dysregulation of Serpina3n, Wdfy1, and Alkbh6 by APOE genotype (Figure S8G–I), and C4b, Pcdhb9, and Plekhb1 by age (Figure S8J–L), which were all consistent with our results from RNAseq.
Identification of metabolite modules associated with APOE genotype, age, and sex in the mouse serum
To assess how APOE genotype, age, or sex affects peripheral metabolism, we examined the serum metabolomes of our mice using the AbsoluteIDQ® p180 Kit. The metabolome profiling yielded 162 metabolites after quality control (Table S3). WGCNA analysis of the metabolomes identified five co-expression metabolite modules (Figure 6A). Three modules, turquoise, yellow, and green, were significantly correlated with APOE genotype (Figure 6A). The MEs of all three modules were higher in APOE2 compared to APOE3 or APOE4 genotype (Figure 6A, C, E, and G). The turquoise module contained 92 metabolites, including 65 glycerophospholipids [including phosphatidylcholine (PC) and lysophosphatidylcholine (lyso-PC)], 14 sphingolipids (including sphingomyelin and hydroxysphingomyelin), and 13 acylcarnitines (Table S3). The yellow module contained 11 PCs, and the green module contained 5 lyso-PCs (Table S3). Metabolites in these three modules mainly belong to lipid metabolic pathways, with an upregulation in APOE2 compared to APOE3 or APOE4 genotype (Figure 6B–G), indicating that APOE2 drives distinct serum metabolomics signatures through the upregulation of lipid metabolism. Additionally, the yellow and green modules were also significantly correlated with sex with lower expression in females compared to males (Figure 6A, D–G).
Figure 6: Impact of APOE genotype, age and sex on co-expression network of the mouse serum metabolomes.
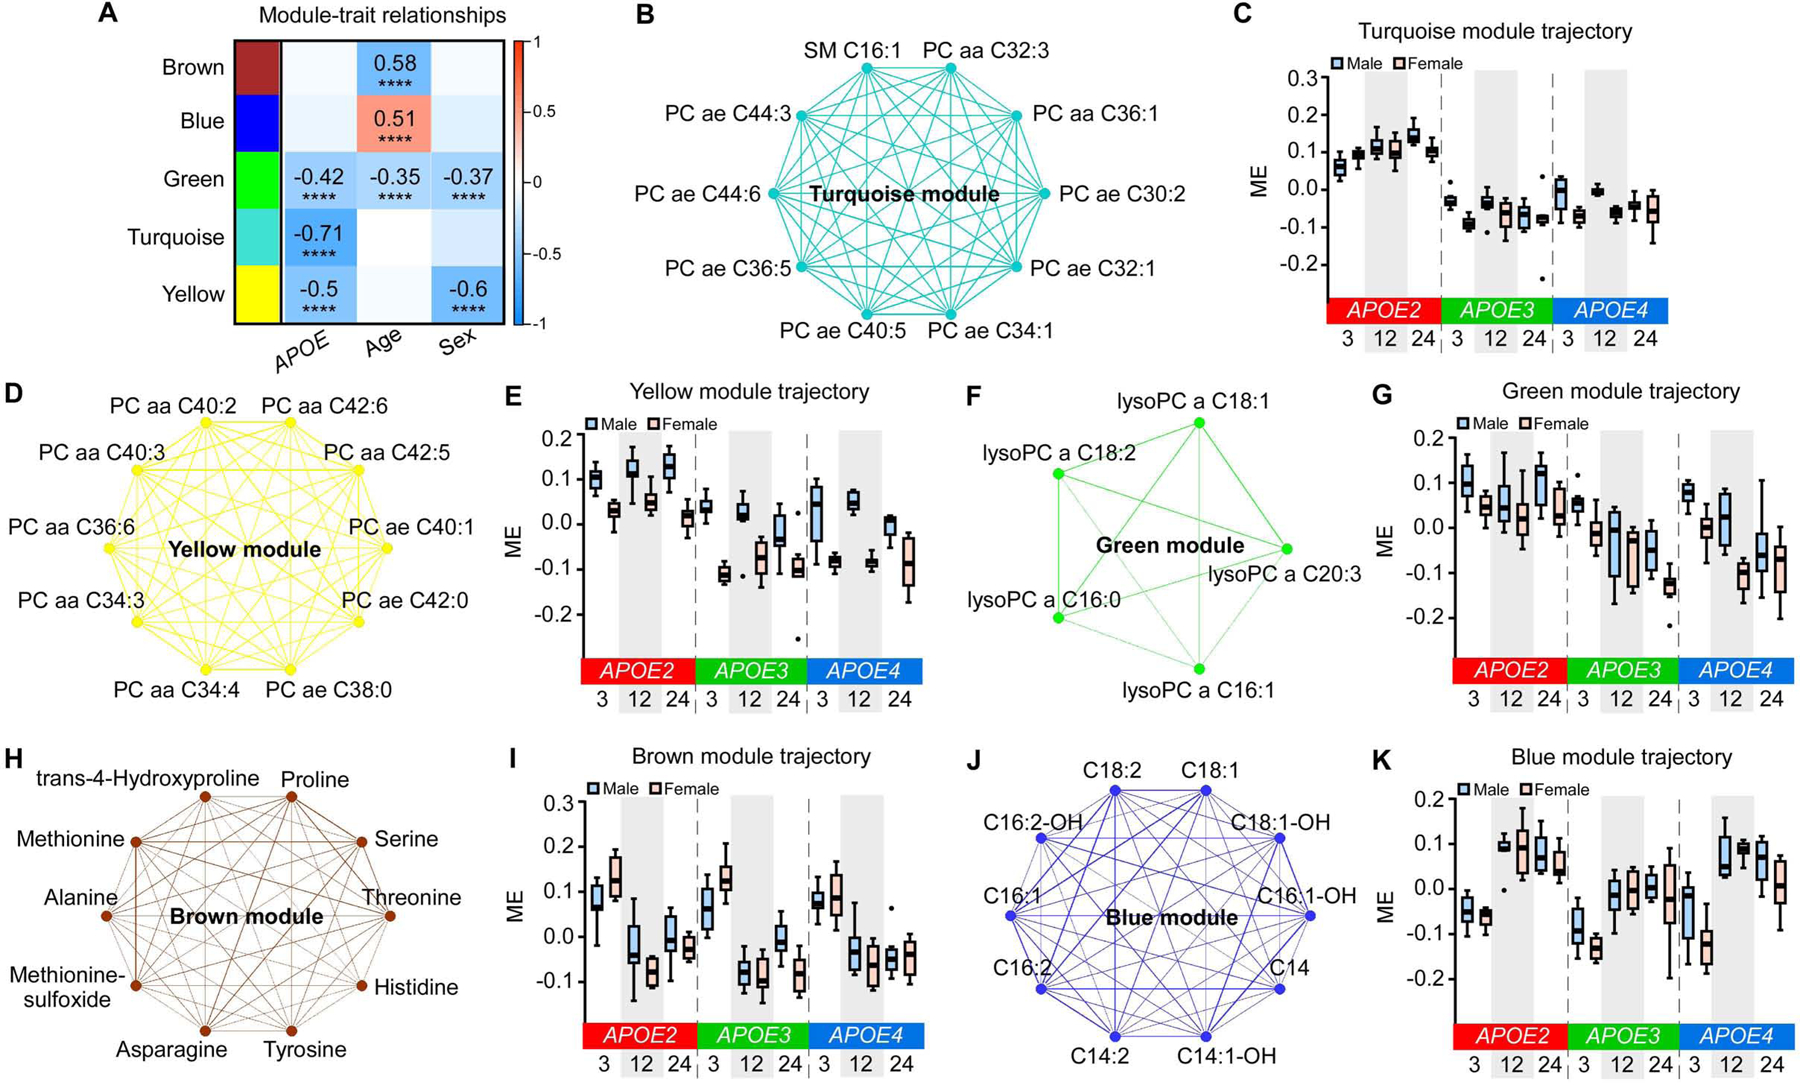
(A) The correlation between MEs and APOE genotype, age, and sex. The values in the heatmap are Pearson’s correlation coefficients. Stars represent significant correlations: ****p < 0.0001. Modules with positive values (orange) indicate positive correlation of MEs with APOE4 genotype, older age, or female; modules with negative values (blue) indicate negative correlation of MEs with these traits. (B, D, F, H, and J) Network plots of the top 10 hub metabolites in the turquoise (B), yellow (D), green (F, only 5 metabolites in the module), brown (H), and blue (J) modules. (C, E, G, I, and K) MEs in the turquoise (C), yellow (E), green (G), brown (I), and blue (K) modules across different APOE genotypes (APOE2, APOE3, and APOE4), ages (3, 12, and 24 months), and sexes (male and female). The upper and lower lines in the boxplots represent the maximum and minimum values after Tukey’s test. The center line represents the median. N = 7–8 mice/genotype/age/sex.
We further identified three modules that were significantly correlated with age, including two downregulated (brown and green) and one upregulated (blue) modules (Figure 6A). The brown module contained 13 amino acids and biogenic amines, and the ME was lower at 12 or 24 months of age compared to 3 months (Table S3; Figure 6H and I). The green module contained 5 lyso-PCs which were associated with both APOE genotype and age (Figure 6A and F). The ME of this module was downregulated with aging in APOE3 and APOE4 genotype; however, this downregulation was not seen in APOE2 genotype (Figure 6G), indicating that the protective effects of APOE2 on aging might be linked to the preservation of lyso-PC levels. Moreover, the blue module contained 14 acylcarnitines with most of them being long-chain fatty acids, and the ME was upregulated at 12 and 24 months compared to 3 months (Figure 6J and K). Together, these data indicate that the effects of aging on serum metabolomics are downregulation of amino acids and biogenic amines, and upregulation of acylcarnitines especially long-chain fatty acids.
Identification of APOE genotype, age and sex-related differentially expressed metabolites (DEMs)
We next studied metabolites that were significantly differentially expressed among different APOE genotypes, ages, and between sexes (Table S4; Figure S9A–D). We found 123 upregulated and 4 downregulated DEMs in APOE2 versus APOE3 genotype; 110 upregulated and 2 downregulated DEMs in APOE2 versus APOE4 genotype; 0 upregulated and 26 downregulated DEMs in APOE3 versus APOE4 genotype (Bonferroni-corrected P < 0.05, |fold change| ≥ 1.2); and overall 130 DEMs among three APOE genotypes (Table S4; Figure S9A; Figure 7A–C). Hierarchical clustering of the top 20 DEMs successfully separated the samples by APOE genotype with APOE2 showing distinct upregulation of lipids compared to APOE3 and APOE4 (Figure 7A–C; Figure S9B), consistent with our WGCNA analysis (Figure 6B–G).
Figure 7: Differentially expressed metabolites (DEMs) in the mouse serum.
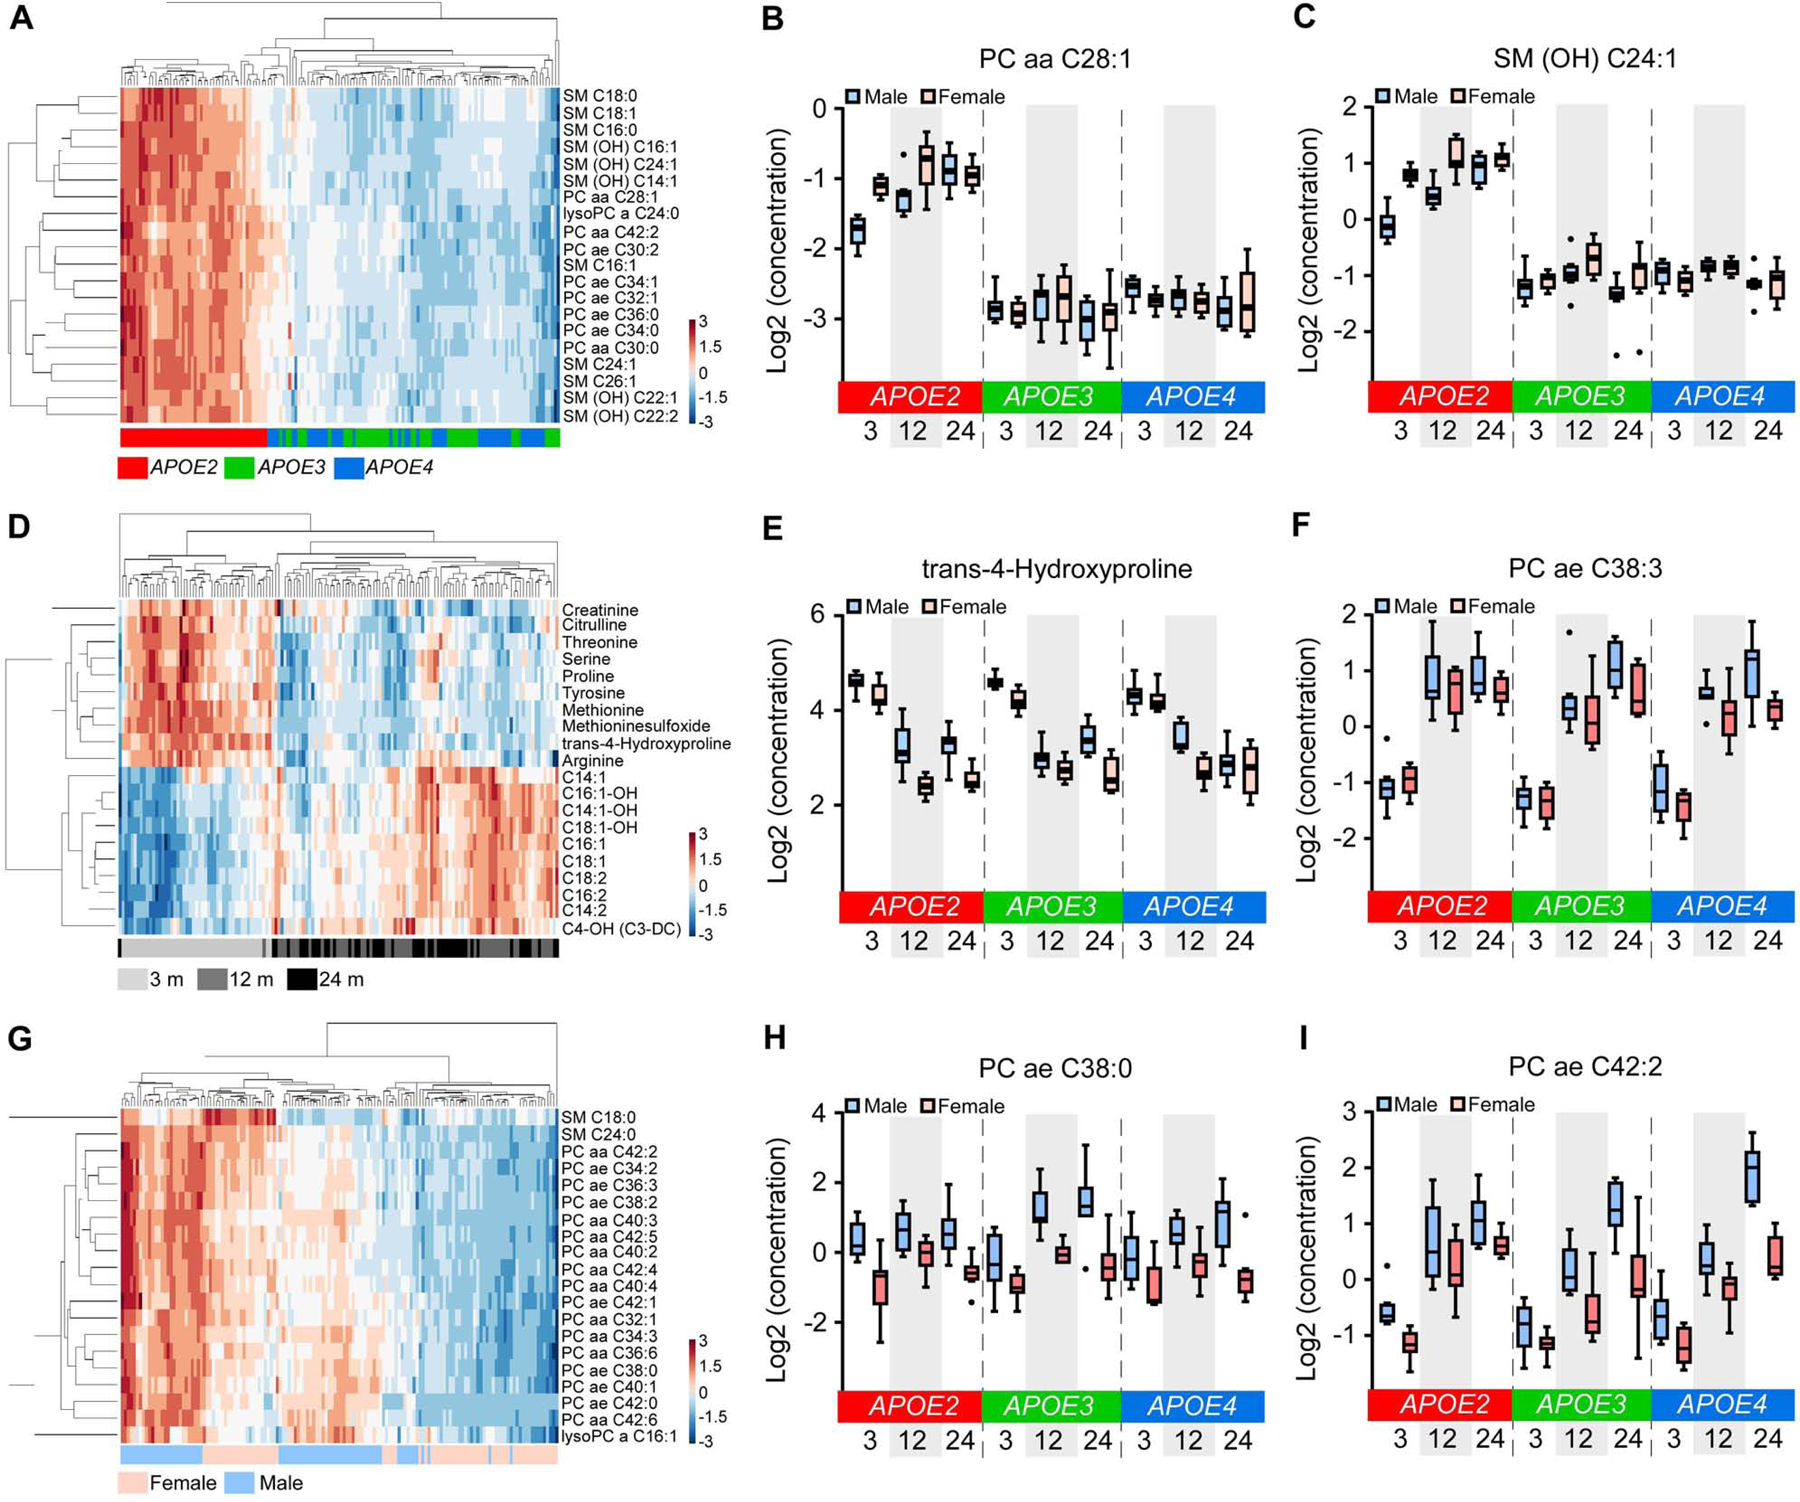
(A, D and G) Hierarchical clustering of the top 20 DEMs affected by APOE genotypes (A), age (D), or sex (G) (Bonferroni-corrected p < 0.05). (B, C, E, F, H and I) The expression levels of the top 2 DEMs in the comparison among APOE genotypes (B and C), ages (E and F), or sexes (H and I). The upper and lower lines in the boxplots represent the maximum and minimum values after Tukey’s test. The center line represents the median. N = 7–8 mice/genotype/age/sex.
In regard to aging, we identified 30 upregulated and 27 downregulated DEMs in 12 months versus 3 months; 30 upregulated and 31 downregulated DEMs in 24 months versus 3 months; 1 upregulated and 9 downregulated DEMs in 24 months versus 12 months of age (Table S4; Figure S9A and C); and overall 74 DEMs among three ages (Table S4). The small number of DEMs between 24 and 12 months indicates that the most dramatic change of serum metabolomics signatures happen in early ages, consistent with our findings in the brain transcriptomics (Figure S6A). Hierarchical clustering of the top 20 DEMs successfully separated the 3 month serum samples from that of 12 and 24 months, with downregulation of amino acids and biogenic amines and upregulation of acylcarnitines after 3 months (Figure 7D–F), consistent with our findings from our WGCNA analysis (Figure 6H–K).
We found 10 upregulated and 68 downregulated DEMs in female versus male mice (Table S4; Figure S9A and D). The top 20 DEMs were all lipids, but the hierarchical clustering of these DEMs did not clearly separate sexes (Figure 7G–I), indicating that the effects of sex on lipid metabolism might be strongly influenced by other factors such as APOE genotype.
Interactions of APOE genotype, age, and sex on brain transcriptomes and serum metabolomes
We finally assessed how the three AD risk factors - APOE genotype, age and sex, interactively affect the brain transcriptomes and serum metabolomes. We identified 776 brain DEGs (Bonferroni-corrected p < 0.0001) affected by the interactions of APOE genotype, age, and sex. These genes were enriched in canonical pathways such as unfolded protein response, autophagy, tight junction signaling, and endoplasmic reticulum stress pathway (Figure S10B), all of which are closely related to neurodegenerative disorders such as AD (Gerakis and Hetz, 2018; Scheper and Hoozemans, 2015; Uddin et al., 2018; Yamazaki and Kanekiyo, 2017). Hierarchical clustering of the top 20 DEGs showed strong interacting effects of age and APOE genotype (Figure S10A). In particular, APOE4 was distinct from APOE2 and APOE3 at 3 months, whereas APOE2 at 12 and 24 months showed distinct signature from the other groups (Figure S10A). Interestingly, all age groups from APOE3 genotype clustered together, indicating that the influence of aging on APOE3 genotype was minimal. These data suggest that the effects of age on brain transcriptomic profiles were influenced by APOE genotype. The sex effect was not dominant under any age or APOE genotype group.
We further identified 68 serum DEMs synergistically affected by APOE genotype, age and sex (Bonferroni-corrected p < 0.05) (Table S4, Figure S10C). Hierarchical clustering of these DEMs showed distinct separation of APOE2 from APOE3 and APOE4 with significant upregulation of lipids (Figure S10C), consistent with our PCA, WGCNA and DEM analyses (Figure 1D; Figure 6B–G; Figure 7A–C). The effects of age and sex on serum metabolites were observed within APOE2 genotype but were less apparent in APOE3 and APOE4 (Figure S10C), further indicating that the APOE2 genotype is the main driver for the distinct serum metabolomics profiles in our mouse cohort.
Discussion
Numerous genetic and functional studies have indicated the individual and interactive effects of age, APOE genotype, and sex on AD risk; however, the underlying molecular pathways remained elusive. By taking the triad of AD risk factors into consideration in animal models, we investigated the molecular signatures of transcriptomics in the brain and metabolomics in the blood using apoE-TR mice at young, middle, and old ages in both sexes. Rather than focusing on a priori candidate genes or metabolites, we pursued an unbiased systems-based approach using multiple types of bioinformatics analyses to identify gene and metabolite networks and molecular pathways. Importantly, our study demonstrated that the major age- or APOE genotype-related genes, gene modules and pathways identified in the mouse cortex were also significantly dysregulated in human AD temporal cortex, further supporting the profound relationship and overlap between increasing age and AD (Xia et al., 2018). We also considered the principles of regional vulnerability and disease trajectories (Fu et al., 2018) and found that the major gene networks associated with aging in animal models were altered in brain areas that show signs of pathology such as the temporal cortex, but not in the cerebellum, a brain region that is for the most part spared in AD (Allen et al., 2018a; Conway et al., 2018). The validation of gene modules at the protein level also suggests that the dysregulation of these co-expressed gene networks in AD might be brain region-dependent.
We identified two major age-related gene modules in the mouse cortex, including the immune and EVs modules, which were well-preserved in human brains and upregulated in the temporal cortex of AD cases compared to control subjects. While aging was the greatest contributor to the brain transcriptomics signature in our mouse models, a gene module of “immune response” was significantly upregulated at 24 months compared to 12 and 3 months of age. This module was led by the top hub genes including Trem2 and Tyrobp. Although the R47H risk variant of the TREM2 gene has been defined as a genetic risk factor of AD (Guerreiro et al., 2013; Jonsson et al., 2013), and the triggering receptor expressed on myeloid cells 2/TYRO Protein Tyrosine Kinase Binding Protein (TREM2/TYROBP) signaling are well-known as regulators of microglial functions in the brain (Deczkowska et al., 2018; Poliani et al., 2015; Rangaraju et al., 2018; Song and Colonna, 2018), our study is the first to capture the agingmediated dysregulation of Trem2/Tyrobp and their gene network (308 genes) using a unbiased systems-based approach in animal models. Further validation of this gene module in human brains, especially the upregulation in several cortical brain regions of AD cases compared to controls from both gene expression levels and protein levels, indicates the common changes between aging and AD regarding immune responses led by TREM2/TYROBP signaling (Zhang et al., 2013), although the validation using human aging brains without AD is necessary when the datasets become available. In addition, since the dysregulation of “EVs” module was predominantly affected in aged mouse brains or in human AD brains, our results imply the roles of EVs in maintaining CNS homeostasis and contributing to neurodegenerative disease pathology including AD. Dynamic brain functions rely upon communication among different cell types, and EVs have emerged as key mediators of such communication (Delpech et al., 2019). All cell types in the brain could release EVs which can either be taken up by neighboring cells or released into the cerebrospinal fluid and blood (Colombo et al., 2014). Thus, they display a harmonious beneficial and detrimental role in response to CNS injury, mediating inflammatory response and inflammation-related neuroprotection, spreading senescence, as well as propagating pathogenic proteins such as Aβ, α-synuclein, and tau (Basso and Bonetto, 2016; Coleman and Hill, 2015; Delpech et al., 2019; Effenberger et al., 2014). Therefore, comprehensive investigation focusing on the biology of EVs - including the biogenesis, release, action, and the profiles of isolated EVs, will be extremely valuable.
Interestingly, age, APOE genotype, and sex interactively impacted pathways led by unfolded protein response (UPR) in the brain. The UPR pathway is activated to protect cells under ER stress when the inability of cells to properly fold, modify and assemble secretory and transmembrane proteins leads to the accumulation of misfolded proteins in the ER (Walter and Ron, 2011). However, the maladaptive UPR signaling under chronic ER stress alternatively commits cells to degeneration, which is implicated in the etiology and pathogenesis of various neurodegenerative disorders including AD (Pitale et al., 2017; Scheper and Hoozemans, 2015). Our study suggests that the signaling components of the UPR might be potential targets for intervention and treatment of AD (Maly and Papa, 2014).
Furthermore, to our knowledge, our study is the first to report the correlation of APOE genotype and Serpina3n/SERPINA3 gene expression in both mouse and human brains. Serpina3n/SERPINA3 gene encodes α1-antichymotrypsin (ACT), which is an acute phase serum glycoprotein belonging to a class of serine protease inhibitors (Padmanabhan et al., 2006). ACT inhibits the activity of chymotrypsin and cathepsin G, thus playing an important role in inflammation, complement activation, and apoptosis (Irving et al., 2000; Law et al., 2006). It has also been broadly reported that ACT is elevated in AD brains, and may promote Aβ polymerization and amyloid formation (Abraham et al., 2000; Abraham et al., 1988; Abraham et al., 1990; McGeer et al., 1990; Pasternack et al., 1989), consistent with our findings from the human brain datasets. In the brain, it was reported that Serpina3n gene is expressed by astrocytes and has recently been identified as a strong marker for reactive and aged astrocytes in the mouse brain (Boisvert et al., 2018; Zamanian et al., 2012). Interestingly, the oligodendroglia in the experimental autoimmune encephalomyelitis mouse model displayed elevated Serpina3n expression (Falcao et al., 2018). Notably, our study suggests an important role of apoE4 in the regulation of Serpina3n expression in the brain, although the underlying mechanisms remain unclear on how apoE4 elevates the expression of Serpina3n, which cell types are involved, and what are the functional impacts linked to the elevated Serpina3n in apoE4 mice. The upregulation of Serpina3n in APOE4 genotype might be related with the pathogenic effect of apoE4 on astrocyte activation and might thus contribute to the role of apoE4 in AD pathogenesis (Fernandez et al., 2019; Perez-Nievas and Serrano-Pozo, 2018; Zhu et al., 2012). Additionally, the Serpina3 gene expression was upregulated at 24 months compared to 12 months of age, suggesting the common effects of APOE4 and aging on astrocyte activation in the brain (Boisvert et al., 2018; Zamanian et al., 2012). Interestingly, in periphery such as liver and blood, the level of Serpina3n was not elevated in APOE4 mice, indicating the upregulation of APOE4 on Serpina3n expression is brain-specific. Therefore, a better understanding of the regulation of Serpina3n by APOE4 and aging in both the central nervous and periphery systems is needed such that potential biomarkers, tractable pathways, and drug targets can be defined for early diagnosis or to reduce APOE4- and aging-related AD risk.
ApoE lipoprotein particles in circulation play a critical role in regulating the peripheral lipid metabolism. Although it has been reported that apoE isoforms differentially impact peripheral lipid metabolism in humans (Karjalainen et al., 2019; Phillips, 2014), our study is the first to examine the APOE genotype effect on blood metabolomics in a well-defined animal cohort. We found distinct serum metabolite profiles in APOE2 mice with dramatically upregulated lipid levels (including phospholipids and sphingolipids) compared to APOE3 and APOE4 mice, likely due to its reduced binding affinity to apoE receptors including the LDL receptor, which might consequently elevate apoE levels and lipids in the blood (Kowal et al., 1990; Mahley, 2016; Rasmussen et al., 2015; Schneider et al., 1981). This dramatic effect of APOE2 on lipid levels is consistent with a recently published human study (Karjalainen et al., 2019). Interestingly, lower levels of blood phospholipids are related to the phenoconversion from normal to either amnestic mild cognitive impairment or AD (Mapstone et al., 2014), suggesting that the protective effects of APOE2 on AD risk might be associated with the elevated phospholipid profiles. However, the role of APOE2 has been debated on one hand to be protective against AD, but on the other hand to promote vascular disease (Lahoz et al., 2001; Wilson et al., 1994) and the risk for type III hyperlipoproteinemia (Kowal et al., 1990; Schneider et al., 1981) when combined with additional genetic or environmental stress, e.g., obesity, highfat diet, and different races (Phillips, 2014; Zhao et al., 2017b). Further studies on apoE isoformspecific effects on lipid metabolism and related pathways offer great promise for a more comprehensive understanding of APOE genotype effects on AD to establish mechanism-based therapy. While the effect of sex on serum metabolomics is not prominent in our study, it is possible that the dominant effects of age and APOE genotype masked the sex effects.
In conclusion, our comprehensive data support unique and interactive molecular pathways underlying the three major risk factors for AD, and map the landscape regarding how they collectively drive AD risk. These resources provide therapeutic insights into treating AD and will facilitate discovery and validation research in model systems and humans.
STAR Methods
LEAD CONTACT AND MATERIALS AVAILABILITY
Further information and requests for resources and reagents should be directed to and will be fulfilled by the Lead Contact, Guojun Bu (bu.guojun@mayo.edu). This study did not generate new unique reagents.
EXPERIMENTAL MODEL AND SUBJECT DETAILS
Mice
ApoE-targeted replacement (apoE-TR) mice in which murine Apoe gene locus is replaced with human APOE2, APOE3, or APOE4 gene (Sullivan et al., 1997) were obtained from Taconic Biosciences. Animals were housed under controlled temperature and lighting conditions and were given free access to food and water. Male and female apoE-TR mice at 3, 12 and 24 months of age were sacrificed (n = 8 mice/genotype/sex/age group). Mice were anesthetized with isoflurane and blood was collected from the inferior vena cava. After transcardial perfusion with phosphate-buffered saline (PBS, pH 7.4), the brains were collected and divided along the sagittal plane. Cortex from left hemisphere was snap-frozen in liquid nitrogen immediately and further stored at −80°C for RNA extraction and RNA-Seq. Blood was stored at 4°C overnight and then centrifuged at 1000 × g for 10 minutes. The serum was collected and stored at −80°C for metabolomics study. All animal procedures were approved by the Mayo Clinic Institutional Animal Care and Use Committee (IACUC) and were in accordance with the National Institutes of Health Guide for the Care and Use of Laboratory Animals.
Humans
The RNA sequencing data of the ROSMAP (Bennett et al., 2018) and Mayo Clinic post mortem brain samples (Allen et al., 2016; Allen et al., 2018a) were used for gene module preservation analyses. Briefly, 150 AD (cogdx = 4, Braak ≥ 4, CERAD ≤ 2), 78 mild cognitive impairment (MCI; cogdx = 2, Braak ≥ 4) and 85 no cognitive impairment (NCI, control; cogdx = 1, Braak ≤ 3, CERAD ≥ 3) white, non-Hispanic samples from prefrontal cortex of ROSMAP cohort were analyzed. For Mayo Clinic cohorts, the data of temporal cortex from 82 AD and 77 controls, and the cerebellum from 82 AD and 76 controls were analyzed. Additionally, we analyzed the module preservation using the previously published protein expression profiles from dorsolateral prefrontal frontal cortex and anterior cingulate gyrus of 10 AD and 10 controls subjects measured by liquid chromatography-tandem mass spectrometry (Ping et al., 2018).
METHOD DETAILS
Brain tissue RNA extraction, library preparation and sequencing
Total RNA were extracted from the cortex using Trizol reagent (Thermo Fisher Scientific, Waltham, MA) and cleaned using RNeasy spin columns with DNase treatment (QIAGEN, Hilden, Germany) to remove contaminating genomic DNA. The RNA concentrations were determined by NanoDrop™ Spectrophotometers (Thermo Fisher Scientific, Waltham, MA). The RNA integrity numbers (RIN) were measured using an RNA chip on an Agilent Bioanalyzer (Agilent Technologies). The RIN values of all the RNA samples were ≥ 7, thus all samples were approved for library preparation and sequencing. RNA libraries were prepared from 200 ng of total RNA using the TruSeq RNA Sample Prep Kit v2 (Illumina, San Diego, CA) according to the manufacturer’s instructions, employing poly-A mRNA enrichment using oligo-dT magnetic beads. The final adapter-modified cDNA fragments were enriched by 12 cycles of PCR using Illumina TruSeq PCR primers. The concentration and size distribution of the completed libraries were determined using a Fragment Analyzer (AATI, Ankeny, IA) and Qubit fluorometer (Invitrogen, Carlsbad, CA). Libraries were randomized for sequencing lanes and flow cells, and were sequenced following Illumina’s standard protocol using the Illumina cBot and HiSeq 3000/4000 PE Cluster Kit, yielding 40 to 75 million fragment reads per sample. Each fragment was sequenced as 50 × 2 paired end reads on an Illumina HiSeq 4000 using HiSeq 3000/4000 sequencing kit and HCS v3.3.52 collection software. Base-calling was performed using Illumina’s RTA version 2.7.3.
Serum metabolites detection
Serum samples were analyzed using the AbsoluteIDQ p180 kit (Biocrates Life Sciences AG, Innsbruck, Austria) according to the user manual. Briefly, after the addition of 10 μl of the supplied internal standard solution to each well on filterspot of the 96-well extraction plates, 10 μl of each serum sample, quality control (QC) samples, blank, zero sample, or calibration standard were added to the appropriate wells. All the serum samples were randomly distributed in different plates during detection. The plates were then dried under a gentle stream of nitrogen. The samples were derivatized with phenyl isothiocyanate (PITC) for the amino acids and biogenic amines, and dried again. Sample extract elution was performed with 5 mM ammonium acetate in methanol. Sample extracts were diluted with either 40% methanol in water for the UPLC-MS/MS analysis (15:1) or kit running solvent (Biocrates Life Sciences AG) for flow injection analysis (FIA)-MS/MS (20:1).
Mouse tissue preparation for validation experiments
Mice were deeply anesthetized with isoflurane prior to transcardial perfusion with saline. Brains was removed and bisected along the midline. One half of each brain was drop-fixed in 10% neutral buffered formalin (Fisher Scientific) overnight at 4°C for in situ hybridization and histology, and the other half was snap-frozen in liquid nitrogen and stored at −80°C. Livers were collected as well. For biochemical analysis, the brain and liver tissues were homogenized and lysed in RIPA (Fisher Scientific) buffer, supplemented by protease inhibitor (cOmplete) and phosphatase inhibitor (PhosSTOP) and ultracentrifuged at 50,000 g for 30 min at 4°C. The supernatant was collected as RIPA soluble fraction and stored in −80°C.
Histology and immunohistochemistry
The brain samples fixed in 10% formalin were embedded in paraffin wax, sectioned in a coronal plane at 5 μm thickness and mounted on glass slides. Sections were collected from the same brain region for all animals, and brain regions were confirmed under the microscope by comparing sections to images on the Allen Mouse Brain Atlas site. The tissue sections were deparaffinized in xylene and rehydrated in a graded series of alcohols. Antigen retrieval was performed by steaming in distilled water for 30 min, and endogenous peroxidase activity was blocked by incubation in 0.03% hydrogen peroxide. Sections were then immunostained using the DAKO Autostainer (DAKO) and the DAKO EnVision+HRP system. The stained slides were dehydrated, cover-slipped and scanned with the Aperio Slide Scanner (Aperio). The following primary antibodies were used: anti-CD68 (Cat# ab125212, Abcam, 1:2500) and antiIBA1 (Cat# 019–19741, Wako, 1:2500) antibodies. A technician blinded to sample groups performed immunohistochemical staining. Data collection and quantification of immunoreactivity were performed blindly by another technician.
In situ hybridization
In situ hybridization was performed on freshly cut Formalin-Fixed Paraffin-Embedded 5μm sections using RNAscope® Multiplex Fluorescent Reagent Manual Assay Kit v2 (Cat #323100, ACD) according to the manufacturer’s protocol with ACD probes for mouse Serpina3n (Cat #430191; target NM_009252.2, 745–2005bp), DapB (negative control Cat #310043; target EF191515, 414–862bp), and Ppib (positive control Cat #313911; target NM_011149.2, 98–856bp). The probes were detected using AKOYA Biosciences fluorophores Opal 620, diluted 1:750 in TSA Buffer (ACD). The slides were counterstained with DAPI (ACD) for 2 min at RT before mounting.
Western blotting
Equal amounts of protein from RIPA fraction of homogenized tissue lysates were resolved by SDS-PAGE and transferred to PVDF membranes. After the membranes were blocked, proteins of interest were detected with a primary antibody. The membranes were then probed with an HRP-conjugated secondary antibody and visualized using the Odyssey infrared imaging system (LI-COR). The following primary antibodies were used: anti-Serpin3n (Cat# AF4709, R&D systems, 1:1000), anti-α-tubulin (Cat# T9026, Sigma, 1:5000), and anti-β-actin (Cat# 4967L, Cell Signaling Technology, 1:2000) antibodies.
Serpina3 ELISA
The Serpina3 level in mouse serum was measured using a commercial ELISA kit (Cat# CSBE13727m, Cusabio) according to the instructions provided by the manufacturer. Briefly, the serum samples were diluted 500 folds with Sample Diluent buffer and 100 μl of samples were added into the antibody-coated plate for 2 hours incubation at 37°C. 100 μl of Biotin-conjugated detection antibodies were then added into the plate and incubated for 1 hour at 37°C. The plate was washed and incubated with 100 μl HRP-avidin for 1 hour at 37°C. After washing, 90 μl TMB were added into the plate with 20 minutes incubation at 37°C with protection from light. 50 μl of the Stop Solution were applied before colorimetric absorbance measurements were taken at 450 nm using a Synergy HT plate reader (BioTek).
qPCR analysis
Reverse transcription of RNA was performed using iScript™ Reverse Transcription Supermix (Biorad). cDNA was added to a reaction mix (10 μl final volume) containing gene-specific primers and SYBR green supermix (Biorad). All samples were run in duplicates and were analyzed with QuantStudio™ 7 Flex Real-Time PCR System (ThermoFisher Scientific). The relative gene expression was normalized to Gapdh controls and assessed using the 2−ΔΔCT method. Primer sequences and information are as follows (5 ′ – 3 ′ ): Gapdh: AGGTCGGTGTGAACGGATTTG (forward) and TGTAGACCATGTAGTTGAGGTCA (reverse); Serpina3n: Mm.PT.58.6333775 (Integrated Device Technology, IDT, CA); Wdfy1: Mm.PT.58.13459241 (IDT); Alkbh6: Mm.PT.58.7880283 (IDT); C4b: Mm.PT.58.42828296.g (IDT); Pcdhb9: Mm.PT.58.14060200.g (IDT); Plekhb1: Mm.PT.58.10308025 (IDT).
QUANTIFICATION AND STATISTICAL ANALYSIS
RNA and metabolites quantification, quality control and normalization
RNA sequencing reads were processed using the Mayo Clinic RNA sequencing analytic pipeline, MAP-RSeq Version 2.1.1 (Kalari et al., 2014). Briefly, reads were aligned to the mouse reference genome mm10 using TopHat version 2.1.0 (Kim et al., 2013) and Bowtie version 1.1.2 (Langmead et al., 2009). Quality control (QC) was performed using RSeQC version 2.6.2 (Wang et al., 2012). Gene counts were generated using featureCounts version 1.4.6-p5 (Liao et al., 2014). One 12 months APOE2 male sample failed the pipeline and was excluded from further analysis. For the remaining 143 sample, conditional quantile normalization (CQN) was applied to raw gene counts to remove unwanted sources of variability caused by GC-content, gene length, sample-specific systematic biases and global distortions that affect the overall distribution of gene counts (Hansen et al., 2012). Based on the bimodal distribution of the CQN-normalized and log2-transformed reads per kb per million (RPKM) gene expression values, genes with log2 RPKM of −1 or more in at least one sample were considered expressed above detection threshold. Using this selection threshold, 19,120 genes were included in the downstream analyses. Principal component analysis (PCA) identified two sample outliers: a 3 month-old APOE4 male, and a 12 month-old APOE4 female, both were excluded from downstream analyses.
Metabolites from 144 serum samples were analyzed using four sets of QC as described in (St John-Williams et al., 2017). First, low/mid/high level QC samples provided by Biocrates Life Sciences AG were prepared and analyzed on each plate as recommended by the manufacturer. These QC samples were used for technical validation of each kit plate. Briefly, metabolites with > 40% of measurements below the lower limit of detection (LOD) were excluded from the analysis. To adjust for batch effects, a correction factor for each metabolite in a specific plate was obtained by dividing the metabolite’s QC global average by the QC average within the plate. Using each metabolite’s LOD/2 value followed by log2 transformation, we imputed the < LOD values.
Differential gene expression, hierarchical clustering and pathway analysis
Differential gene expression analyses were performed by Partek Genomics Suite (Partek Inc., St. Louis, MO) using CQN-normalized log2RPKM values. Gene expressions between different APOE genotypes, ages and sexes were compared using Analyses of Variance models (ANOVA) while adjusting for sequencing depth per sample, which significantly affected the variation in the gene expression values (mean F ratio >1.5). The Bonferroni correction was applied to adjust for multiple testing. Differentially expressed genes (DEG) were defined by thresholds of Bonferroniadjusted p value < 0.05 and |fold change| (FC) ≥ 1.2. Hierarchical clustering was performed in MATLAB using the Clustergram function based on standardized Euclidean distance metric. Volcano plots were generated in MATLAB using –log10 (p value) as y axis and ± log2 (|FC|) as x axis. Pathway analyses of differentially expressed genes were performed using Ingenuity Pathway Analysis (QIAGEN Inc., https://www.qiagenbioinformatics.com/products/ingenuitypathway-analysis) (Kramer et al., 2014).
Weighted gene co-expression network analysis of the mouse transcriptomes
Weighted gene co-expression network analysis (WGCNA) was performed using residual expression values calculated from adjusting for sequence coverage. Based on the relationship between power and scale independence, the power of 8 was chosen to build scale-free topology using signed hybrid network. We set the minimum modules size as 30, and merged modules whose correlation coefficients were greater than 0.6 (mergeCutHeight = 0.4). Each module was summarized by the first principal component of the scaled module expression profiles, termed module eigengene (ME). For each module, the module membership (MM) was defined as the correlation between gene expression values and ME. Intramodular hub genes are genes with the highest connectivity to other genes within a given module, and were selected based on the p values of MM. To assess the correlation of modules to APOE genotype, age and sex, we defined the APOE2 genotype as 0, APOE3 as 1, and APOE4 as 2; 3 months of age as 3, 12 months as 12, and 24 months as 24; male as 0 and female as 1. Modules were annotated using R package anRichment. MEs of selected modules were compared between APOE genotypes, ages and sexes using boxplots showing maximum and minimum values after Tukey’s test. Gene-gene connections among top hub genes were visualized using VisANT version 5.51 (Hu et al., 2013).
Module preservation analysis in human RNA samples
The preservation of the mouse modules were tested in the RNA sequencing data of the ROSMAP prefrontal cortex and Mayo Clinic temporal cortex and cerebellum human post mortem brain samples. With the prefrontal cortex data from ROSMAP, we performed CQN normalization on the raw genes counts of these samples. Based on the bimodal distribution of the CQN-normalized and log2-transformed RPKM gene expression values, we removed genes whose average expressions in AD, MCI and control were all < 0, leaving 15,439 expressed genes. With the available temporal cortex samples from Mayo Clinic cohort, we performed CQN normalization on the raw genes counts of these samples, and removed genes whose average expressions in AD and control were both < 1, leaving 17,176 expressed genes. We calculated residual expression values of these genes from adjusting for the effects of RIN, which significantly contributed to the variation of the gene expression values (mean F ratio > 1.5). For the available cerebellum samples from Mayo Clinic cohort, after CQN normalization of the raw gene counts, we removed genes whose average expressions in AD and controls were both < 1, leaving 21,459 expressed genes. We calculated residual expression values of these genes from adjusting for the effects of RIN (mean F ratio > 1.5). The human genes were matched to the mouse gene names in order to perform module preservation analysis. Separate module preservation analyses were performed for the three datasets using WGCNA. In all analyses, module definitions from the mouse network were used as reference to calculate the z-summary statistics for each module. Z summary score > 2 suggests moderate preservation, and Z summary score >10 suggests strong preservation. The MEs of selected modules were compared between disease groups using Mann-Whitney U tests.
Module validation in human proteomics samples
We downloaded the previously published protein expression profiles from human dorsolateral prefrontal frontal cortex and anterior cingulate gyrus and calculated residual expression values of these samples from adjusting for the effects of batch and race, both significantly contributing to the variation of the protein expression values (mean F ratio > 1.5). To validate the pink and blue mouse modules in the human proteomics datasets, we matched the protein names to the module gene names, and calculated MEs of the matched proteins using WGCNA. The MEs of the pink and blue modules were compared between AD and control samples using Mann-Whitney U tests.
Differential metabolite expression analysis
Differential metabolite expression analyses were performed using Partek Genomics Suite (Partek Inc., St. Louis, MO). Metabolite expressions between different APOE genotypes, ages, and sexes were compared using ANOVA. The Bonferroni correction was applied to adjust for multiple testing. Differentially expressed metabolites (DEM) were defined by thresholds of Bonferroniadjusted p value < 0.05 and |FC| ≥ 1.2. Hierarchical clustering was performed in MATLAB using the Clustergram function based on standardized Euclidean distance metric.
Metabolite co-expression network analysis
WGCNA was performed using the metabolite expression values. Based on the relationship between power and scale independence, the power of 16 was chosen to build scale-free topology using unsigned network. We set the minimum modules size as 5, and merged modules whose correlation coefficients were greater than 0.85 (mergeCutHeight = 0.15). Each module was summarized by ME. Hub metabolites were selected based on the p values of MM. To assess the correlation of modules to APOE genotype, age and sex, we defined the APOE2 genotype as 0, APOE3 as 1, and APOE4 as 2; 3 months of age as 3, 12 months as 12, and 24 months as 24; male as 0 and female as 1. MEs of selected modules were compared between APOE genotypes, ages, and sexes using boxplots showing maximum and minimum values after Tukey’s test. The connections among top hub metabolites were visualized using VisANT version 5.51 (Hu et al., 2013).
Statistical Analyses for validation experiments
All data were reported as mean values ± SEM unless elsewise indicated. In order to ensure that results were valid in the presence of non-normal distributions, or differing variances between groups, nonparametric Mann-Whitney tests and Kruskal-Wallis tests with Dunn’s multiple comparison tests were used to compare outcomes. With sample size < 8, one-way ANOVA was used to compare outcomes among groups. All statistical tests were two-sided. The statistical tests used for each analysis, the numerosity of the experiments, and the significance levels were reported in the caption of each figure.
DATA AND CODE AVAILABILITY
Both the mouse transcriptomic and metabolomics datasets described in this study have been deposited in Synapse (https://www.synapse.org/) under the accession ID syn15682620 and syn15682634, respectively.
ADDITIONAL RESOURCES
Our mouse transcriptomic and metabolomics datasets are also available and can be visualized in the website http://www.gbulab.com/.
Supplementary Material
Table S1: WGCNA analyses of mouse brain transcriptomics data, Related to Figure 2
Table S2: One-way ANOVA analyses of mouse brain transcriptomics data, Related to Figure 5
Table S3: WGCNA analyses of mouse serum metabolomics data, Related to Figure 6
Table S4: One-way ANOVA analyses of mouse serum metabolomics data, Related to Figure 7
KEY RESOURCES TABLE
| REAGENT or RESOURCE | SOURCE | IDENTIFIER |
|---|---|---|
| Antibodies | ||
| Serpina3n | R&D systems | Cat# AF4709 |
| α-tubulin | Sigma | Cat# T9026 |
| β-actin | Cell Signaling Technology | Cat# 4967L |
| CD68 | Abcam | Cat# ab125212 |
| IBA1 | WAKO | Cat# 019–19741 |
| Chemicals | ||
| Trizol | Trizol | Trizol |
| RNeasy Mini Kit | RNeasy Mini Kit | RNeasy Mini Kit |
| Critical Commercial Assays | ||
| AbsoluteIDQ p180 kit | Biocrates | https://www.biocrates.com/products/research-products/absoluteidq-p180-kit |
| cBot and HiSeq 3000/4000 PE Cluster Kit | Illumina | RRID: SCR_010233 |
| TruSeq RNA Sample Prep Kit v2 | Illumina | RRID: SCR_010233 |
| HiSeq 3000/4000 sequencing kit | Illumina | RRID: SCR_010233 |
| HCS v3.3.52 collection software | Illumina | RRID: SCR_010233 |
| Mouse Serpina3 ELISA kit | Cusabio | Cat# CSB-E13727m |
| RNAscope® Multiplex Fluorescent Reagent Manual Assay Kit v2 | ACD | Cat #323100 |
| Deposited Data | ||
| Raw data and analysis for brain transcriptomics | This paper | https://www.synapse.org/ Synapse ID: syn15682620 |
| Raw data and analysis for serum metabolomics | This paper | https://www.synapse.org/ Synapse ID: syn15682634 |
| Mayo Clinic human brain RNA-seq raw data | (Allen et al., 2016) | https://www.synapse.org/ Synapse ID: syn5550404 |
| ROSMAP human brain RNA-seq raw data | (Bennett et al., 2018) | https://www.synapse.org/ Synapse ID: syn3219045 |
| Human brain proteomics raw data | (Ping et al., 2018) | https://www.synapse.org/ Synapse ID: syn10183278 |
| Mouse reference genome mm10 | Genome Reference Consortium | http://useast.ensembl.org/Musmusculus/Info/Annotation |
| Experimental Models: Organisms/Strains | ||
| Mouse/apoE2-TR (B6.129P2-Apoetm1(APOE2)Mae N9) | Taconic Biosciences | RRID: IMSR_TAC:1547 |
| Mouse/apoE3-TR (B6.129P2-Apoetm2(APOE3)Mae N8) | Taconic Biosciences | RRID: IMSR_TAC:1548 |
| Mouse/apoE4-TR (B6.129P2-Apoetm3(APOE4)Mae N8) | Taconic Biosciences | RRID: IMSR_TAC:1549 |
| Oligonucleotides | ||
| Mouse Serpina3n | ACD | Cat #430191 |
| DapB | ACD | Cat #310043 |
| Ppib | ACD | Cat #313911 |
| Software and Algorithms | ||
| RTA version 2.7.3 | Illumina | RRID: SCR_010233 |
| R version 3.4.2 | R Core Team | https://www.R-project.org/ |
| MAP-RSeq version 2.1.1 | (Kalari et al., 2014) | http://bioinformaticstools.mayo.edu/research/maprseq/ |
| TopHat version 2.1.0 | (Kim et al., 2013) | https://ccb.jhu.edu/software/tophat/index.shtml |
| Bowtie version 1.1.2 | (Langmead et al., 2009) | https://sourceforge.net/projects/bowtie-bio/files/bowtie/1.1.2/ |
| RSeQC version 2.6.2 | (Wang et al., 2012) | http://rseqc.sourceforge.net/ |
| featureCounts version 1.4.6-p5 | (Liao et al., 2014) | http://subread.sourceforge.net |
| CQN version 1.24.0 | (Hansen et al., 2012) | https://bioconductor.org/packages/release/bioc/vignettes/cqn/ |
| Partek Genomics Suite version 6.6 | Partek | http://www.partek.com/ |
| Ingenuity Pathway Analysis version 2019–05–15 | Qiagen | https://www.qiagenbioinformatics.com/products/ingenuitypathway-analysis |
| WGCNA version 1.61 | (Langfelder and Horvath, 2008) | https://horvath.genetics.ucla.edu/html/CoexpressionNetwork/Rpackages/WGCNA/ |
| anRichment version 0.82–1 | (Langfelder and Horvath, 2008) | https://horvath.genetics.ucla.edu/html/CoexpressionNetwork/GeneAnnotation/index.html |
| VisANT version 5.51 | (Hu et al., 2013) | http://visant.bu.edu/home2.htm |
| MATLAB | MathWorks | https://www.mathworks.com/products/matlab.html |
| Prism 7.0 | GraphPad Software | http://www.graphpad.com/ |
| Other | ||
| Resource website | This paper | http://www.gbulab.com/ |
Highlights:
Aging leads to the most profound changes in brain gene expression networks
Immune module led by Alzheimer’s risk genes Trem2/Tyrobp is upregulated with aging
Alzheimer’s risk allele APOE4 increases the expression of Serpina3 family genes
Alzheimer’s protective allele APOE2 drives unique serum metabolome profiles
Acknowledgments
We thank Dr. Patrick Sullivan (Duke University Medical Center, Durham, NC) for developing and contributing the apoE-TR mice. We are grateful to Monica Castanedes-Casey for histologic and immunohistochemical support. This work was supported by NIA grants RF1AG051504 (to G.B. and N.E.-T.); RF1AG057181, R37AG027924, R01AG035355, and RF1AG046205 (to G.B.); RF1AG062110 (to C.-C.L.); R21AG052423 (to T.K.); and BrightFocus Foundation Fellowship A2018777F (to N.Z.).
The Mayo Clinic human RNA-seq dataset were provided by the following sources: The Mayo Clinic Alzheimer’s Disease Genetic Studies, led by Dr. Nilüfer Ertekin-Taner and Dr. Steven G. Younkin, Mayo Clinic, Jacksonville, FL using samples from the Mayo Clinic Study of Aging, the Mayo Clinic Alzheimer’s Disease Research Center, and the Mayo Clinic Brain Bank. Data collection was supported through funding by NIA grants P50 AG016574, R01 AG032990, U01 AG046139, R01 AG018023, U01 AG006576, U01 AG006786, R01 AG025711, R01 AG017216, R01 AG003949, NINDS grant R01 NS080820, CurePSP Foundation, and support from Mayo Foundation. Study data includes samples collected through the Sun Health Research Institute Brain and Body Donation Program of Sun City, Arizona. The Brain and Body Donation Program is supported by the National Institute of Neurological Disorders and Stroke (U24 NS072026 National Brain and Tissue Resource for Parkinsons Disease and Related Disorders), the National Institute on Aging (P30 AG19610 Arizona Alzheimers Disease Core Center), the Arizona Department of Health Services (contract 211002, Arizona Alzheimers Research Center), the Arizona Biomedical Research Commission (contracts 4001, 0011, 05–901 and 1001 to the Arizona Parkinson’s Disease Consortium) and the Michael J. Fox Foundation for Parkinsons Research.
The Religious Orders Study and Rush Memory and Aging Project (ROSMAP) was supported by the NIA grants P30 AG10161, R01 AG15819, R01 AG17917, U01 AG51356.
Support for the metabolomics sample processing, assays and analytics reported here was provided by grants from the NIA, which supported the Alzheimer’s Disease Metabolomics Consortium led by Rima Kaddurah-Daouk at Duke University, part of NIA’s national initiatives AMP-AD and M2OVE-AD (R01 AG046171, RF1 AG051550).
Footnotes
Publisher's Disclaimer: This is a PDF file of an unedited manuscript that has been accepted for publication. As a service to our customers we are providing this early version of the manuscript. The manuscript will undergo copyediting, typesetting, and review of the resulting proof before it is published in its final form. Please note that during the production process errors may be discovered which could affect the content, and all legal disclaimers that apply to the journal pertain.
Declaration of Interests
Competing interests: M.A. is co-inventor on patent WO2018049268 in this field. The other authors declare no competing interests.
References
- Abraham CR, McGraw WT, Slot F, and Yamin R (2000). Alpha 1-antichymotrypsin inhibits A beta degradation in vitro and in vivo. Ann N Y Acad Sci 920, 245–248. [PubMed] [Google Scholar]
- Abraham CR, Selkoe DJ, and Potter H (1988). Immunochemical identification of the serine protease inhibitor alpha 1-antichymotrypsin in the brain amyloid deposits of Alzheimer’s disease. Cell 52, 487–501. [DOI] [PubMed] [Google Scholar]
- Abraham CR, Shirahama T, and Potter H (1990). Alpha 1-antichymotrypsin is associated solely with amyloid deposits containing the beta-protein. Amyloid and cell localization of alpha 1-antichymotrypsin. Neurobiol Aging 11, 123–129. [DOI] [PubMed] [Google Scholar]
- Allen M, Carrasquillo MM, Funk C, Heavner BD, Zou F, Younkin CS, Burgess JD, Chai HS, Crook J, Eddy JA, et al. (2016). Human whole genome genotype and transcriptome data for Alzheimer’s and other neurodegenerative diseases. Sci Data 3, 160089. [DOI] [PMC free article] [PubMed] [Google Scholar]
- Allen M, Wang X, Burgess JD, Watzlawik J, Serie DJ, Younkin CS, Nguyen T, Malphrus KG, Lincoln S, Carrasquillo MM, et al. (2018a). Conserved brain myelination networks are altered in Alzheimer’s and other neurodegenerative diseases. Alzheimers Dement 14, 352–366. [DOI] [PMC free article] [PubMed] [Google Scholar]
- Allen M, Wang X, Serie DJ, Strickland SL, Burgess JD, Koga S, Younkin CS, Nguyen TT, Malphrus KG, Lincoln SJ, et al. (2018b). Divergent brain gene expression patterns associate with distinct cell-specific tau neuropathology traits in progressive supranuclear palsy. Acta Neuropathol 136, 709–727. [DOI] [PMC free article] [PubMed] [Google Scholar]
- Altmann A, Tian L, Henderson VW, and Greicius MD (2014). Sex modifies the APOE-related risk of developing Alzheimer disease. Ann Neurol 75, 563–573. [DOI] [PMC free article] [PubMed] [Google Scholar]
- Baker C, Belbin O, Kalsheker N, and Morgan K (2007). SERPINA3 (aka alpha-1-antichymotrypsin). Front Biosci 12, 2821–2835. [DOI] [PubMed] [Google Scholar]
- Basso M, and Bonetto V (2016). Extracellular Vesicles and a Novel Form of Communication in the Brain. Front Neurosci 10, 127. [DOI] [PMC free article] [PubMed] [Google Scholar]
- Bennett DA, Buchman AS, Boyle PA, Barnes LL, Wilson RS, and Schneider JA (2018). Religious Orders Study and Rush Memory and Aging Project. J Alzheimers Dis 64, S161–S189. [DOI] [PMC free article] [PubMed] [Google Scholar]
- Blennow K, de Leon MJ, and Zetterberg H (2006). Alzheimer’s disease. Lancet 368, 387–403. [DOI] [PubMed] [Google Scholar]
- Boisvert MM, Erikson GA, Shokhirev MN, and Allen NJ (2018). The Aging Astrocyte Transcriptome from Multiple Regions of the Mouse Brain. Cell Rep 22, 269–285. [DOI] [PMC free article] [PubMed] [Google Scholar]
- Brookmeyer R, Gray S, and Kawas C (1998). Projections of Alzheimer’s disease in the United States and the public health impact of delaying disease onset. Am J Public Health 88, 1337–1342. [DOI] [PMC free article] [PubMed] [Google Scholar]
- Bu G (2009). Apolipoprotein E and its receptors in Alzheimer’s disease: pathways, pathogenesis and therapy. Nat Rev Neurosci 10, 333–344. [DOI] [PMC free article] [PubMed] [Google Scholar]
- Coleman BM, and Hill AF (2015). Extracellular vesicles--Their role in the packaging and spread of misfolded proteins associated with neurodegenerative diseases. Semin Cell Dev Biol 40, 89–96. [DOI] [PubMed] [Google Scholar]
- Colombo M, Raposo G, and Thery C (2014). Biogenesis, secretion, and intercellular interactions of exosomes and other extracellular vesicles. Annu Rev Cell Dev Biol 30, 255–289. [DOI] [PubMed] [Google Scholar]
- Conway OJ, Carrasquillo MM, Wang X, Bredenberg JM, Reddy JS, Strickland SL, Younkin CS, Burgess JD, Allen M, Lincoln SJ, et al. (2018). ABI3 and PLCG2 missense variants as risk factors for neurodegenerative diseases in Caucasians and African Americans. Mol Neurodegener 13, 53. [DOI] [PMC free article] [PubMed] [Google Scholar]
- Damoiseaux JS, Seeley WW, Zhou J, Shirer WR, Coppola G, Karydas A, Rosen HJ, Miller BL, Kramer JH, Greicius MD, et al. (2012). Gender modulates the APOE epsilon4 effect in healthy older adults: convergent evidence from functional brain connectivity and spinal fluid tau levels. J Neurosci 32, 8254–8262. [DOI] [PMC free article] [PubMed] [Google Scholar]
- Davis AA, Inman CE, Wargel ZM, Dube U, Freeberg BM, Galluppi A, Haines JN, Dhavale DD, Miller R, Choudhury FA, et al. (2020). APOE genotype regulates pathology and disease progression in synucleinopathy. Sci Transl Med 12. [DOI] [PMC free article] [PubMed] [Google Scholar]
- Deczkowska A, Keren-Shaul H, Weiner A, Colonna M, Schwartz M, and Amit I (2018). Disease-associated microglia: a universal immune sensor of neurodegeneration. Cell 173, 1073–1081. [DOI] [PubMed] [Google Scholar]
- Delpech JC, Herron S, Botros MB, and Ikezu T (2019). Neuroimmune Crosstalk through Extracellular Vesicles in Health and Disease. Trends Neurosci 42, 361–372. [DOI] [PMC free article] [PubMed] [Google Scholar]
- Effenberger T, von der Heyde J, Bartsch K, Garbers C, Schulze-Osthoff K, Chalaris A, Murphy G, Rose-John S, and Rabe B (2014). Senescence-associated release of transmembrane proteins involves proteolytic processing by ADAM17 and microvesicle shedding. FASEB J 28, 4847–4856. [DOI] [PubMed] [Google Scholar]
- Falcao AM, van Bruggen D, Marques S, Meijer M, Jakel S, Agirre E, Samudyata, Floriddia EM, Vanichkina DP, Ffrench-Constant C, et al. (2018). Disease-specific oligodendrocyte lineage cells arise in multiple sclerosis. Nat Med 24, 1837–1844. [DOI] [PMC free article] [PubMed] [Google Scholar]
- Farrer LA, Cupples LA, Haines JL, Hyman B, Kukull WA, Mayeux R, Myers RH, Pericak-Vance MA, Risch N, and van Duijn CM (1997). Effects of age, sex, and ethnicity on the association between apolipoprotein E genotype and Alzheimer disease. A meta-analysis. APOE and Alzheimer Disease Meta Analysis Consortium. JAMA 278, 1349–1356. [PubMed] [Google Scholar]
- Fernandez CG, Hamby ME, McReynolds ML, and Ray WJ (2019). The Role of APOE4 in Disrupting the Homeostatic Functions of Astrocytes and Microglia in Aging and Alzheimer’s Disease. Front Aging Neurosci 11, 14. [DOI] [PMC free article] [PubMed] [Google Scholar]
- Fu H, Hardy J, and Duff KE (2018). Selective vulnerability in neurodegenerative diseases. Nat Neurosci 21, 1350–1358. [DOI] [PMC free article] [PubMed] [Google Scholar]
- Gerakis Y, and Hetz C (2018). Emerging roles of ER stress in the etiology and pathogenesis of Alzheimer’s disease. FEBS J 285, 995–1011. [DOI] [PubMed] [Google Scholar]
- Guerreiro R, Wojtas A, Bras J, Carrasquillo M, Rogaeva E, Majounie E, Cruchaga C, Sassi C, Kauwe JS, Younkin S, et al. (2013). TREM2 variants in Alzheimer’s disease. N Engl J Med 368, 117–127. [DOI] [PMC free article] [PubMed] [Google Scholar]
- Hansen KD, Irizarry RA, and Wu Z (2012). Removing technical variability in RNA-seq data using conditional quantile normalization. Biostatistics 13, 204–216. [DOI] [PMC free article] [PubMed] [Google Scholar]
- Hebert LE, Weuve J, Scherr PA, and Evans DA (2013). Alzheimer disease in the United States (2010–2050) estimated using the 2010 census. Neurology 80, 1778–1783. [DOI] [PMC free article] [PubMed] [Google Scholar]
- Heit C, Jackson BC, McAndrews M, Wright MW, Thompson DC, Silverman GA, Nebert DW, and Vasiliou V (2013). Update of the human and mouse SERPIN gene superfamily. Hum Genomics 7, 22. [DOI] [PMC free article] [PubMed] [Google Scholar]
- Holtzman DM, Herz J, and Bu G (2012). Apolipoprotein E and apolipoprotein E receptors: normal biology and roles in Alzheimer disease. Cold Spring Harb Perspect Med 2, a006312. [DOI] [PMC free article] [PubMed] [Google Scholar]
- Horvath AJ, Irving JA, Rossjohn J, Law RH, Bottomley SP, Quinsey NS, Pike RN, Coughlin PB, and Whisstock JC (2005). The murine orthologue of human antichymotrypsin: a structural paradigm for clade A3 serpins. J Biol Chem 280, 43168–43178. [DOI] [PubMed] [Google Scholar]
- Hu J, Liu CC, Chen XF, Zhang YW, Xu H, and Bu G (2015). Opposing effects of viral mediated brain expression of apolipoprotein E2 (apoE2) and apoE4 on apoE lipidation and Abeta metabolism in apoE4-targeted replacement mice. Mol Neurodegener 10, 6. [DOI] [PMC free article] [PubMed] [Google Scholar]
- Hu Z, Chang YC, Wang Y, Huang CL, Liu Y, Tian F, Granger B, and Delisi C (2013). VisANT 4.0: Integrative network platform to connect genes, drugs, diseases and therapies. Nucleic Acids Res 41, W225–231. [DOI] [PMC free article] [PubMed] [Google Scholar]
- Irving JA, Pike RN, Lesk AM, and Whisstock JC (2000). Phylogeny of the serpin superfamily: implications of patterns of amino acid conservation for structure and function. Genome Res 10, 1845–1864. [DOI] [PubMed] [Google Scholar]
- Jonsson T, Stefansson H, Steinberg S, Jonsdottir I, Jonsson PV, Snaedal J, Bjornsson S, Huttenlocher J, Levey AI, Lah JJ, et al. (2013). Variant of TREM2 associated with the risk of Alzheimer’s disease. N Engl J Med 368, 107–116. [DOI] [PMC free article] [PubMed] [Google Scholar]
- Kalari KR, Nair AA, Bhavsar JD, O’Brien DR, Davila JI, Bockol MA, Nie J, Tang X, Baheti S, Doughty JB, et al. (2014). MAP-RSeq: Mayo Analysis Pipeline for RNA sequencing. BMC Bioinformatics 15, 224. [DOI] [PMC free article] [PubMed] [Google Scholar]
- Kanekiyo T, Xu H, and Bu G (2014). ApoE and Abeta in Alzheimer’s disease: accidental encounters or partners? Neuron 81, 740–754. [DOI] [PMC free article] [PubMed] [Google Scholar]
- Kang SS, Ebbert MTW, Baker KE, Cook C, Wang X, Sens JP, Kocher JP, Petrucelli L, and Fryer JD (2018). Microglial translational profiling reveals a convergent APOE pathway from aging, amyloid, and tau. J Exp Med 215, 2235–2245. [DOI] [PMC free article] [PubMed] [Google Scholar]
- Karjalainen JP, Mononen N, Hutri-Kahonen N, Lehtimaki M, Juonala M, Ala-Korpela M, Kahonen M, Raitakari O, and Lehtimaki T (2019). The effect of apolipoprotein E polymorphism on serum metabolome - a population-based 10-year follow-up study. Sci Rep 9, 458. [DOI] [PMC free article] [PubMed] [Google Scholar]
- Keren-Shaul H, Spinrad A, Weiner A, Matcovitch-Natan O, Dvir-Szternfeld R, Ulland TK, David E, Baruch K, Lara-Astaiso D, Toth B, et al. (2017). A Unique Microglia Type Associated with Restricting Development of Alzheimer’s Disease. Cell 169, 1276–1290 e1217. [DOI] [PubMed] [Google Scholar]
- Kim D, Pertea G, Trapnell C, Pimentel H, Kelley R, and Salzberg SL (2013). TopHat2: accurate alignment of transcriptomes in the presence of insertions, deletions and gene fusions. Genome Biol 14, R36. [DOI] [PMC free article] [PubMed] [Google Scholar]
- Kowal RC, Herz J, Weisgraber KH, Mahley RW, Brown MS, and Goldstein JL (1990). Opposing effects of apolipoproteins E and C on lipoprotein binding to low density lipoprotein receptor-related protein. J Biol Chem 265, 10771–10779. [PubMed] [Google Scholar]
- Kramer A, Green J, Pollard J Jr., and Tugendreich S (2014). Causal analysis approaches in Ingenuity Pathway Analysis. Bioinformatics 30, 523–530. [DOI] [PMC free article] [PubMed] [Google Scholar]
- Lahoz C, Schaefer EJ, Cupples LA, Wilson PW, Levy D, Osgood D, Parpos S, Pedro-Botet J, Daly JA, and Ordovas JM (2001). Apolipoprotein E genotype and cardiovascular disease in the Framingham Heart Study. Atherosclerosis 154, 529–537. [DOI] [PubMed] [Google Scholar]
- Langfelder P, and Horvath S (2008). WGCNA: an R package for weighted correlation network analysis. BMC Bioinformatics 9, 559. [DOI] [PMC free article] [PubMed] [Google Scholar]
- Langmead B, Trapnell C, Pop M, and Salzberg SL (2009). Ultrafast and memory-efficient alignment of short DNA sequences to the human genome. Genome Biol 10, R25. [DOI] [PMC free article] [PubMed] [Google Scholar]
- Law RH, Zhang Q, McGowan S, Buckle AM, Silverman GA, Wong W, Rosado CJ, Langendorf CG, Pike RN, Bird PI, et al. (2006). An overview of the serpin superfamily. Genome Biol 7, 216. [DOI] [PMC free article] [PubMed] [Google Scholar]
- Liao Y, Smyth GK, and Shi W (2014). featureCounts: an efficient general purpose program for assigning sequence reads to genomic features. Bioinformatics 30, 923–930. [DOI] [PubMed] [Google Scholar]
- Liu CC, Zhao N, Fu Y, Wang N, Linares C, Tsai CW, and Bu G (2017). ApoE4 Accelerates Early Seeding of Amyloid Pathology. Neuron 96, 1024–1032 e1023. [DOI] [PMC free article] [PubMed] [Google Scholar]
- Loy CT, Schofield PR, Turner AM, and Kwok JB (2014). Genetics of dementia. Lancet 383, 828–840. [DOI] [PubMed] [Google Scholar]
- Mahley RW (2016). Central Nervous System Lipoproteins: ApoE and Regulation of Cholesterol Metabolism. Arterioscler Thromb Vasc Biol 36, 1305–1315. [DOI] [PMC free article] [PubMed] [Google Scholar]
- Maly DJ, and Papa FR (2014). Druggable sensors of the unfolded protein response. Nat Chem Biol 10, 892–901. [DOI] [PMC free article] [PubMed] [Google Scholar]
- Mapstone M, Cheema AK, Fiandaca MS, Zhong X, Mhyre TR, MacArthur LH, Hall WJ, Fisher SG, Peterson DR, Haley JM, et al. (2014). Plasma phospholipids identify antecedent memory impairment in older adults. Nat Med 20, 415–418. [DOI] [PMC free article] [PubMed] [Google Scholar]
- Mayeux R, Saunders AM, Shea S, Mirra S, Evans D, Roses AD, Hyman BT, Crain B, Tang MX, and Phelps CH (1998). Utility of the apolipoprotein E genotype in the diagnosis of Alzheimer’s disease. Alzheimer’s Disease Centers Consortium on Apolipoprotein E and Alzheimer’s Disease. N Engl J Med 338, 506–511. [DOI] [PubMed] [Google Scholar]
- Mazure CM, and Swendsen J (2016). Sex differences in Alzheimer’s disease and other dementias. Lancet Neurol 15, 451–452. [DOI] [PMC free article] [PubMed] [Google Scholar]
- McGeer PL, McGeer E, Rogers J, and Sibley J (1990). Anti-inflammatory drugs and Alzheimer disease. Lancet 335, 1037. [DOI] [PubMed] [Google Scholar]
- Michaelson DM (2014). APOE epsilon4: the most prevalent yet understudied risk factor for Alzheimer’s disease. Alzheimers Dement 10, 861–868. [DOI] [PubMed] [Google Scholar]
- Neu SC, Pa J, Kukull W, Beekly D, Kuzma A, Gangadharan P, Wang LS, Romero K, Arneric SP, Redolfi A, et al. (2017). Apolipoprotein E Genotype and Sex Risk Factors for Alzheimer Disease A Meta-analysis. Jama Neurol 74, 1178–1189. [DOI] [PMC free article] [PubMed] [Google Scholar]
- Padmanabhan J, Levy M, Dickson DW, and Potter H (2006). Alpha1-antichymotrypsin, an inflammatory protein overexpressed in Alzheimer’s disease brain, induces tau phosphorylation in neurons. Brain 129, 3020–3034. [DOI] [PubMed] [Google Scholar]
- Pasternack JM, Abraham CR, Van Dyke BJ, Potter H, and Younkin SG (1989). Astrocytes in Alzheimer’s disease gray matter express alpha 1-antichymotrypsin mRNA. Am J Pathol 135, 827–834. [PMC free article] [PubMed] [Google Scholar]
- Pathan M, Fonseka P, Chitti SV, Kang T, Sanwlani R, Van Deun J, Hendrix A, and Mathivanan S (2019). Vesiclepedia 2019: a compendium of RNA, proteins, lipids and metabolites in extracellular vesicles. Nucleic Acids Res 47, D516–D519. [DOI] [PMC free article] [PubMed] [Google Scholar]
- Payami H, Montee KR, Kaye JA, Bird TD, Yu CE, Wijsman EM, and Schellenberg GD (1994). Alzheimer’s disease, apolipoprotein E4, and gender. JAMA 271, 1316–1317. [PubMed] [Google Scholar]
- Perez-Nievas BG, and Serrano-Pozo A (2018). Deciphering the Astrocyte Reaction in Alzheimer’s Disease. Front Aging Neurosci 10, 114. [DOI] [PMC free article] [PubMed] [Google Scholar]
- Phillips MC (2014). Apolipoprotein E isoforms and lipoprotein metabolism. IUBMB Life 66, 616–623. [DOI] [PubMed] [Google Scholar]
- Ping L, Duong DM, Yin L, Gearing M, Lah JJ, Levey AI, and Seyfried NT (2018). Global quantitative analysis of the human brain proteome in Alzheimer’s and Parkinson’s Disease. Sci Data 5, 180036. [DOI] [PMC free article] [PubMed] [Google Scholar]
- Pitale PM, Gorbatyuk O, and Gorbatyuk M (2017). Neurodegeneration: Keeping ATF4 on a Tight Leash. Front Cell Neurosci 11, 410. [DOI] [PMC free article] [PubMed] [Google Scholar]
- Poliani PL, Wang Y, Fontana E, Robinette ML, Yamanishi Y, Gilfillan S, and Colonna M (2015). TREM2 sustains microglial expansion during aging and response to demyelination. J Clin Invest 125, 2161–2170. [DOI] [PMC free article] [PubMed] [Google Scholar]
- Rangaraju S, Dammer EB, Raza SA, Rathakrishnan P, Xiao H, Gao T, Duong DM, Pennington MW, Lah JJ, Seyfried NT, et al. (2018). Identification and therapeutic modulation of a pro-inflammatory subset of disease-associated-microglia in Alzheimer’s disease. Molecular neurodegeneration 13, 24. [DOI] [PMC free article] [PubMed] [Google Scholar]
- Rasmussen KL, Tybjaerg-Hansen A, Nordestgaard BG, and Frikke-Schmidt R (2015). Plasma levels of apolipoprotein E and risk of dementia in the general population. Ann Neurol 77, 301–311. [DOI] [PubMed] [Google Scholar]
- Sala Frigerio C, Wolfs L, Fattorelli N, Thrupp N, Voytyuk I, Schmidt I, Mancuso R, Chen WT, Woodbury ME, Srivastava G, et al. (2019). The Major Risk Factors for Alzheimer’s Disease: Age, Sex, and Genes Modulate the Microglia Response to Abeta Plaques. Cell Rep 27, 1293–1306 e1296. [DOI] [PMC free article] [PubMed] [Google Scholar]
- Scheper W, and Hoozemans JJ (2015). The unfolded protein response in neurodegenerative diseases: a neuropathological perspective. Acta Neuropathol 130, 315–331. [DOI] [PMC free article] [PubMed] [Google Scholar]
- Schneider WJ, Kovanen PT, Brown MS, Goldstein JL, Utermann G, Weber W, Havel RJ, Kotite L, Kane JP, Innerarity TL, et al. (1981). Familial dysbetalipoproteinemia. Abnormal binding of mutant apoprotein E to low density lipoprotein receptors of human fibroblasts and membranes from liver and adrenal of rats, rabbits, and cows. J Clin Invest 68, 1075–1085. [DOI] [PMC free article] [PubMed] [Google Scholar]
- Shi Y, Yamada K, Liddelow SA, Smith ST, Zhao L, Luo W, Tsai RM, Spina S, Grinberg LT, Rojas JC, et al. (2017). ApoE4 markedly exacerbates tau-mediated neurodegeneration in a mouse model of tauopathy. Nature 549, 523–527. [DOI] [PMC free article] [PubMed] [Google Scholar]
- Shinohara M, Kanekiyo T, Yang L, Linthicum D, Shinohara M, Fu Y, Price L, Frisch-Daiello JL, Han X, Fryer JD, et al. (2016). APOE2 eases cognitive decline during Aging: Clinical and preclinical evaluations. Ann Neurol 79, 758–774. [DOI] [PMC free article] [PubMed] [Google Scholar]
- Song WM, and Colonna M (2018). The identity and function of microglia in neurodegeneration. Nat Immunol 19, 1048–1058. [DOI] [PubMed] [Google Scholar]
- St John-Williams L, Blach C, Toledo JB, Rotroff DM, Kim S, Klavins K, Baillie R, Han X, Mahmoudiandehkordi S, Jack J, et al. (2017). Targeted metabolomics and medication classification data from participants in the ADNI1 cohort. Sci Data 4, 170140. [DOI] [PMC free article] [PubMed] [Google Scholar]
- Sullivan PM, Mezdour H, Aratani Y, Knouff C, Najib J, Reddick RL, Quarfordt SH, and Maeda N (1997). Targeted replacement of the mouse apolipoprotein E gene with the common human APOE3 allele enhances diet-induced hypercholesterolemia and atherosclerosis. J Biol Chem 272, 17972–17980. [DOI] [PubMed] [Google Scholar]
- Tachibana M, Holm ML, Liu CC, Shinohara M, Aikawa T, Oue H, Yamazaki Y, Martens YA, Murray ME, Sullivan PM, et al. (2019). APOE4-mediated amyloid-beta pathology depends on its neuronal receptor LRP1. J Clin Invest 129, 1272–1277. [DOI] [PMC free article] [PubMed] [Google Scholar]
- Uddin MS, Stachowiak A, Mamun AA, Tzvetkov NT, Takeda S, Atanasov AG, Bergantin LB, Abdel-Daim MM, and Stankiewicz AM (2018). Autophagy and Alzheimer’s Disease: From Molecular Mechanisms to Therapeutic Implications. Front Aging Neurosci 10, 04. [DOI] [PMC free article] [PubMed] [Google Scholar]
- Ulland TK, and Colonna M (2018). TREM2 - a key player in microglial biology and Alzheimer disease. Nat Rev Neurol 14, 667–675. [DOI] [PubMed] [Google Scholar]
- Walker DG, and Lue LF (2015). Immune phenotypes of microglia in human neurodegenerative disease: challenges to detecting microglial polarization in human brains. Alzheimers Res Ther 7, 56. [DOI] [PMC free article] [PubMed] [Google Scholar]
- Walter P, and Ron D (2011). The unfolded protein response: from stress pathway to homeostatic regulation. Science 334, 1081–1086. [DOI] [PubMed] [Google Scholar]
- Wang L, Wang S, and Li W (2012). RSeQC: quality control of RNA-seq experiments. Bioinformatics 28, 2184–2185. [DOI] [PubMed] [Google Scholar]
- Wilson PW, Myers RH, Larson MG, Ordovas JM, Wolf PA, and Schaefer EJ (1994). Apolipoprotein E alleles, dyslipidemia, and coronary heart disease. The Framingham Offspring Study. JAMA 272, 1666–1671. [PubMed] [Google Scholar]
- Xia X, Jiang Q, McDermott J, and Han JJ (2018). Aging and Alzheimer’s disease: Comparison and associations from molecular to system level. Aging Cell 17, e12802. [DOI] [PMC free article] [PubMed] [Google Scholar]
- Yamazaki Y, and Kanekiyo T (2017). Blood-Brain Barrier Dysfunction and the Pathogenesis of Alzheimer’s Disease. Int J Mol Sci 18. [DOI] [PMC free article] [PubMed] [Google Scholar]
- Yamazaki Y, Zhao N, Caulfield TR, Liu CC, and Bu G (2019). Apolipoprotein E and Alzheimer disease: pathobiology and targeting strategies. Nat Rev Neurol 15, 501–518. [DOI] [PMC free article] [PubMed] [Google Scholar]
- Zamanian JL, Xu L, Foo LC, Nouri N, Zhou L, Giffard RG, and Barres BA (2012). Genomic analysis of reactive astrogliosis. J Neurosci 32, 6391–6410. [DOI] [PMC free article] [PubMed] [Google Scholar]
- Zhang B, Gaiteri C, Bodea LG, Wang Z, McElwee J, Podtelezhnikov AA, Zhang C, Xie T, Tran L, Dobrin R, et al. (2013). Integrated systems approach identifies genetic nodes and networks in late-onset Alzheimer’s disease. Cell 153, 707–720. [DOI] [PMC free article] [PubMed] [Google Scholar]
- Zhang B, and Horvath S (2005). A general framework for weighted gene co-expression network analysis. Stat Appl Genet Mol Biol 4, Article17. [DOI] [PubMed] [Google Scholar]
- Zhao N, Attrebi ON, Ren Y, Qiao W, Sonustun B, Martens YA, Meneses AD, Li F, Shue F, Zheng J, et al. (2020). APOE4 exacerbates alpha-synuclein pathology and related toxicity independent of amyloid. Sci Transl Med 12. [DOI] [PMC free article] [PubMed] [Google Scholar]
- Zhao N, Liu CC, Qiao W, and Bu G (2018a). Apolipoprotein E, Receptors, and Modulation of Alzheimer’s Disease. Biol Psychiatry 83, 347–357. [DOI] [PMC free article] [PubMed] [Google Scholar]
- Zhao N, Liu CC, Van Ingelgom AJ, Linares C, Kurti A, Knight JA, Heckman MG, Diehl NN, Shinohara M, Martens YA, et al. (2018b). APOE epsilon2 is associated with increased tau pathology in primary tauopathy. Nat Commun 9, 4388. [DOI] [PMC free article] [PubMed] [Google Scholar]
- Zhao N, Liu CC, Van Ingelgom AJ, Martens YA, Linares C, Knight JA, Painter MM, Sullivan PM, and Bu G (2017a). Apolipoprotein E4 Impairs Neuronal Insulin Signaling by Trapping Insulin Receptor in the Endosomes. Neuron 96, 115–129 e115. [DOI] [PMC free article] [PubMed] [Google Scholar]
- Zhao QR, Lei YY, Li J, Jiang N, and Shi JP (2017b). Association between apolipoprotein E polymorphisms and premature coronary artery disease: a meta-analysis. Clin Chem Lab Med 55, 284–298. [DOI] [PubMed] [Google Scholar]
- Zhu Y, Nwabuisi-Heath E, Dumanis SB, Tai LM, Yu C, Rebeck GW, and LaDu MJ (2012). APOE genotype alters glial activation and loss of synaptic markers in mice. Glia 60, 559–569. [DOI] [PMC free article] [PubMed] [Google Scholar]
Associated Data
This section collects any data citations, data availability statements, or supplementary materials included in this article.
Supplementary Materials
Table S1: WGCNA analyses of mouse brain transcriptomics data, Related to Figure 2
Table S2: One-way ANOVA analyses of mouse brain transcriptomics data, Related to Figure 5
Table S3: WGCNA analyses of mouse serum metabolomics data, Related to Figure 6
Table S4: One-way ANOVA analyses of mouse serum metabolomics data, Related to Figure 7
Data Availability Statement
Both the mouse transcriptomic and metabolomics datasets described in this study have been deposited in Synapse (https://www.synapse.org/) under the accession ID syn15682620 and syn15682634, respectively.