Abstract
In tissue engineering experiments in vitro, bioreactors have been used for applying wall shear stress (WSS) on cells to regulate cellular activities. To determine the loading conditions within bioreactors and to design tissue engineering products, in silico models are used. Previous in silico studies in bone tissue engineering (BTE) focused on quantifying the WSS on cells and the influence on appositional tissue growth. However, many BTE experiments also show interstitial tissue formation (i.e., tissue infiltrated in the pores rather than growing on the struts ‐ appositional growth), which has not been considered in previous in silico studies. We hereby used a multiscale fluid‐solid interaction model to quantify the WSS and mechanical strain on cells with interstitial tissue formation, taken from a reported BTE experiment. The WSS showed a high variation among different interstitial tissue morphologies. This is different to the situation under appositional tissue growth. It is found that a 35% filling of the pores results (by mineralised bone tissue) when the average WSS increases from 1.530 (day 0) to 5.735 mPa (day 28). Furthermore, the mechanical strain on cells caused by the fluid flow was extremely low (at the level of 10−14‐10−15), comparing to the threshold in a previous mechanobiological theory of osteogenesis (eg, 10−2). The output from this study offers a significant insight of the WSS changes during interstitial tissue growth under a constant perfusion flow rate in a BTE experiment. It has paved the way for optimising the local micro‐fluidic environment for interstitial tissue mineralisation.
Keywords: fluid‐solid interaction, interstitial tissue, mechanical stimulation, tissue engineering, wall shear stress
A multiscale fluid‐solid interaction approach is used for quantifying the cellular mechanical stimulation during interstitial tissue formation in a previously reported bone tissue engineering experiment. It is found that:

WSS has high variation among different interstitial tissue morphologies;
35% filling of the pores results (by mineralised bone tissue) when the average WSS increases from 1.530 (day 0) to 5.735 mPa (day 28).
Novelty.
Mechanical stimulation in terms of fluid‐induced wall shear stress (WSS) can affect the activity of cells. In tissue engineering experiments in vitro, bioreactors have been used for applying WSS on cells. To determine the loading conditions within bioreactors and to design tissue engineering products (e.g., scaffolds, bioreactors), in silico models are usually used. Previous in silico studies in bone tissue engineering (BTE) have focused on quantifying the WSS on cells and how it affects appositional tissue growth within scaffolds. However, many tissue engineering experiments in vitro also show interstitial tissue formation (i.e., tissue infiltrated in the pores rather than growing on the struts) that will influence the mechanical stimulation on cells, but is neglected in the simulation. In this study, we use a multiscale fluid‐solid interaction model to quantify the mechanical stimulation (i.e., WSS and mechanical strain) on cells under interstitial tissue formation, based on a previously reported BTE experiment. This is the first study, which reveals the mechanical stimulation on cells under interstitial tissue growth within scaffold. The output from this study offers an insight of the WSS changes during interstitial tissue growth under a constant perfusion flow rate in BTE experiment. Furthermore, the WSS range obtained from this study has paved the way for optimising the local micro‐fluidic environment for interstitial tissue mineralisation through either designing the local scaffold geometry or adjusting the bioreactor loading condition.
1. INTRODUCTION
In bone tissue engineering (BTE), cells seeded onto porous scaffolds can be stimulated to mineralise their extracellular matrix (ECM) by fluid‐induced wall shear stress (WSS). 1 To achieve this, bioreactors have been used in vitro to apply flow‐induced WSS on cells within scaffolds. 2 Among different types of bioreactors, perfusion bioreactors, which can perfuse the medium through the cell‐seeded scaffold, have commonly been used due to their capability to generate a uniformly distributed flow comparing to other bioreactors (e.g., spinner flask and rotating wall vessel).2, 3 The flow‐induced WSS at the level of the cells, however, is dependent on many factors, for example, scaffold permeability, scaffold micro‐structural geometry, fluid viscosity, etc. Computational models (e.g., computational fluid dynamics [CFD], multiphasic finite element [FE]) have been used for calculating the local WSS for a variety of applied flow rates.4, 5, 6, 7, 8 In most previous CFD analyses, the models merely included the empty scaffold geometries which were obtained either from computer aided design (CAD) or micro‐computer tomography (μCT) scanning images.7, 8, 9, 10, 11 It was assumed that cells were initially attached flatly onto the scaffold surface prior to ECM deposition with the underlying assumption that the solid volume of cells was negligible and would not affect the fluid flow comparing to that in the empty scaffold.7, 9, 10, 11 Such models were then for example used to calculate a flow rate, which could generate a local WSS distribution in the range for stimulating the cells, for example, 0.1 to 10 mPa for supporting the differentiation of mesenchymal stromal cells (MSCs) towards the osteogenic lineage. 12 In tissue engineering experiments, however, the scaffold pores are gradually filled by newly formed tissue, which will lead to a change in the fluid velocity and the WSS over time.6, 13, 14 In order to keep the mechanical stimulation within a range favourable for the cells, the fluid flow should be adapted accordingly over time.
For tissue formation within scaffolds, two different types can be distinguished: (a) appositional growth and (b) interstitial growth. Appositional tissue growth occurs when the cells are flatly attached to the scaffold surfaces and deposit ECM underneath themselves, so that ECM production results in a thickening of the scaffold struts.10, 15, 16 In interstitial tissue growth, the cells attach across the pores and produce ECM that will gradually infiltrate the void of the scaffold pores.9, 17, 18 For either of the tissue formation types, the overall scaffold permeability is decreasing with the filling of the pores, so through a reduction in porosity.19, 20 This would lead to changes in the WSS sensed by the cells. 6 Estimation of the WSS based on the empty scaffold geometry is not accurate anymore to determine the mechanical stimulation at later time points.
Recent computational (in silico) studies have quantified the mechanical stimulation of cells in models that included appositional tissue growth within the scaffold.6, 13, 14 For instance, it was found that the average WSS on the tissue was increased from 3.4 to 5.0 mPa with an increase of tissue volume fraction of 50% within an arbitrary scaffold with square pore shapes. 6 Other recent computational studies, however, have shown that fluid flow can cause considerable single cell deformation for cells bridging across the pores.21, 22 For example, a fluid velocity of 100 μm/s can result in a cell strain up to almost 18%, 21 suggesting that such fluid flow rates can cause strains high enough to stimulate the osteogenic differentiation of adipose‐derived stem cells according to Virjula et al. 23 However, the resultant strain of cells embedded in the interstitial tissue under perfusion flow is still unknown. Furthermore, in addition to the potential cellular strain, the interstitial tissue growth will also increase the fluid flow due to the lower permeability, hence resulting in a higher WSS. Furthermore, according to the computational quantification of the mechanical stimulation (WSS and mechanical strain in cells), the cells that infiltrated or bridged the pores receive higher mechanical stimulation than those flatly attached on the struts surface. 21 Differences in attachment (bridged vs flatly attached) will result in differences in tissue formation (interstitial vs appositional). 24 Interstitial tissue growth can potentially have a much more dramatic effect on the cell stimulation than appositional tissue filling. Therefore, computational models based on either empty scaffolds or merely accounting for appositional tissue growth will not be likely to provide accurate predictions of mechanical stimulation in case of interstitial tissue growth. Yet it is still unclear if a change in mechanical stimulation over time due to interstitial tissue formation is substantial enough to result in cell WSS and strain values beyond the range that is required for optimal stimulation of cells in BTE in vitro.
This study employs a computational multiscale fluid‐solid interaction (FSI) approach to quantify the mechanical stimulation (ie, WSS and strain) that the cells might be subjected to with interstitial tissue formation. Our computational investigation was based on a previous BTE experiment (e.g., bioreactor setup, flow rate, scaffold geometric features, volume fractions of tissue and mineralised bone tissue). Therefore, the overall aim of this study is to quantify the changes in mechanical stimulation of cells due to interstitial tissue formation in a perfusion bioreactor environment.
2. METHODS
2.1. Previously reported bone tissue engineering experiment
This computational study was based on a previously published BTE experiment that used a cylindrical scaffold made from β‐tricalcium phosphate (β‐TCP) ceramic with a central channel through which it was perfused. 18 The porous region had a regular and spherical pore shape with an average pore diameter of 530 μm and a homogeneous porosity of 75%. In the experiment, a perfusion flow rate of 3 mL/min was applied through a peristaltic pump (Figure 1). In a previous study, it was reported that β‐TCP the ceramic scaffold with a porosity of 75% has an overall Young's modulus of 48.7 MPa. 25 Therefore, the scaffold deformation under perfusion flow was ignored in this study.
FIGURE 1.
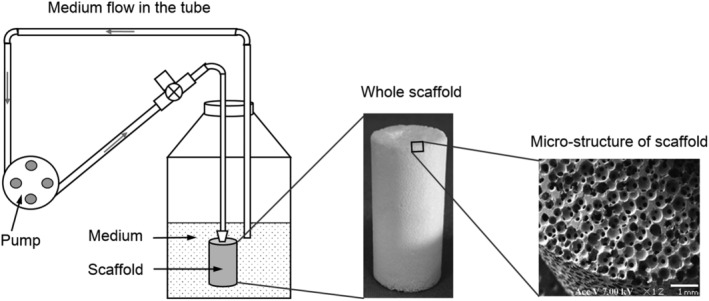
Setup of the bone tissue engineering experiment (adapted from Reference 18)
In their study, 18 Li et al found that the cells were flatly attached at the scaffold struts surfaces at day 0, while at day 28, interstitial cells and ECM formed with a volume fraction of 50% (cells plus ECM). As shown in the histological images (Figure 2A), the tissue displayed a wide variety of morphologies at day 28.
FIGURE 2.
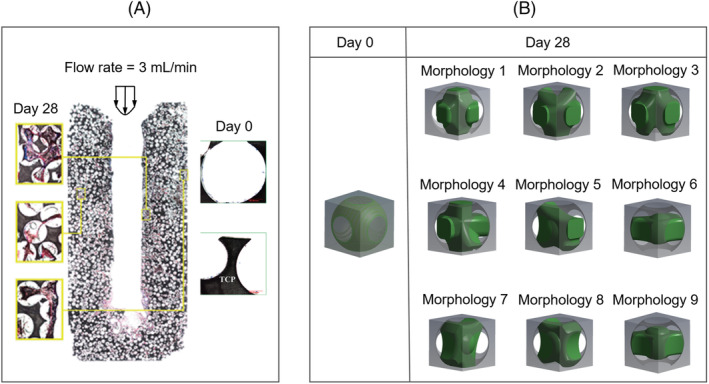
A, Histological images that show the observed morphologies of cell/ECM within the scaffold at day 0 and day 28 (adapted from Reference 18), B, idealised morphologies of cell/ECM at day 0 and day 28 for the computational model. ECM, extracellular matrix
2.2. Multiscale computational model
To quantify the mechanical stimulation received by the cells, a multiscale computational model based on a previous developed multiscale CFD model 26 was used. The micro models represented a unit scaffold pore infiltrated with cells and ECM, while the macro model represented the full scaffold (Figure 3).
FIGURE 3.
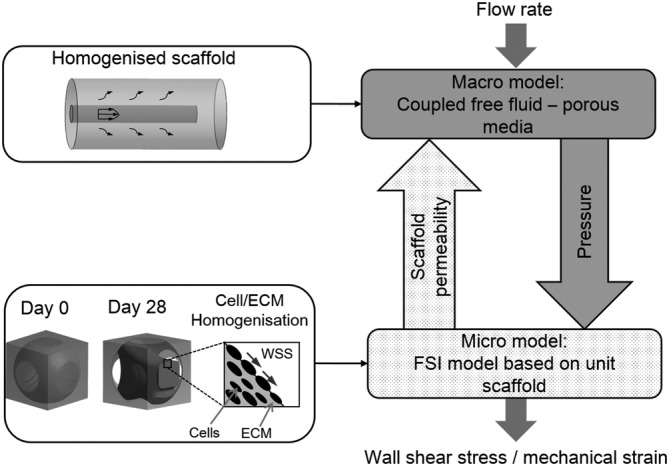
Flowchart of the multiscale computational model for computing the mechanical stimulation on cells (adapted from Reference 26)
In this study, the cell/ECM mixture was homogenised (Figure 3) and modelled as a hyperelastic solid. Based on the tissue morphologies exhibited in the histological images (e.g., Figure 2A), also considering one or more processes attaching on the struts to support the interstitial tissue, we identified nine basic morphologies of the interstitial cell/ECM. According to the results in Li et al, 18 the tissue occupied 50% of the porous volume. To recreate the tissue with a volume fraction of 50%, nine morphologies were created by CAD in ANSYS DesignModeler (ANSYS, Inc., Pennsylvania, USA) with the specific dimensions in the Appendix S1. At day 0, no interstitial tissue was assumed, instead, a uniform cell layer attached to the strut surface with a thickness of 5 μm was modelled (day 0 in Figure 2B). The cell layer geometry was also constructed by CAD in ANSYS DesignModeler. A CFD analysis was performed in ANSYS CFX for all the nine micro models to calculate their permeability. Afterwards, their average permeability was specified to the macro model, from which the pressure distribution within the homogenised global scaffold was obtained by a second CFD analysis at the global scaffold level. The calculated pressure was then used as input for a FSI analysis of the micro models to compute the mechanical stimulation on the cell/ECM (Figure 4B). As the global scaffold was axisymmetric, which would result in an axisymmetric distribution of fluidic environment, only twelve locations (L1‐L12 in Figure 4A) were needed to represent a large part of the scaffold. As in each location ( Lj, j = 1, 2, …, 12), nine possible morphologies for the pore unit cell were possible (Figure 2B), a total of 108 micro FSI analyses were performed for day 28. Therefore, the mechanical stimulation (e.g., WSS and mechanical strain) was calculated for two time points (day 0 and day 28). Furthermore, statistical analysis was performed to test if there was significant difference among different morphologies on the WSS (in Appendix S1).
FIGURE 4.
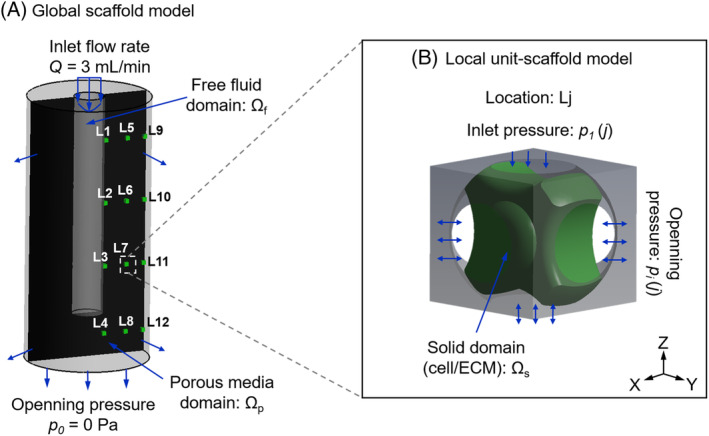
Loading and boundary conditions of A, the macro computational fluid dynamics model of the global scaffold, the black area is the cross section of the whole scaffold, in which 12 locations are selected; B, local fluid‐solid interaction model (micro model of scaffold unit) at location Lj in the global scaffold (L1‐L12)
In the macro CFD model, the free fluid domain in the central region followed the Navier‐Stokes equation:
| (1) |
where v is the fluid velocity vector; μ is the medium dynamic viscosity (μ = 1.4 mPa·s for medium α‐MEM supplemented with 10% fetal bovine serum and 1 wt% dextran 27 ;) Ωf represents the free fluid domain (Figure 4A).
The porous media domain followed the Darcy equation:
| (2) |
where 〈v〉 is the Darcy velocity (average fluid velocity); 〈p〉 is the average pressure; κ is the permeability of the porous domain Ωp (Figure 4A).
The permeability (κ) of the porous domain was derived from the micro CFD models at day 0 and 28, respectively. For day 28, the global permeability was obtained by averaging the permeabilities of nine different morphologies (Figure 2B).
To compute the resultant mechanical strain in the cell/ECM, the FSI approach was applied to the micro model. The cell/ECM was modelled as a hyperelastic (Neo‐Hookean) material with strain energy density function according to previous cellular mechanics model: 28
| (3) |
where W and F are the strain energy density and deformation gradient, respectively; Ī 1 is the first invariant of the right Cauchy‐Green deformation tensor, which can be derived from:
| (4) |
where λ 1, λ 2 and λ 3 are the principal stretches.
In Equation (3), C 1 and D 1 are material constants, which were calculated using Equations (5) and (6), respectively:
| (5) |
and
| (6) |
where G, E and K are shear modulus, Young's modulus and bulk modulus, respectively, and ν is the Poisson's ratio. In our study, the cell/ECM was defined as an almost incompressible material with a Young's modulus E of 3 kPa and Poisson's ratio ν of 0.49 (G = 0.5 kPa, K = 50 kPa). 29
In the local FSI model (micro model), six faces were defined as open boundaries loaded by pressure derived from the global CFD model (Figure 4B). The cell/ECM surfaces formed the fluid‐solid interface between the CFD and FE domains and this two‐way FSI analysis followed a staggered iteration approach. Specifically, the Navier‐Stokes equation (Equation [1]) was solved and the resulting fluid stress tensor acting at fluid‐solid interfaces was applied as the boundary condition on the solid domain (cell/ECM), where resulting deformations were relayed back to the fluid domain and the solution continued through further iterations until a convergence criteria (i.e., root mean square [RMS] residual of momentum and mass < 1.0 × 10⁻⁴) was reached. The fluid domain was meshed by a tetrahedron method with a patch conforming algorithm. Similar as Zhao et al, 7 a local‐curvature‐dependent mesh was applied for controlling the element size. Specifically, the mesh was subdivided in curved regions until the normal vector of neighbouring surfaces was within 36° (minimum element edge length = 1.9 μm) as introduced in Zhao et al. 7 Finally, the model was solved in steady state by ANSYS CFX solver under the convergence criteria of RMS residual of momentum and mass < 1.0 × 10⁻⁴.
3. RESULTS
3.1. Permeability of scaffold
The permeability of the scaffold at day 0 was calculated as 2.0 × 10⁻⁹ m2. At day 28, different cell/ECM morphologies resulted in different scaffold permeabilities, although the volume fraction was constant (Figure 5). The permeability of the unit scaffold infiltrated with different cell/ECM morphologies varied from 1.39 × 10⁻¹⁰ to 4.58 × 10⁻¹⁰ m2. The whole scaffold (macro‐level) was homogenised and modelled as a porous medium that follows Darcy's law. The permeability of the homogenised scaffold was defined as 2.90 × 10⁻¹⁰ m2, which was the average permeability of the nine (micro‐level) unit scaffolds.
FIGURE 5.

Permeability of the scaffold influenced by nine different morphologies at day 28
3.2. Cellular mechanical stimulation
From the micro FSI model, it was found that the maximum mechanical strain at day 0 was negligible (average: 6.1 × 10⁻¹⁵) (Figure 6A). The average WSS on the cell surface (without ECM at day 0) varied from 0.29 to 3.91 mPa, depending on the locations in the scaffold (Figure 7A). For instance, the cell layer at location L1 was exposed to the highest WSS (i.e., 3.91 mPa), while the cells at location L12 experienced the lowest WSS (i.e., 0.29 mPa) at day 0 (Figure 7A). When considering all twelve locations, the average WSS was 1.53 mPa at day 0.
FIGURE 6.
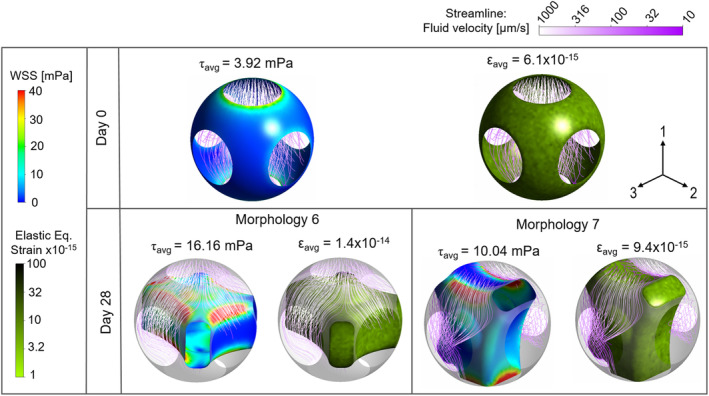
Wall shear stress and equivalent elastic strain distribution on cell layer at day 0 and those on interstitial cell/extracellular matrix of morphology 6 and 7 at day 28 at location L1
FIGURE 7.
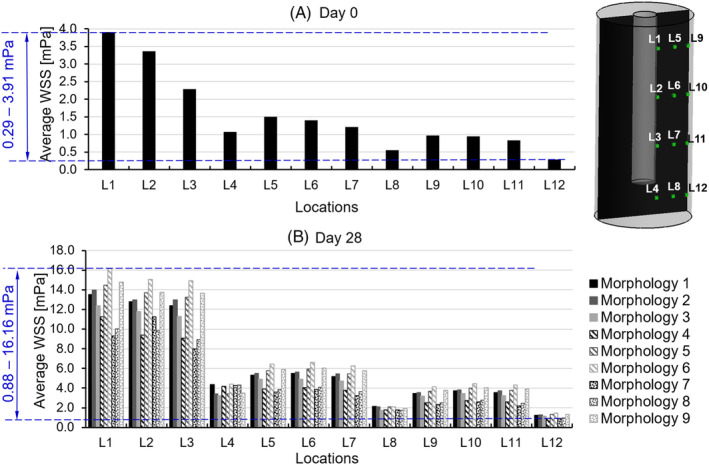
Average wall shear stress on cell/extracellular matrix at 12 locations (L1‐L12) within scaffold at A, day 0 and B, day 28
At day 28, the resultant mechanical stimulation of the tissues largely depended on the location and the interstitial morphology (nine types in our study). The maximum value of the equivalent elastic strain was found for morphology 6 at location L1, however, the value (1.4 × 10⁻¹⁴) was still very low (Figure 6).
The average WSS on the cell/ECM mixtures at day 28 largely depended on both the locations in the global scaffold and the tissue morphologies. As expected higher WSS was found for the regions near the inlet as the fluid pressure there was higher, resulting in larger pressure gradients, than at the bottom of the channel. Overall, the WSS varied from 0.88 to 16.16 mPa (Figure 7B) with an average value of 5.735 mPa. The highest WSSs were found for morphology 6 at location L1, while the lowest WSSs were found for morphology 7 at location L12 (Figures 6 and 7B). The WSS variation due to different tissue morphologies was in the range of 2% to 33% of the average. The variation in WSS due to location in the global scaffold, however, was higher and ranged from 4% to 153% of the average WSS per model. Moreover, it was found that the morphology had a more distinct influence on the WSS in the upper region (i.e., L1‐3, 5‐7 and 9‐11 in Figure 7) than that in the bottom region (i.e., L4, 8 and 12 in Figure 7) in the global scaffold. The cell/ECM mixtures in the upper region close to the medium flow channel (i.e., L1‐4 in Figure 7) were subjected to a much higher WSS than those in the region further from the medium channel (i.e., L5‐12 in Figure 7).
To analyse the WSS at day 0 and 28, we calculated the WSS from all the cases based on the assumption that (a) at day 0, 1 morphology would occur at each location (12 locations in total) and (b) at day 28, nine morphologies had an equal chance to occur at each location (108 cases in total). Based on all these WSS results, a histogram of the WSS for the full specimen at day 0 and 28 was shown in Figure 8. Afterwards, a WSS range of 1.530 to 5.735 mPa, which were the average WSS from day 0 to 28 in Figure 7 was applied to the histogram (i.e., overall WSS distribution) in Figure 8. It has been found that the majority of WSS was distributed within the range of 1 to 6 mPa (a close superset of 1.530‐5.735 mPa) with a frequency of 67.5%.
FIGURE 8.
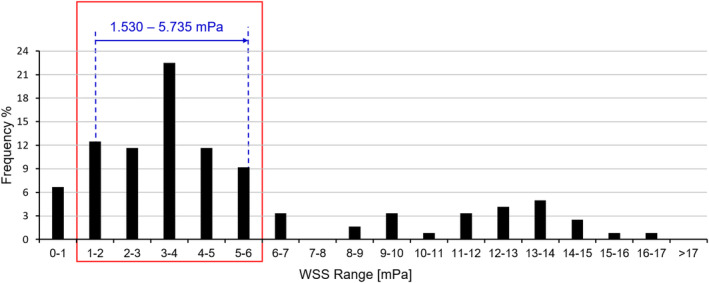
Histogram of the overall WSS distribution: the blue arrow represents the change in average WSS from day 0 to day 28 that increases from 1.530 to 5.735 mPa; the red box represents the WSS of 1 to 6 mPa, which occupies a frequency of 67.5%. WSS, wall shear stress
4. DISCUSSION
This study quantified the mechanical stimulation on cell/ECM mixtures in an in vitro BTE experiment by a multiscale computational approach. It was found that the average WSS increased from 1.530 to 5.735 mPa when 50% of the pore volume was infiltrated by the interstitial tissue. A narrow superset of this average WSS range (i.e., 1‐6 mPa) has a peak probability (i.e., 67.5%) in the overall WSS distribution with 32.5% out of this range. This level of WSS was in agreement with values reported to be adequate for cell stimulation: 0.1 to 10 mPa for stimulating the MSCs to differentiate towards the osteogenic lineage 12 and 0.55 to 24 mPa for stimulating the mineralisation of the ECM. 9
The actual WSS was not constant but depended on three factors. The first one was the amount of interstitial tissue. When the pore volume was filled by interstitial tissue with a fraction increasing from 0% to 50%, the average WSS increased from 1.530 to 5.735 mPa when 50% of the pore volume was infiltrated by the interstitial tissue. A narrow superset of this average WSS range (i.e., 1‐6 mPa) has a peak probability (i.e., 67.5%) in the overall WSS distribution with 32.5% out of this range. This level of WSS was in agreement with values reported to be adequate for stimulating the MSCs to differentiate towards the osteogenic lineage (0.1‐10 mPa) 12 and for stimulating the mineralisation of the ECM (0.55‐24 mPa). 9 The second factor that influenced the actual WSS was the interstitial tissue morphology. According to our analysis (Figure 7), the differences in morphology could lead to a 10‐fold variation in the resultant WSS. A previous computational study quantified the WSS on single cells with different morphologies within a scaffold with regular geometry under perfusion flow. 21 It was found that the WSS on cells also showed a 10‐fold difference among different single cell morphologies (i.e., flat cell and round cell). 21 However, they indicated that with cell proliferation and ECM production, the influence of cell/tissue morphology on resultant WSS would approximately be constant. Thirdly, the WSS on cells also can be affected by the location within the scaffold. In a special scaffold, due to the special cell/ECM at different locations received different WSS with higher values when situated closer to the medium channel (e.g., average WSS at L1‐L4 = 10.16 mPa, average WSS in other regions = 3.52 mPa). This location‐dependent phenomenon was also observed in other studies, in which homogenous scaffolds were exposed to the uniform perfusion flow.10, 21 However, the histological image in reference 18 did not show a clear location‐dependent mineralisation pattern (Figure 2A). One of the potential reasons for this could be that the WSS in any location was within the range for stimulating mineralisation. For instance, Vetsch et al found that any WSS within the range of 0.55 to 24 mPa would stimulate the cells producing mineralised ECM. 9 Comparing to the results in our study, the majority of the WSS was within this range at day 0, and at day 28 all of the WSS were within this range.
Our study showed that the mechanical strain in the tissue due to the fluid flow was negligible and much lower than values reported to have an effect on osteogenic differentiation of MSCs. 30 However, a previous computational study found that this could be different for single cells which could be highly deformed under perfusion flow. 21 For instance, when the WSS on a single cell reached 250 mPa, the resultant equivalent elastic strain could be up to 17%. 21 Comparing to the WSS and strain results in our study, even if the WSS were increased to 250 mPa, the strain still was not likely to reach a 10% level. The potential reason for this difference between mechanical strain in interstitial tissue and single cells could be that the higher volume of tissue made the cell/ECM structure stiffer, such that it could resist the external force, while the single cell structure was less rigid. Although increasing the flow rate could result in higher mechanical strains in the cell/ECM mixture, the WSS would also increase with the flow rate, leading to a WSS beyond the range for stimulating mineralisation. Therefore, as an implication to future tissue engineering experiments with perfusion bioreactors, loading optimisation of a bioreactor at early phase (e.g., days 1‐3) needs to consider both WSS and mechanical strain as an effective mechanical stimulation that may have influence on cell activities. However, at a later phase (e.g., after 1 week), such flow rate optimisation only needs to be focused on WSS on cells rather than the resultant mechanical strain.
The major limitation of this study was that the computational model was merely based on one experiment by Li et al. 18 The reason for this choice was based on the availability of the required information within one study, to correlate the experimental setup with the results. This study by Li et al 18 has provided the required details on scaffold geometry and external loading to calculate the mechanical stimulation within the scaffold, also observational results (e.g., interstitial tissue volume) that were required for the computational model. However, in this study, very limited data was available about the interstitial tissue morphology and volume distribution within scaffold during the experiment. For this reason, only nine interstitial micro‐morphologies were created artificially. Although other morphologies are possible as well, these nine cases were found to well represent the overall distribution as seen in the experiment of Li et al. 18 Although these may deviate from the actual morphologies, we expected that they would provide a reasonable estimation. In addition, the limit of the mineralised tissue distribution within scaffold has prevented from correlating the numerical results (e.g., WSS) to the mineralised tissue volume at specific location. However, according to Li et al, 18 no significant difference of mineralisation was observed in different regions within scaffold. Therefore, we used the average level of WSS throughout the scaffold to correlate with the total mineralised tissue volume within the scaffold. Second, cells and ECM were homogenised and modelled with a hyperelastic constitutive material model. In reality, cell and ECM are porous elastic materials that allow fluid perfusing through it.13, 31 However, the permeability of cell/ECM is probably much less than that of the pores, for instance, Beno et al reported that cell permeability is much lower than the bone pore permeability (cells: 10−22‐10−19 m2 vs bone: 10−10 m2). 32 So, the error when assuming hyperelastic constitutive material behaviour is expected to be small. Furthermore, we used constant mechanical properties for cell/ECM tissue, even though the ECM may become stiffer over time due to increased mineralisation. However, the mechanical strain in the cell/ECM tissue before mineralisation (e.g., 10−15‐10−14) was already below the level for stimulating osteogenesis or mineralisation (e.g., 10−2 30 ) such that further stiffening is not expected to change our results. Third, in our study, the scaffold was idealised into one assembled by many repeating unit cells. Although the real scaffold in the experiment had a regular pore shape and geometry (Figure 1), a variation in pore diameter in the range of 350 ± 100 μm was reported. According to the results in Reference 11, such variation in pore size may lead to variations in the local WSS. The average WSS values, however, should not be affected much by such variations. One possible approach to address this issue would be image‐based modelling, in which the CFD model is built based on a real scaffold geometry, for example constructed from μCT scanning images.
5. CONCLUSION
Under mechanical stimulation by perfusion flow, the WSS sensed by the cells in porous scaffold is highly dependent on: (a) the volume of the present tissue, (b) the morphology of the interstitial tissue and (c) the locations within scaffold. To obtain a more accurate correlation between WSS and mineralised bone tissue formation, it is suggested to conduct the numerical‐experimental correlation at specific locations within the scaffold. During tissue engineering, the tissue volume and morphology will change over time during culturing. Therefore, to keep proper stimulation over time, the flow rate may need adjustments during the culturing process. An experiment‐specific computational analysis, such as performed in the present study, can help in identifying optimal loading regimes. To achieve this, we suggest to determine the tissue growth type (i.e., interstitial or appositional) first, which then can be accounted for in the computational model. Furthermore, to generate the homogeneously distributed tissue volume throughout the whole scaffold, it is suggested to control the local mechanical stimulation by optimising the local geometric features (i.e., porosity and pore size) of scaffold.
CONFLICT OF INTEREST
The authors declare no conflicts of interest.
Supporting information
Appendix S1. Supporting information.
ACKNOWLEDGEMENT
This study was supported by the EU Seventh Framework Programme (FP7/2007‐2013); grant agreement number 336043 (project REMOTE).
Zhao F, van Rietbergen B, Ito K, Hofmann S. Fluid flow‐induced cell stimulation in bone tissue engineering changes due to interstitial tissue formation in vitro. Int J Numer Meth Biomed Engng. 2020;36:e3342 10.1002/cnm.3342
Contributor Information
Bert van Rietbergen, Email: b.v.rietbergen@tue.nl.
Sandra Hofmann, Email: s.hofmann@tue.nl.
REFERENCES
- 1. Yu X, Botchwey EA, Levine EM, Pollack SR, Laurencin CT. Bioreactor‐based bone tissue engineering: the influence of dynamic flow on osteoblast phenotypic expression and matrix mineralization. Proc Natl Acad Sci U S A. 2004;101(31):11203‐11208 10.1073/pnas.0402532101. [DOI] [PMC free article] [PubMed] [Google Scholar]
- 2. Vetsch JR, Müller R, Hofmann S. The evolution of simulation techniques for dynamic bone tissue engineering in bioreactors. J Tissue Eng Regen Med. 2015;9(8):903‐917. 10.4161/biom.22170. [DOI] [PubMed] [Google Scholar]
- 3. Gaspar DA, Gomide V, Monteiro FJ. The role of perfusion bioreactors in bone tissue engineering. Biomatter. 2012;2(4):1‐9. 10.1002/term.1851. [DOI] [PMC free article] [PubMed] [Google Scholar]
- 4. Sandino C, Lacroix D. A dynamical study of the mechanical stimuli and tissue differentiation within a CaP scaffold based on micro‐CT finite element models. Biomech Model Mechanobiol. 2011;10(4):565‐576. 10.1007/s10237-010-0256-0. [DOI] [PubMed] [Google Scholar]
- 5. Castro APG, Lacroix D. Micromechanical study of the load transfer in a polycaprolactone–collagen hybrid scaffold when subjected to unconfined and confined compression. Biomech Model Mechanobiol. 2018;17(2):531‐541. 10.1007/s10237-017-0976-5. [DOI] [PMC free article] [PubMed] [Google Scholar]
- 6. Guyot Y, Luyten FP, Schrooten J, Papantoniou I, Geris L. A three‐dimensional computational fluid dynamics model of shear stress distribution during neotissue growth in a perfusion bioreactor. Biotechnol Bioeng. 2015;112(12):2591‐2600. 10.1002/bit.25672. [DOI] [PubMed] [Google Scholar]
- 7. Zhao F, van Rietbergen B, Ito K, Hofmann S. Flow rates in perfusion bioreactors to maximise mineralisation in bone tissue engineering in vitro. J Biomech. 2018;79:232‐237. 10.1016/j.jbiomech.2018.08.004. [DOI] [PubMed] [Google Scholar]
- 8. Daish C, Blanchard R, Pirogova E, Harvie DJE, Pivonka P. Numerical calculation of permeability of periodic porous materials: application to periodic arrays of spheres and 3D scaffold microstructures. Int J Numer Methods Eng. 2019;118(13):783‐803. 10.1002/nme.6037. [DOI] [Google Scholar]
- 9. Vetsch JR, Betts DC, Müller R, Hofmann S. Flow velocity‐driven differentiation of human mesenchymal stromal cells in silk fibroin scaffolds: a combined experimental and computational approach. PLoS One. 2017;12(7):1‐17. 10.1371/journal.pone.0180781. [DOI] [PMC free article] [PubMed] [Google Scholar]
- 10. Papantoniou I, Guyot Y, Sonnaert M, et al. Spatial optimization in perfusion bioreactors improves bone tissue‐engineered construct quality attributes. Biotechnol Bioeng. 2014;111(12):2560‐2570. 10.1002/bit.25303. [DOI] [PubMed] [Google Scholar]
- 11. Marin AC, Lacroix D. The inter‐sample structural variability of regular tissue‐engineered scaffolds significantly affects the micromechanical local cell environment. Interface Focus. 2015;5(2):5 10.1098/rsfs.2014.0097. [DOI] [PMC free article] [PubMed] [Google Scholar]
- 12. Olivares AL, Marsal È, Planell JA, Lacroix D. Finite element study of scaffold architecture design and culture conditions for tissue engineering. Biomaterials. 2009;30(30):6142‐6149. 10.1016/j.biomaterials.2009.07.041. [DOI] [PubMed] [Google Scholar]
- 13. Guyot Y, Papantoniou I, Luyten FP, Geris L. Coupling curvature‐dependent and shear stress‐stimulated neotissue growth in dynamic bioreactor cultures: a 3D computational model of a complete scaffold. Biomech Model Mechanobiol. 2016;15(1):169‐180. 10.1007/s10237-015-0753-2. [DOI] [PubMed] [Google Scholar]
- 14. Nava MM, Raimondi MT, Pietrabissa R. A multiphysics 3D model of tissue growth under interstitial perfusion in a tissue‐engineering bioreactor. Biomech Model Mechanobiol. 2013;12(6):1169‐1179. 10.1007/s10237-013-0473-4. [DOI] [PubMed] [Google Scholar]
- 15. Owen R, Sherborne C, Paterson T, Green NH, Reilly GC, Claeyssens F. Emulsion templated scaffolds with tunable mechanical properties for bone tissue engineering. J Mech Behav Biomed Mater. 2016;54:159‐172. 10.1016/j.jmbbm.2015.09.019. [DOI] [PMC free article] [PubMed] [Google Scholar]
- 16. Papantoniou I, Sonnaert M, Geris L, Luyten FP, Schrooten J, Kerckhofs G. Three‐dimensional characterization of tissue‐engineered constructs by contrast‐enhanced nanofocus computed tomography. Tissue Eng Part C Methods. 2014;20(3):177‐187. 10.1089/ten.tec.2013.0041. [DOI] [PMC free article] [PubMed] [Google Scholar]
- 17. Melke J, Zhao F, van Rietbergen B, Ito K, Hofmann S. Localisation of mineralised tissue in a complex spinner flask environment correlates with predicted wall shear stress level localisation. Eur Cell Mater. 2018;36:57‐68. 10.22203/eCM.v036a05. [DOI] [PubMed] [Google Scholar]
- 18. Li D, Tang T, Lu J, Dai K. Effects of flow shear stress and mass transport on the construction of a large‐scale tissue‐engineered bone in a perfusion bioreactor. Tissue Eng Part A. 2009;15(10):2773‐2783. 10.1089/ten.tea.2008.0540. [DOI] [PubMed] [Google Scholar]
- 19. Vikingsson L, Claessens B, Gómez‐Tejedor JA, Gallego Ferrer G, Gómez Ribelles JL. Relationship between micro‐porosity, water permeability and mechanical behavior in scaffolds for cartilage engineering. J Mech Behav Biomed Mater. 2015;48:60‐69. 10.1016/j.jmbbm.2015.03.021. [DOI] [PubMed] [Google Scholar]
- 20. Panadero JA, Vikingsson L, Gomez Ribelles JL, Lanceros‐Mendez S, Sencadas V. In vitro mechanical fatigue behavior of poly‐ε‐caprolactone macroporous scaffolds for cartilage tissue engineering: influence of pore filling by a poly(vinyl alcohol) gel. J Biomed Mater Res, Part B. 2015;103(5):1037‐1043. 10.1002/jbm.b.33276. [DOI] [PubMed] [Google Scholar]
- 21. Zhao F, Vaughan TJ, Mcnamara LM. Multiscale fluid–structure interaction modelling to determine the mechanical stimulation of bone cells in a tissue engineered scaffold. Biomech Model Mechanobiol. 2015;14(2):231‐243. 10.1007/s10237-014-0599-z. [DOI] [PubMed] [Google Scholar]
- 22. Guyot Y, Smeets B, Odenthal T, et al. Immersed boundary models for quantifying flow‐induced mechanical stimuli on stem cells seeded on 3D scaffolds in perfusion bioreactors. PLoS Comput Biol. 2016;12(9):1‐21. 10.1371/journal.pcbi.1005108. [DOI] [PMC free article] [PubMed] [Google Scholar]
- 23. Virjula S, Zhao F, Leivo J, et al. The effect of equiaxial stretching on the osteogenic differentiation and mechanical properties of human adipose stem cells. J Mech Behav Biomed Mater. 2017;72:38‐48. 10.1016/j.jmbbm.2017.04.016. [DOI] [PubMed] [Google Scholar]
- 24. Iandolo D, Pennacchio FA, Mollo V, et al. Electron microscopy for 3D scaffolds–cell biointerface characterization. Adv Biosyst. 2019;3(2):1‐6. 10.1002/adbi.201800103. [DOI] [PMC free article] [PubMed] [Google Scholar]
- 25. Lin L, Zhang J, Zhao L, Tong A, Sun J, Hu Q. Effect of microstructure on the mechanical properties and biology performance of bone tissue scaffolds using selective laser sintering IFMBE Proceedings, Berlin, Heidelberg: Springer; 2008. [Google Scholar]
- 26. Zhao F, Melke J, Ito K, Van Rietbergen B, Hofmann S. A multiscale computational fluid dynamics approach to simulate the micro‐fluidic environment within a tissue engineering scaffold with highly irregular pore geometry. Biomech Model Mechanobiol. 2019;18:1965‐1977. [DOI] [PMC free article] [PubMed] [Google Scholar]
- 27. Lakhotia S, Papoutsakis ET. Agitation induced cell injury in viscosity is agitation intensity dependent: experiments and modeling. Biotechnol Bioeng. 1992;39:95‐107. [DOI] [PubMed] [Google Scholar]
- 28. Jafari Bidhendi A, Korhonen RK. A finite element study of micropipette aspiration of single cells: effect of compressibility. Comput Math Methods Med. 2012;2012:1‐9. 10.1155/2012/192618. [DOI] [PMC free article] [PubMed] [Google Scholar]
- 29. Titushkin I, Cho M. Modulation of cellular mechanics during osteogenic differentiation of human mesenchymal stem cells. Biophys J. 2007;93(10):3693‐3702. 10.1529/biophysj.107.107797. [DOI] [PMC free article] [PubMed] [Google Scholar]
- 30. You J, Yellowley CE, Donahue HJ, Zhang Y, Chen Q, Jacobs CR. Substrate deformation levels associated with routine physical activity are less stimulatory to bone cells relative to loading‐induced oscillatory fluid flow. J Biomech Eng. 2000;122:387‐393. 10.1115/1.1287161. [DOI] [PubMed] [Google Scholar]
- 31. Dong L, Oberai AA. Recovery of cellular traction in three‐dimensional nonlinear hyperelastic matrices. Comput Methods Appl Mech Eng. 2017;314:296‐313. 10.1016/j.cma.2016.05.020. [DOI] [Google Scholar]
- 32. Beno T, Yoon YJ, Cowin SC, Fritton SP. Estimation of bone permeability using accurate microstructural measurements. J Biomech. 2006;39(13):2378‐2387. 10.1016/j.jbiomech.2005.08.005. [DOI] [PubMed] [Google Scholar]
Associated Data
This section collects any data citations, data availability statements, or supplementary materials included in this article.
Supplementary Materials
Appendix S1. Supporting information.


