

Abstract
The narrow therapeutic index and large inter-individual variability in sirolimus pharmacokinetics (PK) make therapeutic drug monitoring (TDM) necessary. Factors responsible for PK variability are not well understood, and published PK studies do not include pediatric patients with immune cytopenia. The objective of this study was to characterize the PK of sirolimus in pediatric patients with immune cytopenia and to develop a population PK model in Chinese children and evaluate its utility for dose individualization. A total of 27 children with either acquired or congenital immune cytopenia aged 8.16 ± 3.60 years (range: 1–15 years) were included. TDM data for sirolimus were collected. The population PK model of sirolimus was described using the nonlinear mixed-effects modeling (Phoenix NLME 1.3 software) approach. Covariate analysis was applied to select candidate factors associated with PK parameters. The final model was validated using bootstrap (1000 runs) and visual predictive check (VPC) method. A one-compartment model with first-order absorption and elimination was developed. The outcome parameters were as follows: apparent clearance (CL/F) 5.63 L/h, apparent distribution volume (V/F) 144.16 L. Inter-individual variabilities for CL/F and V/F were 3.53% and 7.27%, respectively. The intra-individual variability of proportional error model was 22.45%. The covariate test found that body weight and total bilirubin were strongly associated with clearance; however, we did not find the relevance between the covariate and volume of distribution of sirolimus. Personalized dosage regimens were provided based on Bayesian method. The oral dose should be adjusted according to weight and total bilirubin. This is the first study to describe a population PK model of sirolimusin pediatric patients with immune cytopenia. Population pharmacokinetic (PPK) model–based dose individualization of sirolimus and the design of future clinical studies in children will be facilitated by the developed model in this study.
Keywords: immunosuppressant, immune cytopenia, pediatrics, population pharmacokinetics, sirolimus
Introduction
Sirolimus, an inhibitor of mammalian target of rapamycin (mTOR), is an effective immunosuppressant, currently Food and Drug Administration (FDA)-approved as an anti-rejection medication for solid organ and bone marrow transplant.1 Until now, due to the safety and efficacy of sirolimus in clinical trials, it is under more intensive investigation for the treatment of various immune-mediated disorders, including type 1 diabetes, systemic lupus erythematosus, rheumatoid arthritis, and immune cytopenia.2–5 In patients with immune cytopenia, underexposure may lead to a lack of therapeutic effect, whereas overexposure may increase the risk for toxicities such as renal dysfunction, hypertension, pneumonitis, and infection.6–8 These may lead to increased morbidity, decreased quality of life, and higher health care costs. Identifying and measuring factors that affect the variability in sirolimus pharmacokinetics (PKs) will contribute to more rapid target attainment thereby optimizing therapeutic outcomes at reduced cost.
As sirolimus has a narrow therapeutic index and has shown large inter-individual variability in PKs,9 optimizing sirolimus therapy based on the therapeutic drug monitoring (TDM) has been of great interest to improve efficacy while minimizing toxicity, especially in pediatric patients.10 Great concerns remain in under- and overexposure to sirolimus, and rapid attainment of target sirolimus concentrations is challenging, which is essential for preventing therapy-related complications.
In current clinical practice, most centers use whole blood trough concentrations (C0) to adjust the individual dose. The primary goal is to maintain C0 within a predefined therapeutic range. Concentration-controlled dosage adaptation is often performed. Despite the widespread use of this strategy, it is still difficult to quickly determine a stable dose that will achieve the target C0 for numerous demographic, biological, and clinical factors influencing sirolimus PKs, including weight, age, serum creatinine, and concomitant medication.11 TDM is mandatory for pediatric patients, who exhibit wider PK variability than adults.12 Population pharmacokinetics (PPKs), which integrates different effects of variables on drug exposure, have great potential for dosage individualization.13
The PPK approach has been used for determining the sirolimus dose in children who have received transplantation.14–16 However, PK data for children with immune cytopenia are limited, and a PPK analysis of sirolimus has not been conducted in this critical population. A thorough understanding of the developmental aspects (i.e. the impact of age on sirolimus clearance) and quantification of the influences of different clinical and biological covariates is required to individualize sirolimus therapy. This is the first study to describe a PPK model of sirolimus, using a large TDM database, and disposition in pediatric patients with immune cytopenia. The developed model will facilitate PK model–based dose individualization of sirolimus and the design of future clinical studies in children.
Patients and methods
This pilot study was conducted from January 2016 to December 2017. The study was approved by the Ethics Committee of Beijing Children’s Hospital (BCH). According to the requirements of the local independent ethics committee (IEC), informed consent was obtained from each enrolled patient (written informed consent for subjects ⩾8 years old, and oral informed consent for subjects <8 years old), as well as written informed consent was obtained from legally authorized representatives.
Inclusion/exclusion criteria
Inclusion criteria are as follows: (1) children with refractory single or multiple lineage autoimmune cytopenia, (2) first- and second-line treatment is ineffective, (3) age from 1 to 15 years, and (4) patients who live near the comprehensive care center (best within 50 km) at BCH and are compliant to therapies. Patients with incomplete information, poor compliance, and inability to adhere to treatment were excluded (Figure 1).
Figure 1.
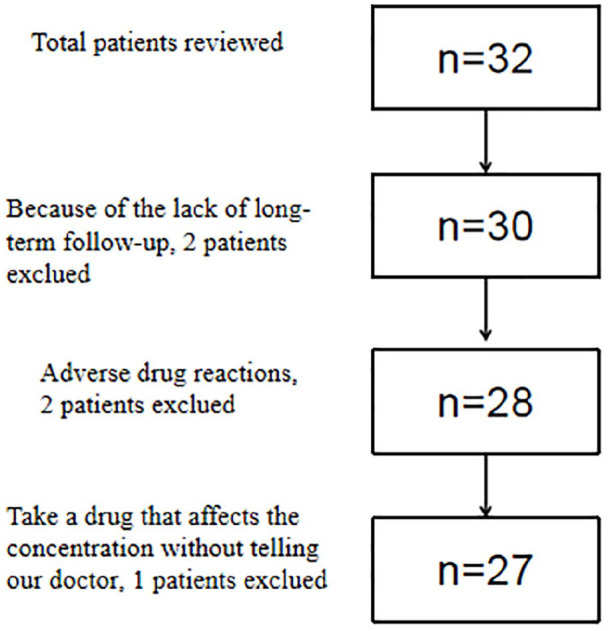
Flow chart of patient inclusion.
Method
Sirolimus (gelatin capsule) was given orally daily with an initial dose of 1.5 mg/m2. Dosage adjustment was based on TDM results to achieve a target C0 of 5–15 ng/mL.17 The concentration of sirolimus was determined after at least 7 days of consistent administration in order to reach the steady state.
The following data were collected: detailed dosing history, age, gender, body weight (WT), blood platelet count (PLT), red blood cell (RBC), hemoglobin (HB), hematocrit (Hct), glutamic transaminase (ALT), alanine aminotransferase (AST), triacylglycerol (TG), total cholesterol (TCHO), low-density lipoprotein (LDL), alkaline phosphatase (ALP), serum creatinine (SCr), urea nitrogen (BUN), total bilirubin (TBIL), direct bilirubin (DBIL), indirect bilirubin (IBIL), serum albumin (ALB). This clinical trial was designed in accordance with legal requirements and was approved by the local ethics committee.
Assay of sirolimus
Sirolimus blood concentrations were determined by fluorescence polarization immunoassay (FPIA) technology (TDX/FLX; Abbott Laboratories, Abbott Park, IL, USA). The lower limit of quantification was 25 ng/mL, and the linearity ranged from 25 to 1500 ng/mL, with a coefficient variation of less than 4%.
PPK analysis
PK modeling
PPK analysis was performed with software Phoenix NLME 1.3 (Certara, St. Louis, MO). The compartmental model was applied to describe the kinetic behavior of sirolimus in blood. It was characterized by a one-compartment model with first-order absorption and elimination.3 There was no available date collected from the absorption phase and only trough concentration date was documented, so absorption rate constant (Ka) was fixed at 0.7521/h according to relevant literature.18 Furthermore, as bioavailability could not be estimated, the clearance and volume of distribution were deemed as apparent clearance (CL/F) and apparent distribution volume (V/F), respectively. Exponential models were used to account for inter-individual variability. The residual error was tested using additive, proportional, and combined error structures.
The study screened 19 covariates, including age, body weight, gender, ALT, AST, serum ALB, ALP, TBIL, DBIL, IBIL, SCr, BUN, TG, TCHO, LDL, RBC, PLT, HB, Hct. Once the base model was selected, the relationship between the covariates and inter-individual random effects (η) was assessed by means of a scatter plot. The continuous and categorical covariates, in the form of exponential model and piece-wise model, respectively, were introduced into the base model to perform the PPK analysis.
During covariate evaluation, stepwise regression was applied to the full regression model building by forward selection manner. If the objective function value (OFV) decreased more than 6.64, it was considered to be statistically significant (at P < 0.01 level) and this difference in OFV (between two models) was assumed to be asymptotically χ2 distributed. The added covariates were then excluding one by one from the full regression model. The more stringent statistical criteria were used to test the necessity of each covariate include in this model. If the OFV change was more than 10.83, the effect was deemed significant (P < 0.001) and the covariate was kept in the model. On the other hand, if the OFV change was less than 10.83, this covariate was removed from the model. The final model was obtained after the reverse removal of covariates from the full regression model.
Model evaluation
To describe the adaptability of the PK model to fit the observations, the internal evaluation of goodness-of-fit scatter plots included conditional weighted residuals (CWRES) versus time, CWRES versus predictions, observations versus predictions, and observations versus individual predictions was done. In addition, the robustness and the predictive performance of the final PK model were assessed by bootstrap resampling technology and visual predictive checks (VPCs). A total of 1000 bootstrap samples were generated with different combinations of patients, and the PK parameters were re-estimated with the use of the final model.
PK parameters were compared with median parameter values of bootstrap estimates along with 95% confidence interval (CI) (2.5th and 97.5th percentiles of distribution). Simulations of 1000 virtual data sets were performed from the final population model. VPCs can be done by comparing the observed concentrations with different percentiles of simulated concentrations, including 5th, 50th, and 95th.
Model simulation
The target concentration of sirolimus was from 5 to 15 ng/mL; we were mainly concerned with the drug concentration to reach the therapeutic concentration. Children were divided into different subgroups according to the incorporated covariates. Monte Carlo simulations were conducted with the Phoenix NLME software to find the optimal individual dosing regimen for different subgroups of patients of >90% steady-state concentration.
Statistical analysis
Demographic and baseline clinical data are summarized using descriptive statistics. Descriptive summaries of the data were carried out using Excel (Microsoft, Redmond, WA, USA). Normally distributed continuous variables are presented as the mean and standard deviation (SD), and non-normally distributed continuous variables are described as the median and interquartile range (IQR). Discrete variables are expressed as percentages. Quantitative and qualitative data were compared using the Mann–Whitney U and Fisher’s exact tests, respectively. Statistical significance was assumed for P values of <0.05. The statistical analyses were performed using SPSS 21.0 for Windows (IBM Corp., Armonk, NY, USA).
Results
Demographic information
In our study, 27 children with immune cytopenia were recruited for this PPK study between 2016 and 2017. The mean ± SD age was 8.16 ± 3.60 years (range: 1–15), and the mean ± SD body weight was 27.03 ± 10.87 kg (range: 7–43). The children’s characteristics are shown in Table 1.
Table 1.
Demographic and biological characteristics of 27 children.
| Characteristic | Mean ± SD |
|---|---|
| Age (years) | 8.16 ± 3.60 |
| Body weight (kg) | 27.03 ± 10.87 |
| Gender (male/female) | 18/9 |
| ALT (U/L) | 19.95 ± 14.73 |
| AST (U/L) | 32.71 ± 10.15 |
| ALB (g/L) | 43.24 ± 3.42 |
| ALP (U/L) | 176.11 ± 69.97 |
| TBIL (μmol/L) | 12.13 ± 7.35 |
| DBIL (μmol/L) | 1.53 ± 1.06 |
| IBIL (μmol/L) | 10.76 ± 6.48 |
| SCr (μmol/L) | 34.96 ± 10.43 |
| BUN (mmol/L) | 4.02 ± 1.11 |
| TG (mmol/L) | 1.30 ± 1.06 |
| TCHO (mmol/L) | 3.91 ± 0.92 |
| LDL (mmol/L) | 1.93 ± 0.69 |
| RBC (×1012/L) | 4.46 ± 0.97 |
| PLT (×109/L) | 93.63 ± 101.36 |
| Hb (g/L) | 119.96 ± 26.66 |
| Hct (%) | 36.23 ± 6.18 |
ALT: alanine transaminase; AST: aspartate aminotransferase; ALB: serum albumin; ALP: alkaline phosphatase; TBIL: total bilirubin, DBIL: direct bilirubin; IBIL: indirect bilirubin; SCr: serum creatinine; BUN: urea nitrogen; TG: triacylglycerol; TCHO: total cholesterol, LDL: low-density lipoprotein; RBC: red blood cell; PLT: blood platelet count; HB: hemoglobin; Hct: red blood cell specific volume.
A total of 107 sirolimus blood concentration results (168–7368 h) were available for the PPK analysis. The samples of sirolimus concentration were collected at 0.5 h before the next dose, which were at steady state, 7 days after first dose administration.
PK model building
OFV of the base model was 998.93, and the parameter estimates of apparent clearance (CL/F) and apparent distribution volume (V/F) were 5.08 L/h and 137.70 L, respectively. After forward inclusion and backward exclusion of all covariates, CL was significantly influenced by the body weight (WT) and total bilirubin (TBIL), V was by no co-variants influenced (Table 2). The final model with the two covariates was as follows
Table 2.
Decrease of OFV after adding covariates into the model.
| Covariates | ΔOFV |
|---|---|
| WT added into CL | −16.88 |
| TBIL added into CL | −11.81 |
ΔOFV: decrease of OFV (objective function value) after adding covariates into the model; WT: body weight; TBIL: total bilirubin; CL: apparent clearance
where 5.63 L/h is the typical value of CL/F, 11.29 is median TBIL (μmol/L), and −0.32 indicates the relationship between CL and TBIL. The median weight of children was 28.50 kg, and 0.50 indicates the relationship between CL and WT. The final PPK parameters, their relative standard error (RSE) and inter-individual variability (CV), and residual errors are summarized in Table 3.
Table 3.
Summary of the sirolimus population PK parameters after oral administration in immune cytopenia.
| Parameter | Model estimate |
Bootstrap |
||||
|---|---|---|---|---|---|---|
| Estimate | RSE (%) | 95% CI | CV (%) | Median | 95% CI | |
| Ka | 0.75 | 0 | 0.75–0.75 | 0.00 | 0.75 | 0.75–0.75 |
| V (L) | 144.16 | 23.89 | 75.80–212.52 | 42.91 | 142.77 | 12.42–254.46 |
| CL (L/h) | 5.63 | 9.00 | 4.62–6.63 | 21.89 | 5.48 | 1.60–6.53 |
| fCL-TBIL | −0.32 | −31.12 | −0.52–(−0.12) | −42.56 | −0.36 | −0.62–(−0.074) |
| fCL-WT | 0.50 | 18.28 | 0.32–0.68 | 26.72 | 0.49 | 0.22–0.70 |
| Σ | 0.22 | 11.42 | 0.17–0.28 | 11.80 | 0.22 | 0.17–0.27 |
CV: coefficient of variance; fCL-TBIL relationship of CL and TBIL; fCL-WT relationship of CL and WT; RSE: relative standard error; SE: standard error.
Model evaluation
The goodness-of-fit plots of the basic model (Figure 2(a–d)) and the final model (Figure 2(a′–d′)) are shown in Figure 2. Figure 2(a, a′, b, and b′) displays the scatter plots of CWRES versus time or prediction. No major trend was found in the magnitude of CWRES. Scatter plots of observation versus prediction and individual prediction are shown in Figure 2(c, 2c′, 2d, and 2d′). The incorporation of covariates improved the plots of goodness of fit (Figure 2).
Figure 2.

Goodness-of-fit plots of (a–d) basic and (a′–d′) final population PK models.
a and a′ = conditional weighted residuals (CWRES) versus prediction; b and b′ = CWRES versus time; c and c′ = observations versus predictions, the lines represent the lines of unity y = x; d and d′ = observations versus individual predictions.
The bootstrap results are listed in Table 3. Analyses of 1000 bootstrap samples yielded 916 samples that converged successfully. The typical values of the final model were similar to the median parameter estimates obtained with the 1000 bootstrap replicates of data, and their 95% CIs enclosed the values estimated during the data fitting. Bootstrap results pointed the stability of the final population model.
VPC plots displayed actual observational and the 90% prediction intervals using final model (90% PI: the areas between the 5th and 95th percentiles) (Figure 3). The dashed lines were 5th and 95th percentiles, and the solid lines were predicted 50th percentile. Because most observations fell inside the 90% PI, a match between observations and predictions was observed. The PVC plots revealed adequate and precise predictive properties of the final population model.
Figure 3.

Visual predictive check (VPC) from the final population PK model.
c means predicted 50th percentile; a, f represent the 5th and 95th percentiles; the area between the 5th and 95th percentiles indicating the areas representing the 90% prediction interval; d means observed 50th percentile; b, e represent the 5th and 95th percentiles of observations.
Model application
The final population model incorporated with two covariates, including body weight and total bilirubin. The value of CL/F was calculated with equation (5), and V/F was fixed as population typical values. Children were categorized according to their weight and total bilirubin. The simulated dosing regimens are listed in Table 4. Steady state can be achieved more quickly and individual fluctuations can be reduced according to recommendation.
Table 4.
Simulated dosing regimens (initial dose (mg)) for the specific patient population based on the weight and total bilirubin.
| Weight (kg) | TBIL (μmol/L) |
|
|---|---|---|
| 3.42–20.50 | >20.50 | |
| 5–15 | 0.75 | 0.5 |
| 15–25 | 1.5 | 0.75 |
| 25–35 | 1.75 | 1.0 |
| 35–45 | 2.0 | 1.5 |
TBIL: total bilirubin.
Discussion
Immune cytopenia is often a serious hematopoietic condition, which has significant hazards to the health of children. Sirolimus, as an immunosuppressive drug, plays an important role in the treatment of this disease. However, due to its narrow therapeutic index and high inter-individual variation of PKs in children, as well as the effect of gene polymorphism of drug metabolic enzymes, the treatment dosage of sirolimus should be individuated.
In our institution, sirolimus blood concentrations are routinely monitored, and the efficacy assessments are usually based on the measurements of the trough sirolimus concentration. The trough concentration is often required to be within the range of 5–15 ng/mL and used for dose adjustments. It usually takes a long time for clinical adjustment to the appropriate dose, and the method of establishing the model can effectively reduce the dose adjustment time and control the disease progression. Some studies have suggested that the trough concentration only reflects a single time point, and consequently the dose may be less accurate.19 On the other hand, frequent blood sampling would cause significant trauma and pain to children, making it unacceptable for children and their parents. Therefore, trough sirolimus concentration combined with Bayesian feedback method was used to estimate the dose, so as to accurately adjust the dosage, providing a feasible scheme for the optimization of sirolimus in the treatment of children with immune hemocytopenia. A constant absorption coefficient of 0.752 was selected because the trough concentration is only related to the elimination phase rather than the absorption phase and based on other publications.
Published sirolimus PK data in pediatrics were limited, especially in patients with immune cytopenia. This first study of sirolimus of PPK in children with immune cytopenia was undertaken to describe the PKs of sirolimus in this special population and to evaluate the influence of developmental, biological, and clinical factors affecting drug exposure. Our results showed that a one-compartment model with first-order absorption and elimination was adequate for data modeling and that body weight and total bilirubin had significant impacts on CL/F.
The study subjects were children aged 1–15 years. Based on the final model, the estimated CL/F value was 5.63 L/h and V/F value was 144.16 L. In one study in adult patients undergoing heart transplantation,18 CL/F value was 7.09 L/h and V/F value was 1350 L; the corresponding values were 10.1 L/h and 3670 L in another study in adult patients undergoing kidney transplantation.20 It can be seen that there was a small fluctuation in CL/F (the values were similar between children and adults) and a high fluctuation in V/F. A higher CL/F corrected for weight-normalized in younger children group compared with the older age group had been reported in the literature.21 No significant increase in CL/F when compared with adult studies may be due to the small sample size and larger age range. In addition, the target concentration of adults after transplantation was higher than that of children with hematocytopenia, so there was a bias in the modeling. In children, the body weight was significantly influenced by V/F. The body weight was 27.03 ± 10.87 kg for children in this study, compared with 60.4 ± 9.43 kg and 78.3 ± 12.7 kg in the previous two adult studies, respectively.18,20 The relatively larger extracellular and total body water spaces in neonates and young infants as compared with adults, coupled with adipose stores that have a higher ratio of water to lipid, result in lower plasma levels of drugs in these compartments when the drugs are administered in a weight-based fashion.22 The influence of age on the apparent volume of distribution is not as readily apparent for lipophilic drugs that are primarily distributed in tissue.23
In this study, 19 covariates were selected for screening, including 1 categorical covariate and 18 continuous covariates, which were similar to the covariates selected for adult post-transplant patients. To date, there are no reports on the use of sirolimus in children for treating cytopenia, so we selected more covariates wherever possible, including blood routine, liver function, renal function, blood lipid profile, in order to identify the factors that contribute to the in vivo behavior of sirolimus in children. This study was the first PPK study of sirolimus in children with cytopenia.
Study subjects and selected covariates were different among the different studies. In patients with heart transplantation, hypertriglyceridemia and cyclosporine dose were found to have strong impact on CL/F.18 For renal transplant patients, triglyceride levels and cyclosporine concentration were found to have strong impact on CL/F.20 After transplantation, sirolimus was often used in combination with cyclosporine and hormones, so there might be drug-related dyslipidemia. The results of this study suggested the influence of total bilirubin and body weight on CL/F, that is, CL/F varied by total bilirubin and body weight. When total bilirubin was constant, the greater body weight was associated with the higher CL/F. When the body weight was constant, the higher total bilirubin was associated with the lower CL/F. Body weight had a positive influence on CL/F. It is generally believed that increasing age and body weight may result in an increase in glomerular filtration rate (GFR), and consequently, an increase in CL/F.
As with other macrolide immunosuppressive drugs, sirolimus is metabolized by CYP3A4. Literature suggests that hepatic enzyme system in infants is still developing in an age-independent manner.23-25 The continuous development of hepatic enzymes is associated with changes in the in vivo PK processes of drugs. The specific changes in hepatic enzymes, however, have not been studied in the literature. A direct correlation between enzyme changes and drug CL/F may explain the high CL/F observed for children in the lower age group.
Our study has some limitations. We planned to observationally collect some sirolimus TDM data set in children with immune cytopenia. In clinical practice, only C0 is routinely measured to adjust the dose of sirolimus, and it was thus used in this PPK analysis. When the recruitment began in 2017, some covariates (e.g. cholesterol levels, hematocrit, CYP3A4, and ABCB1 genotype) were not routinely collected, so their impact could not be tested.3 We will continue to expand the sample size for further studies and improve the model.
Conclusion
A PPK model of sirolimus was developed in Chinese children with immune cytopenia. This study provides a useful example to effectively leverage existing data on drug concentration measurements and stored blood samples for further understanding of the mechanism of developmental change in drug PKs of Chinese children with immune cytopenia. Furthermore, studies will be needed to evaluate the generalizability of the model to other pediatric disease populations.
Footnotes
Author contributions: X.C. was involved in the critical analysis of clinical data and wrote the first draft of the paper. H.G. contributed to assist in collection of blood dates. Yi.Z. and Y.Z. contributed to analyze the data and build the PPK model. L.Z. and X.W. contributed to the modification of the paper. R.W. was involved in idea development, content analysis, supervision of statistical analysis, and critical review of manuscript.
Trial registration: Establishment and application of a standardized diagnosis and treatment system for children with immune thrombocytopenia: Trial registration number: ChiCTR1900022419.
Declaration of conflicting interests: The author(s) declared no potential conflicts of interest with respect to the research, authorship, and/or publication of this article.
Ethical approval: Ethical approval for this study was obtained from Ethics Committee of Beijing Children’s Hospital (approval number: 2018-k-97).
Funding: The author(s) disclosed receipt of the following financial support for the research, authorship, and/or publication of this article: This work was supported in part by grants from the National Natural Science Foundation of China (no. 81970111), Beijing Natural Science Foundation of China (no. 7192064), the Pediatric Medical Coordinated Development Center of Beijing Municipal Administration of Hospitals (no. XTZD20180205), National Science and Technology Key Projects (no. 2017ZX09304029004), Construction of Clinical Evaluation Technology Platform for Children Demonstration New Drugs (no. 2017ZX09304029).
Informed consent: Verbal informed consent was obtained from all subjects before the study. Written informed consent was obtained from legally authorized representatives before the study. According to the requirements of the local independent Ethics Committee (IEC), for subjects ⩾8 years old, we have obtained written informed consent from both the child and the legal guardian. For subjects <8 years old, we have obtained written informed consent from their legal guardian and oral informed consent from the subjects (children who can write their names correctly can also sign written informed consent, but it is not necessary).
ORCID iD: Xiaoling Cheng  https://orcid.org/0000-0002-0048-2658
References
- 1. Emoto C, Fukuda T, Mizuno T. (2015) Age-dependent changes in sirolimus metabolite formation in patients with neurofibromatosis type 1. Therapeutic Drug Monitoring 37(3): 395–399. [DOI] [PubMed] [Google Scholar]
- 2. Lam S, Partovi N, Ting LS, et al. (2008) Corticosteroid interactions with cyclosporine, tacrolimus, mycophenolate, and sirolimus: Fact or fiction? Annals Pharmacotherapy 42: 1037–1047. [DOI] [PubMed] [Google Scholar]
- 3. Zhou H, Gao Y, Cheng XL, et al. (2012) Population pharmacokinetics of cyclosporine a based on NONMEM in Chinese allogeneic hematopoietic stem cell transplantation recipients. European Journal of Drug Metabolism and Pharmacokinetics 37(4): 271–278. [DOI] [PubMed] [Google Scholar]
- 4. Liu B, Zhao H, Poon M-C. (2007) Abnormality of CD4+CD25+ regulatory T cells in idiopathic thrombocytopenic purpura. European Journal of Haematology 78(2): 139–143. [DOI] [PubMed] [Google Scholar]
- 5. Nishimoto T, Kuwana M. (2013) CD4+CD25+Foxp3+ regulatory T Cells in the pathophysiology of immune thrombocytopenia. Seminars in Hematology 50(Suppl 1): S43–S49. [DOI] [PubMed] [Google Scholar]
- 6. Jasinski S, Weinblatt ME, Glasser CL. (2017) Sirolimus as an effective agent in the treatment of immune thrombocytopenia (ITP) and Evans syndrome (ES): A single institution’s experience. Journal of Pediatric Hematology/Oncology 39(6): 420–424. [DOI] [PubMed] [Google Scholar]
- 7. Miano M, Scalzone M, Perri K, et al. (2015) Mycophenolate mofetil and sirolimus as second or further line treatment in children with chronic refractory primitive or secondary autoimmune cytopenias: A single centre experience. British Journal of Haematology 171: 247–253. [DOI] [PubMed] [Google Scholar]
- 8. Nocerino A, Valencic E, Loganes C. (2018) Low-dose sirolimus in two cousins with autoimmune lymphoproliferative syndrome-associated infection. Pediatrics International: Official Journal of the Japan Pediatric Society 60(3): 315–317. [DOI] [PubMed] [Google Scholar]
- 9. Mizuno T, Fukuda T, Christians U, et al. (2017) Population pharmacokinetics of temsirolimus and sirolimus in children with recurrent solid tumours: A report from the Children’s Oncology Group. British Journal of Clinical Pharmacology 83(5): 1097–1107. [DOI] [PMC free article] [PubMed] [Google Scholar]
- 10. Scott JR, Courter JD, Saldaña SN. (2013) Population pharmacokinetics of sirolimus in pediatric patients with neurofibromatosis type 1. Therapeutic Drug Monitoring 35: 332–337. [DOI] [PMC free article] [PubMed] [Google Scholar]
- 11. Del Mar Fernández De Gatta M, Santos-Buelga D, Gil AD, et al. (2002) Immunosuppressive therapy for paediatric transplant patients: Pharmacokinetic considerations. Clinical Pharmacokinetics 41(2): 115–135. [DOI] [PubMed] [Google Scholar]
- 12. Zhao W, Fakhoury M, Jacqz-Aigrain E. (2010) Developmental pharmacogenetics of immunosuppressants in pediatric organ transplantation. Therapeutic Drug Monitoring 32(6): 688–699. [DOI] [PubMed] [Google Scholar]
- 13. Zheng QS, Li LJ. (2012) Pharmacometrics: A quantitative tool of pharmacological research. Acta Pharmacologica Sinica 33(11): 1337–1338. [DOI] [PMC free article] [PubMed] [Google Scholar]
- 14. Fanta Jönsson SJS, Backman JT, Karlsson MO, et al. (2007) Developmental pharmacokinetics of ciclosporin—A population pharmacokinetic study in paediatric renal transplant candidates. British Journal of Clinical Pharmacology 64(6): 772–784. [DOI] [PMC free article] [PubMed] [Google Scholar]
- 15. Irtan S, Saint-Marcoux F, Rousseau A, et al. (2007) Population pharmacokinetics and bayesian estimator of cyclosporine in pediatric renal transplant patients. Therapeutic Drug Monitoring 29: 96–102. [DOI] [PubMed] [Google Scholar]
- 16. Willemze AJ, Cremers SC, Schoemaker RC, et al. (2008) Ciclosporin kinetics in children after stem cell transplantation. British Journal of Clinical Pharmacology 66(4): 539–545. [DOI] [PMC free article] [PubMed] [Google Scholar]
- 17. Bing H, Siyi Y, Wei Z, et al. (2010) The use of antihuman T lymphocyte porcine immunoglobulin and cyclosporine a to treat patients with acquired severe aplastic anemia. Acta Haematologica 124: 245–250. [DOI] [PubMed] [Google Scholar]
- 18. Zahir H, Keogh AM, Akhlaghi F. (2006) Apparent clearance of sirolimus in heart transplant recipients: Impact of primary diagnosis and serum lipids. Therapeutic Drug Monitoring 28: 818–826. [PubMed] [Google Scholar]
- 19. Dansirikul C, Morris RG, Tett SE, et al. (2006) A Bayesian approach for population pharmacokinetic modelling of sirolimus. British Journal of Clinical Pharmacology 62(4): 420–434. [DOI] [PMC free article] [PubMed] [Google Scholar]
- 20. Jiao Z, Shi XJ, Li ZD, et al. (2009) Population pharmacokinetics of sirolimus in de novo Chinese adult renal transplant patients. British Journal of Clinical Pharmacology 68(1): 47–60. [DOI] [PMC free article] [PubMed] [Google Scholar]
- 21. Tejani A1, Alexander S, Ettenger R, et al. (2004) Safety and pharmacokinetics of ascending single doses of sirolimus (Rapamune, rapamycin) in pediatric patients with stable chronic renal failure undergoing dialysis. Pediatric Transplantation 8(2): 151–160. [DOI] [PubMed] [Google Scholar]
- 22. Siber GR, Echeverria P, Smith AL, et al. (1975) Pharmacokinetics of gentamicin in children and adults. The Journal of Infectious Diseases 132: 637–651. [DOI] [PubMed] [Google Scholar]
- 23. Kearns GL, Abdel-Rahman SM, Alander SW, et al. (2003) Developmental pharmacology-drug disposition, action, and therapy in infants and children. The New England Journal of Medicine 349: 1157–1167. [DOI] [PubMed] [Google Scholar]
- 24. Emoto C, Fukuda T, Mizuno T, et al. (2016) Characterizing the developmental trajectory of sirolimus clearance in neonates and infants. CPT: Pharmacometrics and Systems Pharmacology 5(8): 411–417. [DOI] [PMC free article] [PubMed] [Google Scholar]
- 25. Emoto C, Fukuda T, Johnson TN, et al. (2015) Development of a pediatric physiologically based pharmacokinetic model for sirolimus: Applying principles of growth and maturation in neonates and infants. CPT: Pharmacometrics and Systems Pharmacology 4(2): e17–e18. [DOI] [PMC free article] [PubMed] [Google Scholar]