

Abstract
Background
Multiple sclerosis (MS) is a common demyelinating disease of the central nervous system. Although the exact pathogenesis remains unknown, the leading theory is that it results from immune system dysregulation. Approved disease‐modifying therapy appears to modulate the immune system to improve MS‐related outcomes. There is substantial interest in the ability of dietary interventions to influence MS‐related outcomes. This is an update of the Cochrane Review 'Dietary interventions for multiple sclerosis' (Farinotti 2003; Farinotti 2007; Farinotti 2012).
Objectives
To assess the effects of dietary interventions (including dietary plans with recommendations for specific whole foods, macronutrients, and natural health products) compared to placebo or another intervention on health outcomes (including MS‐related outcomes and serious adverse events) in people with MS.
Search methods
On 30 May 2019, we searched CENTRAL, MEDLINE, Embase, and Web of Science. We also searched ClinicalTrials.gov, World Health Organization International Clinical Trials Registry Platform (ICTRP), and Networked Digital Library of Theses and Dissertations (NDLTD). We checked reference lists in identified trials and requested information from trial authors to identify any additional published or unpublished data.
Selection criteria
We included any randomized controlled trial (RCT) or controlled clinical trial (CCT) examining the effect of a dietary intervention versus placebo or another intervention among participants with MS on MS‐related outcomes, including relapses, disability progression, and magnetic resonance imaging (MRI) measures.
Data collection and analysis
We used standard methodological procedures expected by Cochrane. Planned primary outcomes were number of participants experiencing relapse and change in disability progression, according to a validated disability scale at the last reported follow‐up. Secondary outcomes included MRI activity, safety, and patient‐reported outcomes. We entered and analysed data in Review Manager 5.
Main results
We found 41 full‐text articles examining 30 trials following full‐text review. Participants were adults with MS, defined by established criteria, presenting to MS clinics in Europe, North America, and the Middle East. Study design varied considerably, although all trials had at least one methodological issue leading to unknown or high risk of bias. Trials examined: supplementation to increase polyunsaturated fatty acids (PUFAs) (11 trials); a variety of antioxidant supplements (10 trials); dietary programmes (3 trials); and other dietary supplements (e.g. acetyl L‐carnitine, biotin, creatine, palmitoylethanolamide, probiotic, riboflavin) (6 trials).
In three trials comparing PUFAs with monounsaturated fatty acids (MUFAs), the evidence was very uncertain concerning difference in relapses (risk ratio (RR) 1.02, 95% confidence interval (CI) 0.88 to 1.20; 3 studies, 217 participants; 75% in the PUFA group versus 74% in the MUFA group; very low‐certainty evidence). Among four trials comparing PUFAs with MUFAs, there may be little to no difference in global impression of deterioration (RR 0.85, 95% CI 0.71 to 1.03; 4 studies, 542 participants; 40% in the PUFA group versus 47% in the MUFA group; low‐certainty evidence). In two trials comparing PUFAs with MUFAs (102 participants), there was very low‐certainty evidence for change in disability progression. None of the PUFA versus MUFA trials examined MRI outcomes. In one trial comparing PUFAs with MUFAs (40 participants), there were no serious adverse events; based on low‐certainty evidence.
In two trials comparing different PUFAs (omega‐3 versus omega‐6), there may be little to no difference in relapses (RR 1.02, 95% CI 0.62 to 1.66; 2 studies, 129 participants; 30% in the omega‐3 versus 29% in the omega‐6 group; low‐certainty evidence). Among three trials comparing omega‐3 with omega‐6, there may be little to no difference in change in disability progression, measured as mean change in Expanded Disability Status Scale (EDSS) (mean difference (MD) 0.00, 95% CI ‐0.30 to 0.30; 3 studies, 166 participants; low‐certainty evidence). In one trial comparing omega‐3 with omega‐6, there was likely no difference in global impression of deterioration (RR 0.99, 95% CI 0.51 to 1.91; 1 study, 86 participants; 29% in omega‐3 versus 29% in omega‐6 group; moderate‐certainty evidence). In one trial comparing omega‐3 with omega‐6 (86 participants), there was likely no difference in number of new T1‐ weighted gadolinium‐enhancing lesions, based on moderate‐certainty evidence. In four trials comparing omega‐3 with omega‐6, there may be little to no difference in serious adverse events (RR 1.12, 95% CI 0.38 to 3.31; 4 studies, 230 participants; 6% in omega‐3 versus 5% in omega‐6 group; low‐certainty evidence).
In four trials examining antioxidant supplementation with placebo, there may be little to no difference in relapses (RR 0.98, 95% CI 0.59 to 1.64; 4 studies, 345 participants; 17% in the antioxidant group versus 17% in the placebo group; low‐certainty evidence). In six trials examining antioxidant supplementation with placebo, the evidence was very uncertain concerning change in disability progression, measured as mean change of EDSS (MD ‐0.19, 95% CI ‐0.49 to 0.11; 6 studies, 490 participants; very low‐certainty evidence). In two trials examining antioxidant supplementation with placebo, there may be little to no difference in global impression of deterioration (RR 0.99, 95% 0.50 to 1.93; 2 studies, 190 participants; 15% in the antioxidant group versus 15% in the placebo group; low‐certainty evidence). In two trials examining antioxidant supplementation with placebo, the evidence was very uncertain concerning difference in gadolinium‐enhancing lesions (RR 0.67, 95% CI 0.09 to 4.88; 2 studies, 131 participants; 11% in the antioxidant group versus 16% in the placebo group; very low‐certainty evidence). In three trials examining antioxidant supplementation versus placebo, there may be little to no difference in serious adverse events (RR. 0.72, 95% CI 0.17 to 3.08; 3 studies, 222 participants; 3% in the antioxidant group versus 4% in the placebo group; low‐certainty evidence).
Authors' conclusions
There are a variety of controlled trials addressing the effects of dietary interventions for MS with substantial variation in active treatment, comparator, and outcomes of interest. PUFA administration may not differ when compared to alternatives with regards to relapse rate, disability worsening, or overall clinical status in people with MS, but evidence is uncertain. Similarly, at present, there is insufficient evidence to determine whether supplementation with antioxidants or other dietary interventions have any impact on MS‐related outcomes.
Keywords: Adult; Humans; Antioxidants; Antioxidants/administration & dosage; Diet, Fat-Restricted; Diet, Paleolithic; Diet, Vegetarian; Dietary Supplements; Disease Progression; Fatty Acids, Monounsaturated; Fatty Acids, Monounsaturated/therapeutic use; Fatty Acids, Omega-3; Fatty Acids, Omega-3/administration & dosage; Fatty Acids, Omega-6; Fatty Acids, Omega-6/administration & dosage; Fatty Acids, Unsaturated; Fatty Acids, Unsaturated/administration & dosage; Multiple Sclerosis; Multiple Sclerosis/diet therapy; Randomized Controlled Trials as Topic; Recurrence
Plain language summary
Dietary interventions for multiple sclerosis‐related outcomes
Review question
We assessed the effects of any dietary intervention for multiple sclerosis (MS) (with the exception of vitamin D, which is the subject of a separate Cochrane Review). We used the evidence from randomized controlled trials which are a type of study whereby people are allocated at random to receive one of the clinical interventions.
Background
MS is a disorder where there is damage to the connecting fibres (white matter) in the brain and spinal cord. This can result in a variety of neurological symptoms, including weakness, vision loss, sensory alteration, incoordination, and problems with bowel and bladder. The cause is unknown, but the leading theory is that the body's own immune system plays a role in the disease. Approved treatments for MS work by regulating the immune system. There is interest in whether dietary interventions, such as specific diets or dietary supplements may influence MS.
Study characteristics
From our search of the literature, we found 41 full‐text reports of 30 trials, studying a variety of dietary interventions. Eleven trials examined polyunsaturated fatty acids (PUFAs), 10 examined a variety of antioxidant supplements, three examined dietary programmes, and six trials examined other dietary supplements.
Key results and certainty of the evidence
Among clinical trials comparing PUFAs to monounsaturated fatty acids (MUFAs), there may be little to no difference in MS relapses or global impression of deterioration. A single trial comparing PUFAs with MUFAs reported no serious adverse events. Among trials comparing one PUFA type to another, there may be little to no difference in MS relapses or disability progression. There was likely no difference in global impression of deterioration or enhancing MS lesions by PUFA type. There may be little to no difference in serious adverse events by PUFA type. Among studies examining antioxidant supplementation, there may be little to no difference in MS relapses or global impression of deterioration. There was very low‐certainty evidence regarding the effect of antioxidant versus placebo on disability worsening and enhancing MS lesions. There may be little to no difference in serious adverse events between antioxidant and placebo. Otherwise, studies of dietary programmes and other dietary supplements were too different to group together for analysis. Many of the trials had problems with their design or implementation that could have affected our confidence in the results. At present, there is insufficient high‐certainty evidence as to whether dietary interventions change the course of MS.
The evidence is current to May 2019.
Summary of findings
Summary of findings 1. Polyunsaturated fatty acid (PUFA) compared to monounsaturated fatty acid (MUFA) for multiple sclerosis (MS).
| PUFA compared to MUFA for multiple sclerosis | ||||||
| Patient or population: adults with multiple sclerosis, defined by established criteria Setting: multiple sclerosis clinics in Cyprus, UK and USA Intervention: PUFA (including linolenic acid, linoleic acid, docosahexaenoic acid, eicosapentaenoic acid) Comparison: MUFA (primarily oleic acid) | ||||||
| Outcomes | Anticipated absolute effects* (95% CI) | Relative effect (95% CI) | № of participants (studies) | Certainty of the evidence (GRADE) | Comments | |
| Risk with MUFA | Risk with PUFA | |||||
| Relapse (assessed as number of participants experiencing relapse) Follow‐up: 1 to 2 years | Adults with MS: | RR 1.02 (0.88 to 1.20) | 217 (3 RCTs) | ⊕⊝⊝⊝ Very lowa | There may be little to no benefit of PUFA versus MUFA on relapses, although evidence is very uncertain. | |
| 74 per 100 | 75 per 100 (65 to 88) | |||||
| Change in validated disability scale (assessed with EDSS ‐ scale: 0 to 10) Follow‐up: 1 to 2 years |
Millar 1973 reported no difference in change in EDSS between PUFA and MUFA over two years. Weinstock‐Guttman 2005 reported increase (worsening) in EDSS with MUFA (mean increase 0.35) compared to a decrease (improvement) in EDSS with PUFA (mean decrease 0.07) over one year. | ‐ | 102 (2 RCT) | ⊕⊝⊝⊝ Very lowb | ||
| Global impression of deterioration (investigator defined global impression of deterioration) Follow‐up: 24 to 30 months |
Adults with MS: | RR 0.85 (0.71 to 1.03) | 542 (4 RCTs) | ⊕⊕⊝⊝ Lowc | There may be little to no benefit of PUFA versus MUFA on global impression of deterioration. | |
| 47 per 100 | 40 per 100 (34 to 49) | |||||
| MRI activity ‐ not measured | ‐ | ‐ | ‐ | ‐ | ‐ | |
| SAEs (assessed as number of participants experiencing a SAE) Follow‐up: 30 months |
Pantzaris 2013 reported no adverse events in any of 4 groups, including among 20 participants receiving PUFA and 20 participants receiving MUFA | ‐ | 40 (1 RCT) | ⊕⊕⊝⊝ Lowd | ||
| *The risk in the intervention group (and its 95% confidence interval) is based on the assumed risk in the comparison group and the relative effect of the intervention (and its 95% CI). CI: confidence interval; EDSS: Expanded Disability Status Scale; MS: multiple sclerosis; MUFA: monounsaturated fatty acid; PUFA: polyunsaturated fatty acid; RCT: randomized control trial; RR: risk ratio; SAE: serious adverse event | ||||||
| GRADE Working Group grades of evidence High certainty: we are very confident that the true effect lies close to that of the estimate of the effect. Moderate certainty: we are moderately confident in the effect estimate; the true effect is likely to be close to the estimate of the effect, but there is a possibility that it is substantially different. Low certainty: our confidence in the effect estimate is limited; the true effect may be substantially different from the estimate of the effect. Very low certainty: we have very little confidence in the effect estimate; the true effect is likely to be substantially different from the estimate of effect. | ||||||
aDowngraded three levels for very serious risk of bias (including high risk of attrition bias in 2 studies and uncertain risk of attrition bias in 1 study) and serious imprecision (small sample size in all studies). bDowngraded three levels for very serious risk of bias (including high risk of performance bias, detection bias, attrition bias) and serious imprecision (small sample size). cDowngraded two levels for very serious risk of bias (including high risk of attrition bias in 2 studies and uncertain risk of attrition bias in 2 studies along with high risk of reporting bias in 2 studies where definition of improved and deteriorated was not provided). dDowngraded two levels for serious risk of bias (including high risk of attrition bias) and serious imprecision (small sample size).
Summary of findings 2. Omega‐3 compared to omega‐6 for multiple sclerosis (MS).
| Omega‐3 compared to omega‐6 for multiple sclerosis | ||||||
| Patient or population: adults with multiple sclerosis, defined by established criteria Setting: multiple sclerosis clinics in Iran, Mexico, Norway and USA Intervention: omega‐3 (fish oil including docosahexaenoic acid and eicosapentaenoic acid) Comparison: omega‐6 (corn oil, soybean oil, and sunflower oil including linoleic acid) | ||||||
| Outcomes | Anticipated absolute effects* (95% CI) | Relative effect (95% CI) | № of participants (studies) | Certainty of the evidence (GRADE) | Comments | |
| Risk with omega‐6 | Risk with omega‐3 | |||||
| Relapse (assessed as number of participants experiencing relapse) Follow‐up: 1 to 2 years | Adults with RRMS exposed to DMT (interferon beta or fingolimod): | RR 1.02 (0.62 to 1.66) | 129 (2 RCTs) | ⊕⊕⊝⊝ Lowa | There may be little to no benefit of omega‐3 versus omega‐6 on relapses. | |
| 29 per 100 | 30 per 100 (18 to 48) | |||||
| Change in validated disability scale (assessed with EDSS ‐ scale: 0 to 10) Follow‐up: 1 to 2 years |
Adults with RRMS exposed to DMT (interferon beta or fingolimod): | ‐ | 166 (3 RCTs) | ⊕⊕⊝⊝ Lowb | There may be little to no benefit of omega‐3 versus omega‐6 on disability worsening. | |
| Mean EDSS 2.1 | MD 0.00 (0.30 lower to 0.30 higher) | |||||
| Global impression of deterioration (investigator defined global impression of deterioration) Follow‐up: 2 years |
Adults with RRMS exposed to DMT (interferon beta): | RR 0.99 (0.51 to 1.91) | 86 (1 RCT) | ⊕⊕⊕⊝ Moderatec | Omega‐3 is unlikely to change the global impression of deterioration. | |
| 29 per 100 | 29 per 100 (15 to 56) | |||||
| MRI activity (assessed by new gadolinium‐enhancing lesions) Follow‐up: 2 years | Torkildsen 2012: There was no difference in the number of new T1‐ weighted gadolinium‐enhancing lesions between the omega‐3 and omega‐6 groups at 24 months (P = 0.17). | ‐ | 86 (1 RCT) | ⊕⊕⊕⊝ Moderatec | ||
| SAEs (assessed as number of participants experiencing a SAE) Follow‐up: 3 to 24 months |
Adults with MS: | RR 1.12 (0.38 to 3.31) | 230 (4 RCTs) | ⊕⊕⊝⊝ Lowd | There may be little to no difference between omega‐3 and omega‐6 on serious adverse events. | |
| 5 per 100 | 6 per 100 (2 to 18) | |||||
| *The risk in the intervention group (and its 95% confidence interval) is based on the assumed risk in the comparison group and the relative effect of the intervention (and its 95% CI). CI: confidence interval; DHA: docosahexaenoic acid; DMT: disease‐modifying therapy; EDSS: Expanded Disability Status Scale; EPA: eicosapentaenoic acid; MD: mean difference; MS: multiple sclerosis; PUFA: polyunsaturated fatty acid; RCT: randomized control trial; RR: risk ratio; RRMS: relapsing remitting multiple sclerosis; SAE: serious adverse event | ||||||
| GRADE Working Group grades of evidence High certainty: we are very confident that the true effect lies close to that of the estimate of the effect. Moderate certainty: we are moderately confident in the effect estimate; the true effect is likely to be close to the estimate of the effect, but there is a possibility that it is substantially different. Low certainty: our confidence in the effect estimate is limited; the true effect may be substantially different from the estimate of the effect. Very low certainty: we have very little confidence in the effect estimate; the true effect is likely to be substantially different from the estimate of effect. | ||||||
aDowngraded two levels for serious risk of bias (including uncertain risk of attrition bias in 2 studies) and serious imprecision (small sample size in both studies). bDowngraded two levels for serious risk of bias (including high risk of attrition bias in 1 study and uncertain risk of attrition bias in 2 studies) and serious imprecision (small sample size in all studies). cDowngraded one level for serious imprecision (small sample size). dDowngraded two levels for serious risk of bias (including high risk of attrition bias in 2 studies and uncertain risk of attrition bias in 2 studies) and serious imprecision (small sample size in all studies).
Summary of findings 3. Antioxidant compared to placebo for multiple sclerosis (MS).
| Antioxidant compared to placebo for multiple sclerosis | ||||||
| Patient or population: adults with multiple sclerosis, defined by established criteria Setting: multiple sclerosis clinics in France, Iran, Spain and USA Intervention: antioxidant (including coenzyme Q10, cranberry extract, inosine, lipoic acid, vitamin A) Comparison: placebo | ||||||
| Outcomes | Anticipated absolute effects* (95% CI) | Relative effect (95% CI) | № of participants (studies) | Certainty of the evidence (GRADE) | Comments | |
| Risk with placebo | Risk with antioxidant | |||||
| Relapse (assessed as number of participants experiencing relapse) Follow‐up: 3 to 12 months | Adults with MS: | RR 0.98 (0.59 to 1.64) | 345 (4 RCTs) | ⊕⊕⊝⊝ Lowa | There may be little to no benefit of antioxidant versus placebo on relapses. | |
| 17 per 100 | 17 per 100 (10 to 28) | |||||
| Change in validated disability scale (assessed with EDSS ‐ scale: 0 to 10) Follow‐up: 3 to 24 months |
Adults with MS: | ‐ | 490 (6 RCTs) | ⊕⊝⊝⊝ Very lowc | There may be little to no benefit of antioxidant versus placebo on progression, although evidence is very uncertain. | |
| Mean EDSS 3.0b | MD 0.19 lower (0.49 lower to 0.11 higher) | |||||
| Global impression of deterioration (investigator defined global impression of deterioration) Follow‐up: 9 to 24 months |
Adults with RRMS exposed to DMT (interferon beta): | RR 0.99 (0.50 to 1.93) | 190 (2 RCTs) | ⊕⊕⊝⊝ Lowd | There may be little to no benefit of antioxidant versus control on global impression deterioration. | |
| 15 per 100 | 15 per 100 (8 to 29) | |||||
| MRI activity
(assessed as number of participants with gadolinium‐enhancing lesions) Follow‐up: 3 to 12 months |
Adults with RRMS: | RR 0.67 (0.09 to 4.88) | 131 (2 RCTs) | ⊕⊝⊝⊝ Very lowe | There may be little to no benefit of antioxidant versus control on gadolinium‐enhancing lesions, although evidence is very uncertain. | |
| 16 per 100 | 11 per 100 (1 to 77) | |||||
| SAEs (assessed as number of participants experiencing a SAE) Follow‐up: 2 weeks to 1 year |
Adults with MS: | RR 0.72 (0.17 to 3.08) | 222 (3 RCTs) | ⊕⊕⊝⊝ Lowf | There may be little to no difference in serious adverse events between antioxidant and placebo. | |
| 4 per 100 | 3 per 100 (1 to 11) | |||||
| *The risk in the intervention group (and its 95% confidence interval) is based on the assumed risk in the comparison group and the relative effect of the intervention (and its 95% CI). CI: confidence interval; DMT: disease‐modifying therapy; EDSS: Expanded Disability Status Scale; MD: mean difference: MS: multiple sclerosis; RCT: randomized control trial; RR: risk ratio; RRMS: relapsing remitting multiple sclerosis; SAE: serious adverse event | ||||||
| GRADE Working Group grades of evidence High certainty: we are very confident that the true effect lies close to that of the estimate of the effect. Moderate certainty: we are moderately confident in the effect estimate; the true effect is likely to be close to the estimate of the effect, but there is a possibility that it is substantially different. Low certainty: our confidence in the effect estimate is limited; the true effect may be substantially different from the estimate of the effect. Very low certainty: we have very little confidence in the effect estimate; the true effect is likely to be substantially different from the estimate of effect. | ||||||
aDowngraded two levels for serious risk of bias (including high risk of attrition bias in 1 study and uncertain risk of attrition bias in 2 studies) and serious imprecision (small sample size in all studies). bMean EDSS does not include Bitarafan 2015, as absolute final EDSS was not provided after contacting author. cDowngraded three levels for very serious risk of bias (including high risk of attrition bias in 3 studies and uncertain risk of attrition bias in 3 studies) and serious inconsistency in EDSS between studies. dDowngraded two levels for serious risk of bias (including high risk of attrition bias in 1 study) and serious imprecision (small sample size in both studies). eDowngraded three levels for serious risk of bias (including high risk of attrition bias in 1 study and uncertain risk of attrition bias in 1 study), serious inconsistency in number of participants experiencing gadolinium‐enhancing lesions between studies, and serious imprecision (small sample size in both studies). fDowngraded two levels for serious risk of bias (including high risk of attrition bias in 1 study and high risk of reporting bias in 1 study) and serious imprecision (small sample size in all studies).
Background
In this update of the Cochrane Review 'Dietary interventions for multiple sclerosis' (Farinotti 2003; Farinotti 2007; Farinotti 2012), we assess a broad range of dietary interventions in multiple sclerosis (MS), with the exclusion of vitamin D which is the subject of another Cochrane Review (Jagannath 2018). As conventional therapies are only partially effective, people with MS widely use complementary and alternative medicine (CAM) with dietary interventions among the most popular form of CAM (Pucci 2004; Leong 2009).
Description of the condition
Multiple sclerosis (MS) is a demyelinating disease of the central nervous system (Noseworthy 2000). The estimated worldwide prevalence of MS is greater than 2 million, with twice as many females affected as males (Atlas of MS 2013). The prevalence of MS varies by continent, with Europe and North America having the highest prevalence, at more than 100 per 100,000 individuals (Atlas of MS 2013).
Although MS aetiology and pathogenesis remain poorly understood, it is widely accepted that the disease has an immune‐mediated basis (even if the target antigen remains undetermined), and occurs in genetically susceptible individuals (Kamm 2014). Inflammation is believed to result in relapses and focal lesions while neurodegeneration is believed to be responsible for disability progression and brain atrophy (Ziemssen 2016). MS lesions consist largely of T lymphocytes and macrophages with B lymphocytes shown to activate proinflammatory T lymphocytes (Bar‐Or 2010; Lucchinetti 2005).
Approximately 85% of people with MS initially experience relapsing remitting symptoms, while approximately 15% experience gradual progression from symptom onset (Kamm 2014; Noseworthy 2000). Diagnosis of MS is defined by criteria for relapsing remitting MS (RRMS) and primary progressive MS (PPMS) (Lublin 1996; Poser 1983; Schumacher 1965; Thompson 2018). Ongoing description of MS includes assessment of the disease modifiers of activity (relapses or new inflammatory lesions on imaging) and progression (gradual accumulation of disability) (Lublin 2014).
Despite advances in treatments, there is still no cure. MS management is also largely directed at relieving symptoms, which arise variably in the course of the disease. There are a number of disease‐modifying therapies used in the treatment of relapsing forms of MS, including glatiramer acetate, interferon beta, teriflunomide, dimethyl fumarate, fingolimod, natalizumab, alemtuzumab, ocrelizumab, and cladribine (Giovannoni 2018; Hauser 2017; Torkildsen 2016). While disease‐modifying therapies have been shown to reduce inflammatory relapses compared to placebo or an active comparator in randomized controlled trials (RCTs), the long‐term effect on disability progression is less clear, as conclusions are drawn from observational studies (Trojano 2011). In a cohort study, where the majority of individuals with RRMS were treated with glatiramer acetate, or interferon beta, or both, conversion from relapsing remitting to secondary progressive MS (SPMS) was substantially lower than earlier studies conducted before the availability of effective disease‐modifying therapy, at approximately 15 years after disease onset (Cree 2016). There are few disease‐modifying therapies for progressive MS, although ocrelizumab recently demonstrated modest reduction in disability progression in PPMS (Montalban 2017).
Description of the intervention
We assess a broad range of dietary interventions, with the exception of vitamin D, which is the subject of the Cochrane Review 'Vitamin D for the management of multiple sclerosis' (Jagannath 2018). In particular, eligible interventions include dietary programmes with recommendations for specific whole foods, macronutrients (i.e. fats), and supplementation with natural health products (i.e. vitamins, minerals). All interventions could be administered with or without exercise, behavioural support, or other lifestyle interventions.
How the intervention might work
Dietary programmes with recommendations for specific whole foods
We were interested in standardized dietary programmes that have been evaluated in MS. An association between MS and consumption of saturated fats has been reported (Esposito 2018). In addition, vascular risk factors, including hypertension and dyslipidaemia have been associated with disability progression among individuals with MS (Marrie 2010). A diet low in fat may help reduce vascular risk factors. The McDougall and Swank diets are low‐fat diets that have very low consumption of saturated fats (Swank 2003a; Yadav 2016). Swank proposed that saturated fats obstruct capillaries, leading to MS (Swank 2003b). The Mediterranean diet is low in saturated fat, with the main fat source being olive oil (Altowaijri 2017). Olive oil contains phenols, which scavenge free radicals, and may be neuroprotective. The Mediterranean diet is associated with reduced risk of vascular complications (Estruch 2013). The Paleolithic (Paleo) diet promotes consumption of food available to Paleolithic ancestors, including leafy vegetables and lean meats (Altowaijri 2017).
Macronutrients
Polyunsaturated fatty acids (PUFAs) include omega‐6 fatty acids (e.g. linoleic acid) and omega‐3 fatty acids (e.g. alpha‐linolenic acid, eicosapentaenoic acid, and docosahexaenoic acid) (Mehta 2009). In a large prospective study, increased consumption of PUFAs has been associated with reduced risk of MS (Bjornevik 2017). PUFAs may have anti‐inflammatory or immunomodulatory effects (Mehta 2009).
Natural health products
Biotin (vitamin H) is a cofactor in carboxylation reactions that may enhance fatty acid synthesis and support myelin repair (Tourbah 2016). High dose biotin (300 mg per day) may reduce disability progression among individuals with progressive forms of MS.
Cobalamin (vitamin B12) deficiency may result in decreased non‐genomic methylation, including myelin basic protein and membrane phospholipids, possibly contributing to demyelination (Reynolds 2006). Meta‐analysis did not reveal a significant difference in vitamin B12 levels between individuals with MS and controls, although there was higher homocysteine in the blood of individuals with MS compared to controls (Dardiotis 2017). Homocysteine is converted to methionine by methionine synthase which requires vitamin B12 as a cofactor, thus vitamin B12 deficiency results in hyperhomocysteinemia (Dardiotis 2017).
Oxidative stress is proposed to contribute to MS (Adamczyk 2016). Antioxidants neutralize free radicals and prevent oxidation reactions. Antioxidants include beta‐carotene (vitamin A precursor), ascorbic acid (vitamin C), alpha‐tocopherol (vitamin E), selenium, as well as, polyphenols including curcumin found in tumeric and quercetin found in ginkgo biloba (Adamczyk 2016; Esposito 2018).
Why it is important to do this review
Complementary and alternative medicine (CAM) is an area of intense interest for the MS community (Claflin 2018). Among surveyed individuals with MS, use of a CAM therapy ranges from 37% to 100% (Claflin 2018). As the term suggests, CAM is beyond the scope of conventional medicine and includes a range of practices. Dietary interventions are among the most popular form of CAM (Leong 2009; Pucci 2004), with MS patients more likely than other populations to adopt a dietary intervention (O'Connor 2012). The decision to initiate a dietary intervention is due to a broad range of MS symptoms, along with a desire to improve overall well‐being (Leong 2009). To date, there are limited evidence‐based recommendations regarding dietary interventions for MS (Yadav 2014).
Objectives
To assess the effects of dietary interventions (including dietary plans with recommendations for specific whole foods, macronutrients, and natural health products) compared to placebo or another intervention on health outcomes (including MS‐related outcomes and serious adverse events) in people with MS.
Methods
Criteria for considering studies for this review
Types of studies
We considered randomized controlled trials (RCTs) and controlled clinical trials (CCTs) examining the effects of a dietary intervention for MS versus placebo or another intervention (head‐to‐head comparison study design). We considered cluster‐randomized and cross‐over trial designs. For cross‐over trials, to avoid a unit of analysis error, we planned to only include the first period of randomization to intervention or control. We excluded studies with historical controls, ecological studies and uncontrolled pre‐post evaluations (studies that used pretreatment data as the comparison for treatment effect, without randomizing patient allocation), as these provide unreliable data for determining associations.
Types of participants
We included adult individuals with diagnosis of MS, defined by established criteria (Lublin 1996; Poser 1983; Schumacher 1965; Thompson 2018). We included individuals regardless of age, sex, duration of MS, degree of disability, course of the disease and current/prior MS therapy.
Types of interventions
We considered any dietary intervention including dietary plans, specific foods, macronutrients, or natural health products compared to placebo or another intervention. We did not consider vitamin D, as this is examined in another Cochrane Review (Jagannath 2018). We considered trials reporting dietary interventions along with pharmaceutical interventions only if the pharmaceutical intervention was administered to both arms. There was no minimum duration of intervention, although we excluded single doses of an intervention as a single dose was not representative of a dietary intervention. There was no minimum follow‐up interval.
Types of outcome measures
Primary outcomes
Primary outcomes were assessed at the last reported follow‐up.
Relapse among individuals with MS, within the follow‐up period. Relapse is typically defined as a clinical episode with symptoms and signs typical of MS, with a duration of at least 24 hours, with or without recovery, in the absence of fever or infection (Thompson 2018).
-
Change in any validated disability scale, among individuals with MS, over the study period including:
Expanded Disability Status Scale (EDSS) (Kurtzke 1983); and
Multiple Sclerosis Functional Composite (MSFC) (Cohen 2012).
EDSS ranges from 0 (no neurologic abnormality) to 10 (death due to MS). Disability progression is typically defined as an increase of ≥ 1 point in EDSS if baseline score < 5.5 and of ≥ 0.5 points in EDSS if baseline score ≥ 5.5. The EDSS is the most widely accepted measure of MS disability progression (Cohen 2012).
Secondary outcomes
Secondary outcomes were assessed at the last reported follow‐up.
Number of individuals with MS improved or deteriorated, as determined by a patient or investigator global impression of change, or other applied measure of global assessment. Global impression of deterioration was defined as investigator reported worsening or progression. This included the number of participants experiencing progression according to the study definition of a significant deterioration in EDSS.
Magnetic resonance imaging (MRI) activity, i.e. new T2‐hyperintense lesions or gadolinium‐enhancing lesions in people with MS during the study period.
-
Cognitive function characterized by any validated instrument, i.e.
Brief Repeatable Battery of Neuropsychological Tests (BRB‐N) (Boringa 2001); and
Paced Auditory Serial Addition Test (PASAT) (Tombaugh 2006).
Participant‐reported outcomes
-
Health‐related quality of life, characterized by any validated instrument, i.e.
36‐Item Short Form Health Survey (SF‐36) (Brazier 1992); and
Multiple Sclerosis Quality of Life‐54 (MSQoL‐54) (Vickrey 1995).
-
Fatigue, characterized by any validated instrument, i.e.
Modified Fatigue Impact Scale (MFIS) (Fisk 1994); and
Fatigue Severity Scale (FSS) (Krupp 1989).
Safety
-
Number experiencing ≥ one severe adverse event(s) within the follow‐up period. Severe events were defined as:
fatal
life‐threatening
require or prolong hospitalization or
cause discontinuation of treatment.
We examined severe events to determine whether there were any significant safety issues associated with dietary interventions or whether adverse events caused discontinuation of the intervention.
Search methods for identification of studies
To improve the comprehensiveness of our search, we worked with a health sciences librarian and revised the search strategy from the previous version of this review. We did not restrict our search by language or publication status. References were imported into Covidence (Covidence).
Electronic searches
On 30 May 2019, we searched the Cochrane Central Register of Controlled Trials (CENTRAL; 2019, Issue 4) in the Cochrane Library), MEDLINE (1966 to May 2019), Embase (1980 to May 2019), and the Web of Science (1945 to May 2019). We also searched trial registries, including ClinicalTrials.gov and the World Health Organization International Clinical Trials Registry Platform (ICTRP) portal for ongoing trials. We searched the Networked Digital Library of Theses and Dissertations (NDLTD) for any relevant trial not published in peer reviewed literature.
Detailed strategies are in the appendices: CENTRAL Appendix 1; MEDLINE Appendix 2; Embase Appendix 3; Web of Science Appendix 4; ClinicalTrials.gov and ICTRP Appendix 5.
Searching other resources
We checked all references in the identified trials and contacted trial authors to identify any additional published or unpublished data.
Data collection and analysis
We allocated studies to one of the following categories based on the intervention: polyunsaturated fatty acid (PUFA) supplementation, antioxidant supplementation, dietary programme, other dietary supplementation.
Selection of studies
Two review authors (NEP, RM, LV) first independently assessed the title and abstract of all studies identified by the searches to determine whether a study satisfied the eligibility criteria for the review. Then, two review authors (NEP, RM, LV, CJT) assessed the full text of all studies selected through this process and made a final decision regarding inclusion of the study. Any disagreement on the eligibility of included studies was managed through discussion and consensus. References were assessed in Covidence (Covidence).
Data extraction and management
Two review authors (NEP, CJT) independently extracted data for studies to be included in the review. The data were extracted using a predefined data extraction form created as a Microsoft Excel spreadsheet and entered into Review Manager (Review Manager 2014); both review authors re‐checked all entries and resolved all disagreements by discussion.
Our standardized data collection form contained the following.
Study identification information
Study characteristics, including trial design, inclusion/exclusion criteria, and length of follow‐up
Participant characteristics, including age, sex, MS subtype, prior/current disease‐modifying therapy, and participants lost to follow‐up
Intervention characteristics, including type, dose, duration, concomitant treatment, and comparator intervention
Primary and secondary outcome measures
'Risk of bias' assessment according to the Cochrane 'Risk of bias' tool for randomized trials (Higgins 2011)
For unreported study data regarding population, intervention, comparator, and outcomes, we attempted to contact the principal investigators of all studies that fulfilled selection criteria to obtain additional trial details.
Assessment of risk of bias in included studies
Two review authors (NEP, CJT, LV) independently evaluated each included study for risk of bias (RoB) using the 'Risk of bias' tool in the Cochrane Handbook for Systemic Reviews of Interventions (Higgins 2011).
We assessed the following domains as 'low risk', 'unclear risk' or 'high risk'.
Random sequence generation (selection bias)
Allocation concealment (selection bias)
Blinding of participants and personnel (performance bias)
Blinding of outcome assessment (detection bias)
Incomplete outcome data (attrition bias)
Selective reporting (reporting bias)
Other sources of bias (other bias)
Any disagreement was resolved by discussion among review authors.
Measures of treatment effect
We evaluated each dietary intervention separately. For continuous variables we extracted the number of participants, mean values, and standard deviations (SDs) for the experimental and control groups at baseline and at the end of follow‐up. If studies reported the same continuous outcomes (i.e. EDSS, SF‐36), we calculated the mean differences (MDs) with 95% confidence intervals (CIs). If outcome data were different but measured the same or similar constructs (i.e. cognition or overall quality of life), we calculated standardized mean differences (SMDs) with corresponding 95% CIs. For dichotomous variables, we extracted the number of participants with the outcome of interest and the total number of participants in each group. This was used to calculate a risk ratio (RR) with 95% CIs.
Unit of analysis issues
We did not encounter significant unit of analysis issues. If a study reported different doses of an intervention, we considered the highest dose in the analysis. If there were repeated measurements of outcomes over time, we considered the final measure as the one most relevant to the long‐term course of the participant. In cross‐over trials, we included only the first randomized arm.
Dealing with missing data
Missing data may be due to missing studies, outcomes, and individuals. In the event of missing data, we contacted the principal investigator of the trial with a request for data.
Assessment of heterogeneity
Heterogeneity among interventions was minimized by analysing each intervention separately. We evaluated heterogeneity of the effect of the intervention between trials using the Chi2 test with a significance level at P < 0.1. We also used the I2 statistic to quantify possible heterogeneity with I2 > 50% indicating substantial heterogeneity (Deeks 2017). If possible heterogeneity was detected, we planned to perform subgroup analysis to assess the reasons for heterogeneity.
Assessment of reporting biases
To ensure optimal completeness of identification of published trials, we searched multiple trial databases and reviewed references for relevant articles. To assess reporting bias, we searched trial registries for completed and unreported trials of dietary interventions for MS. In the event of unreported trials, the review authors planned to request results from the trial principal investigator. We used funnel plots to assess for small study bias (Egger 1997). We used caution in the interpretation of funnel plots where there were a small number of trials.
Data synthesis
We performed analysis separately for each intervention. We conducted meta‐analysis using a random‐effects model due to anticipated heterogeneity both within and between studies. Meta‐analysis for continuous outcomes analysed differences in means. Meta‐analysis for dichotomous outcomes analysed RR. We performed all analysis using Cochrane's Review Manager 5 software (Review Manager 2014).
Subgroup analysis and investigation of heterogeneity
We planned to perform subgroup analysis on participants with diagnosis of relapsing versus progressive subtypes of MS, anticipating that individuals with progressive MS will have greater disability; sex (male versus female), anticipating that men experience greater disability; age (< 55 years versus ≥ 55 years), anticipating that older individuals experience greater disability; dietary recommendations, provided with or without ongoing support in following the intervention, assuming that those who do not have ongoing support are less likely to follow dietary recommendations; and compliance with the dietary intervention, if this information was available. However, lack of data did not permit subgroup analysis.
Sensitivity analysis
We performed a sensitivity analysis to verify the presence of bias due to unequal distribution of losses to follow‐up. We used the total number of randomized participants as the denominator and assumed that all missing participants (lost to follow‐up) experienced the outcome event for dichotomous primary outcomes.
Summary of findings and assessment of the certainty of the evidence
We created 'Summary of findings' tables to summarize the effects of interventions for key outcomes, including relapses, progression, global impression of deterioration, MRI outcomes, and serious adverse events. We rated the evidence for each outcome according to the GRADE approach as high, moderate, low or very low certainty and provided the rationale for these decisions. We downgraded evidence for risk of bias, imprecision, indirectness, unexplained heterogeneity, or publication bias. We upgraded evidence for a large magnitude of effect, if all plausible confounding tended to underestimate an apparent intervention effect, and a dose‐response gradient (Atkins 2004). 'Summary of findings' tables were created using GRADEpro GDT (GRADEpro GDT).
Results
Description of studies
A summary of trial design, participants, interventions, and outcomes of the studies meeting the inclusion criteria are summarized in the 'Characteristics of included studies' tables.
Results of the search
Our search strategy identified 2096 unique references. We found 1070 in MEDLINE, 532 in Embase, 406 in CENTRAL, and 766 in Web of Science, with 2086 unique references. We found nine additional references in ClinicalTrials.gov with three of these references also found in the World Health Organization International Clinical Trials Registry Platform (ICTRP). We identified one additional reference from a review of the literature. We screened the titles and abstracts of all identified references, with 140 papers identified for full‐text review. Finally, we included 30 trials, comprising a total of 41 related full‐text articles.
We recorded the study selection process using a PRISMA flow diagram (Figure 1).
1.
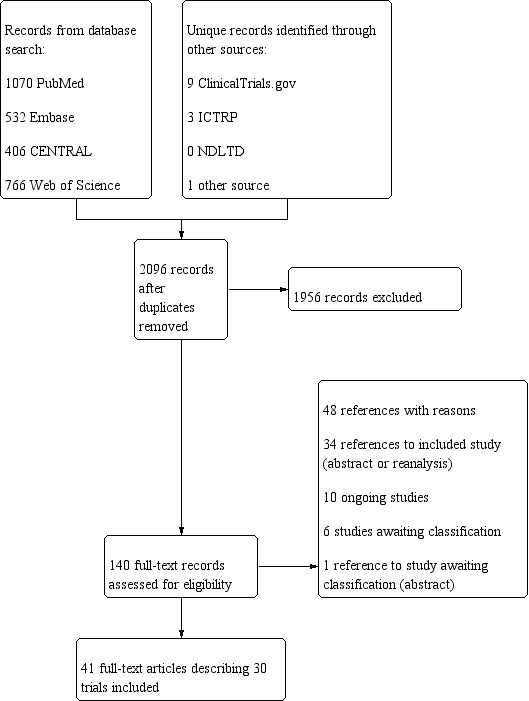
PRISMA Diagram
Included studies
Detailed descriptions of the study design, participant characteristics, and types of interventions used are provided in the Characteristics of included studies table.
Polyunsaturated fatty acid (PUFA) supplementation
We found 11 RCTs on PUFA supplementation (Bates 1977; Bates 1978; Bates 1989; Millar 1973; Pantzaris 2013; Paty 1978; Ramirez‐Ramirez 2013; Shinto 2016; Torkildsen 2012; Weinstock‐Guttman 2005; Zandi‐Esfahan 2017), described below.
Bates 1977 was a parallel group, randomized double‐blind trial of 152 participants with chronic progressive multiple sclerosis (MS) in the United Kingdom. Groups A (linolenic acid and linoleic acid) and C (linoleic acid) received the active treatment (polyunsaturated fatty acid; PUFA) while Groups B and D acted as controls, both receiving oleic acid (monounsaturated fatty acid; MUFA) supplementation. There was no difference in the relapse rate, although additional trial data were not available. After two years of treatment, 24/69 (34.8%) participants receiving PUFA deteriorated and 21/65 (32.3%) receiving MUFA deteriorated. This excluded 18 participants who either died or withdrew during the study, as this information was reported in aggregate form. Funding for this study was obtained from the Multiple Sclerosis Society of Great Britain and Northern Ireland.
Bates 1978 was a parallel group, randomized double‐blind trial of 116 participants with relapsing remitting (RRMS) MS in the United Kingdom. Groups A (linolenic acid and linoleic acid) and C (linoleic acid) received the active treatment (PUFA) while Groups B and D acted as controls, both receiving oleic acid (MUFA). After two years of treatment, 51/58 (87.9%) participants receiving PUFA experienced a relapse and 46/57 (80.7%) receiving MUFA experienced a relapse. Authors reported that at two years, there were significantly more patients in Group A than Group B who had deteriorated according to EDSS, although additional data were not available. Funding for this study was obtained from the Multiple Sclerosis Society of Great Britain and Northern Ireland.
Bates 1989 was a parallel group, randomized double‐blind trial of 312 participants with RRMS in the United Kingdom. The treatment group (PUFA) received fish oil capsules containing eicosapentaenoic acid and docosahexaenoic acid. The control group (MUFA) received capsules containing oleic acid. There was no significant difference in relapse rate although additional data were not available. After two years of treatment, 67/146 (45.9%) participants receiving PUFA and 82/147 (55.8%) receiving MUFA deteriorated, according to EDSS. Funding was obtained from the Multiple Sclerosis Society of Great Britain and Northern Ireland and Action MS ‐ Northern Ireland. The Marfleet Refining Company provided fish oil and control group capsules.
Millar 1973 was a parallel group, randomized double‐blind trial of 87 participants with "inactive MS" in the United Kingdom. The treatment group (PUFA) received sunflower seed emulsion containing linoleic acid. The control group (MUFA) received an emulsion containing primarily oleic acid. After two years of treatment, 25/36 (69.4%) participants receiving PUFA and 30/39 (76.9%) receiving MUFA experienced a relapse. After two years of treatment, EDSS in the treatment group was 3.1 and in the control group was 3.3, with no standard deviation (SD) available. After 2 years of treatment, 13/36 (36.1%) participants receiving PUFA and 18/39 (46.2%) receiving MUFA deteriorated. Funding was obtained from the Multiple Sclerosis Society.
Pantzaris 2013 was a parallel group, randomized double‐blind trial of 80 participants with RRMS in Cyprus. There were four groups: Group A (PUFA, vitamin A, low‐dose vitamin E), Group B (PUFA, vitamin A, high‐dose vitamin E), and Group C (high dose vitamin E), while Group D (olive oil largely composed of oleic acid) was a placebo intervention. There was a significant reduction in annualized relapse rate (ARR) comparing Group B to placebo with ARR 0.40 in Group B and 1.04 in Group D (P < 0.05) after two years of treatment. Group A had ARR 0.85, which was not significantly different from the placebo group. In the intention‐to‐treat analysis at 30 months, disability progression (defined as an increase in EDSS ≥ 1 confirmed at 6 months) occurred among six participants in Group A and seven participants in Group D. No significant adverse events were experienced in any group. Funding was obtained from the Cyprus Ministry of Commerce, Industry and Tourism.
Paty 1978 was a parallel group, randomized double‐blind trial of 96 participants with MS in Ontario, Canada. The treatment group (PUFA) received sunflower seed emulsion containing linoleic acid. The control group (MUFA) received olive emulsion containing primarily oleic acid. After 30 months of treatment, there was no difference in relapse number or severity between groups, although the number of individuals experiencing a relapse in either group was not reported. At 30 months, there was no difference in EDSS between groups, although EDSS attributed to the intervention and control group was unclear and SD was not provided. Funding was obtained from the Multiple Sclerosis Society of Canada.
Ramirez‐Ramirez 2013 was a parallel group, randomized double‐blind trial of 50 participants with RRMS in Mexico taking interferon beta‐1b 250 mcg subcutaneously once every two days ≥ one year prior to study enrolment. The active treatment group (PUFA ‐ omega‐3) received fish oil capsules containing eicosapentaenoic acid and docosahexaenoic acid along with excipient. The control group received placebo capsules containing excipient (glycerin, water, tocopherol, sunflower oil, and titanium dioxide). Sunflower oil is largely composed of linoleic acid (PUFA ‐ omega‐6). There was no difference in relapse rate after one year of treatment between the intervention (0.84, SD 0.9) and control (1.00, SD 1) groups. There was no difference in mean EDSS after one year of treatment between intervention (mean 2.20, SD 1.0) and control (mean 2.20, SD 0.8) groups. Fish oil supplementation was well‐tolerated and no severe adverse events occurred after one year in either group according to the study definition of severe adverse event. There were two participants in the fish oil group and one participant in the control group that discontinued the intervention due to adverse events. There was no reported funding.
Shinto 2016 was a parallel group, randomized double‐blind trial of 39 participants with MS and major depressive disorder taking an antidepressant in the United States. The active treatment group (PUFA‐ omega‐3) received fish oil capsules containing eicosapentaenoic acid and docosahexaenoic acid. The control group received placebo capsules containing soybean oil, which is largely composed of linoleic acid (PUFA ‐ omega‐6). There was no significant difference in the primary outcome of ≥ 50% improvement in the Montgomery‐Asberg Depression Rating Scale (MADRS) at three months. There was no significant difference in change in quality of life between groups, measured using the SF‐36 reported as mean change and standard error of the mean. There were no serious adverse events over three months, according to the study definition of serious adverse event, which was not explicitly stated. There was one participant in the fish oil group and two participants in the soybean oil group who discontinued the intervention due to adverse events. Funding was obtained from National Institutes of Health/National Center for Complementary and Alternative Medicine and National Center for Advancing Translational Research.
Torkildsen 2012 was a parallel group, randomized double‐blind trial of 92 participants with RRMS in Norway. The active treatment group (PUFA ‐ omega‐3) received eicosapentaenoic acid and docosahexaenoic acid. The control group received placebo capsules containing corn oil, which is largely composed of linoleic acid (PUFA ‐ omega‐6). After the first six months, all participants also received interferon beta‐1a 44 mcg three times/week for a further 18 months. There was no significant difference in the primary outcome of new T1‐weighted gadolinium‐enhancing lesions over the initial six months between the active treatment and control groups. In addition, there was no difference in new T1‐weighted gadolinium‐enhancing lesions after 24 months of treatment. At 24 months, 57% of the remaining 45 participants in the omega‐3 group and 58% of the remaining 41 participants in the control group remained relapse free. At 24 months of treatment, there was no significant difference in mean EDSS between the omega‐3 (mean 2.22, SD 1.32) and control (mean 2.19, SD 1.34) groups. Disease progression, although not defined, was reported to have occurred among 13 out of 45 participants in the omega‐3 group and 12 out of 41 in the control group over 24 months. After 24 months of treatment, there was no difference in MSFC, FSS, or SF‐36 scores between the omega‐3 and control groups. There were three participants in the omega‐3 group (fecal incontinence, abortion, anaemia) and one participant in the control group (urinary tract infection/pain) who experienced a serious adverse event according to the study protocol definition of serious adverse event. In addition, one participant in the fish oil group and two participants in the control group discontinued therapy for adverse events. Funding was obtained from Western Norway Regional Health Authority, Norwegian Multiple Sclerosis Society, Pronova Biocare, Amersham Health, and Merck‐Serono.
Weinstock‐Guttman 2005 was a parallel group, randomized double‐blind trial of 31 participants with RRMS in the United States. The active treatment group (PUFA) received capsules containing eicosapentaenoic acid and docosahexaenoic acid. The control group (MUFA) received capsules containing olive oil, which is largely composed of oleic acid. The primary outcome of physical component scale of the SF‐36 was greater in the fish oil compared to the placebo group at six months, but was not significant at 12 months. Unpublished data were obtained indicating 3/13 (23.1%) participants in the PUFA group and 5/14 (35.7%) participants in the MUFA group experienced a relapse after 12 months of treatment. There was a weak trend noted in slight improvement in EDSS in the PUFA group and slight worsening in the MUFA group, although limited data were provided. Fatigue, measured using the MFIS, demonstrated lower fatigue levels in the placebo group at six months compared to the active treatment group, although there was no significant difference between groups at 12 months. Funding was obtained from the National Multiple Sclerosis Society and Mellen Center Foundation.
Zandi‐Esfahan 2017 was a parallel group, randomized double‐blind trial of 50 participants with RRMS receiving fingolimod in Iran. The active treatment group (PUFA ‐ omega‐3) received capsules containing eicosapentaenoic acid and docosahexaenoic acid along with excipient. The control group (PUFA ‐ omega‐6) received capsules containing only excipient (glycerin, water, tocopherol, sunflower oil, titanium dioxide). Sunflower oil contains linoleic acid. The primary outcome was cytokine levels at 12 months, which did not differ between groups. There was no difference in change of EDSS over 12 months of treatment between groups. Over 12 months of treatment, one participant in the active treatment group and one participant in the control group experienced a relapse after which they were removed from the study. Three participants were excluded for hypotension/bradycardia secondary to fingolimod, which was administered to both groups. Funding was obtained from the Vice‐Chancellor for Research and Technology of Isfahan University of Medical Sciences.
Antioxidant supplementation
We found 10 RCTs evaluating antioxidants with a focus on inosine (Gonsette 2010; Markowitz 2009; Munoz Garcia 2015), lipoic acid (Khalili 2012; Khalili 2014; Yadav 2005), vitamin A (Bitarafan 2015), cranberry (Gallien 2014), epigallocatechin‐3‐gallate (Mahler 2015), and coenzyme Q10 (Sanoobar 2015).
Three trials examined inosine. Gonsette 2010 was a parallel group, randomized double‐blind trial of 159 participants with RRMS receiving interferon beta in Europe. The active treatment (antioxidant) group received capsules containing inosine and the control group received placebo. After 24 months of treatment, there was no difference in the number of participants with neurological deterioration between the inosine (14/79) and control (14/78) groups. At 24 months, there was no difference in EDSS between the active treatment (mean 2.30, SD 1.3) and control (mean 2.10, SD 1.3) groups. In addition, there was no difference in MSFC score between groups. After 24 months of treatment, there was no difference in the annual relapse rate between groups, although the number of participants experiencing relapses could not be determined from reported data. Although adverse events were reported, serious adverse events were not defined. Funding was obtained from the Foundation Charcot Stichting, Brussels, Belgium. Markowitz 2009 was a randomized double‐blind, placebo‐controlled cross‐over trial of 16 participants with RRMS in the United States randomized to inosine or placebo for the first six months. EDSS over the initial six months improved on inosine (mean 1.90, SD 0.4) versus placebo (mean 3.10, SD 1.2) although the number of participants remaining in each group at six months was unclear. Also, there were fewer relapses and gadolinium‐enhancing lesions when serum uric acid > 7.0 mg/dL, although we were unable to determine events in the inosine versus placebo group over the initial six months. Four participants over the entire 12‐month study developed renal lithiasis, and three were removed from the study. Funding was obtained from Commonwealth of Pennsylvania Department of Health to Biotechnology Foundation Laboratories and National Institutes of Health. Munoz Garcia 2015 was a parallel group, randomized double‐blind trial of 36 participants with RRMS in Spain treated with interferon beta‐1a randomized to inosine or placebo for nine months. Relapses were experienced by 4/18 in the inosine group and 4/15 in the placebo group after nine months. No participant was felt to have experienced progression by clinical or radiological parameters after nine months of dietary intervention. There were no differences in MRI outcomes at 12 months, including new gadolinium‐enhancing lesions between inosine (mean difference [MD] 1.10, SD 6.1) and placebo (MD ‐1.60, SD 2.4) groups. Three participants withdrew due to adverse events over nine months of interferon beta‐1a plus inosine or interferon beta‐1a plus placebo including one from the inosine group (hyperthyroidism and appendicitis) versus two from the placebo group (1 arthralgias, 1 hypertransaminemia). There was no reported funding.
Three trials examined lipoic acid. Khalili 2012 was a parallel group, randomized double‐blind trial of 50 participants with RRMS in Iran randomized to lipoic acid or placebo for three months. At three months, there was no difference in EDSS between the lipoic acid (mean 1.70, SD 1.3) and placebo (mean 1.70, SD 1.4) groups. In addition, there was no difference in FSS between the lipoic acid (mean 38.40, SD 13.8) and placebo (mean 35.20, SD 10.3) groups. There was conflicting information concerning the number of individuals with new gadolinium‐enhancing lesions at three months. The text indicated one of 22 (4.5%) individuals in the lipoic acid group and four of 17 (23.5%) individuals in the placebo group experienced ≥ one new gadolinium‐enhancing plaque at three months. There was no reported funding. Khalili 2014 was a parallel group, randomized double‐blind trial of 52 participants with RRMS in Iran randomized to lipoic acid or placebo for three months. After three months of treatment, there was no difference in EDSS between the lipoic acid (mean 2.00, SD 0.3) and placebo (mean 1.70, SD 0.3) groups. Funding was obtained from the Vice‐Chancellor for Research of Tehran University of Medical Sciences. Yadav 2005 was a parallel group, randomized double‐blind trial of 37 participants with MS in the United States randomized to lipoic acid (3 different doses) or placebo. Although EDSS was examined at baseline and 14 days, EDSS at follow‐up was not reported. One participant in the lipoic acid 1200 mg twice daily group discontinued treatment due to development of a maculopapular rash associated with fever. Funding was obtained from the National Institutes of Health, Department of Veterans Affairs, Nancy Davis Center WIthout Walls, and Oregon Health & Science University General Clinic Research Centre. Capsules were provided by Pure Encapsulations.
Bitarafan 2015 was a parallel group, randomized double‐blind trial of 101 participants with RRMS in Iran randomized to retinyl palmitate or placebo. After one year of treatment, relapses occurred among 11/47 (23.4%) in the vitamin A group and 6/46 (13.0%) in the placebo group. There was no difference in change in EDSS over one year between the treatment and placebo groups. There was a significantly smaller deterioration in MSFC score over one year in the vitamin A group compared to the control group, which was primarily due to upper limb function and cognition. At one year, gadolinium‐enhancing lesions occurred among 9/46 (19.6%) participants in the treatment group and 6/46 (13.0%) in the placebo group. Funding was obtained from Tehran University of Medical Sciences.
Gallien 2014 was a parallel group, randomized double‐blind trial of 171 participants with MS in France randomized to cranberry extract containing proanthocyanidins or placebo. After one year of treatment, a relapse had occurred among 12/82 (14.6%) participants in the cranberry group and 19/89 (21.3%) in the placebo group. At one year, EDSS was reported to have remained stable, although no data were presented in the publication. Correspondence with the author revealed no significant difference in EDSS between the cranberry group (mean 5.62, SD 1.64) and control group (mean 5.41, SD 1.51) at 1 year. While it was reported that there were no serious adverse events, two participants in the cranberry group and one participant in the placebo group discontinued the intervention due to an adverse event, although these were not attributed to the intervention. Funding was obtained from the French Ministry of Health.
Mahler 2015 was a parallel group, randomized double‐blind, placebo‐controlled cross‐over trial of 20 participants with RRMS in Germany randomized to epigallocatechin‐3‐gallate or placebo for 12 weeks followed by a four‐week washout then the other intervention for 12 weeks. After 12 weeks, there was evidence of improved muscle metabolism among participants receiving EGCG compared to placebo in men to a greater extent than women. Although EDSS was reported at baseline and 12 weeks, the initial randomization group was not clear and values were presented separately for men and women. Funding was obtained from Deutsche Forschungsgemeinschaft.
Sanoobar 2015 was a parallel group, randomized double‐blind trial of 48 participants with RRMS in Iran randomized to coenzyme Q10 or placebo for 12 weeks. Over 12 weeks, two of 24 participants in the coenzyme Q10 group and one of 24 participants in the placebo group were excluded for a relapse. There was no significant difference in change of EDSS over 12 weeks of treatment between the coenzyme Q10 and placebo groups. After 12 weeks of treatment, there was significant improvement in fatigue, measured using the FSS, in the coenzyme Q10 compared to placebo group. Funding was obtained from the Vice‐Chancellor for Research of Tehran University of Medical Sciences.
Dietary programmes
Three RCTs focused on dietary programmes: Paleolithic (Paleo) diet (Irish 2017), Hot‐nature diet (Rezapour‐Firouzi 2013), and a low‐fat plant‐based diet (Yadav 2016).
Irish 2017 was a parallel group trial of 34 participants with RRMS in the United States allocated to the modified Paleo diet or usual diet for three months. Over three months, fatigue measured using the FSS, significantly decreased in the dietary intervention group compared to the control group. Three participants in the dietary intervention group compared to 0 participants in the control group experienced clinically significant improvement in fatigue (FSS > 2 point reduction). There were greater improvements in quality of life measures in the dietary intervention group than control group at three months, according to the Multiple Sclerosis Quality of Life‐54 (MSQoL‐54). All dietary intervention participants experienced an improvement in mental health‐related quality of life compared to three control group participants. In addition, seven dietary intervention participants compared to three control group participants experienced improvement in physical health‐related quality of life. The MSFC revealed no significant change between groups in the timed 25‐foot walk or PASAT although there was improvement in the 9‐Hole Peg Test, using the dominant hand, in the dietary intervention group compared to control group. One participant was withdrawn from the dietary intervention group and two participants from the control group for a flare‐up. No adverse events were reported. Funding was obtained from TZ press which is owned by an author of the study.
Rezapour‐Firouzi 2013 was a parallel group, randomized double‐blind trial of 100 participants with RRMS in Iran randomized to hemp seed oil/evening primrose oil plus Hot‐nature diet (group A), olive oil placebo (group B), or hemp seed oil/evening primrose oil (group C) for six months. EDSS significantly improved over six months in the hemp seed oil/evening primrose oil with and without Hot‐nature diet groups while significantly deteriorated in the placebo group. Over six months, three relapses were experienced in the placebo group, one relapse in the hemp seed oil/evening primrose oil group, and one relapse in the hempseed oil/evening primrose oil with Hot‐nature diet group, although the number of participants experiencing relapses was unclear in the placebo group. There were no serious adverse events, although the definition of a serious adverse event was not provided. Funding was obtained from Tabriz University of Medical Sciences.
Yadav 2016 was a parallel group, randomized single‐blind trial of 61 participants with RRMS in the United States randomized to very low fat, plant‐based diet compared to waiting list over 12 months. After 12 months, there was no difference between groups in MRI measures including new T2 lesions, gadolinium‐enhancing lesions, and brain volume. There was no difference in relapses between groups with seven participants in the diet group and eight participants in the control group experiencing one or more relapse(s). There was no difference between groups in change in EDSS or MSFC over 12 months. There were statistically significant improvements in fatigue in the diet compared to the control group, according to the FSS and MFIS. At 12 months, there was no difference in quality of life between groups, measured using the SF‐36. No severe adverse events were reported, although the definition of severe adverse event was not provided. Funding was obtained from the McDougall Research & Education Foundation which has a study author as president.
Other supplements
Six RCTs focused individually on other supplements including probiotics (Kouchaki 2017), creatine (Malin 2008), riboflavin (Naghashpour 2013), palmitoylethanolamide (Orefice 2016), carnitine (Tomassini 2004), and biotin (Tourbah 2016).
Kouchaki 2017 was a parallel group, randomized double‐blind trial of 60 participants with RRMS in Iran randomized to probiotic versus placebo for 12 weeks. Probiotic contained Lactobacillus acidophilus, Lactobacillus casei, Bifidobacterium bifidum and Lactobacillus fermentum. After 12 weeks of treatment, EDSS significantly improved in the probiotic group compared to placebo group. There were no relapses or adverse events recorded during the study. Funding was obtained from the Vice‐Chancellor for Research of Kashan University of Medical Sciences.
Malin 2008 was a parallel group, randomized double‐blind cross‐over trial of 12 participants with MS in the United States randomized to creatine monohydrate versus placebo for two weeks in phase 1. There was no significant difference in muscle work or power between the creatine and placebo groups, although data were not provided for phase 1. There was no difference in fatigue between the treatment and control phase, measured using the FSS, although data were not provided for phase 1. There were no adverse events. Funding was obtained from the Department of Health, Nutrition, and Exercise Sciences at the University of Delaware.
Naghashpour 2013 was a parallel group, randomized double‐blind trial of 54 participants with RRMS and secondary progressive MS (SPMS) in Iran randomized to riboflavin versus placebo for six months. After six months of treatment, EDSS decreased in both the riboflavin and placebo groups with no significant difference between groups. Funding was obtained from the Vice‐Chancellor for Research Affairs of Ahvaz Jundishapur University of Medical Sciences and the Academic Center for Education, Culture, and Research‐Khuzestan.
Orefice 2016 was a parallel group, randomized double‐blind trial of 29 participants with RRMS in Italy experiencing side effects from subcutaneous interferon beta‐1a randomized to palmitoylethanolamide versus placebo. While there was a reduction in pain in the active treatment group compared to the control group, measured using a visual analogue scale, there was no difference in injection‐related erythema width after 12 months. Quality of life, measured using the MSQOL‐54, improved in the palmitoylethanolamide versus placebo group at 12 months for two subscales (cognitive function, change in health). EDSS and PASAT remained relatively stable in both groups over 12 months. There were no treatment emergent adverse events. There was no reported funding.
Tomassini 2004 was a parallel group, randomized cross‐over trial of 36 participants with RRMS or SPMS in Italy randomized to acetyl L‐carnitine versus amantadine for three months in phase 1. Overall, there was a significant difference in reduction of fatigue in the acetyl L‐carnitine versus amantadine group, assessed using the FSS. Six participants withdrew from the study in phase 1 due to adverse events, including one participant in the acetyl L‐carnitine group due to insomnia, and five participants in the amantadine group due to nausea and dizziness. There was no reported funding.
Tourbah 2016 was a parallel group, randomized double‐blind trial of 154 participants with PPMS or SPMS in France randomized to biotin (MD1003) versus placebo for 12 months. There was a significant improvement in MS‐related disability, measured using the EDSS or timed 25‐foot walk, at nine months and confirmed at 12 months with improvement noted in 13 participants receiving biotin and 0 participants receiving placebo. After 12 months of treatment, EDSS significantly improved in the biotin group compared to the placebo group. There was no significant difference in change in timed 25‐foot walk between the biotin and placebo groups. Over 12 months, 5/103 (4.9%) in the biotin group and 4/51 (7.8%) in the placebo group experienced a relapse. In a subset receiving MRI, there was no significant difference in new demyelinating lesions on MRI between biotin and placebo group participants after 12 months of intervention. Clinician and subject global impression of change favoured the biotin versus placebo group at 12 months. At 12 months, there was no significant difference in fatigue between groups, measured using the MFIS. In addition, there was no consistent difference in quality of life between groups, measured using the SF‐36. Six participants in the MD1003 group and seven participants in the placebo group discontinued the intervention due to adverse events, including one participant described as having a serious adverse event (mucocutaneous rash) and one death due to suicide, both in the MD1003 group. Funding was obtained from MedDay Pharmaceuticals which are the manufacturers of MD1003.
Excluded studies
We excluded 45 studies following full‐text review and listed reasons for exclusion in the 'Characteristics of excluded studies' table. We excluded 19 studies as the study designs were not RCTs (Cendrowski 1982; Cignarella 2017; Dworkin 1981; Dworkin 1984; Field 1979; Harbige 2007; Lovera 2015; Mertin 1973; Meyer‐Rienecker 1976; Millar 1984; Moccia 2019; Saresella 2017; Schultz 1984; Simpson 1985; Skakonik 1963; Swank 1990; Toncev 2006; Tran 2018; van Rensburg 2006). We excluded nine RCTs as the intervention did not meet the inclusion criteria (Bisaga 2011; Bisaga 2012; Bitarafan 2013; Coe 2017; Kouchaki 2018; Lieben 2017; Loder 2002; Shinto 2008; Wade 2002). We excluded 17 RCTs of dietary interventions with no clinical MS‐related outcomes (Bittner 2016; Eghtesadi 2015; Fitzgerald 2017; Gasperini 2011; Holmoy 2013; Jafarirad 2012; Jafarirad 2013; Lambert 2003; Lopes De Carvalho 2012; Mauriz 2013; Mauriz 2014; Mohammadzadeh Honarvar 2013; Mohammadzadeh Honarvar 2016; Saboor‐Yaraghi 2015; Salari 2015; Spitsin 2010; Tamtaji 2017).
Studies awaiting classification
There are six studies awaiting classification (Bock 2015; Kanter 2014; Khalili 2017; Loy 2018; Shah 2007; Tourbah 2018). Studies examined beta‐alanine (Kanter 2014), biotin (Tourbah 2018), lipoic acid (Khalili 2017; Loy 2018), and dietary plans (Bock 2015; Shah 2007). In a single study, there was ambiguity concerning whether or not the study was randomized (Loy 2018). In a single study, there was limited information concerning co‐interventions (Khalili 2017). In four studies, limited results were available (Bock 2015; Kanter 2014; Shah 2007; Tourbah 2018). Further information is provided in the Characteristics of studies awaiting classification table.
Ongoing studies
There are 10 ongoing studies (see Ongoing studies table). Studies examine biotin (NCT02936037), curcumin (NCT01514370), caprylic triglyceride (NCT01848327), D‐aspartate (NCT03387046) and dietary plans (NCT01915433; NCT02664623; NCT02914964; NCT02986893; NCT03322982; NCT03508414). Dietary plans among individuals with MS include a single study of the Wahls Paleo plus (ketogenic) diet versus Wahls (modified Paleolithic) diet versus usual diet (NCT01915433), a single study of the Swank diet versus Wahls elimination diet (NCT02914964), and a single study of a low‐fat diet versus usual diet (NCT03322982) with all of these studies examining dietary plans having a primary outcome of fatigue. In a single study examining biotin versus placebo among individuals with progressive MS, the primary outcome is proportion of participants improved on either EDSS or TW25 at 15 months (NCT02936037).
Risk of bias in included studies
Risk of bias assessment is summarized in Figure 2 and Figure 3.
2.
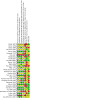
Risk of bias summary: review authors' judgements about each risk of bias item for each included study.
3.
Risk of bias graph: review authors' judgements about each risk of bias item presented as percentages across all included studies.
Allocation
Among trials comparing PUFA to MUFA, a single study described adequate random sequence generation and allocation concealment (Pantzaris 2013). No other studies comparing PUFA to MUFA described the process for random sequence generation and allocation concealment (Bates 1977; Bates 1978; Bates 1989; Millar 1973; Paty 1978; Weinstock‐Guttman 2005). Among trials comparing different PUFAs, three studies described adequate computer‐generated randomization (Ramirez‐Ramirez 2013; Shinto 2016; Torkildsen 2012). In a single study comparing omega‐3 to omega‐6, random sequence generation was not described (Zandi‐Esfahan 2017). Adequate allocation concealment was reported in three studies (Shinto 2016; Torkildsen 2012; Zandi‐Esfahan 2017). The allocation concealment process was unclear in a single study (Ramirez‐Ramirez 2013).
Among trials examining antioxidant supplementation, five studies described adequate computer‐generated randomization (Gallien 2014; Gonsette 2010; Khalili 2012; Mahler 2015; Yadav 2005). In five studies, the random sequence generation process was unclear (Bitarafan 2015; Khalili 2014; Markowitz 2009; Munoz Garcia 2015; Sanoobar 2015). Adequate allocation concealment was reported in five studies (Gallien 2014; Khalili 2012; Mahler 2015; Markowitz 2009; Yadav 2005), and was unclear in five studies (Bitarafan 2015; Gonsette 2010; Khalili 2014; Munoz Garcia 2015; Sanoobar 2015).
Among trials examining dietary programmes, a single study described adequate random sequence generation, although allocation was not concealed (Yadav 2016). A single study had an unclear process of random sequence generation and allocation concealment (Rezapour‐Firouzi 2013). Additionally, a single study had a high risk of selection bias for randomization by flipping a coin for the first five participants followed by group allocation based on Fatigue Severity Scale (FSS) score with lack of allocation concealment (Irish 2017).
Among trials examining other supplements, two studies reported adequate computer‐generated randomization (Kouchaki 2017; Tourbah 2016). In a single study, participants were randomized based on assay kit number which we judged at high risk for inadequate random sequence generation (Orefice 2016). In three studies, the random sequence generation process was unclear (Malin 2008; Naghashpour 2013; Tomassini 2004). Adequate allocation concealment was described for two studies (Naghashpour 2013; Tourbah 2016), while the other four studies had an unclear process for allocation concealment (Kouchaki 2017; Malin 2008; Orefice 2016; Tomassini 2004).
Blinding
Among trials comparing PUFA with MUFA, three studies described adequate blinding of participants and personnel (Bates 1989; Millar 1973; Pantzaris 2013). Blinding of participants and personnel was unclear in three studies (Bates 1977; Bates 1978; Paty 1978). We considered a single study comparing PUFA to MUFA to be at high risk for unblinding of participants and personnel due to different dietary advice administered to the treatment versus control groups (Weinstock‐Guttman 2005). Adequate blinding of outcome assessment was reported in a single study (Pantzaris 2013). The process of blinding outcome assessment was unclear in five studies (Bates 1977; Bates 1978; Bates 1989; Millar 1973; Paty 1978). We considered a single study to be at high risk of bias in blinding of outcome assessment due to relapses being recorded by the treating physician who was not blinded to the intervention (Weinstock‐Guttman 2005). Among studies comparing different types of PUFAs, adequate blinding of participants and personnel was described in all studies (Ramirez‐Ramirez 2013; Shinto 2016; Torkildsen 2012; Zandi‐Esfahan 2017). Three studies described adequate blinding of outcome assessment (Ramirez‐Ramirez 2013; Shinto 2016; Torkildsen 2012), while the blinding of outcome assessment was unclear in a single study (Zandi‐Esfahan 2017).
Among trials examining antioxidant supplementation, six studies reported adequate blinding of participants and personnel (Gallien 2014; Khalili 2012; Khalili 2014; Mahler 2015; Sanoobar 2015; Yadav 2005), while this process was unclear in a further four studies (Bitarafan 2015; Gonsette 2010; Markowitz 2009; Munoz Garcia 2015). Blinding of outcome assessment was described as adequate in five studies (Gallien 2014; Gonsette 2010; Mahler 2015; Markowitz 2009; Sanoobar 2015), while this process was unclear in a further five studies (Bitarafan 2015; Khalili 2012; Khalili 2014; Munoz Garcia 2015; Yadav 2005).
Among trials examining dietary programmes, all were at high risk of performance bias due to lack or inadequate blinding for dietary intervention (Irish 2017; Rezapour‐Firouzi 2013; Yadav 2016). Blinding of outcome assessment was described as adequate in a single study (Rezapour‐Firouzi 2013), unclear in a single study (Yadav 2016), and unblinded in a single study (Irish 2017).
Among trials examining other supplements, four studies reported adequate blinding of participants and personnel (Kouchaki 2017; Malin 2008; Naghashpour 2013; Tourbah 2016), while this was unclear in two studies (Orefice 2016; Tomassini 2004). Two studies described adequate blinding of outcome assessment (Naghashpour 2013; Tourbah 2016), while this was unclear in four studies (Kouchaki 2017; Malin 2008; Orefice 2016; Tomassini 2004).
Incomplete outcome data
Among trials comparing PUFA to MUFA, all studies had participants who did not complete the study, with loss to follow‐up/missing outcome data ranging from 6% to 49% across studies, leading to an unclear (Bates 1989; Millar 1973), or high (Bates 1977; Bates 1978; Pantzaris 2013; Paty 1978; Weinstock‐Guttman 2005) risk of incomplete outcome data. Similarly, among studies comparing different types of PUFAs, all studies experienced loss to follow‐up ranging from 6% to 22% leading to an unclear (Torkildsen 2012; Zandi‐Esfahan 2017), or high (Ramirez‐Ramirez 2013; Shinto 2016) risk of incomplete outcome data.
Among trials examining antioxidant supplementation, Munoz Garcia 2015 was at low risk of incomplete outcome data as all participants were included in the analysis. Four studies were at high risk of incomplete outcome data, with loss to follow‐up ranging from 22% to 35%, and an imbalance of missing outcome data between groups (Gallien 2014; Gonsette 2010; Khalili 2012; Markowitz 2009). The risk of incomplete outcome data in the remaining five studies was unclear (Bitarafan 2015; Khalili 2014; Mahler 2015; Sanoobar 2015; Yadav 2005).
Among trials examining dietary programmes, all studies were at high risk of incomplete outcome data, with missing outcome data ranging from 13% to 50% (Irish 2017; Rezapour‐Firouzi 2013; Yadav 2016).
Among trials examining other supplements, two studies had a low risk of incomplete outcome data (Kouchaki 2017; Orefice 2016). Two studies were at high risk of incomplete outcome data, as missing participant outcome data ranged from 17% to 46%, and there were unbalanced withdrawals between groups (Naghashpour 2013; Tomassini 2004). Finally, two studies had an unclear risk of incomplete outcome data (Malin 2008; Tourbah 2016).
Selective reporting
Among trials comparing PUFA to MUFA, two studies did not adequately define 'better' or 'deteriorated' as an outcome measure, resulting in a high risk of selective reporting (Bates 1977; Bates 1989). The remaining studies examining PUFA versus MUFA had an unclear risk of selective reporting due to lack of prespecified outcomes (Bates 1978; Millar 1973; Pantzaris 2013; Paty 1978; Weinstock‐Guttman 2005). Among studies comparing different types of PUFAs, two studies reported prespecified outcomes (Shinto 2016; Torkildsen 2012), while two studies had an unclear risk of selective reporting bias due to lack of outcome prespecification (Ramirez‐Ramirez 2013; Zandi‐Esfahan 2017).
Among trials examining antioxidant supplementation, two studies reported prespecified outcomes (Bitarafan 2015; Khalili 2014), while four studies were at high risk of selective reporting bias due to missing outcomes or conflicting reporting of results within the same study (Khalili 2012; Mahler 2015; Markowitz 2009; Yadav 2005). The risk of selective reporting bias was unclear among the remaining four studies (Gallien 2014; Gonsette 2010; Munoz Garcia 2015; Sanoobar 2015).
Among trials examining dietary programmes, a single study adequately reported prespecified outcomes (Irish 2017), with the risk of selective reporting unclear in the remaining two studies (Rezapour‐Firouzi 2013; Yadav 2016).
Among trials examining other supplements, a single study reported prespecified outcomes (Kouchaki 2017). Two studies were at high risk of reporting bias, as the initial randomization group was unclear (Malin 2008; Tomassini 2004), and three studies were at unclear risk of selective reporting (Naghashpour 2013; Orefice 2016; Tourbah 2016).
Other potential sources of bias
Details of other potential sources of bias are reported in the 'Risk of bias' tables.
Effects of interventions
See: Table 1; Table 2; Table 3
Polyunsaturated fatty acid (PUFA) versus monounsaturated fatty acid (MUFA)
Relapse
Three trials reported the number of participants experiencing a relapse during the study period (Bates 1978; Millar 1973; Weinstock‐Guttman 2005). Bates 1978 reported that 51/58 (87.9%) participants receiving PUFA and 46/57 (80.7%) receiving MUFA experienced a relapse over two years of treatment. Millar 1973 reported that 25/36 (69.4%) participants receiving PUFA and 30/39 (76.9%) receiving MUFA experienced a relapse over two years of treatment. Weinstock‐Guttman 2005 reported that 3/13 (23.1%) participants receiving PUFA and 5/14 (35.7%) receiving MUFA experienced a relapse over one year of treatment. Overall, when we pooled the data there was no difference in relapse between participants treated with PUFA versus MUFA (risk ratio (RR) 1.02, 95% confidence interval (CI) 0.88 to 1.20; 3 studies, 217 participants; very low‐certainty evidence; Table 1; Analysis 1.1; Figure 4).
1.1. Analysis.

Comparison 1: Polyunsaturated fatty acid versus monounsaturated fatty acid, Outcome 1: Relapse
4.
Forest plot of comparison: 1 PUFA versus MUFA, outcome: 1.1 Relapse.
Change in validated disability scale
No trials reported this outcome in a form to allow for meta‐analysis. Millar 1973 reported no significant difference in change in EDSS between the PUFA (+0.2) and MUFA (+0.6) group after 2 years with no SD available. Paty 1978 reported no difference in EDSS between groups after 30 months, although EDSS attributed to the PUFA and MUFA group was unclear and SD was not provided. Weinstock‐Guttman 2005 reported a weak trend toward slight improvement in EDSS in the PUFA group (‐0.07) and slight worsening in the MUFA group (+0.35), although SD was not provided (2 studies, 102 participants; Table 1).
Global impression of deterioration
Four trials reported global impression of deterioration during the study period (Bates 1977; Bates 1989; Millar 1973; Pantzaris 2013). Bates 1977 reported 24/69 (34.8%) participants receiving PUFA and 21/65 (32.3%) receiving MUFA deteriorated after two years of treatment. This excluded 18 participants who died or withdrew, as this outcome was reported in aggregate. Bates 1989 reported 67/146 (45.9%) participants receiving PUFA and 82/147 (55.8%) receiving MUFA deteriorated after two years of treatment. Millar 1973 reported 13/36 (36.1%) participants receiving PUFA and 18/39 (46.2%) receiving MUFA deteriorated over two years of treatment. Pantzaris 2013 reported 6/20 (30%) participants receiving PUFA and 7/20 (35%) receiving MUFA experienced deterioration at 30 months according to intention‐to‐treat (ITT) analysis. Overall, pooled data showed no difference in global impression of deterioration between participants treated with PUFA versus MUFA (RR 0.85, 95% CI 0.71 to 1.03; 4 studies, 542 participants; low‐certainty evidence; Table 1; Analysis 1.2; Figure 5).
1.2. Analysis.

Comparison 1: Polyunsaturated fatty acid versus monounsaturated fatty acid, Outcome 2: Global impression of deterioration
5.
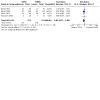
Forest plot of comparison: 1 PUFA versus MUFA, outcome: 1.2 Global impression of deterioration.
MRI activity
No trial reported this outcome.
Cognitive function
No trial reported this outcome.
Health‐related quality of life
No trial reported this outcome in a form to allow for meta‐analysis. Weinstock‐Guttman 2005 reported global SF‐36 remained unchanged in the PUFA group while it had a tendency to worsen in the MUFA group.
Fatigue
No trial reported this outcome in a form to allow for meta‐analysis. Weinstock‐Guttman 2005 reported no significant difference in MFIS between the PUFA and MUFA groups at 12 months.
Serious adverse events
A single trial reported no serious adverse events among 20 participants receiving PUFA and 20 participants receiving MUFA (Pantzaris 2013; low‐certainty evidence; Table 1).
PUFA versus PUFA (omega‐3 versus omega‐6)
Relapse
Two trials reported the number of participants experiencing a relapse during the study period (Torkildsen 2012; Zandi‐Esfahan 2017). Torkildsen 2012 reported 57% of the 45 participants followed in the omega‐3 group and 58% of the 41 participants followed in the omega‐6 group remained free of relapses after two years of treatment. As a result, 19/45 in the omega‐3 group and 17/41 in the omega‐6 group experienced a relapse by two years. Zandi‐Esfahan 2017 reported that one participant was removed from each of the omega‐3 and omega‐6 groups for experiencing a relapse during the study. As a result, 1/22 participants in the omega‐3 group and 1/21 in the omega‐6 group experienced a relapse by one year. Overall, based on these two trials, there was no difference in relapse between participants treated with omega‐3 and omega‐6 supplementation (RR 1.02, 95% CI 0.62 to 1.66; 2 studies, 129 participants; low‐certainty evidence; Table 2; Analysis 2.1; Figure 6).
2.1. Analysis.

Comparison 2: Polyunsaturated fatty acid (omega‐3) versus polyunsaturated fatty acid (omega‐6), Outcome 1: Relapse
6.
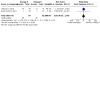
Forest plot of comparison: 2 PUFA (omega‐3) versus PUFA (omega‐6), outcome: 2.1 Relapse.
Change in validated disability scale
Three trials reported change in EDSS (Zandi‐Esfahan 2017), or allowed for a calculation of EDSS change (Ramirez‐Ramirez 2013; Torkildsen 2012). Ramirez‐Ramirez 2013 reported that mean EDSS did not differ between the omega‐3 and omega‐6 group after 12 months of treatment. Torkildsen 2012 reported that mean EDSS did not differ between the omega‐3 and omega‐6 group after 24 months of treatment, while Zandi‐Esfahan 2017 reported no difference in EDSS mean change between the omega‐3 and omega‐6 groups after 12 months. Overall, after pooling the three trials, there was no difference in mean change of EDSS between participants who received omega‐3 versus omega‐6 supplementation (MD 0.00, 95% CI ‐0.30 to 0.30; 3 studies, 166 participants; low‐certainty evidence; Table 2; Analysis 2.2; Figure 7).
2.2. Analysis.

Comparison 2: Polyunsaturated fatty acid (omega‐3) versus polyunsaturated fatty acid (omega‐6), Outcome 2: Progression (change in EDSS)
7.
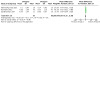
Forest plot of comparison: 2 Polyunsaturated fatty acid (omega‐3) versus polyunsaturated fatty acid (omega‐6), outcome: 2.2 Progression (change in EDSS).
Global impression of deterioration
A single trial reported global impression of deterioration (Torkildsen 2012), with deterioration occurring among 13/45 (28.9%) participants receiving omega‐3 and 12/41 (29.3%) receiving omega‐6 after two years of treatment, demonstrating no difference in deterioration between groups (RR 0.99, 95% CI 0.51 to 1.91; 1 study, 86 participants; moderate‐certainty evidence; Table 2; Analysis 2.3).
2.3. Analysis.
Comparison 2: Polyunsaturated fatty acid (omega‐3) versus polyunsaturated fatty acid (omega‐6), Outcome 3: Global impression of deterioration
MRI activity
No trial reported this outcome in a form to allow for meta‐analysis. Torkildsen 2012 reported no difference in the number of new T1‐ weighted gadolinium‐enhancing lesions between the omega‐3 and omega‐6 groups at 24 months (P = 0.17) (1 study, 86 participants; moderate‐certainty evidence; Table 2).
Cognitive function
No trial reported this outcome.
Health‐related quality of life
No trial reported this outcome in a form to allow for meta‐analysis. Shinto 2016 reported no difference between groups in SF‐36 quality of life, physical component summary (p = 0.10) and mental component summary (p = 0.06) at 3 months. Torkildsen 2012 reported no difference in SF‐36 quality of life, physical component summary (p = 0.49) and mental component summary (p = 0.85) at 24 months.
Fatigue
No trials reported this outcome in a form to allow for meta‐analysis. Torkildsen 2012 reported no difference between groups in fatigue measured using the FSS at 24 months (p = 0.57).
Serious adverse events
Four trials reported serious adverse events (Ramirez‐Ramirez 2013; Shinto 2016; Torkildsen 2012; Zandi‐Esfahan 2017). Ramirez‐Ramirez 2013 reported that two participants in the fish oil group and one in the control group discontinued the intervention due to adverse events. Shinto 2016 reported that one participant in the fish oil group and two in the soybean oil group discontinued the intervention due to adverse events. Torkildsen 2012 reported four participants in the omega‐3 group and 3 in the omega‐6 group experienced a serious adverse event over two years, while Zandi‐Esfahan 2017 reported no adverse events after one year of treatment. Overall, upon pooling the data, there was no difference in serious adverse events between participants treated with omega‐3 and omega‐6 (RR 1.12, 95% CI 0.38 to 3.31; 4 studies, 230 participants; low‐certainty evidence; Table 2; Analysis 2.4).
2.4. Analysis.
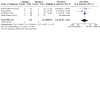
Comparison 2: Polyunsaturated fatty acid (omega‐3) versus polyunsaturated fatty acid (omega‐6), Outcome 4: Serious adverse event
Antioxidant supplementation versus placebo
Ten trials involving antioxidants had a focus on inosine (Gonsette 2010; Markowitz 2009; Munoz Garcia 2015), lipoic acid (Khalili 2012; Khalili 2014; Yadav 2005), vitamin A (Bitarafan 2015), cranberry (Gallien 2014), epigallocatechin‐3‐gallate (Mahler 2015), and coenzyme Q10 (Sanoobar 2015).
Relapse
Four trials reported the number of participants experiencing a relapse during the study period (Bitarafan 2015; Gallien 2014; Munoz Garcia 2015; Sanoobar 2015). In particular, Bitarafan 2015 reported that 11/47 (23.4%) participants receiving retinyl palmitate and 6/46 (13%) participants receiving placebo experienced a relapse over one year of the intervention. Gallien 2014 reported that 12/82 (14.6%) participants receiving cranberry extract and 19/89 (21.3%) participants in the placebo group experienced a relapse over one year of treatment. Munoz Garcia 2015 reported 4/18 (22.2%) participants in the inosine group and 4/15 (26.7%) participants in the placebo group experienced a relapse over nine months of treatment, and Sanoobar 2015 reported 2/24 (8.3%) participants receiving coenzyme Q10 and 1/24 (4.2%) participants receiving placebo experienced a relapse over three months of the intervention. Overall, there was no difference in relapse between participants treated with a variety of antioxidants versus placebo (RR 0.98, 95% CI 0.59 to 1.64; 4 studies, 345 participants; low‐certainty evidence; Table 3; Analysis 3.1; Figure 8).
3.1. Analysis.

Comparison 3: Antioxidant versus placebo, Outcome 1: Relapse
8.
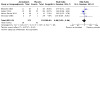
Forest plot of comparison: 3 Antioxidant versus placebo, outcome: 3.1 Relapse.
Change in validated disability scale
Six trials reported EDSS at the end of the study period (Bitarafan 2015; Gallien 2014; Gonsette 2010; Khalili 2012; Khalili 2014; Sanoobar 2015). Bitarafan 2015 reported there was no difference in change in EDSS over one year between the treatment and placebo groups. Gallien 2014 did not report EDSS values, although correspondence with the author revealed no significant difference in EDSS between the cranberry and placebo group at 12 months. Gonsette 2010 reported no difference in mean EDSS between participants receiving inosine and placebo after two years of treatment. Khalili 2012 and Khalili 2014 reported no difference in mean EDSS between participants receiving lipoic acid and placebo at three months. Sanoobar 2015 reported no difference in mean EDSS between participants receiving coenzyme Q10 and placebo at three months. Overall, our pooled estimate found no difference in mean change of disability, measured using EDSS among participants treated with antioxidants versus placebo (MD ‐0.19, 95% CI ‐0.49 to 0.11; 6 studies, 490 participants; very low‐certainty evidence; Table 3; Analysis 3.2; Figure 9).
3.2. Analysis.
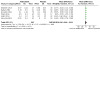
Comparison 3: Antioxidant versus placebo, Outcome 2: Progression (change in EDSS)
9.

Forest plot of comparison: 3 Antioxidant versus placebo, outcome: 3.2 Progression (change in EDSS).
Global impression of deterioration
Two trials reported global impression of deterioration (Gonsette 2010; Munoz Garcia 2015). Gonsette 2010 reported that deterioration occurred among 14/79 (17.7%) participants receiving inosine and 14/78 (17.9%) receiving placebo at two years. Munoz Garcia 2015 reported that no participants experienced progression. The meta‐analysis of these trials demonstrated no difference in global impression of deterioration between participants receiving antioxidant versus placebo (RR 0.99, 95% CI 0.50 to 1.93; 2 studies, 190 participants; low‐certainty evidence; Table 3; Analysis 3.3).
3.3. Analysis.
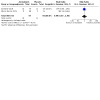
Comparison 3: Antioxidant versus placebo, Outcome 3: Global impression of deterioration
MRI activity
Among the two trials that reported the number of individuals experiencing gadolinium‐enhancing lesions (Bitarafan 2015; Khalili 2012), Bitarafan 2015 reported 80% of participants receiving retinyl palmitate and 87% of participants receiving placebo had no gadolinium‐enhancing lesions after one year of treatment. Khalili 2012 reported 1/22 (4.5%) participants receiving lipoic acid and 4/17 (23.5%) participants receiving placebo experienced a gadolinium‐enhancing lesion at three months, although there were discrepancies between text and table and after contacting study authors, we were unable to resolve the discrepancy. Overall, there was no difference in gadolinium‐enhancing lesions between participants receiving antioxidant and placebo (RR 0.67, 95% CI 0.09 to 4.88; 2 studies, 131 participants; very low‐certainty evidence; Table 3; Analysis 3.4, Figure 10).
3.4. Analysis.

Comparison 3: Antioxidant versus placebo, Outcome 4: Gadolinium‐enhancing lesions
10.
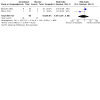
Forest plot of comparison: 3 Antioxidant versus placebo, outcome: 3.4 Gadolinium‐enhancing lesions.
Cognitive function
Two trials reported change in cognition assessed using the PASAT (Bitarafan 2015; Gonsette 2010). Bitarafan 2015 reported a significant improvement in PASAT score between vitamin A and placebo groups after one year. Gonsette 2010 reported no significant change in PASAT score between inosine and placebo groups after two years. Overall, there was no difference in change in cognition measured using PASAT between participants receiving antioxidant and placebo (MD 0.66, 95% CI ‐2.50 to 3.82; 2 studies, 250 participants; Analysis 3.5).
3.5. Analysis.
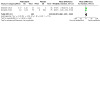
Comparison 3: Antioxidant versus placebo, Outcome 5: Cognition
Health‐related quality of life
No trial reported this outcome in a form to allow for meta‐analysis. Gallien 2014 measured quality of life using the Qualiveen scale and reported no significant difference between the cranberry and placebo groups at one year.
Fatigue
Three trials reported change in fatigue (Bitarafan 2015; Khalili 2012; Sanoobar 2015). Bitarafan 2015 measured fatigue using the MFIS reporting a significant improvement in fatigue in the vitamin A compared to placebo group at one year. Khalili 2012 measured fatigue using the FSS reporting no significant difference between the lipoic acid and placebo groups at 3 months. Sanoobar 2015 measured fatigue using the FSS reporting a significant improvement in fatigue in the coenzyme Q10 group compared to placebo group at 3 months. Overall, there was no difference in change in fatigue between participants receiving antioxidant and placebo (SMD ‐0.38, 95% CI ‐0.96 to 0.19; 3 studies, 177 participants; Analysis 3.6).
3.6. Analysis.
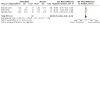
Comparison 3: Antioxidant versus placebo, Outcome 6: Fatigue
Serious adverse events
Three trials reported serious adverse events (Gallien 2014; Munoz Garcia 2015; Yadav 2005). Gallien 2014 reported no serious adverse events, although two participants in the cranberry group and one in the placebo group discontinued the intervention due to an adverse event. Munoz Garcia 2015 reported three participants who withdrew due to adverse events over nine months of interferon beta‐1a plus inosine or interferon beta‐1a plus placebo, including one from the inosine group and two from the placebo group, while Yadav 2005 reported one participant in the lipoic acid (1200 mg twice daily) group who discontinued due to development of a maculopapular rash associated with fever. Overall, after pooling the reported serious adverse events, there was no difference in events among participants treated with antioxidant versus placebo (RR 0.72, 95% CI 0.17 to 3.08; 3 studies, 222 participants; low‐certainty evidence; Table 3; Analysis 3.7).
3.7. Analysis.
Comparison 3: Antioxidant versus placebo, Outcome 7: Serious adverse event
Dietary programmes versus usual diet/placebo
Three trials examined dietary programmes (Irish 2017; Rezapour‐Firouzi 2013; Yadav 2016). These differed substantially in diet protocol and outcome measures, thus preventing meta‐analysis.
Sensitivity Analysis
There were no differences in relapse between PUFA versus MUFA, omega‐3 versus omega‐6, or antioxidant versus placebo in a sensitivity analysis, assuming that all participants lost to follow‐up experienced the outcome of interest (Analysis 4.1, Analysis 4.2, Analysis 4.3).
4.1. Analysis.

Comparison 4: Sensitivity analysis, Outcome 1: Polyunsaturated fatty acid versus monounsaturated fatty acid: relapse
4.2. Analysis.

Comparison 4: Sensitivity analysis, Outcome 2: Omega‐3 versus omega‐6: relapse
4.3. Analysis.
Comparison 4: Sensitivity analysis, Outcome 3: Antioxidant versus placebo: relapse
Discussion
The purpose of this review was to assess the efficacy and safety of a diversity of dietary interventions among people with multiple sclerosis (MS). We excluded vitamin D which is the subject of a dedicated Cochrane Review (Jagannath 2018).
Summary of main results
This review included 41 full‐text articles reporting the results of 30 trials. Eleven trials examined polyunsaturated fatty acids (PUFAs), 10 trials examined a variety of antioxidant supplements, three trials examined dietary programmes, and six trials examined other dietary supplements.
PUFA supplementation
Trials examining PUFA demonstrated variation in PUFA type, PUFA dose, and comparator intervention. We found seven trials (874 participants) comparing PUFA (including linoleic acid, alpha‐linolenic acid, eicosapentaenoic acid, docosahexaenoic acid) to monounsaturated fatty acid (MUFA) (oleic acid) (Bates 1977; Bates 1978; Bates 1989; Millar 1973; Pantzaris 2013; Paty 1978; Weinstock‐Guttman 2005), and four trials (231 participants) comparing different types of PUFAs: omega‐3 fatty acids (eicosapentaenoic acid, docosahexaenoic acid) versus omega‐6 fatty acids (linoleic acid) (Ramirez‐Ramirez 2013; Shinto 2016; Torkildsen 2012; Zandi‐Esfahan 2017). There was little to no difference between PUFA versus MUFA regarding number of participants experiencing a relapse (risk ratio (RR) 1.02, 95% confidence interval (CI) 0.88 to 1.20; anticipated absolute effect 75% in the PUFA group versus 74% in the MUFA group) although the evidence was very uncertain. Also, there was little to no difference between PUFA versus MUFA regarding global impression of deterioration (RR 0.85, 95% CI 0.71 to 1.03; 40% in the PUFA group versus 47% in the MUFA group). A single study examining PUFA versus MUFA reported no adverse events (Pantzaris 2013). There was little to no difference between PUFA‐type, omega‐3 versus omega‐6, on number of participants experiencing a relapse (RR 1.02, 95% CI 0.62 to 1.66; 30% in the omega‐3 versus 29% in the omega‐6 group) or mean change of disability measured using EDSS (MD 0.00, 95% CI ‐0.30 to 0.30). There was likely no difference in global impression of deterioration or gadolinium‐enhancing lesions by PUFA type. Also, there was little to no difference in serious adverse events between participants receiving omega‐3 versus omega‐6 (RR 1.12, 95% CI 0.38 to 3.31; 6% in the omega‐3 versus 5% in the omega‐6 group).
Antioxidant supplementation
Studies examining antioxidant supplementation varied considerably in agent, dose and comparator intervention. Antioxidants were defined according to MeSH term "antioxidants [pharmacologic action]". Ten randomized controlled trials (RCTs) involved antioxidants (690 participants) with a focus on inosine (Gonsette 2010; Markowitz 2009; Munoz Garcia 2015), lipoic acid (Khalili 2012; Khalili 2014; Yadav 2005), vitamin A (Bitarafan 2015), cranberry (Gallien 2014), epigallocatechin‐3‐gallate (Mahler 2015), and coenzyme Q10 (Sanoobar 2015). Our pooled analysis of studies examining antioxidant supplementation indicated there was little to no difference in number of participants experiencing a relapse (RR 0.98, 95% CI 0.59 to 1.64; 17% in the antioxidant versus 17% in the placebo group) or global impression of deterioration (RR 0.99, 95% CI 0.50 to 1.93; 15% in the antioxidant versus 15% in the placebo group). There was very uncertain evidence regarding mean change of disability measured by EDSS (mean difference (MD) ‐0.19, 95% CI ‐0.49 to 0.11) or number of participants experiencing gadolinium‐enhancing lesions (RR 0.67, 95% CI 0.09 to 4.88; 11% in the antioxidant versus 16% in the placebo group). Also, there was little to no difference in serious adverse events between participants receiving antioxidant supplementation versus placebo (RR 0.72, 95% CI 0.17 to 3.08; 3% in the antioxidant versus 4% in the placebo group).
Dietary programmes and other supplements
Studies of dietary programmes and other supplements varied considerably, limiting our ability to perform meta‐analysis. We found three RCTs (195 participants) focusing on dietary programmes, each examining a different diet, namely Paleo (Irish 2017), Hot‐nature (Rezapour‐Firouzi 2013), and low‐fat plant‐based (Yadav 2016) diets. Although the Paleo (Irish 2017) and low‐fat plant‐based (Yadav 2016) diets demonstrated improvement in fatigue outcomes, these trials were at high risk of bias. Six RCTs focused on other supplements individually, including probiotics (Kouchaki 2017), creatine (Malin 2008), riboflavin (Naghashpour 2013), palmitoylethanolamide (Orefice 2016), carnitine (Tomassini 2004), and biotin (Tourbah 2016). High‐dose biotin was associated with improvement in disability, measured using a composite of EDSS and the 25‐foot walk (Tourbah 2016).
Overall completeness and applicability of evidence
A number of small RCTs examine unique dietary interventions in MS, but with very little similarity between studies to allow meaningful meta‐analysis. The greatest number of trials examining a similar agent were for PUFA, although even within this group of studies there was a high degree of variability in PUFA type, PUFA dose, and comparator therapy. In addition to variability in the interventions, there was variability in outcome measures between studies, which further limited our ability to perform meta‐analysis.
Certainty of the evidence
We identified risks of bias in all the studies included in this systematic review. Among 11 studies examining PUFA, eight had unknown risk of selection bias, four had unknown or high risk of performance bias, seven had unknown or high risk of detection bias, 11 had unknown or high risk of attrition bias, and nine had unknown or high risk of reporting bias. Among 10 studies examining antioxidant supplementation, six had unknown risk of selection bias, four had unknown risk of performance bias, five had unknown risk of detection bias, nine had unknown or high risk of attrition bias, and eight had unknown or high risk of reporting bias. Among three studies examining dietary programmes, three studies had unknown or high risk of selection bias, three had high risk of performance bias, two had unknown or high risk of detection bias, three had high risk of attrition bias, and two had unknown risk of reporting bias. Among six studies examining other supplementation, five studies had unknown or high risk of selection bias, two had unknown risk of performance bias, four had unknown risk of detection bias, four had unknown or high risk of attrition bias, and five had unknown or high risk of reporting bias. We conducted a sensitivity analysis for missing outcome data (attrition bias) and found no difference in number of participants experiencing a relapse across interventions, assuming all participants lost to follow‐up experienced the outcome of interest.
Sample sizes were small for all meta‐analyses. We tried to minimize heterogeneity among interventions by analysing different groups of interventions separately, although there remained a substantial degree of heterogeneity (I2 ranged from 0% to 89%) between studies.
Potential biases in the review process
Although there was heterogeneity among interventions and outcomes, the individual study results are consistent with our pooled results, demonstrating little to no difference for any intervention for any outcome. It is possible that there are additional dietary intervention studies with relevant clinical outcome data that we did not obtain. We do not think that we failed to identify a significant dietary intervention study with relapse or progression as a primary outcome. Sensitivity analysis, performed to verify the presence of bias due to losses to follow‐up, did not reveal any effect on relapse between the intervention and control group.
Agreements and disagreements with other studies or reviews
Recently, a systematic review including clinical trials and observational studies examined the effect of diet on risk of MS, with the conclusion that low vitamin D and low vitamin B12 may be associated with increased risk of MS (Bagur 2017). We are not aware of any other comprehensive systematic review assessing dietary interventions for MS outcomes, though there are a number of descriptive reviews covering dietary therapy in MS (Claflin 2018; Esposito 2018; Namaka 2008; Payne 2001; Schwarz 2005; Yadav 2010), with most demonstrating consistent results with our findings. We did not include evidence for vitamin D in MS as this is the subject of a separate Cochrane Review (Jagannath 2018). This review is an updated Cochrane Review (Farinotti 2003; Farinotti 2007; Farinotti 2012). Overall, we reached similar conclusions to the prior versions of this review, whereby there is insufficient evidence from studies of PUFA, antioxidant supplementation, dietary programmes, and other natural health product supplementation to determine whether these interventions have an effect on MS‐related outcomes.
In terms of PUFA supplementation, we did not find a beneficial effect of PUFA supplementation on relapses or disability progression. This is similar to the result reported in the prior version of this review (Farinotti 2012). A systematic review of observational and interventional studies examining fish oil consumption provided a descriptive analysis of seven studies, without performing a meta‐analysis, concluding that omega‐3 supplementation may have a benefit on relapse rate and quality of life (AlAmmar 2019). Evidence‐based guidelines from the American Academy of Neurology conclude that a low‐fat diet with fish oil supplementation is probably ineffective in improving relapses, disability progression, magnetic resonance imaging (MRI) activity, or quality of life measures (Yadav 2014).
In terms of antioxidant supplementation, we did not find a beneficial effect of antioxidant supplementation on relapses, disability progression, or gadolinium‐enhancing lesions. Again, our findings are similar to prior work indicating there is insufficient evidence to determine whether there is a beneficial effect of antioxidant supplementation on MS outcomes (Bowling 2003; Yadav 2010; Esposito 2018).
In terms of dietary programmes, we included three trials each examining a different dietary intervention, including modified Paleo diet, Hot‐nature diet, and low‐fat plant‐based diet. All trials of a dietary programme had issues blinding participants, while two of three trials had incomplete blinding of study personnel. Also, all studies were at risk of attrition bias due to missing outcome data (Irish 2017; Rezapour‐Firouzi 2013; Yadav 2016). No randomized trials addressed the Swank diet, a very low‐fat diet, although an observational study concluded that the Swank diet may be associated with improved survival and mobility (Swank 2003a). There is an ongoing RCT comparing the Wahls Paleo diet to the Swank diet (NCT02914964), with the primary outcome of fatigue.
In terms of other supplements, there was limited evidence to assess the benefit of any individual supplement. High‐dose biotin (MD1003) has shown promise in a small study for decreasing disability progression (Tourbah 2016), and there is an ongoing larger trial to investigate the effects of high‐dose biotin on progressive MS (NCT02936037).
Authors' conclusions
Implications for practice.
There is insufficient evidence from studies of PUFA, antioxidant supplementation, dietary programmes, and other natural health product supplementation to determine whether these interventions have an effect on MS‐related outcomes.
In this review, PUFA was the most common intervention studied. Among 11 studies examining PUFA, there was no significant benefit of PUFA supplementation on relapses or disability progression. There was little or no difference in serious adverse events with PUFA. Among 10 studies examining antioxidant supplementation with a variety of interventions, there was no significant benefit of antioxidant supplementation on relapses, disability progression, or gadolinium‐enhancing lesions. There was little or no change in serious adverse events among the included antioxidants. Among three studies involving dietary programmes, the intervention was very different between studies and there were substantial methodological issues. Among six studies involving other supplements, all examined different interventions. A single study of biotin suggested a benefit of high‐dose biotin (MD1003) on disease progression at one year among progressive forms of multiple sclerosis (MS).
Implications for research.
Future research of dietary interventions in MS should implement higher‐quality research methodology to limit the potential for bias. Outcomes in future trials should include relapses and disease progression described using EDSS along with patient‐reported outcomes, such as fatigue, measured using a validated fatigue scale.
In terms of future research, there is an ongoing randomised controlled trial (RCT) comparing the Wahls Paleo diet to the Swank diet (NCT02914964), with the primary outcome of fatigue. Fatigue is an important patient‐reported outcome with prior trials examining the Paleo diet (Irish 2017) and low‐fat plant‐based diet (Yadav 2016) reporting improvement in fatigue. High‐dose biotin (MD1003) has shown promise in a small study for decreasing disability progression (Tourbah 2016), and there is an ongoing larger trial to investigate the effects of high‐dose biotin on progressive MS (NCT02936037).
What's new
| Date | Event | Description |
|---|---|---|
| 18 November 2019 | New citation required but conclusions have not changed | We added 24 new trials and 1541 new participants. The review now includes 30 trials and 2335 participants. To this version of the review, we added new analyses and discussion. We assessed the quality of evidence from the included studies using the GRADE approach, and we added 'Summary of findings' tables. |
| 30 May 2019 | New search has been performed | We amended the search criteria. We re‐ran the search for relevant RCTs and identified new trials. |
History
Protocol first published: Issue 2, 2003 Review first published: Issue 1, 2007
| Date | Event | Description |
|---|---|---|
| 30 November 2011 | New citation required but conclusions have not changed | We did not identify any new trials. We added a description to risk of bias and have added 'Risk of bias' tables. |
| 17 November 2011 | New search has been performed | We re‐ran the search. |
| 31 October 2011 | Amended | The authors decided to exclude the vitamin D intervention from this review update as vitamin D is the subject of another recent Cochrane Review. The review team has changed. |
| 18 June 2008 | Amended | Converted to new review format |
Acknowledgements
The authors thank the Maritime SPOR SUPPORT Unit, particularly Leah Boulos for assistance in developing a search strategy and performing the electronic search of CENTRAL, MEDLINE, Embase, and the Web of Science. The authors thank Karren Komitas for assistance in translation from Russian to English and Przemyslaw Holko for assistance in translation from Polish to English. Natalie E Parks thanks the donors who sponsored the Killam Predoctoral Scholarship, Nova Scotia Graduate Scholarship, and Dalhousie Medical Research Foundation Multiple Sclerosis Graduate Studentship which helped make updating this Cochrane Review possible. The authors are grateful for free access to Covidence software for screening trials and GradePro GDT software for construction of 'Summary of finding' tables. The authors acknowledge Dalhousie University for general support provided to the authors while they conducted this review.
Appendices
Appendix 1. CENTRAL search strategy
| 1 | MeSH descriptor: [Multiple Sclerosis] explode all trees |
| 2 | MeSH descriptor: [Myelitis, Transverse] explode all trees |
| 3 | MeSH descriptor: [Optic Neuritis] explode all trees |
| 4 | clinically isolated syndrome or disseminated sclerosis or multiple sclerosis or optic neuritis or transverse myelitis |
| 5 | #1 or #2 or #3 or #4 |
| 6 | MeSH descriptor: [Diet] explode all trees |
| 7 | Any MeSH descriptor with qualifier(s): [Diet therapy ‐ DH] |
| 8 | MeSH descriptor: [Eating] explode all trees |
| 9 | MeSH descriptor: [Food and Beverages] explode all trees |
| 10 | MeSH descriptor: [Nutrition Therapy] explode all trees |
| 11 | beverage* or diet or diets or dietary or drink* or eat* or nutri* |
| 12 | anthocyan* or barley or bread or cereal* or corn or gingko‐biloba or pectin* or rice or wheat |
| 13 | butter or cheese* or dairy or egg* or margarin* |
| 14 | nut or nuts or seed* |
| 15 | cumin or curry or spice* or turmeric |
| 16 | MeSH descriptor: [Cerebrosides] explode all trees |
| 17 | MeSH descriptor: [Fats] explode all trees |
| 18 | MeSH descriptor: [Fatty Acids] explode all trees |
| 19 | MeSH descriptor: [Inosine] explode all trees |
| 20 | MeSH descriptor: [Oils] explode all trees |
| 21 | cerebroside* |
| 22 | fat or fats or fatten* or fatty acid* or oil* |
| 23 | alpha linolenic acid* or docosahexaenoic acid* or eicosapentaenoic acid* or linoleic acid OR omega 3 or omega 6 |
| 24 | inosine |
| 25 | MeSH descriptor: [Ascorbic Acid] explode all trees |
| 26 | MeSH descriptor: [Biotin] explode all trees |
| 27 | MeSH descriptor: [Folic Acid] explode all trees |
| 28 | MeSH descriptor: [Niacin] explode all trees |
| 29 | MeSH descriptor: [Riboflavin] explode all trees |
| 30 | MeSH descriptor: [Thiamine] explode all trees |
| 31 | MeSH descriptor: [Vitamin A] explode all trees |
| 32 | MeSH descriptor: [Vitamin B 12] explode all trees |
| 33 | MeSH descriptor: [Vitamin E] explode all trees |
| 34 | MeSH descriptor: [Vitamin K] explode all trees |
| 35 | MeSH descriptor: [Vitamin U] explode all trees |
| 36 | ascorbic acid or biotin or coenzyme q10 or folic acid or niacin* or riboflavin or thiamine |
| 37 | vitamin a or vitamin b or vitamin b1 or vitamin b2 or vitamin b3 or vitamin b7 or vitamin b9 or vitamin b12 or vitamin c or vitamin e or vitamin k or vitamin u |
| 38 | MeSH descriptor: [Minerals] explode all trees |
| 39 | mineral* or selenium |
| 40 | #6 or #7 or #8 or #9 or #10 or #11 or #12 or #13 or #14 or #15 or #16 or #17 or #18 or #19 or #20 or #21 or #22 or #23 or #24 or #25 or #26 or #27 or #28 or #29 or #30 or #31 or #32 or #33 or #34 or #35 or #36 or #37 or #38 or #39 |
| 41 | #5 and #40 |
Appendix 2. MEDLINE search strategy
| 1 | "Multiple Sclerosis"[Mesh] |
| 2 | "Myelitis, Transverse"[Mesh] |
| 3 | "Optic Neuritis"[Mesh] |
| 4 | clinically isolated syndrome[tiab] OR disseminated sclerosis[tiab] OR multiple sclerosis[tiab] OR optic neuritis[tiab] OR transverse myelitis[tiab] |
| 5 | #1 OR #2 OR #3 OR #4 |
| 6 | "Diet"[Mesh] |
| 7 | "Diet Therapy"[sh] |
| 8 | "Eating"[Mesh] |
| 9 | "Food and Beverages"[Mesh] |
| 10 | "Nutrition Therapy"[Mesh] |
| 11 | beverage*[tiab] OR diet[tiab] OR diets[tiab] OR dietary[tiab] OR drink*[tiab] OR eat*[tiab] OR nutri*[tiab] |
| 12 | anthocyan*[tiab] OR barley[tiab] OR bread[tiab] OR cereal*[tiab] OR corn[tiab] OR gingko‐biloba[tiab] OR pectin*[tiab] OR rice[tiab] OR wheat[tiab] |
| 13 | butter[tiab] OR cheese*[tiab] OR dairy[tiab] OR egg*[tiab] OR margarin*[tiab] |
| 14 | nut[tiab] OR nuts[tiab] OR seed*[tiab] |
| 15 | cumin[tiab] OR curry[tiab] OR spice*[tiab] OR turmeric[tiab] |
| 16 | "Cerebrosides"[Mesh] |
| 17 | "Fats"[Mesh] |
| 18 | "Fatty Acids"[Mesh] |
| 19 | "Inosine"[Mesh] |
| 20 | "Oils"[Mesh] |
| 21 | cerebroside*[tiab] |
| 22 | fat[tiab] OR fats[tiab] OR fatten*[tiab] OR fatty acid*[tiab] OR oil*[tiab] |
| 23 | alpha linolenic acid*[tiab] OR docosahexaenoic acid*[tiab] OR eicosapentaenoic acid*[tiab] OR linoleic acid[tiab] OR omega 3[tiab] OR omega 6[tiab] |
| 24 | inosine[tiab] |
| 25 | "Ascorbic Acid"[Mesh] |
| 26 | "Biotin"[Mesh] |
| 27 | "Folic Acid"[Mesh] |
| 28 | "Niacin"[Mesh] |
| 29 | "Riboflavin"[Mesh] |
| 30 | "Thiamine"[Mesh] |
| 31 | "Vitamin A"[Mesh] |
| 32 | "Vitamin B 12"[Mesh] |
| 33 | "Vitamin E"[Mesh] |
| 34 | "Vitamin K"[Mesh] |
| 35 | "Vitamin U"[Mesh] |
| 36 | ascorbic acid[tiab] OR biotin[tiab] OR coenzyme q10[tiab] OR folic acid[tiab] OR niacin*[tiab] OR riboflavin[tiab] OR thiamine[tiab] |
| 37 | vitamin a[tiab] OR vitamin b[tiab] OR vitamin b1[tiab] OR vitamin b2[tiab] OR vitamin b3[tiab] OR vitamin b7[tiab] OR vitamin b9[tiab] OR vitamin b12[tiab] OR vitamin c[tiab] OR vitamin e[tiab] OR vitamin k[tiab] OR vitamin u[tiab] |
| 38 | "Minerals"[Mesh] |
| 39 | mineral*[tiab] OR selenium[tiab] |
| 40 | #6 OR #7 OR #8 OR #9 OR #10 OR #11 OR #12 OR #13 OR #14 OR #15 OR #16 OR #17 OR #18 OR #19 OR #20 OR #21 OR #22 OR #23 OR #24 OR #25 OR #26 OR #27 OR #28 OR #29 OR #30 OR #31 OR #32 OR #33 OR #34 OR #35 OR #36 OR #37 OR #38 OR #39 |
| 41 | randomized controlled trial [pt] |
| 42 | controlled clinical trial [pt] |
| 43 | randomized [tiab] |
| 44 | placebo [tiab] |
| 45 | drug therapy [sh] |
| 46 | randomly [tiab] |
| 47 | trial [tiab] |
| 48 | groups [tiab] |
| 49 | #41 OR #42 OR #43 OR #44 OR #45 OR #46 OR #47 OR #48 |
| 50 | animals [mh] NOT humans [mh] |
| 51 | #49 NOT #50 |
| 52 | #5 AND #40 AND #51 |
Appendix 3. Embase search strategy
| 1 | 'multiple sclerosis'/exp |
| 2 | 'optic neuritis'/exp |
| 3 | 'clinically isolated syndrome':ti,ab OR 'disseminated sclerosis':ti,ab OR 'multiple sclerosis':ti,ab OR 'optic neuritis':ti,ab OR 'transverse myelitis':ti,ab |
| 4 | #1 OR #2 OR #3 |
| 5 | 'diet'/exp |
| 6 | 'diet therapy'/exp |
| 7 | 'eating'/exp |
| 8 | 'food'/exp |
| 9 | beverage*:ti,ab OR diet:ti,ab OR diets:ti,ab OR dietary:ti,ab OR drink*:ti,ab OR eat*:ti,ab OR nutri*:ti,ab |
| 10 | anthocyan*:ti,ab OR barley:ti,ab OR bread:ti,ab OR cereal*:ti,ab OR corn:ti,ab OR 'gingko‐biloba':ti,ab OR pectin*:ti,ab OR rice:ti,ab OR wheat:ti,ab |
| 11 | butter:ti,ab OR cheese*:ti,ab OR dairy:ti,ab OR egg*:ti,ab OR margarin*:ti,ab |
| 12 | nut:ti,ab OR nuts:ti,ab OR seed*:ti,ab |
| 13 | cumin:ti,ab OR curry:ti,ab OR spice*:ti,ab OR turmeric:ti,ab |
| 14 | 'cerebroside'/exp |
| 15 | 'fat'/exp |
| 16 | 'fatty acid'/exp |
| 17 | 'inosine'/exp |
| 18 | 'oil'/exp |
| 19 | cerebroside*:ti,ab |
| 20 | fat:ti,ab OR fats:ti,ab OR fatten*:ti,ab OR 'fatty acid*':ti,ab OR oil*:ti,ab |
| 21 | 'alpha linolenic acid*':ti,ab OR 'docosahexaenoic acid*':ti,ab OR 'eicosapentaenoic acid*':ti,ab OR 'linoleic acid*':ti,ab OR 'omega 3':ti,ab OR 'omega 6':ti,ab |
| 22 | inosine:ti,ab |
| 23 | 'alpha tocopherol'/exp |
| 24 | 'ascorbic acid'/exp |
| 25 | 'biotin'/exp |
| 26 | 'cyanocobalamin'/exp |
| 27 | 'folic acid'/exp |
| 28 | 'nicotinic acid'/exp |
| 29 | 'retinol'/exp |
| 30 | 'riboflavin'/exp |
| 31 | 's methylmethionine'/exp |
| 32 | 'thiamine'/exp |
| 33 | 'vitamin K group'/exp |
| 34 | 'ascorbic acid':ti,ab OR biotin:ti,ab OR 'coenzyme q10':ti,ab OR 'folic acid':ti,ab OR niacin*:ti,ab OR riboflavin:ti,ab OR thiamine:ti,ab |
| 35 | 'vitamin a':ti,ab OR 'vitamin b':ti,ab OR 'vitamin b1':ti,ab OR 'vitamin b2':ti,ab OR 'vitamin b3':ti,ab OR 'vitamin b7':ti,ab OR 'vitamin b9':ti,ab OR 'vitamin b12':ti,ab OR 'vitamin c':ti,ab OR 'vitamin e':ti,ab OR 'vitamin k':ti,ab OR 'vitamin u':ti,ab |
| 36 | 'mineral'/exp |
| 37 | 'selenium'/exp |
| 38 | mineral*:ti,ab OR selenium:ti,ab |
| 39 | #5 OR #6 OR #7 OR #8 OR #9 OR #10 OR #11 OR #12 OR #13 OR #14 OR #15 OR #16 OR #17 OR #18 OR #19 OR #20 OR #21 OR #22 OR #23 OR #24 OR #25 OR #26 OR #27 OR #28 OR #29 OR #30 OR #31 OR #32 OR #33 OR #34 OR #35 OR #36 OR #37 OR #38 |
| 40 | 'crossover procedure'/exp |
| 41 | 'double blind procedure'/exp |
| 42 | 'single blind procedure'/exp |
| 43 | 'randomized controlled trial'/exp |
| 44 | crossover*:ti,ab |
| 45 | 'cross over*':ti,ab |
| 46 | placebo*:ti,ab |
| 47 | (doubl* NEAR/1 blind*):ti,ab |
| 48 | allocat*:ti,ab |
| 49 | random*:ti,ab |
| 50 | trial*:ti |
| 51 | #40 OR #41 OR #42 OR #43 OR #44 OR #45 OR #46 OR #47 OR #48 OR #49 OR #50 |
| 52 | 'animal'/exp NOT human* |
| 53 | #51 NOT #52 |
| 54 | #4 AND #39 AND #53 |
Appendix 4. Web of Science search strategy
| 1 | TS=("clinically isolated syndrome" or "disseminated sclerosis" or "multiple sclerosis" or "optic neuritis" or "transverse myelitis") |
| 2 | TS=(beverage* or diet or diets or dietary or drink* or eat* or nutri*) |
| 3 | TS=(anthocyan* or barley or bread or cereal* or corn or "gingko‐biloba" or pectin* or rice or wheat) |
| 4 | TS=(butter or cheese* or dairy or egg* or margarin*) |
| 5 | TS=(nut or nuts or seed*) |
| 6 | TS=(cumin or curry or spice* or turmeric) |
| 7 | TS=cerebroside* |
| 8 | TS=(fat or fats or fatten* or "fatty acid*" or oil*) |
| 9 | TS=("alpha linolenic acid*" or "docosahexaenoic acid*" or "eicosapentaenoic acid*" or "linoleic acid" OR "omega 3" or "omega 6") |
| 10 | TS=inosine |
| 11 | TS=("ascorbic acid" or biotin or "coenzyme q10" or "folic acid" or niacin* or riboflavin or thiamine) |
| 12 | TS=("vitamin a" or "vitamin b" or "vitamin b1" or "vitamin b2" or "vitamin b3" or "vitamin b7" or "vitamin b9" or "vitamin b12" or "vitamin c" or "vitamin e" or "vitamin k" or "vitamin u") |
| 13 | TS=(mineral* or selenium) |
| 14 | #13 OR #12 OR #11 OR #10 OR #9 OR #8 OR #7 OR #6 OR #5 OR #4 OR #3 OR #2 |
| 15 | TS= clinical trial* |
| 16 | TS=research design |
| 17 | TS=comparative stud* |
| 18 | TS=evaluation stud* |
| 19 | TS=controlled trial* |
| 20 | TS=follow‐up stud* |
| 21 | TS=prospective stud* |
| 22 | TS=random* |
| 23 | TS=placebo* |
| 24 | TS=(single blind*) |
| 25 | TS=(double blind*) |
| 26 | #25 OR #24 OR #23 OR #22 OR #21 OR #20 OR #19 OR #18 OR #17 OR #16 OR #15 |
| 27 | TS=animal* NOT TS=human* |
| 28 | #26 NOT #27 |
| 29 | #28 AND #14 AND #1 |
Appendix 5. ClinicalTrials.gov, ICTRP search strategy
1 Multiple sclerosis
2 Diet
3 Clinical trial
Data and analyses
Comparison 1. Polyunsaturated fatty acid versus monounsaturated fatty acid.
| Outcome or subgroup title | No. of studies | No. of participants | Statistical method | Effect size |
|---|---|---|---|---|
| 1.1 Relapse | 3 | 217 | Risk Ratio (M‐H, Random, 95% CI) | 1.02 [0.88, 1.20] |
| 1.2 Global impression of deterioration | 4 | 542 | Risk Ratio (M‐H, Random, 95% CI) | 0.85 [0.71, 1.03] |
Comparison 2. Polyunsaturated fatty acid (omega‐3) versus polyunsaturated fatty acid (omega‐6).
| Outcome or subgroup title | No. of studies | No. of participants | Statistical method | Effect size |
|---|---|---|---|---|
| 2.1 Relapse | 2 | 129 | Risk Ratio (M‐H, Random, 95% CI) | 1.02 [0.62, 1.66] |
| 2.2 Progression (change in EDSS) | 3 | 166 | Mean Difference (IV, Random, 95% CI) | ‐0.00 [‐0.30, 0.30] |
| 2.3 Global impression of deterioration | 1 | 86 | Risk Ratio (M‐H, Random, 95% CI) | 0.99 [0.51, 1.91] |
| 2.4 Serious adverse event | 4 | 230 | Risk Ratio (M‐H, Random, 95% CI) | 1.12 [0.38, 3.31] |
Comparison 3. Antioxidant versus placebo.
| Outcome or subgroup title | No. of studies | No. of participants | Statistical method | Effect size |
|---|---|---|---|---|
| 3.1 Relapse | 4 | 345 | Risk Ratio (M‐H, Random, 95% CI) | 0.98 [0.59, 1.64] |
| 3.2 Progression (change in EDSS) | 6 | 490 | Mean Difference (IV, Random, 95% CI) | ‐0.19 [‐0.49, 0.11] |
| 3.3 Global impression of deterioration | 2 | 190 | Risk Ratio (M‐H, Random, 95% CI) | 0.99 [0.50, 1.93] |
| 3.4 Gadolinium‐enhancing lesions | 2 | 131 | Risk Ratio (M‐H, Random, 95% CI) | 0.67 [0.09, 4.88] |
| 3.5 Cognition | 2 | 250 | Mean Difference (IV, Random, 95% CI) | 0.66 [‐2.50, 3.82] |
| 3.6 Fatigue | 3 | 177 | Std. Mean Difference (IV, Random, 95% CI) | ‐0.38 [‐0.96, 0.19] |
| 3.7 Serious adverse event | 3 | 222 | Risk Ratio (M‐H, Random, 95% CI) | 0.72 [0.17, 3.08] |
Comparison 4. Sensitivity analysis.
| Outcome or subgroup title | No. of studies | No. of participants | Statistical method | Effect size |
|---|---|---|---|---|
| 4.1 Polyunsaturated fatty acid versus monounsaturated fatty acid: relapse | 3 | 234 | Risk Ratio (M‐H, Random, 95% CI) | 0.97 [0.89, 1.06] |
| 4.2 Omega‐3 versus omega‐6: relapse | 2 | 142 | Risk Ratio (M‐H, Random, 95% CI) | 0.89 [0.59, 1.36] |
| 4.3 Antioxidant versus placebo: relapse | 4 | 353 | Risk Ratio (M‐H, Random, 95% CI) | 0.98 [0.65, 1.50] |
Characteristics of studies
Characteristics of included studies [ordered by study ID]
Bates 1977.
| Study characteristics | ||
| Methods | Double‐blind, parallel‐group, randomized trial | |
| Participants | 152 participants with 'chronic progressive MS' were studied for 2 years. Chronic progressive MS was not defined. There were no exclusion criteria. No information available concerning disease‐modifying therapy. Authors stated groups did not differ with respect to age, sex, or duration of illness although data were not shown. Participants were randomized to one of four groups of equal size (n = 38). 18 participants withdrew or died (4 participants from Group A, 7 from Group B, 3 from Group C, and 4 from Group D). | |
| Interventions | Group A and C received active treatment (PUFA) with Group B and D served as controls (MUFA). Group A received linolenic acid 0.36 g/day and linoleic acid 3.42 g /day in the form of 8 oral capsules each containing 0.6 mL of oil. Group B received 8 capsules identical in appearance to those given to Group A each containing 0.6 mL of oleic acid. Group C received linoleic acid 11.5 g/day in the form of a spread. Group D received oleic acid 4 g/day in the form of a spread. The intervention was administered for 2 years. | |
| Outcomes |
|
|
| Notes | ||
| Risk of bias | ||
| Bias | Authors' judgement | Support for judgement |
| Random sequence generation (selection bias) | Unclear risk | Randomization process not described |
| Allocation concealment (selection bias) | Unclear risk | Allocation process not described |
| Blinding of participants and personnel (performance bias) All outcomes | Unclear risk | 'Double‐blind'. Capsules were reported to be identical in appearance and spreads were reported to be similar but no further details were provided. |
| Blinding of outcome assessment (detection bias) All outcomes | Unclear risk | 'Double‐blind'. No further details |
| Incomplete outcome data (attrition bias) All outcomes | High risk | No details on the 18 participants who died/withdrew. Withdrawals/deaths were imbalanced between groups. |
| Selective reporting (reporting bias) | High risk | Definition of improved and deteriorated not provided |
| Other bias | Low risk | None identified |
Bates 1978.
| Study characteristics | ||
| Methods | Double‐blind, parallel‐group, randomized trial | |
| Participants | 116 participants with acute RRMS studied for 2 years. Inclusion and exclusion criteria were not explicitly stated. Participants were randomly allocated into one of four groups of equal size (n = 29). No information available concerning disease‐modifying therapy. Mean age and disease duration did not differ between groups. 12 participants dropped out early or died (0 participants from Group A, 3 from Group B, 3 from Group C, 6 from Group D). | |
| Interventions | Groups A and C received active treatment (PUFA) with Groups B and D serving as controls (MUFA). Group A received γ‐linolenic acid 0.34 g/day and linoleic acid 2.92 g /day in the form of 8 oral capsules. Group B received 8 capsules identical in appearance to those given to Group A containing 4.0 g/day of oleic acid. Group C received linoleic acid 23 g/day in the form of a spread. Group D received oleic acid 16 g/day in the form of a spread. The intervention was administered for 2 years. | |
| Outcomes |
|
|
| Notes | ||
| Risk of bias | ||
| Bias | Authors' judgement | Support for judgement |
| Random sequence generation (selection bias) | Unclear risk | Randomization process not described |
| Allocation concealment (selection bias) | Unclear risk | Allocation process not described |
| Blinding of participants and personnel (performance bias) All outcomes | Unclear risk | 'Double‐blind'. Group A and Group B received similar capsules but no further details were provided. |
| Blinding of outcome assessment (detection bias) All outcomes | Unclear risk | 'Double‐blind'. No further details |
| Incomplete outcome data (attrition bias) All outcomes | High risk | Limited details on the 12 participants who died/withdrew. Withdrawals were imbalanced between groups. There were 2 deaths, both in Group B. |
| Selective reporting (reporting bias) | Unclear risk | Prespecified outcomes unclear. Participants were evaluated with neurologic and functional assessment every 6 weeks, but data not reported regarding progression |
| Other bias | Unclear risk | Group C had a higher female to male ratio compared with other groups. |
Bates 1989.
| Study characteristics | ||
| Methods | Double‐blind, parallel‐group, randomized trial | |
| Participants | 312 participants with RRMS (McDonald 1977) studied for 2 years across 3 centres (London, Belfast, Newcastle‐upon‐Tyne). Inclusion criteria included aged 16 to 45 years with at least two definite prior MS relapses, with at least one relapse occurring in the two preceding years. Exclusion criteria included a diagnosis of chronic progressive MS or EDSS > 6. No information available concerning disease‐modifying therapy. Participants were stratified for sex and age. Randomization allocated 155 to the active treatment group and 157 to the control group. There was no difference between groups in terms of participant sex, age, disease duration, EDSS, or number of prior relapses. 292 participants included in analysis, with 20 participants not completing the study (9 withdrew and 1 died in the treatment group, 10 withdrew in the control group). | |
| Interventions | Both groups were given dietary advice to encourage low animal fat intake and high intake of omega‐6 PUFAs. The treatment group (PUFA) received eicosapentaenoic acid 1.71 g/day and docosahexaenoic acid 1.14 g/day in 20 capsules. The control group (MUFA) took 20 capsules identical to fish oil capsules containing oleic acid. All capsules contained vitamin E 0.5 IU and 100 ppm of dodecylgallatein. The intervention was administered for 2 years. | |
| Outcomes |
|
|
| Notes | ||
| Risk of bias | ||
| Bias | Authors' judgement | Support for judgement |
| Random sequence generation (selection bias) | Unclear risk | Randomization process not described, apart from stratified by age and sex |
| Allocation concealment (selection bias) | Unclear risk | Allocation process not described |
| Blinding of participants and personnel (performance bias) All outcomes | Low risk | 'Double‐blind'. Capsules given to both groups were said to be the same in appearance/flavour and dispensed in the same manner |
| Blinding of outcome assessment (detection bias) All outcomes | Unclear risk | 'Double‐blind'. No further details |
| Incomplete outcome data (attrition bias) All outcomes | Unclear risk | Limited details concerning 20 participants who died/withdrew, although balanced between groups |
| Selective reporting (reporting bias) | High risk | Outcomes outlined in methods reported. Definition of better and worse not provided |
| Other bias | High risk | Trial did not have a strictly untreated control group as advice on diet including avoiding animal fat and increasing polyunsaturated fatty acids was provided to both groups. |
Bitarafan 2015.
| Study characteristics | ||
| Methods | Double‐blind, parallel‐group, randomized trial | |
| Participants | 101 participants with RRMS (Polman 2011) studied for 1 year across 3 sites (Iran). Inclusion criteria were age 20 to 45 years, EDSS ≤ 5, BMI 18.5 to 30, no relapse in the preceding 3 months, interferon beta‐1a weekly for ≥ 3 months before the trial. Exclusion criteria included lactating, history of addiction, alcohol intake, dysphagia, myocardial infarction, stroke, allergic reaction to vitamin A, autoimmune disease, or disorders of the liver/pancreatic/biliary system. Participants were stratified by gender and then randomly assigned to treatment or placebo. 51 participants were randomized to the treatment group and 50 participants to the placebo group. Baseline characteristics including age, gender, disease duration, EDSS, and vitamin A dietary intake were balanced between groups. A total of 8 participants (4 from each group) were withdrawn from the study due to changes in interferon use, multivitamin use and/or major changes in diet. | |
| Interventions | The treatment group received retinyl palmitate 25,000 IU daily for the initial 6 months and then retinyl palmitate 10,000 IU daily for the latter 6 months. No details were provided on the placebo. | |
| Outcomes |
|
|
| Notes | ||
| Risk of bias | ||
| Bias | Authors' judgement | Support for judgement |
| Random sequence generation (selection bias) | Unclear risk | Block assignment based on gender with subsequent randomization. No further details |
| Allocation concealment (selection bias) | Unclear risk | Allocation process not described |
| Blinding of participants and personnel (performance bias) All outcomes | Unclear risk | 'Double‐blind'. No further details |
| Blinding of outcome assessment (detection bias) All outcomes | Unclear risk | 'Double‐blind'. No further details |
| Incomplete outcome data (attrition bias) All outcomes | Unclear risk | 8 of 101 participants withdrew including 4 participants from both groups. MRI outcomes were reported for 46 of 47 in the treatment group. |
| Selective reporting (reporting bias) | Low risk | Prespecified outcomes reported |
| Other bias | Unclear risk | Baseline data not provided for participants who withdrew |
Gallien 2014.
| Study characteristics | ||
| Methods | Double‐blind, parallel‐group, randomized trial | |
| Participants | 171 adult participants with MS (RRMS, SPMS, PPMS) were studied for 1 year across 8 sites. Inclusion criteria included age 18 to 70 years, EDSS ≥ 3, clinically stable for at least 3 months, and have a urinary disorder defined as ≥ 1 symptom(s) among urgency, dysuria, pollakiuria, or urinary incontinence. Participants were excluded if they were pregnant, breastfeeding, at risk of uric acid lithiasis, indwelling catheter, renal failure, peptic ulcers, UTI at time of randomization, anticoagulation, prophylactic antibiotics, consumed cranberry in any form in the past 3 months, or were intolerant to cranberry and/or excipients. There was no information provided concerning use of MS disease‐modifying therapies. 82 participants were randomized to active treatment and 89 to placebo with randomization stratified by centre and use of clean intermittent self‐catheterization. 67 participants withdrew or were lost to follow‐up including 34 participants in the active treatment group and 33 participants in the placebo group. Data for all participants were used in the analysis. | |
| Interventions | Treatment was a powder containing cranberry extract proanthocyanidins 18 mg twice per day for 1 year. The placebo group received a placebo powder twice per day. Compliance was assessed by counting used and non‐used sachets at each 3‐month follow‐up visit. | |
| Outcomes | Primary
Secondary
|
|
| Notes | Protocol deviation included 2 participants in the placebo group and 1 participant in the cranberry group who were not clinically stable | |
| Risk of bias | ||
| Bias | Authors' judgement | Support for judgement |
| Random sequence generation (selection bias) | Low risk | Computer‐generated randomization. Participants were stratified according to centre and use of clean intermittent self‐catheterization. |
| Allocation concealment (selection bias) | Low risk | Central allocation. Sequentially numbered boxes, according to the randomization list, delivered to the investigator by the pharmacist. |
| Blinding of participants and personnel (performance bias) All outcomes | Low risk | 'Double‐blind'. Intervention and placebo were said to be matching. All participants, pharmacists, medical and nursing staff remained blinded throughout the study period. |
| Blinding of outcome assessment (detection bias) All outcomes | Low risk | 'Double‐blind'. All participants, pharmacists, medical and nursing staff remained blinded throughout the study period. |
| Incomplete outcome data (attrition bias) All outcomes | High risk | All participants included in intent‐to‐treat analysis. High number of participants withdrawn/lost to follow‐up including 34 of 82 in the intervention group and 33 of 89 in placebo group. Data and Safety Monitoring Board stopped the study after a sequential analysis and 25 participants (14 cranberry group, 11 placebo group) did not complete 1 year follow‐up. There were three protocol deviations (2 participants placebo group, 1 participant cranberry group were not regarded as clinically stable, but were included in analysis). |
| Selective reporting (reporting bias) | Unclear risk | Prespecified outcomes reported. Groups were reported to be well balanced at baseline although P values were not reported. |
| Other bias | Low risk | None identified |
Gonsette 2010.
| Study characteristics | ||
| Methods | Double‐blind, parallel‐group, randomized trial | |
| Participants | 159 participants with RRMS (McDonald 2001) studied for 2 years. Inclusion criteria included age 18‐55 years, disease duration ≤ 15 years, EDSS 1‐4, relapse within past 2 years, and receiving interferon beta for ≥ 6 months prior to entry into the trial. Exclusion criteria included progressive disease, previous use of immunosuppressants, participation in a clinical trial with approved immunomodulators in the previous 6 months, exacerbation in the previous 3 months, corticosteroids in the previous 2 months, and serum uric acid exceeding 7 mg/dL (416 ɥmol/L). Randomization allocated 79 participants to inosine treatment and 80 participants to placebo with block assignment based on clinic site. Ratio of female to male was higher in the control (0.85) compared with treatment group (0.74). Otherwise the groups were comparable in age, disease duration, relapse rate in preceding 2 years, and mean EDSS. All participant data were analysed in the treatment group while 2 participants were removed from analysis in the control group due to violation of inclusion criteria. 39 participants lost to follow‐up, including 17 in the treatment group (8 adverse events, 4 non‐compliance, 1 pregnancy, 1 neurological event, 3 other) and 22 in the control group (5 adverse events, 2 pregnancy, 2 protocol violation, 2 non‐compliance, 1 neurological event, 10 other). | |
| Interventions | Active treatment was inosine 500 mg capsules. Over one week participants were titrated up to a dose of two capsules three times per day (total daily dose of 3000 mg). Uric acid levels were measured at 1 month then every 3 months to keep serum uric acid levels < 9 mg/dL in women and < 10 mg/dL in men. Placebo group received a matched placebo (details not provided). All participants were concurrently treated with interferon beta. The intervention was administered for 2 years. Compliance was monitored by counting capsules at follow‐up visits every 3 months. | |
| Outcomes | Primary
Secondary
|
|
| Notes | ||
| Risk of bias | ||
| Bias | Authors' judgement | Support for judgement |
| Random sequence generation (selection bias) | Low risk | Computer‐generated randomization. Blocked by clinical site |
| Allocation concealment (selection bias) | Unclear risk | Allocation process not described |
| Blinding of participants and personnel (performance bias) All outcomes | Unclear risk | 'Double‐blind'. Participants were reported to receive matching placebo, no further details. Inosine dose was adjusted based on serum uric acid levels but it is unclear if placebo participants underwent dose adjustment. |
| Blinding of outcome assessment (detection bias) All outcomes | Low risk | 'Double‐blind'. Evaluating neurologist was blinded from treatment designation and serum uric acid level |
| Incomplete outcome data (attrition bias) All outcomes | High risk | All participants included in intention‐to‐treat analysis. High number of participants lost to follow‐up including 17 of 79 in inosine group and 22 of 80 in the control group. As well, 2 participants were excluded from analysis in the control group due to violation of exclusion criteria. |
| Selective reporting (reporting bias) | Unclear risk | Outcomes outlined in methods reported. Although there was reported to be no difference in number of participants relapse‐free, there were no reported data. |
| Other bias | Unclear risk | Power was calculated for 216 participants although only 159 participants included. Secondary outcome of sustained improvement was added post‐design. Baseline variables were reported to be well‐matched between groups but there were slightly more female participants in the control compared to active treatment group although P values were not reported. |
Irish 2017.
| Study characteristics | ||
| Methods | Parallel‐group, randomized trial | |
| Participants | 34 participants with RRMS (McDonald 2001) enrolled in the study for 3.5 months. Inclusion criteria included age 18 to 45 years, stable RRMS (no medication changes within 3 months), ability to walk 25 feet with or without assistive device, and not using another 'diet' recommended to treat MS. Exclusion criteria included cancer, liver disease, kidney disease, diabetes, active heart disease, heart block, arrhythmia, bleeding disorders, diuretic/anticoagulant/antiplatelet use, psychosis or other psychiatric disorders likely to impact ability to comply with study procedures, or any change in prescription medication for mental health problems, such as depression or anxiety during the 3 months preceding enrolment. All participants completed a baseline automated self‐administered 24‐hour dietary recall application and 2‐week food diary prior to being randomized. 17 participants were allocated to dietary treatment and control groups, respectively. Groups were similar in sex, age, disease duration, and education. There was no information provided concerning participant use of disease‐modifying therapy. In the dietary treatment group, 1 participant was removed during the 2‐week training period, 6 withdrawals (including 2 with relapses), and 2 removed for nonadherence. In the control group, 2 participants were removed during the 2‐week training period and 6 withdrawals (including 1 with relapse). | |
| Interventions | Active treatment was a modified Paleo diet described as nine cups of vegetables and fruits, meat protein, and complete avoidance of gluten, dairy, potatoes, and legumes for 3 months. Controls continued usual diet. Subjects logged their intake on electronic food logs to monitor compliance. | |
| Outcomes | Primary
Secondary
|
|
| Notes | Differences were noted in those who withdrew from those who completed the study. | |
| Risk of bias | ||
| Bias | Authors' judgement | Support for judgement |
| Random sequence generation (selection bias) | High risk | Randomized by flipping coin for the first 5 participants then added to each group according to FSS score |
| Allocation concealment (selection bias) | High risk | Not concealed |
| Blinding of participants and personnel (performance bias) All outcomes | High risk | Not blinded |
| Blinding of outcome assessment (detection bias) All outcomes | High risk | Not blinded |
| Incomplete outcome data (attrition bias) All outcomes | High risk | High number of participants withdrawn, including 8 of 16 in the intervention group and 6 of 15 in the control group. Participants who withdrew from the study were reported to have differed from subjects who completed the study. |
| Selective reporting (reporting bias) | Low risk | Prespecified outcomes reported |
| Other bias | High risk | There were significant differences between the intervention and control group at baseline. Participants may have been biased by socioeconomic status as the diet intervention was believed to result in a potential 30% increase in food costs. |
Khalili 2012.
| Study characteristics | ||
| Methods | Double‐blind, parallel‐group, randomized trial. | |
| Participants | 50 participants with RRMS (McDonald criteria, version unclear) were studied for 3 months at a single site (Iran). Inclusion criteria included age 18 to 50 years and an EDSS < 5.5. Exclusion criteria were pregnancy, anti‐oxidant use in the preceding 1 month, diabetes, other autoimmune disease, or relapse during the study. There were 25 participants randomized to lipoic acid treatment or placebo, respectively. Prior to study initiation there were 3 participants who withdrew from the lipoic acid group and 8 participants who withdrew from the placebo group. Participants remaining in the groups were matched for age, sex, disease duration, EDSS, and FSS. Information regarding participant use of MS disease‐modifying agents was not provided. | |
| Interventions | Active treatment was R/S alpha‐lipoic acid 600 mg twice daily for 3 months. Placebo group received the same number of capsules that were similar in shape, colour, and volume. Each subject was followed for compliance by a phone follow‐up by a physician (frequency not stated). | |
| Outcomes |
|
|
| Notes | ||
| Risk of bias | ||
| Bias | Authors' judgement | Support for judgement |
| Random sequence generation (selection bias) | Low risk | Computer‐generated randomization |
| Allocation concealment (selection bias) | Low risk | Blinded technician labelled capsules through simple random allocation |
| Blinding of participants and personnel (performance bias) All outcomes | Low risk | 'Double‐blind'. Lipoic acid and placebo capsules were similar in shape, colour, and volume. |
| Blinding of outcome assessment (detection bias) All outcomes | Unclear risk | 'Double‐blind'. No further details |
| Incomplete outcome data (attrition bias) All outcomes | High risk | Unbalanced withdrawals with 3 of 25 participants from the active treatment group and 8 of 25 participants from the placebo group occurring before study initiation. No further details provided |
| Selective reporting (reporting bias) | High risk | Outcomes outlined in methods reported. There was conflicting information concerning the number of individuals with new gadolinium‐enhancing lesions at 3 months. |
| Other bias | Low risk | None identified |
Khalili 2014.
| Study characteristics | ||
| Methods | Double‐blind, parallel‐group, randomized trial | |
| Participants | 52 participants with RRMS (McDonald criteria, version unclear) were followed for 3 months at a single centre (Iran). Inclusion criteria included age 18 to 50 years and EDSS ≤ 5.5. Exclusion criteria were pre‐existing use of antioxidants, MS attack during the previous month, current corticosteroid use, other autoimmune disease, diabetes, other chronic disease, pregnancy or lactation. 26 participants randomized to the active treatment and placebo groups, respectively. Groups were matched for baseline characteristics including age, disease duration, EDSS, weight, and disease‐modifying therapy. 6 participants withdrew from the study including 2 participants in the active treatment group (2 relapse) and 4 participants in the placebo group (1 relapse, 3 lost to follow‐up). | |
| Interventions | Active treatment was lipoic acid 1200 mg/day in 600 mg capsules for 3 months. Placebo group received capsules of similar volume, shape, and colour. Compliance was assessed by monitoring the consumption of capsules and weekly follow‐up phone calls. | |
| Outcomes | Primary
|
|
| Notes | ||
| Risk of bias | ||
| Bias | Authors' judgement | Support for judgement |
| Random sequence generation (selection bias) | Unclear risk | Randomization process not described apart from blocked randomization. |
| Allocation concealment (selection bias) | Unclear risk | Allocation process not described |
| Blinding of participants and personnel (performance bias) All outcomes | Low risk | 'Double‐blind'. Lipoic acid and placebo capsules were similar in volume, colour, and shape. |
| Blinding of outcome assessment (detection bias) All outcomes | Unclear risk | 'Double‐blind'. No further details provided |
| Incomplete outcome data (attrition bias) All outcomes | Unclear risk | 2 of 26 participants withdrew from the lipoic acid group and 4 of 34 participants withdrew from the placebo group with reasons provided. |
| Selective reporting (reporting bias) | Low risk | Prespecified outcomes reported |
| Other bias | Unclear risk | Baseline characteristics of withdrawn participants not provided. Change in placebo group IL‐6 level data not consistent |
Kouchaki 2017.
| Study characteristics | ||
| Methods | Double‐blind, parallel‐group, randomized trial | |
| Participants | 60 participants with RRMS (McDonald criteria, version unclear) were followed for 12 weeks at a single centre (Iran). Inclusion criteria included age 18 to 55 years, EDSS ≤ 4.5, and no prior probiotic/symbiotic supplementation. Exclusion criteria included pregnancy/lactation in previous 6 months, nephrolithiasis in previous 5 years, menopause with irregular menstruation and non‐use of contraceptive method. 30 participants randomized to the intervention and placebo groups, respectively. Groups were similar including in age, gender, MS duration, and EDSS. All participants received interferon beta‐1a therapy. A total of 6 participants were lost to follow‐up, 3 from each group, although all data were analysed. | |
| Interventions | Active treatment was a probiotic capsule containing Lactobacillus acidophilus, Lactobacillus casei, Bifidobacterium bifidum and Lactobacillus fermentum (each 2 x 10⁹ CFU/g). Placebo contained starch only but was placed in capsules similar in colour, shape, size, packaging, smell, and taste. The intervention was administered for 12 weeks. Participants were instructed not to change their lifestyle with food and exercise diaries before, during, and after the trial monitored. Compliance was monitored by counting remaining capsules at each follow‐up and a reminder message was sent to participant cell phones daily. | |
| Outcomes | Primary
Secondary
|
|
| Notes | Authors do not differentiate which tests they consider primary outcomes of serum inflammatory markers from secondary outcomes of oxidative stress biomarkers and metabolic profiles. | |
| Risk of bias | ||
| Bias | Authors' judgement | Support for judgement |
| Random sequence generation (selection bias) | Low risk | Computer‐generated randomization. Matched for EDSS, relapses, gender, medication type, BMI, age |
| Allocation concealment (selection bias) | Unclear risk | Allocation process not described. Randomization was performed by staff at the clinic |
| Blinding of participants and personnel (performance bias) All outcomes | Low risk | 'Double‐blind'. Probiotic and placebo capsules were similar in colour, shape, size, packaging, smell, and taste. |
| Blinding of outcome assessment (detection bias) All outcomes | Unclear risk | 'Double‐blind'. No further details |
| Incomplete outcome data (attrition bias) All outcomes | Low risk | Intention‐to‐treat analysis. 3 of 30 participants in both groups lost to follow‐up. All participants analysed |
| Selective reporting (reporting bias) | Low risk | Prespecified outcomes reported. EDSS was not a prespecified outcome but was reported in the methods to be a primary outcome. |
| Other bias | Low risk | None identified |
Mahler 2015.
| Study characteristics | ||
| Methods | Double‐blind, cross‐over, randomized trial | |
| Participants | 20 participants with RRMS (Polman 2005) enrolled in a 28‐week trial at a single centre (Germany). Inclusion criteria included age 20 to 60 years, stable on glatiramer acetate ≥ 6 months, EDSS < 4.5, and BMI 18.5 kg/m2 to 30 kg/m2. Exclusion criteria were progressive MS, clinical relapse in the preceding 3 months or during the study, comorbid heart/liver/lung/kidney disease, caffeine intake > 300 mg/day, green tea consumption, drug abuse, or alcohol abuse. 8 participants randomized to epigallocatechin‐3‐gallate and 12 participants randomized to placebo for the initial 12 weeks. Subsequently, there was a 4‐week washout period after which participants began the other treatment for 12 weeks. There were 2 participants who dropped out or were excluded during the first phase in the active treatment arm. | |
| Interventions | Active treatment was capsules containing epigallocatechin‐3‐gallate (EGCG) 300 mg twice daily. Placebo consisted of identical appearing capsules taken twice daily containing starch. Patients were randomized to active treatment or placebo for 12 weeks then went through a 4‐week washout phase followed by treatment with the other therapy for 12 weeks. Compliance was monitored at monthly clinic visits. | |
| Outcomes | Primary
Secondary
|
|
| Notes | ||
| Risk of bias | ||
| Bias | Authors' judgement | Support for judgement |
| Random sequence generation (selection bias) | Low risk | Computer‐generated randomization |
| Allocation concealment (selection bias) | Low risk | External person not involved in the study generated the randomization list and numbered capsule containers accordingly. |
| Blinding of participants and personnel (performance bias) All outcomes | Low risk | 'Double‐blind'. All people involved in the study (patients, healthcare providers, data collectors, and outcome assessors) were blinded. Epigallocatechin‐3‐gallate and placebo capsules appeared identical. |
| Blinding of outcome assessment (detection bias) All outcomes | Low risk | 'Double‐blind'. Outcome assessors were blinded. |
| Incomplete outcome data (attrition bias) All outcomes | Unclear risk | 2 participants excluded/dropped out among 8 participants during active treatment in phase 1 with further details not provided. |
| Selective reporting (reporting bias) | High risk | Prespecified outcomes reported although initial randomization group not clear |
| Other bias | Unclear risk | Small sample size |
Malin 2008.
| Study characteristics | ||
| Methods | Double‐blind, cross‐over, randomized trial | |
| Participants | 12 participants with MS were studied for 7 weeks at a single centre (Newark, USA). Inclusion criteria required participants to have MS (subtype not specified), EDSS ≤ 6, FSS ≤ 6.0. Exclusion criteria included smoking or previous history of cardiovascular disease, diabetes, thyroid/hepatic/renal dysfunction. Participants were also required not to consume exogenous creatine or other ergogenic aids at baseline. All participants were given instructions to limit tea, coffee, soda, and alcohol. Initially 12 participants were recruited but one subject's data were lost in a power outage. Initial randomization allocated 6 participants to the creatine group and 5 participants to the control group. Baseline characteristics of participants randomized to each group during phase 1 were not available | |
| Interventions | Active treatment was creatine monohydrate powder 20 g/day for 7 days followed by 5 g/day for 7 days. Placebo was maltodextrin powder similar in colour and texture. In phase 1, participants received active treatment or placebo for 2 weeks, followed by a 3‐week washout period. In phase 2, participants received the other intervention for 2 weeks. Compliance was monitored by a dietary supplement log | |
| Outcomes |
|
|
| Notes | ||
| Risk of bias | ||
| Bias | Authors' judgement | Support for judgement |
| Random sequence generation (selection bias) | Unclear risk | Randomization process not described |
| Allocation concealment (selection bias) | Unclear risk | Allocation process not described |
| Blinding of participants and personnel (performance bias) All outcomes | Low risk | 'Double‐blind'. Placebo and active treatment were said to be similar in appearance, no further details provided |
| Blinding of outcome assessment (detection bias) All outcomes | Unclear risk | 'Double‐blind'. No further details |
| Incomplete outcome data (attrition bias) All outcomes | Unclear risk | One participant's data were lost due to power outage. |
| Selective reporting (reporting bias) | High risk | Outcomes outlined in methods reported although initial randomization group not clear |
| Other bias | Unclear risk | Small sample size |
Markowitz 2009.
| Study characteristics | ||
| Methods | Double‐blind, cross‐over, randomized trial | |
| Participants | 16 participants with RRMS (McDonald criteria, version unclear) studied for 1 year from a single centre (Philadelphia, USA). Inclusion criteria included EDSS ≤ 5, and serum uric acid levels < 5 mg/dL. Exclusion criteria included treatment with interferons/glatiramer acetate/other immune‐modifying medications in previous 3 months, or corticosteroids within 1 month of the initial baseline MRI. If relapse occurred during the study corticosteroids were allowed. Participants were randomized to inosine treatment for 12 months or placebo for 6 months followed by inosine for 6 months. EDSS was equal between groups at baseline. 12 patients completed the study with 4 withdrawn (3 renal lithiasis, 1 non‐compliance) although the initial randomization group was unclear. | |
| Interventions | Active treatment was inosine 500 mg capsules. Dose was adjusted for a target serum uric acid level 6mg/dL to 9 mg/dL. Initially the treatment group was given 1g/day to 2 g/day increasing by 0.5 g/day at biweekly intervals. Dose adjustments were made by unblinded investigators at a separate site. Placebo was identical appearing capsules containing fructose 500 mg. Compliance was measured by serum uric acid levels. In the active treatment group, inosine was administered for 12 months. In the placebo group, placebo was administered for the first 6 months followed by inosine for 6 months. | |
| Outcomes |
|
|
| Notes | Target levels of uric acid were only consistently maintained in 2 participants. In 3 participants, low uric acid levels were due to poor compliance. | |
| Risk of bias | ||
| Bias | Authors' judgement | Support for judgement |
| Random sequence generation (selection bias) | Unclear risk | Randomization using a stratification method at a separate site. No further details provided |
| Allocation concealment (selection bias) | Low risk | Capsules were provided in containers labelled with a random four‐digit lot number with sequence concealed from subjects and study team. |
| Blinding of participants and personnel (performance bias) All outcomes | Unclear risk | 'Double‐blind'. Capsules were identical in appearance and participants were requested to swallow capsules whole to minimize any difference in taste. Participants, examining/treating neurologists, study co‐ordinators, and MRI analysis personnel were blinded to treatment. Inosine dose adjustments were made by an unblinded investigator based on blood urate levels. Unclear if placebo group underwent a similar process of dose adjustment |
| Blinding of outcome assessment (detection bias) All outcomes | Low risk | 'Double‐blind'. Researchers involved with clinical assessments and MRI analysis were blinded to participant allocation done by a separate study team. |
| Incomplete outcome data (attrition bias) All outcomes | High risk | 4 of 16 participants did not complete the study, including 3 removed for formation of kidney stones and 1 for not following study protocol. Timing of participant removal from the study was unclear. Unclear whether data from participants who did not complete the study was included in analysis |
| Selective reporting (reporting bias) | High risk | Data presentation unclear. Visits with exacerbations and MRI active lesions were presented without reporting study arm or number of participants in group. Change in EDSS was presented in a graph without reporting number of participants in each group. |
| Other bias | High risk | 4 of the initial 11 participants developed kidney stones which resulted in a change in study protocol to adopt dietary guidelines. Dietary guidelines included adequate fluid intake (6 to 8 glasses of water daily), low purine, low oxalate, calcium 1000mg to 1300 mg daily, limit alcohol. Small sample size |
Millar 1973.
| Study characteristics | ||
| Methods | Double‐blind, parallel‐group, randomized trial | |
| Participants | 87 participants with MS studied for 2 years at 2 clinical sites (London, Belfast). Inclusion criteria was a diagnosis of MS (subtype not specified) and EDSS score ≤ 6. Exclusion criteria were active disease and baseline consumption of sunflower seed oil. No information available concerning disease‐modifying therapy. 12 participants withdrew from the study (7 participants in the active treatment group and 5 participants in the control group). Included in the analysis were 75 participants randomized with 36 in the treatment group and 39 in the control group | |
| Interventions | Active treatment was sunflower seed oil emulsion containing linoleic acid given as 30 mL (8.6 g) twice daily for a total of 17.2 g/day. The placebo group received a similar appearing and tasting emulsion containing oleic acid given as 30 mL (3.8 g) twice daily for a total of 7.6 g/day. Each 30 mL serving of placebo emulsion contained a small amount of linoleic acid (0.2 g). The intervention was administered for 2 years | |
| Outcomes |
|
|
| Notes | ||
| Risk of bias | ||
| Bias | Authors' judgement | Support for judgement |
| Random sequence generation (selection bias) | Unclear risk | Randomization process not described |
| Allocation concealment (selection bias) | Unclear risk | Allocation process not described |
| Blinding of participants and personnel (performance bias) All outcomes | Low risk | 'Double‐blind'. Placebo and active treatment similar in appearance and taste |
| Blinding of outcome assessment (detection bias) All outcomes | Unclear risk | 'Double‐blind'. No further details provided |
| Incomplete outcome data (attrition bias) All outcomes | Unclear risk | 12 of 87 participants withdrawn, including 7 in the active treatment group and 5 in the placebo group. Remaining participants in the active treatment and placebo groups were similar in age, sex, disease duration, and disease severity. |
| Selective reporting (reporting bias) | Unclear risk | All outcomes outlined in methods reported |
| Other bias | Unclear risk | Baseline characteristics of withdrawn participants not reported |
Munoz Garcia 2015.
| Study characteristics | ||
| Methods | Double‐blind, parallel‐group, randomized trial | |
| Participants | 36 participants with RRMS (McDonald 2001) studied for 1 year at 5 hospitals (Spain). Inclusion criteria were age 18 to 55 years, EDSS ≤ 5.5, and ≥ 2 relapses in previous 3 years. Exclusion criteria was previous treatment with immunomodulators, refractory depression, pregnancy, breastfeeding, epilepsy, alcohol use, drug use, malignancy, renal/hepatic/cardiac disease, dementia, leukopenia, thrombopenia, anaemia, or uric acid level over the upper limit of normal. Participants were to be withdrawn if there was persistent hyperuricaemia (> 15 days of UA levels > 10 mg/dL), symptomatic hyperuricaemia, or intolerance of oral tablets. 18 participants randomized to inosine treatment or placebo, respectively. At baseline, there was no difference between groups in age, gender, disease duration, EDSS, relapses in the past year, and uric acid levels. 3 individuals withdrew prior to starting the study, all from the placebo group. During the study, there were 5 discontinuations with 2 from the inosine group (1 withdrew, 1 hyperthyroidism/appendicitis) and 3 from the placebo group (1 unblinding, 1 arthralgias, 1 hypertransaminemia) | |
| Interventions | All participants started interferon beta‐1a at a dose of 44 mcg subcutaneously three times/week at study entry. Three months after initiation of interferon beta, participants were randomized to active treatment or placebo. Active treatment was inosine 1.5 g twice per day given as oral tablets each containing inosine 500 mg. Placebo was oral tablets given twice per day; no further details were provided. Both groups were instructed to consume at least 2 L of water per day | |
| Outcomes | Primary
Secondary
|
|
| Notes | ||
| Risk of bias | ||
| Bias | Authors' judgement | Support for judgement |
| Random sequence generation (selection bias) | Unclear risk | Randomization process not described |
| Allocation concealment (selection bias) | Unclear risk | Allocation process not described |
| Blinding of participants and personnel (performance bias) All outcomes | Unclear risk | 'Double‐blind'. 1 participant excluded for breaking of the blind. No further details provided |
| Blinding of outcome assessment (detection bias) All outcomes | Unclear risk | 'Double‐blind'. Neuroradiologist and neurologist reviewed images in a blind manner. |
| Incomplete outcome data (attrition bias) All outcomes | Low risk | 33 of 36 participants were included in data analysis with 3 withdrawing consent before beginning treatment. 2 of 18 participants in the active treatment group discontinued treatment. 3 of 18 participants in the placebo group did not start treatment. |
| Selective reporting (reporting bias) | Unclear risk | All outcomes outlined in methods reported. Limited data reported for some outcomes including disability progression and brain atrophy. |
| Other bias | Low risk | None identified |
Naghashpour 2013.
| Study characteristics | ||
| Methods | Double‐blind, parallel‐group, randomized trial | |
| Participants | 54 participants with RRMS or SPMS (McDonald 2001) were enrolled for 6 months at a single centre (Iran). Inclusion criteria included age 18 to 50 years and EDSS ≤ 4. Exclusion criteria included a diagnosis of PPMS or benign MS, pregnancy, significant other health condition, other vitamins, simultaneous participation in other clinical trials, or experiencing impairment of daily activities. Participants were allowed to continue disease‐modifying therapy although no further information was provided. 25 participants randomized to active treatment and 29 participants randomized to the control group. 25 participants lost to follow‐up, including 14 from the intervention group and 11 from the control group. Baseline characteristics including age, sex, and EDSS did not differ between groups among those who completed the study | |
| Interventions | Active treatment was riboflavin 10 mg/day delivered in a single capsule once per day for 6 months. Placebo was a single lactose containing capsule once per day for 6 months | |
| Outcomes | Primary
Secondary
|
|
| Notes | ||
| Risk of bias | ||
| Bias | Authors' judgement | Support for judgement |
| Random sequence generation (selection bias) | Unclear risk | Randomization process not described |
| Allocation concealment (selection bias) | Low risk | A designated study team member, not involved in other aspects of the study, dispensed capsules, coded packaging, and delivered packages to participants every month. |
| Blinding of participants and personnel (performance bias) All outcomes | Low risk | 'Double‐blind'. Capsules were similar in appearance and packaging. Participants and study staff were reported to have remained blinded throughout the entire treatment period. |
| Blinding of outcome assessment (detection bias) All outcomes | Low risk | 'Double‐blind'. Study staff were reported to have remained blinded throughout the entire treatment period. |
| Incomplete outcome data (attrition bias) All outcomes | High risk | 25 of 54 participants were lost to follow‐up, including 14 in the active treatment group and 11 in the placebo group. Data were not analysed for participants lost to follow‐up. |
| Selective reporting (reporting bias) | Unclear risk | All outcomes outlined in methods reported |
| Other bias | High risk | Baseline data not provided for high number of participants that withdrew |
Orefice 2016.
| Study characteristics | ||
| Methods | Double‐blind, parallel‐group, randomized trial | |
| Participants | 29 participants with RRMS (Polman 2011) were enrolled for 1 year at a single centre (Italy). Inclusion criteria included age 18 to 55 years, disease duration < 1 year, EDSS 1.0 to 3.5, interferon beta‐1a ≥ 6 months, and experiencing interferon beta‐1a related adverse events. Exclusion criteria were current relapse, steroid use 30 days before entering the trial, concomitant disease precluding interferon use, pregnancy, breastfeeding, cognitive decline preventing informed consent, pathological conditions interfering with MS evolution, NSAID allergy, or intolerance of interferon beta‐1a. 15 participants randomized to active treatment and 14 participants randomized to placebo. Baseline characteristics including age and EDSS did not differ between groups. No withdrawals were reported. | |
| Interventions | All participants received interferon beta‐1a 44 μg subcutaneously 3 times/week. Active treatment was ultramicronized palmitoylethanolamide (um‐PEA) 600 mg orally daily. Placebo was given orally as a pill. No description of pills. Pill containers were said to be similar in appearance and weight. Intervention was administered for 12 months. | |
| Outcomes | Primary
Secondary
|
|
| Notes | ||
| Risk of bias | ||
| Bias | Authors' judgement | Support for judgement |
| Random sequence generation (selection bias) | High risk | Randomization 1:1 using kit numbers for enzyme‐linked immunosorbent assay kits |
| Allocation concealment (selection bias) | Unclear risk | Sequentially numbered pill containers similar in appearance |
| Blinding of participants and personnel (performance bias) All outcomes | Unclear risk | 'Double‐blind'. Active treatment and placebo were provided in containers of similar appearance and weight. No further details provided |
| Blinding of outcome assessment (detection bias) All outcomes | Unclear risk | 'Double‐blind'. No further details provided |
| Incomplete outcome data (attrition bias) All outcomes | Low risk | No withdrawals were reported |
| Selective reporting (reporting bias) | Unclear risk | All outcomes outlined in methods reported |
| Other bias | Unclear risk | Small sample size |
Pantzaris 2013.
| Study characteristics | ||
| Methods | Double‐blind, parallel‐group, randomized trial | |
| Participants | 80 participants with RRMS enrolled for a planned 30 months of treatment at a single centre (Cyprus). There was an additional 12‐month intervention‐free observation period. Eligibility criteria included age 18 to 65 years, diagnosis of RRMS (McDonald criteria, version unclear), EDSS 0 to 5.5, MRI lesions consistent with MS, and at least one documented clinical relapse. Exclusion criteria included relapse within 30 days before study enrolment, prior immunosuppressant or monoclonal antibody use, pregnancy or breastfeeding, other severe disease‐compromising organ function, progressive MS, recent drug or alcohol abuse, use of any additional food supplements, and history of severe allergic reaction. Participants were randomly assigned to 4 groups with 20 participants assigned to each group. Baseline characteristics did not differ between groups including sex, age, disease‐modifying therapy treatment, disease duration, and baseline EDSS. 39 participants withdrew or were lost to follow‐up (10 group A, 10 group B, 11 group C, 8 group D) including 29 discontinuing for unpleasant taste/smell of the intervention | |
| Interventions | Each group received an oral liquid 19.5 mL daily for 30 months. Groups A/B/C were intervention groups and Group D received placebo. Group A received EPA 1650 mg, DHA 4650 mg, gamma‐linolenic acid 2000 mg, linoleic acid 3850 mg, total other omega‐3 600 mg, total MUFA 1714 mg, total saturated fatty acids 18:0 160 mg/16:0 650 mg, vitamin A 0.6 mg, vitamin E 22 mg, citrus aroma. Group B received EPA 1650 mg, DHA 4650 mg, gamma‐linolenic acid 2000 mg, linoleic acid 3850 mg, total other Ω‐3 600 mg, total MUFA 1714 mg, total saturated fatty acids 18:0 160 mg/16:0 650 mg, vitamin A 0.6 mg, vitamin E 22 mg, pure gamma‐tocopherol 760 mg, citrus aroma. Group C received pure gamma‐tocopherol 760 mg dispersed in pure virgin olive oil plus citrus aroma. Group D received pure virgin olive oil (16,930 mg) plus citrus aroma. If relapses occurred these were treated with intravenous methyl‐prednisolone 1 g/day for 3 days followed by prednisone orally at a dose of 1 mg/kg of weight per day with 3‐week taper. Adherence was monitored by blood samples monitoring fatty acid composition of participant's red blood cell membrane by gas chromatography | |
| Outcomes | Primary
Secondary
|
|
| Notes | ||
| Risk of bias | ||
| Bias | Authors' judgement | Support for judgement |
| Random sequence generation (selection bias) | Low risk | Randomization through lottery‐type pool of numbered balls and coin toss stratified by gender and blocked in groups of 4 |
| Allocation concealment (selection bias) | Low risk | Central randomization. Intervention bottles were labelled with code numbers by study team at central randomization site. |
| Blinding of participants and personnel (performance bias) All outcomes | Low risk | 'Double‐blind'. All interventions were identical in appearance, smell, and packaging. Assignment was blinded through code numbers. Participants, physicians, other investigators, pharmacist, and neuroradiologist were blinded to treatment allocation. |
| Blinding of outcome assessment (detection bias) All outcomes | Low risk | 'Double‐blind'. Physicians, other investigators, pharmacist, and neuroradiologist were blinded to treatment allocation. |
| Incomplete outcome data (attrition bias) All outcomes | High risk | 39 of 80 participants did not complete the study with similar pattern of reason for discontinuation across groups. All data were included in an intention‐to‐treat analysis. |
| Selective reporting (reporting bias) | Unclear risk | MRI outcomes reported for only 2 of 4 treatment groups |
| Other bias | Low risk | None identified |
Paty 1978.
| Study characteristics | ||
| Methods | Double‐blind, parallel‐group, randomized trial | |
| Participants | 96 participants with MS enrolled for an intended 30‐month study period at a single centre (London, Ontario). Inclusion criteria were clinically definite MS (Schumacher 1965) and independently ambulatory with or without a gait aid. Exclusion criteria were other serious concomitant disease and significant MS‐related dementia. No information available concerning disease‐modifying therapy. During the trial, 20 participants withdrew (unclear distribution between groups). At 30 months, 38 remained in the active treatment group and 38 in the placebo group. Among participants that completed the trial, both groups were reported to be very similar in age of MS onset, disease duration, average disability, and linoleic acid dietary intake. | |
| Interventions | Active treatment was a 1 ounce emulsion of sunflower seed oil (66.2% linoleic acid) twice a day for a total daily dose of linoleic acid 17 g/day. Placebo group received a 1 ounce emulsion of olive oil (83.5% oleic acid, 4% linoleic acid) twice a day. Dietary history was monitored using a diary during the study. The intervention was administered for 30 months. | |
| Outcomes |
|
|
| Notes | ||
| Risk of bias | ||
| Bias | Authors' judgement | Support for judgement |
| Random sequence generation (selection bias) | Unclear risk | Randomization process not described apart from stratification based on gender |
| Allocation concealment (selection bias) | Unclear risk | Allocation process not described |
| Blinding of participants and personnel (performance bias) All outcomes | Unclear risk | 'Double‐blind'. No further details provided |
| Blinding of outcome assessment (detection bias) All outcomes | Unclear risk | 'Double‐blind'. No further details provided |
| Incomplete outcome data (attrition bias) All outcomes | High risk | 20 of 96 participants withdrew prior to study completion. Details not provided concerning treatment allocation for participants that withdrew |
| Selective reporting (reporting bias) | Unclear risk | All outcomes outlined in methods reported |
| Other bias | High risk | Baseline data not provided for participants that withdrew, including randomization group |
Ramirez‐Ramirez 2013.
| Study characteristics | ||
| Methods | Double‐blind, parallel‐group, randomized trial | |
| Participants | 50 adults with RRMS (Polman 2005) treated with interferon beta‐1b 250 mcg subcutaneous every 2 days ≥ 1 year prior to study enrolment were studied for 1 year at a single centre (Mexico). Inclusion criteria included age 18 to 55 years, ≥ 1 relapse in the year prior to study enrolment, and EDSS 0 to 5 at baseline. Exclusion criteria included progressive MS, currently taking other supplements, severe depression, acute liver/renal dysfunction, tobacco/alcohol/drug abuse, intolerance/allergy fish oil. 25 participants were randomized to omega‐3 and placebo groups, respectively. There were no significant differences in baseline characteristics including age, sex, MS duration, and baseline EDSS. 11 participants dropped out, including 5 from the omega‐3 group and 6 from the placebo group | |
| Interventions | Omega‐3 group received fish oil capsules containing EPA 0.8 g and DHA 1.6 g. Both fish oil and placebo capsules contained glycerin, water, tocopherol, sunflower oil, and titanium dioxide. Both groups received 4 capsules per day for 12 months | |
| Outcomes | Clinical outcomes
Laboratory outcomes
Safety outcomes at 12 months
|
|
| Notes | ||
| Risk of bias | ||
| Bias | Authors' judgement | Support for judgement |
| Random sequence generation (selection bias) | Low risk | Computer‐generated randomization (blocks of 2 to 4) |
| Allocation concealment (selection bias) | Unclear risk | Allocation process not described |
| Blinding of participants and personnel (performance bias) All outcomes | Low risk | 'Double‐blind'. Capsules were identical in appearance, packaging, and labelling. Participants and physicians were blinded |
| Blinding of outcome assessment (detection bias) All outcomes | Low risk | 'Double‐blind'. Independent physician evaluated EDSS and collected samples at each clinic visit. All assays were performed blinded on coded samples. |
| Incomplete outcome data (attrition bias) All outcomes | High risk | 11 of 50 participants dropped out including 5 participants in the active treatment group and 6 participants in the placebo group. Unclear whether data from participants that did not complete the study was included in data analysis |
| Selective reporting (reporting bias) | Unclear risk | All outcomes outlined in the methods reported. Unclear number of participants contributing data to analysis |
| Other bias | Low risk | None identified |
Rezapour‐Firouzi 2013.
| Study characteristics | ||
| Methods | Double‐blind, parallel‐group, randomized trial | |
| Participants | 100 participants with RRMS, age 14 to 55 years, EDSS < 6.0 recruited through the MS Society of Tabriz (Iran). Participants were allowed to continue interferon therapy. Exclusion criteria included progressive forms of MS, pregnancy, corticosteroid treatment, another chronic disease. Participants were randomly assigned to 34 Group A (hempseed/evening primrose oils plus Hot‐nature diet), 33 Group B (olive oil, placebo), and 33 Group C (hempseed/evening primrose oils). 35 participants did not complete the study, including 11 Group A (7 intolerance, 4 non‐compliant), 11 Group B (10 intolerance, 1 active disease), and 13 Group C (10 intolerance, 3 non‐compliant). 65 participants completed the study with disease‐modifying therapy exclusively interferon treatment administered to Group A 22/23, Group B 22/22, and Group C 19/20. At baseline, there were no significant differences in age, gender, and disease duration between groups | |
| Interventions | Group A received hemp seed oil and evening primrose oil (9:1) prepared in a syrup 6 g to 7 g three times/day with advice on following a Hot‐nature diet. Group B received olive oil 6 g to 7 g 3 times/day as placebo. Group C received hemp seed oil and evening primrose oil 6 g to 7 g 3 times/day. Hot‐nature diet includes foods low in cholesterol/trans fats/saturated fats, consumption of olive/grape seed oils, fruit/vegetables, nuts/seeds, fish, unrefined carbohydrates, dairy with honey/dates, and avoidance of alcohol/smoking. All interventions were administered for 6 months. Participants were contacted by phone once a month to assess compliance | |
| Outcomes | Clinical outcomes
Laboratory outcomes
|
|
| Notes | ||
| Risk of bias | ||
| Bias | Authors' judgement | Support for judgement |
| Random sequence generation (selection bias) | Unclear risk | Random block design |
| Allocation concealment (selection bias) | Unclear risk | Randomization performed by statistician not directly involved in trial |
| Blinding of participants and personnel (performance bias) All outcomes | High risk | Blinding of participants was incomplete as those in group A were instructed to follow a Hot‐nature diet while participants in group B and C were instructed to follow usual diet. |
| Blinding of outcome assessment (detection bias) All outcomes | Low risk | Assessments, data collection, and data analysis were performed by blinded researchers. |
| Incomplete outcome data (attrition bias) All outcomes | High risk | 35 of 100 participants (11 group A, 11 group B, 13 group C) dropped out prior to study completion. Data from participants who dropped out was not included in data analysis. |
| Selective reporting (reporting bias) | Unclear risk | All outcomes outlined in the methods reported |
| Other bias | High risk | Baseline data not provided for high number of participants that withdrew. Error in reporting EDSS at 6 months for Group B and Group C with reversal of mean and standard deviation values |
Sanoobar 2015.
| Study characteristics | ||
| Methods | Double‐blind, parallel‐group, randomized trial | |
| Participants | 48 participants with RRMS (McDonald 2001) recruited from a single centre (Iran). Participants were allowed to remain on disease‐modifying therapy. Exclusion criteria included regular antioxidant supplementation, diabetes/other chronic disease, concurrent corticosteroid treatment, relapse during study period, RRMS < 1 year, current smoker. 24 participants randomized to coenzyme Q10 and placebo groups, respectively. 3 participants excluded due to a relapse during the study including 2 in the coenzyme Q10 group and 1 in the placebo group | |
| Interventions | Coenzyme Q10 group received coenzyme Q10 capsules 100 mg five times/day (500 mg/day) for 12 weeks. Placebo group received identical‐appearing starch capsules five times/day for 12 weeks | |
| Outcomes | Clinical outcomes
Laboratory outcomes
|
|
| Notes | Able to determine participants excluded during study period due to relapse | |
| Risk of bias | ||
| Bias | Authors' judgement | Support for judgement |
| Random sequence generation (selection bias) | Unclear risk | Randomization process not described apart from performed by a pharmacist |
| Allocation concealment (selection bias) | Unclear risk | Allocation process not described |
| Blinding of participants and personnel (performance bias) All outcomes | Low risk | 'Double‐blind'. Capsules were identical. Physicians and technicians examining blood were blinded to treatment group. |
| Blinding of outcome assessment (detection bias) All outcomes | Low risk | 'Double‐blind'. Physicians and technicians examining blood were blinded to treatment group. |
| Incomplete outcome data (attrition bias) All outcomes | Unclear risk | 3 of 48 participants were withdrawn, including 2 participants in the active treatment group and 1 participant in the placebo group due to a relapse. Data for withdrawn participants were not included in data analysis |
| Selective reporting (reporting bias) | Unclear risk | All outcomes outlined in the methods reported |
| Other bias | High risk | Baseline data not provided for participants that withdrew (all due to relapse) |
Shinto 2016.
| Study characteristics | ||
| Methods | Double‐blind, parallel‐group, randomized trial | |
| Participants | 39 adults with any type of MS (Polman 2011) with major depressive disorder according to Diagnostic and Statistical Manual of Mental Disorder‐IV criteria, mild to moderate depression severity, stable dose of antidepressant ≥ 3 months prior to study enrolment, if on MS disease‐modifying therapy on stable dose ≥ 6 months prior to study enrolment. Exclusion criteria included severe depression, MS exacerbation or corticosteroid therapy < 1 month prior to study enrolment, Mini‐Mental Status Examination (MMSE) ≤ 24, pregnancy, ventricular arrhythmia, other significant health issue, fish/cod liver oil supplementation ≤ 30 days of study enrolment, > 6‐ounce serving fish/seafood per week ≤ 30 days of study enrolment. 21 randomized to omega‐3 group and 18 randomized to placebo group. There was no difference in age, sex, MS duration, baseline EDSS, or DMT use between groups with the only significant difference being a greater proportion of college educated individuals in the active treatment group. 8 participants withdrew prior to study completion including 6 omega‐3 group (2 lost to follow‐up, 4 discontinued intervention) and 2 placebo group (2 discontinued intervention) | |
| Interventions | Active treatment group received fish oil capsules containing both EPA and DHA resulting in EPA 1.95 g/day and DHA 1.35 g/day. Placebo group received soybean oil capsules with 1% fish oil to simulate smell/taste of fish oil capsules. Both groups took 3 capsules in the morning and 3 capsules in the afternoon with food for 3 months | |
| Outcomes | Primary
Secondary
|
|
| Notes | ||
| Risk of bias | ||
| Bias | Authors' judgement | Support for judgement |
| Random sequence generation (selection bias) | Low risk | Computer‐generated randomization stratified by severity of depression (Beck Depression Inventory) |
| Allocation concealment (selection bias) | Low risk | Pharmacy‐controlled randomization |
| Blinding of participants and personnel (performance bias) All outcomes | Low risk | 'Double‐blind'. Capsules were similar in taste and smell. Appearance of capsules was not stated. Study was reported to be well‐blinded with ≥ 75% of both groups remaining blinded to treatment. |
| Blinding of outcome assessment (detection bias) All outcomes | Low risk | 'Double‐blinded'. Outcome assessors were blinded. Study was reported to be well‐blinded with ≥ 75% of both groups remaining blinded to treatment. |
| Incomplete outcome data (attrition bias) All outcomes | High risk | 8 of 39 participants did not complete the study, including 6 participants in the active treatment group and 2 participants in the placebo group. |
| Selective reporting (reporting bias) | Low risk | Prespecified outcomes reported |
| Other bias | Low risk | None identified |
Tomassini 2004.
| Study characteristics | ||
| Methods | Double‐blind, cross‐over, randomized trial | |
| Participants | 36 adults with RRMS or SPMS experiencing fatigue defined as FSS > 4 enrolled for 12 months at a single centre (Italy). Inclusion criteria included age ≥ 18 years, EDSS 1 to 3.5 for RRMS and 4 to 7 for SPMS, if receiving interferon therapy treatment for ≥ 1 year, no relapse or steroids < 8 weeks prior to study enrolment. Exclusion criteria included active treatment with antidepressants, anxiolytics, beta‐blockers, and anticonvulsants. 18 participants were randomized to initial treatment with acetyl L‐carnitine or amantadine, respectively. Baseline characteristics were similar between groups including in age, sex, disease duration, EDSS, and FSS. 6 withdrew from the study including 5 on amantadine and 1 on acetyl L‐carnitine as initial therapy | |
| Interventions | Acetyl L‐carnitine 1 g twice daily or amantadine 100 mg twice daily for 3 months followed by a 3‐month washout period. Subsequent cross‐over to other treatment for 3 months followed by a 3 month washout period. Compliance was measured by patient diary and telephone follow‐up between assessments | |
| Outcomes | Primary
Secondary
|
|
| Notes | ||
| Risk of bias | ||
| Bias | Authors' judgement | Support for judgement |
| Random sequence generation (selection bias) | Unclear risk | Randomization process not described |
| Allocation concealment (selection bias) | Unclear risk | Allocation process not described |
| Blinding of participants and personnel (performance bias) All outcomes | Unclear risk | 'Double‐blind'. No further details provided |
| Blinding of outcome assessment (detection bias) All outcomes | Unclear risk | 'Double‐blind'. No further details provided |
| Incomplete outcome data (attrition bias) All outcomes | High risk | 6 of 36 participants withdrew from the study, including 5 participants receiving amantadine and 1 participant receiving acetyl L‐carnitine as initial therapy. All withdrawals occurred before 3‐month assessment. |
| Selective reporting (reporting bias) | High risk | Outcome data did not specify initial randomization group. Limited data reported for secondary outcomes |
| Other bias | Low risk | None identified |
Torkildsen 2012.
| Study characteristics | ||
| Methods | Double‐blind, parallel‐group, randomized trial | |
| Participants | 92 adults with RRMS (McDonald 2001) with EDSS ≤ 5 at 13 centres (Norway). Inclusion criteria required at least 1 clinical relapse or 1 new T1‐gadolinium enhancing or T2‐weighted MRI lesion in 1 year prior to study enrolment. Exclusion criteria included treatment with interferon beta‐1a or glatiramer acetate within past 6 months, supplementation with omega‐3 fatty acids within past 3 months, any previous other immunosuppressive treatment for MS, treatment with glucocorticoids within past 2 months, relapse within 1 month of study enrolment. 46 randomized to omega‐3 fatty acids or placebo, respectively. Baseline characteristics including age, sex, MS duration, baseline EDSS, and prior disease‐modifying therapy were similar between groups. All participants included in data analysis apart from 1 participant in the placebo group who was lost to follow‐up before efficacy data collected | |
| Interventions | Omega‐3 group received capsules containing both EPA 270 mg and DHA 170 mg along with alpha‐tocopherol 4 units. Placebo capsules contained corn oil. Both omega‐3 and placebo groups were administered 5 capsules per day. After 6 months, all participants also received interferon beta‐1a 44 mcg 3 times/week for a further 18 months | |
| Outcomes | Primary
Secondary
EDSS, MSFC, FSS, and SF‐36 were performed at baseline then every 6 months for 24 months. Change in EDSS, MSFC, FSS, and SF‐36 were reported at 6 months and 24 months.
|
|
| Notes | ||
| Risk of bias | ||
| Bias | Authors' judgement | Support for judgement |
| Random sequence generation (selection bias) | Low risk | Computer‐generated randomization in 1:1 ratio with block size of 6 |
| Allocation concealment (selection bias) | Low risk | Central allocation performed by independent contractor. Packaging and distribution of capsules was performed by independent contractor. |
| Blinding of participants and personnel (performance bias) All outcomes | Low risk | 'Double‐blind'. Capsules were identical. Active treatment was not suspected to have any clinical or laboratory effects that could result in unblinding. |
| Blinding of outcome assessment (detection bias) All outcomes | Low risk | 'Double‐blind'. Neurologist evaluating participant and neuroradiologists evaluating imaging were not aware of treatment allocation. |
| Incomplete outcome data (attrition bias) All outcomes | Unclear risk | 6 of 92 participants lost to follow‐up including 1 participants in active treatment group and 5 participants in placebo group. All participants included in data analysis apart from 1 participant in the placebo group who was lost to follow‐up prior to collection of efficacy data. Power calculation performed estimating 10% to 15% dropout rate |
| Selective reporting (reporting bias) | Low risk | Prespecified outcomes reported |
| Other bias | Low risk | None identified |
Tourbah 2016.
| Study characteristics | ||
| Methods | Double‐blind, parallel‐group, randomized trial | |
| Participants | 154 participants with PPMS or SPMS, according to McDonald or Lublin criteria enrolled for 12 months at 16 centres (France). Inclusion criteria included 18 to 75 years, spastic paraparesis, baseline EDSS 4.5 to 7, and progression in previous 2 years (increase ≥ 1 point if EDSS 4.5 to 5.5 or ≥ 0.5 point if EDSS 6 to 7). There were no restrictions on concurrent medications provided immunomodulatory medications were started ≥ 3 months prior to study entry and fampridine started ≥ 1 month prior to study entry. Exclusion criteria included clinical or radiographic evidence of inflammatory disease activity within the past year, significant comorbidity, pregnancy, or inpatient rehabilitation therapy < 3 months prior to study entry. 103 randomized to biotin and 51 randomized to placebo. Baseline characteristics were similar between groups including age, sex, disease duration, EDSS, concomitant disease‐modifying therapy, and concomitant fampridine. Over 1 year, there were 21 participants that discontinued intervention including 12 in the biotin group and 9 in the placebo group. All participants were included in the final analysis at 12 months | |
| Interventions | Biotin (MD1003) 100 mg PO 3 times/day or placebo for 12 months. Randomized 2:1 to biotin versus placebo. Capsules for biotin and placebo were identical | |
| Outcomes | Primary
Secondary
|
|
| Notes | ||
| Risk of bias | ||
| Bias | Authors' judgement | Support for judgement |
| Random sequence generation (selection bias) | Low risk | Computer‐generated randomization in 2:1 ratio stratified by study centre |
| Allocation concealment (selection bias) | Low risk | Central allocation performed by independent contractor |
| Blinding of participants and personnel (performance bias) All outcomes | Low risk | 'Double‐blind'. Capsules for biotin and placebo groups were identical. Participants and investigators were blinded. |
| Blinding of outcome assessment (detection bias) All outcomes | Low risk | 'Double‐blind'. Neurologist was blind to treatment allocation. |
| Incomplete outcome data (attrition bias) All outcomes | Unclear risk | All participants enrolled in study were included in analysis (intention‐to‐treat). 12 of 103 participants discontinued intervention in the active treatment group and 9 of 51 participants discontinued intervention in the placebo group. |
| Selective reporting (reporting bias) | Unclear risk | All outcomes outlined in the methods reported |
| Other bias | Low risk | None identified |
Weinstock‐Guttman 2005.
| Study characteristics | ||
| Methods | Double‐blind, parallel‐group, randomized trial | |
| Participants | 31 adults with RRMS were studied for 1 year at a single centre (Buffalo, USA). Inclusion criteria included age 18 to 60 years, stable disease for 2 months prior to study enrolment, ≥ 1 relapse in the preceding 3 years, and diet prior to study enrolment > 30% total calories from fat determined by a 7‐day food record. There were no restrictions on concurrent medications provided duration of immunomodulatory medication was ≥ 2 months. 15 participants were randomized to fish oil and 16 participants to olive oil. Baseline characteristics including age, sex, MS duration, baseline EDSS, and disease‐modifying therapy were similar between groups. 10 participants discontinued the intervention, including 3 participants in the fish oil group (1 not tolerated, 1 noncompliant, 1 active disease) and 7 participants in the olive oil group (2 noncompliant, 4 active disease, 1 pregnancy) | |
| Interventions | Fish oil group received 6 capsules per day containing eicosapentaenoic acid 1.98 g/day and docosahexaenoic acid 1.32 g/day. In addition, the fish oil group was instructed to follow a very low‐fat diet (≤ 15% of the total daily calories from fat including fish oil supplement). Olive oil group received 6 capsules per day containing a total of 1 g olive oil. In addition, the olive oil group was instructed to follow a controlled low cholesterol diet (total fat ≤ 30% of total daily calories and saturated fats < 10%). Both groups received daily vitamin E 400 IU, multivitamin, calcium ≥ 500 mg. Duration of treatment was 1 year | |
| Outcomes | Primary
Secondary
|
|
| Notes | ||
| Risk of bias | ||
| Bias | Authors' judgement | Support for judgement |
| Random sequence generation (selection bias) | Unclear risk | Randomization process not described |
| Allocation concealment (selection bias) | Unclear risk | Allocation process not described |
| Blinding of participants and personnel (performance bias) All outcomes | High risk | 'Double‐blind'. Participants received same number of capsules per day. Different dietary instructions were provided to active treatment and placebo groups. |
| Blinding of outcome assessment (detection bias) All outcomes | High risk | Examining physician recording EDSS was blinded to intervention. Treating physician recording relapses was not blinded to intervention. |
| Incomplete outcome data (attrition bias) All outcomes | High risk | 4 of 31 participants, including 2 participants from both the active treatment and placebo groups were excluded from data analysis. Unpublished data, provided by authors, shows a high rate lost to follow‐up for EDSS evaluation (33% in the treatment group and 75% in control group). |
| Selective reporting (reporting bias) | Unclear risk | All outcomes outlined in the methods reported, although limited information concerning participant numbers in each group |
| Other bias | High risk | Multiple interventions making it impossible to determine the effect of any specific intervention. Baseline data not provided for participants that withdrew |
Yadav 2005.
| Study characteristics | ||
| Methods | Double‐blind, parallel‐group, randomized trial | |
| Participants | 37 adults with MS (McDonald 2001) were studied for 2 weeks at a single centre (Oregon, USA). Inclusion criteria were age 18 to 70 years and EDSS < 7.5. Exclusion criteria included relapse within 30 days of screening, lipoic acid within 2 weeks of enrolment, pregnancy, or breastfeeding. Participants were able to continue with interferon or glatiramer acetate. Participants were randomized to four treatment conditions including 9 placebo, 10 lipoic acid 600 mg twice daily, 9 lipoic acid 1200 mg daily, 9 lipoic acid 1200 mg twice daily. 33 participants began the treatment to which they were randomized including 17 RRMS, 6 PPMS, 8 SPMS, 2 unclear MS type. Baseline characteristics among groups, for all participants who started therapy, were similar in age, gender, MS type, disease duration, and EDSS. 30 participants completed the study with 2 participants in the placebo group withdrawing for personal reasons and 1 participant in the lipoic acid 1200 mg twice daily group withdrawing for an adverse event | |
| Interventions | Lipoic acid versus placebo for 2 weeks. Participants were randomized to one of four groups including placebo twice/day; lipoic acid 600 mg twice/day; lipoic acid 1200 mg in morning and placebo in evening; lipoic acid 1200 mg twice/day. All capsules appeared identical and all participants took 3 capsules twice/day before meals. Placebo contained 4.3 mg quercetin to provide similar colouring to lipoic acid capsules | |
| Outcomes | The purpose of the study was to determine pharmacokinetics, tolerability, and effects on matrix metalloproteinase‐9 and intercellular adhesion molecule‐1. Clinical outcomes (at baseline and 14 days)
|
|
| Notes | ||
| Risk of bias | ||
| Bias | Authors' judgement | Support for judgement |
| Random sequence generation (selection bias) | Low risk | Computer‐generated randomization |
| Allocation concealment (selection bias) | Low risk | Allocation performed by pharmacy |
| Blinding of participants and personnel (performance bias) All outcomes | Low risk | 'Double‐blind'. Capsules were similar in appearance. |
| Blinding of outcome assessment (detection bias) All outcomes | Unclear risk | 'Double‐blind'. Laboratory evaluations were performed blinded to treatment status of participants. Blinding of clinical assessments including EDSS unclear |
| Incomplete outcome data (attrition bias) All outcomes | Unclear risk | 30 of 37 participants (7/9 placebo, 7/10 lipoic acid 600 mg twice/day, 9/9 lipoic acid 1200 mg daily, 7/9 lipoic acid 1200 mg twice/day) completed the study. |
| Selective reporting (reporting bias) | High risk | Clinical measures including EDSS, timed 25‐foot walk, and 9‐hole peg test reported at baseline but not 14 days although methods state collected at both time points |
| Other bias | Low risk | None identified |
Yadav 2016.
| Study characteristics | ||
| Methods | Single‐blind, parallel‐group, randomized trial | |
| Participants | 61 adults with RRMS (Polman 2011) were studied for 1 year at a single centre (Oregon, USA). Inclusion criteria included age 18 to 70 years, duration MS < 15 years, EDSS ≤ 6.0, active disease (clinical relapse or MRI activity) in previous 2 years. Participants were able to continue disease‐modifying therapy provided treatment initiated ≥ 6 months before study enrolment and maintained throughout study. Baseline diet > 30% total daily caloric intake from fat determined by the self‐administered Food Frequency Questionnaire. Exclusion criteria included pregnancy, breastfeeding, relapse or corticosteroid therapy ≤ 30 days of study enrolment. 32 randomized to diet group and 29 to control group. 8 participants withdrew, including 6 from diet group and 2 from control group. Among the 26 participants included in analysis of the diet intervention, 22 participants were diet adherent, defined as ≤ 20% calories from fat at least 80% of the time. In the diet compared to control group, disease‐modifying therapy was taken as follows: 8/9 none, 12/10 glatiramer acetate, 11/10 interferon, and 1/0 natalizumab. Baseline characteristics were similar although there were significant differences with higher fatigue, higher EDSS, and greater portion with gadolinium‐enhancing lesions in the diet group. | |
| Interventions | Very low‐fat, plant‐based diet compared to waiting list over 12 months. The very low‐fat, plant‐based diet group received instruction on the diet and had monitoring with Food Frequency Questionnaire monthly. Study diet was based on starchy plant foods (beans, bread, corn, pasta, rice, potatoes, fruit, non‐starchy vegetables), 10% calories from fat, 14% calories from protein, and 76% calories from carbohydrates. The diet did not allow consumption of meat, fish, eggs, dairy, or vegetable oils. The control group received an exercise seminar. All participants were encouraged to perform ≥ 30 minutes moderate intensity exercise at least 5 days/week. | |
| Outcomes | Primary
Secondary (over 12 months)
|
|
| Notes | Previously listed as ongoing study NCT00852722 | |
| Risk of bias | ||
| Bias | Authors' judgement | Support for judgement |
| Random sequence generation (selection bias) | Low risk | Computer‐generated randomization stratified according to disease‐modifying therapy use |
| Allocation concealment (selection bias) | High risk | Treatment allocation was known to participants, treating neurologist, study co‐ordinators, and dietician. |
| Blinding of participants and personnel (performance bias) All outcomes | High risk | Treatment allocation was known to participants, treating neurologist, study co‐ordinators, and dietician. |
| Blinding of outcome assessment (detection bias) All outcomes | Unclear risk | Radiologists reviewing imaging and neurologists performing EDSS were blinded to treatment allocation. |
| Incomplete outcome data (attrition bias) All outcomes | High risk | 8 of 61 participants withdrew from the study including 6 participants from the diet group and 2 participants from the control group. |
| Selective reporting (reporting bias) | Unclear risk | Prespecified outcomes reported. Clinical measures mainly reported as rate of change per month with P value |
| Other bias | Unclear risk | Participants able to discuss study experiences with each other in‐person and online |
Zandi‐Esfahan 2017.
| Study characteristics | ||
| Methods | Double‐blind, parallel‐group, randomized trial | |
| Participants | 50 adults with RRMS (Polman 2011), at a single centre (Iran). Inclusion criteria included age 18 to 45 years, EDSS ≤ 5, ≥ 1 relapse over past 1 year, and varicella immunity. Exclusion criteria included pregnancy, chronic infection, cardiovascular disease, use of steroids ≤ 1 month prior to study enrolment, prior exposure chemotherapy, use of interferons ≤ 2 months prior to study enrolment, prior exposure to fingolimod, relapse ≤ 30 days before entering study or any time during study, dietary supplements. 25 participants were randomized to fish oil or placebo group, respectively. At baseline, groups were similar in sex, age, and seafood consumption. 41 participants were included in analysis, including 21 in fish oil group and 20 in placebo group. In the fish oil group, 2 discontinued due to hypotension/bradycardia secondary to fingolimod, 1 experienced a relapse, 1 started another herbal supplement. In the placebo group, 3 lost to follow‐up, 1 experienced hypotension/bradycardia secondary to fingolimod, 1 experienced a relapse | |
| Interventions | Fish oil versus placebo over 12 months. Fish oil capsules contained EPA 180 mg, DHA 120 mg, excipient (glycerin, water, tocopherol, sunflower oil, titanium dioxide). Placebo capsules contained excipient. All participants received fingolimod 0.5 mg daily | |
| Outcomes |
|
|
| Notes | Reports participants excluded from analysis due to experiencing relapse during study | |
| Risk of bias | ||
| Bias | Authors' judgement | Support for judgement |
| Random sequence generation (selection bias) | Unclear risk | Block randomized although method of generating randomized sequence unclear |
| Allocation concealment (selection bias) | Low risk | Randomization performed by nurse not otherwise involved in study |
| Blinding of participants and personnel (performance bias) All outcomes | Low risk | 'Double‐blind'. Capsules were identical in appearance, packaging, and labelling. |
| Blinding of outcome assessment (detection bias) All outcomes | Unclear risk | 'Double‐blind'. All assays were performed blind on coded samples. Blinding of clinical assessments, including EDSS unclear |
| Incomplete outcome data (attrition bias) All outcomes | Unclear risk | 9 of 50 participants withdrew, including 4 participants in active treatment group and 5 participants in placebo group. |
| Selective reporting (reporting bias) | Unclear risk | All outcomes outlined in the methods reported |
| Other bias | Unclear risk | Unclear whether withdrawn participants included in description of baseline characteristics |
BMI: body mass index DASS: Depression Anxiety and Stress Scale DHA: docosahexaenoic acid EDSS: Expanded Disability Status Scale EPA: eicosapentaenoic acid FSS: Fatigue Severity Scale GHQ‐28: General Health Questionnaire‐28 MFIS: Modified Fatigue Impact Scale MRI: magnetic resonance imaging MSFC: Multiple Sclerosis Functional Composite MSQoL‐54: Multiple Sclerosis Quality of Life‐54 MUFA: monounsaturated fatty acid NSAID: non‐steroidal anti‐inflammatory drug PASAT: paced auditory serial addition test PPMS: primary progressive multiple sclerosis PUFA: polyunsaturated fatty acid RRMS: relapsing remitting multiple sclerosis SF‐36: 36‐Item Short Form Health Survey SPMS: secondary progressive multiple sclerosis UTI: urinary tract infection
Characteristics of excluded studies [ordered by study ID]
| Study | Reason for exclusion |
|---|---|
| Bisaga 2011 | RCT for cytoflavine treatment of relapse; both treatment and placebo arms received trental and vitamin B supplementation as co‐intervention |
| Bisaga 2012 | RCT for cytoflavine treatment of relapse; both treatment and placebo arms received trental and vitamin B supplementation as co‐intervention |
| Bitarafan 2013 | RCT for vitamin A treatment; both treatment and placebo arms received vitamin D and interferon beta‐1a as co‐intervention. No clinical outcome |
| Bittner 2016 | RCT for lipoic acid. Pharmacokinetic data |
| Cendrowski 1982 | Review paper |
| Cignarella 2017 | Animal experiment |
| Coe 2017 | Cross‐over study of single dose of flavonoid on fatigue |
| Dworkin 1981 | Letter to the editor |
| Dworkin 1984 | Reanalysis of three RCTs on PUFA supplementation in RRMS (Millar 1973; Bates 1978; Paty 1978). |
| Eghtesadi 2015 | RCT for lipoic acid. No clinical outcome |
| Field 1979 | Letter to the editor |
| Fitzgerald 2017 | RCT for fasting diets. No clinical MS‐related outcomes. Abstracts x 4 |
| Gasperini 2011 | RCT for cyanocobalamin plus calcium levofolinate. Only reported outcome brain atrophy. Previously listed as ongoing study AIFA 2005‐006071‐12 |
| Harbige 2007 | Review paper |
| Holmoy 2013 | RCT for omega‐3 fatty acids. No clinical outcome |
| Jafarirad 2012 | RCT for vitamin A. No clinical outcome |
| Jafarirad 2013 | RCT for vitamin A. No clinical outcome |
| Kouchaki 2018 | RCT for omega‐3 and vitamin D versus placebo. Unable to separate effect of omega‐3 from vitamin D |
| Lambert 2003 | RCT for creatine. No clinical MS‐related outcomes |
| Lieben 2017 | RCT for single dose of tryptophan on cognition |
| Loder 2002 | RCT for lofepramine and phenylalanine; both treatment and placebo arms received vitamin B12 |
| Lopes De Carvalho 2012 | RCT for D‐mannose, cranberry and vitamin C. No clinical MS‐related outcomes |
| Lovera 2015 | Single arm study of polyphenon E |
| Mauriz 2013 | RCT for low‐fat diet and antioxidant supplementation. No clinical outcome |
| Mauriz 2014 | RCT for lemon verbena supplementation. No clinical outcome |
| Mertin 1973 | Letter to the editor |
| Meyer‐Rienecker 1976 | Uncontrolled pre‐post study |
| Millar 1984 | Abstract of Dworkin 1984 describing reanalysis of RCTs for PUFA supplementation |
| Moccia 2019 | Retrospective analysis on prospectively collected data |
| Mohammadzadeh Honarvar 2013 | RCT for vitamin A. No clinical outcome |
| Mohammadzadeh Honarvar 2016 | RCT for vitamin A. No clinical outcome |
| Saboor‐Yaraghi 2015 | RCT for vitamin A. No clinical outcome |
| Salari 2015 | RCT for zinc sulphate on depression outcomes |
| Saresella 2017 | Non‐randomized design with self‐selection to high‐vegetable, low‐protein diet or Western diet |
| Schultz 1984 | Uncontrolled pre‐post study |
| Shinto 2008 | RCT for naturopathic treatment |
| Simpson 1985 | Uncontrolled pre‐post study |
| Skakonik 1963 | Non‐randomized study with diabetol |
| Spitsin 2010 | RCT for inosine on blood pressure outcomes |
| Swank 1990 | Case series |
| Tamtaji 2017 | RCT for probiotic. No clinical outcome |
| Toncev 2006 | Non‐randomized administration of inosine |
| Tran 2018 | Study population healthy volunteers |
| van Rensburg 2006 | Uncontrolled study of iron and folate‐vitamin B12 |
| Wade 2002 | RCT for lofepramine and phenylalanine; both treatment and placebo arms received vitamin B12 |
PUFA: polyunsaturated fatty acid RCT: randomized controlled trial RRMS: relapsing remitting MS
Characteristics of studies awaiting classification [ordered by study ID]
Bock 2015.
| Methods | Design: RCT |
| Participants | 60 participants with RRMS |
| Interventions | Intervention group: ketogenic diet for 6 months Intervention group: usual diet with initial 7‐day fasting episode Control group: usual diet |
| Outcomes | Quality of life assessed using the MSQoL‐54 over 6 months |
| Notes | Need more information about co‐interventions and study results |
Kanter 2014.
| Methods | Design: RCT |
| Participants | 21 participants with MS |
| Interventions | Intervention group: beta‐alanine (4.8 g/day) for 4 weeks Control group: placebo for 4 weeks |
| Outcomes | EDSS, SF‐36, and MFIS over 4 weeks |
| Notes | Need more information about study results |
Khalili 2017.
| Methods | Design: RCT |
| Participants | 31 participants with RRMS |
| Interventions | Intervention group: alpha‐lipoic acid capsules (1200 mg/day) for 12 weeks Control group: placebo for 12 weeks |
| Outcomes | Mean variation of ADMA and EDSS over 12 weeks |
| Notes | Need more information about co‐interventions |
Loy 2018.
| Methods | Design: RCT |
| Participants | 21 participants with SPMS |
| Interventions | Intervention group: racemic lipoic acid capsules (1200 mg/day) for 2 years Control group: placebo for 2 years |
| Outcomes | Timed Up and Go (TUG) over 2 years |
| Notes | May not be randomized |
Shah 2007.
| Methods | Design: RCT |
| Participants | 30 participants with MS |
| Interventions | Intervention group: Best Bet Diet (hypoallergenic diet, high in vitamin D) for 12 months Control group: dietary advice given by the MS Society for 12 months |
| Outcomes | Primary outcome of MRI white matter lesions and rate of brain atrophy Secondary outcomes of clinical measures and symptom scores |
| Notes | Need more information on study results |
Tourbah 2018.
| Methods | Design: RCT |
| Participants | 93 participants with MS with unilateral or bilateral optic neuropathy and evidence of worsening visual acuity during the last 3 years |
| Interventions | Intervention group: biotin capsules (300 mg/day) for 6 months Control group: placebo for 6 months |
| Outcomes |
|
| Notes | Need more information on study results |
ADMA: asymmetric dimethylarginine EDSS: Expanded Disability Status Scale IU: international units MFIS: modified Fatigue Impact Scale MRI: magnetic resonance imaging MS: multiple sclerosis MSQoL‐54 ‐ Multiple Sclerosis Quality of Life‐54 OCT: optical coherence tomography RCT: randomized controlled study RNFL: retinal nerve fibre layer RRMS: relapsing remitting multiple sclerosis SF‐36: 36‐Item Short Form Health Survey SPMS: secondary progressive multiple sclerosis VEPs: visual evoked potentials
Characteristics of ongoing studies [ordered by study ID]
NCT01514370.
| Study name | Dietary supplement of curcumin in subjects with active relapsing multiple sclerosis treated with subcutaneous interferon beta‐1a |
| Methods | RCT |
| Participants | Age 18 to 60 years, RRMS diagnosed ≤ 3 years, EDSS ≤ 5.5, current treatment with interferon beta‐1a 44 μg for ≥ 6 months and < 12 months prior to enrolment, inflammatory activity (≥ 1 gadolinium‐enhancing lesion or 1 relapse) in 6 months before enrollment |
| Interventions | Curcumin versus placebo for 24 months. Co‐intervention interferon beta‐1a |
| Outcomes | Primary outcome
Secondary outcomes
|
| Starting date | April 2012 |
| Contact information | Merck Serono |
| Notes |
NCT01848327.
| Study name | Caprylic triglyceride for treatment of cognitive impairments in multiple sclerosis |
| Methods | RCT |
| Participants | Age 18 to 59 years, multiple sclerosis (RRMS, PPMS, SPMS), EDSS ≥ 2, memory complaint, MMSE ≥ 24 |
| Interventions | Caprylic triglyceride versus placebo for 90 days |
| Outcomes | Primary outcomes (related to cognition) including:
Secondary outcomes include:
|
| Starting date | February 2013 |
| Contact information | Leticia Tornes, University of Miami |
| Notes |
NCT01915433.
| Study name | Wahls Paleo diet and progressive multiple sclerosis |
| Methods | RCT |
| Participants | Age 30 to 65 years, multiple sclerosis (RRMS, PPMS, SPMS), EDSS ≥ 4.5, able to walk 25 feet in < 60 seconds, non‐smoker, American diet, significant fatigue (FSS score ≥ 4 or MFIS score ≥ 38) |
| Interventions | Wahls Paleo plus (ketogenic) diet or Wahls (modified Paleolithic) diet or control consisting of usual care only for 12 weeks |
| Outcomes | Primary outcome
Secondary outcomes
|
| Starting date | July 2013 |
| Contact information | Terry Wahls, University of Iowa |
| Notes |
NCT02664623.
| Study name | Personalized nutrition advice for optimizing dietary calcium intake in MS patients |
| Methods | RCT |
| Participants | Multiple sclerosis, EDSS < 6.5 |
| Interventions | Dietary advice sheet +/‐ dietician for optimizing calcium consumption at 6 months |
| Outcomes | Primary outcome
Secondary outcomes
|
| Starting date | July 2016 |
| Contact information | Eric Thouvenot, Centre Hospitalier Universitaire de Nîmes |
| Notes |
NCT02914964.
| Study name | Dietary approaches to treat multiple sclerosis‐related fatigue study |
| Methods | RCT |
| Participants | Age 18 to 70 years, RRMS, able to walk 25 feet without support or with unilateral support, FSS ≥ 4 |
| Interventions | Swank diet versus Wahls elimination diet for 24 weeks. Swank diet is a low saturated fat diet. Wahls diet is a modified Paleolithic diet excluding grains, dairy, eggs, legumes, nightshade vegetables. |
| Outcomes | Primary outcome
Secondary outcomes
|
| Starting date | August 2016 |
| Contact information | Terry Wahls and LInda Snetselaar, University of Iowa |
| Notes |
NCT02936037.
| Study name | Effect of MD1003 in progressive multiple sclerosis (SPI2) |
| Methods | RCT |
| Participants | Age 18 to 65 years, progressive MS, EDSS 3.5 to 6.5, TW25 < 40 seconds, disability progression in last 2 years (a) EDSS during the past two years of at least 1 point increase sustained for at least 6 months if inclusion EDSS is from 3.5 to 5.5 or at least 0.5 point increase sustained for at least 6 months if inclusion EDSS is from 6 to 6.5 or b) increase of TW25 by at least 20% in the last two years sustained for at least 6 months or c) other well‐documented objective worsening validated by the Adjudication Commit), Kurtzke pyramidal functional subscore ≥ 2 |
| Interventions | MD1003 100 mg by mouth 3 times/day versus placebo for 15 to 27 months |
| Outcomes | Primary outcome
Secondary outcomes
Other outcomes include:
|
| Starting date | December 2016 |
| Contact information | Bruce Cree, University of California, San Francisco |
| Notes |
NCT02986893.
| Study name | Pilot diet study for multiple sclerosis |
| Methods | RCT |
| Participants | Age 18 to 65 years, female, self‐reported race white or black, CIS or RRMS or PPMS or SPMS |
| Interventions | Diet intervention versus usual diet for 6 months. Diet intervention includes foods high in polyunsaturated fatty acids, polyphenols, antioxidants while excluding dairy, saturated fat, and refined sugars. |
| Outcomes | Primary outcomes
Secondary outcomes
|
| Starting date | November 2016 |
| Contact information | Ilana Katz Sand, Corinne Goldsmith Dickinson Center for Multiple Sclerosis at Mount Sinai |
| Notes |
NCT03322982.
| Study name | Low fat diet for fatigue in MS |
| Methods | RCT |
| Participants | Age 18 to 70 years, MS, EDSS ≤ 7.5, MFIS ≥ 38 |
| Interventions | Low‐fat diet versus waiting list for 4 months |
| Outcomes | Primary outcome
Secondary outcomes
|
| Starting date | November 2017 |
| Contact information | Vijayshree Yadav, Oregan Health and Science University |
| Notes |
NCT03387046.
| Study name | A pilot study in subjects with relapsing remitting multiple sclerosis (RR‐MS) |
| Methods | RCT |
| Participants | RRMS, EDSS ≤ 3, interferon beta‐1a 44 µg 3 times/week for ≥ 6 months and ≤ 10 years, among those with relapse, enrolment < 5 days from relapse onset |
| Interventions | D‐aspartate versus placebo for 24 weeks. Co‐intervention interferon beta‐1a for all participants. Co‐intervention methylprednisolone 1000 mg intravenous daily for 5 days among those with relapse |
| Outcomes | Primary outcome
Secondary outcomes
|
| Starting date | March 2018 |
| Contact information | Merck KGaA |
| Notes |
NCT03508414.
| Study name | Nutritional approaches in multiple sclerosis |
| Methods | RCT |
| Participants | Age 18 to 65 years, RRMS and EDSS < 4.5 |
| Interventions | Ketogenic versus intermittent therapeutical fasting versus vegetarian control diets for 18 months |
| Outcomes | Primary outcome
Secondary outcomes
|
| Starting date | April 2017 |
| Contact information | Paul Friedemann, Charite University, Berlin, Germany |
| Notes |
CAREQOL‐MS: caregiver quality of life in MS CIS: clinically isolated syndrome DMT: disease‐modifying therapy EDSS: Expanded Disability Status Scale FIS: Fatigue Impact Scale FSS ‐ Fatigue Severity Scale MFIS ‐ Modified Fatigue Impact Scale MMSE: Mini‐Mental State Examination MRI: magnetic resonance imaging MS: multiple sclerosis MSFC: Multiple Sclerosis Functional Composite MSQLI: Multiple Sclerosis Quality of Life Inventory MSQoL‐54: Multiple Sclerosis Quality of Life‐54 PPMS: primary progressive MS RCT: randomized controlled trial RRMS: relapsing remitting MS SDMT: Symbol Digital Modalities Test SPMS: secondary progressive MS TW25: time to walk 25 feet
Differences between protocol and review
The title of the review was updated to "Dietary interventions for multiple sclerosis‐related outcomes" from "Dietary interventions for multiple sclerosis". In this review, there is an updated search strategy which captured the six RCTs on polyunsaturated fatty acid (PUFA) described in the prior review (Farinotti 2012), along with additional trials. After we determined the included studies, we decided to group analysis into PUFA supplementation, antioxidant supplementation, dietary programme, and other supplementation. We assessed primary outcomes (relapses, disability worsening) at last available follow‐up to examine long‐term response to the intervention. We updated study descriptions, risk of bias, and outcome analyses.
Contributions of authors
| Task | Author |
| Draft the protocol |
Farinotti 2007 with modifications by Natalie E Parks (NEP), Bradley C Johnston (BCJ) |
| Develop criteria for a search strategy | NEP, BCJ |
| Search identified titles and abstracts for trials | NEP, Laura Vacchi (LV), Roah Merdad (RM) |
| Obtain copies of trials | NEP, Caitlin S Jackson‐Tarlton (CSJT) |
| Select which trials to include | NEP, CSJT, LV, RM |
| Extract data from trials | NEP, CSJT, LV |
| Enter data into Review Manager software | NEP, CSJT |
| Carry out the analysis | NEP, CSJT, BCJ |
| Interpret the analysis | NEP, CSJT, LV, RM, BCJ |
| Draft the final review | NEP, CSJT, LV, RM, BCJ |
Sources of support
Internal sources
Dalhousie University, Canada
External sources
No sources of support supplied
Declarations of interest
Natalie E Parks has provided consulting services to Biogen, EMD Serono, Roche, and Sanofi Genzyme. She has accepted funds from Biogen and Roche for travel to a scientific conference. She has acted as site sub‐investigator for clinical trials for Biogen, MedDay, Sanofi Genzyme, and Roche. She is the recipient of a Killam Predoctoral Scholarship, Nova Scotia Graduate Scholarship, and Dalhousie Medical Research Foundation Multiple Sclerosis Graduate Studentship.
Caitlin S Jackson‐Tarlton: nothing to declare Laura Vacchi: nothing to declare Roah Merdad: nothing to declare Bradley C Johnston: As part of his recruitment to Texas A&M University, BCJ received a start‐up grant from Texas A&M AgriLife Research to fund investigator‐initiated research related to saturated and polyunsaturated fats. The grant was from Texas A&M AgriLife institutional funds from interest and investment earnings, not a sponsoring organization, industry, or company.
Prior appointment Department of Community Health and Epidemiology, Dalhousie University, Halifax, Canada
New search for studies and content updated (no change to conclusions)
References
References to studies included in this review
Bates 1977 {published data only}
- *.Bates D, Fawcett PR, Shaw DA, Weightman D. Trial of polyunsaturated fatty acids in non-relapsing multiple sclerosis. British Medical Journal 1977;2(6092):932-33. [PMID: 334337 ] [DOI] [PMC free article] [PubMed] [Google Scholar]
Bates 1978 {published data only}
- *.Bates D, Fawcett PR, Shaw DA, Weightman D. Polyunsaturated fatty acids in treatment of acute remitting multiple sclerosis. British Medical Journal 1978;2(6149):1390-1. [PMID: ] [DOI] [PMC free article] [PubMed] [Google Scholar]
- Shaw D. Trial of polyunsaturated fatty acids in multiple sclerosis [abstract]. Irish Journal of Medical Science 1978;147(3):118. [CN-00257675] [Google Scholar]
Bates 1989 {published data only}
- *.Bates D, Cartlidge NE, French JM, Jackson MJ, Nightingale S, Shaw DA, et al. A double-blind controlled trial of long chain n-3 polyunsaturated fatty acids in the treatment of multiple sclerosis. Journal of Neurology, Neurosurgery, and Psychiatry 1989;52(1):18-22. [PMID: ] [DOI] [PMC free article] [PubMed] [Google Scholar]
- Bates D, Cartlidge NE, French JM. Results of a trial of N-3 polyunsaturated fatty acids in the treatment of multiple sclerosis [abstract]. Irish Journal of Medical Science 1988;157(8):277. [Google Scholar]
Bitarafan 2015 {published data only}
- *.Bitarafan S, Saboor-Yaraghi A, Sahraian MA, Nafissi S, Togha M, Beladi Moghadam N, et al. Impact of vitamin A supplementation on disease progression in patients with multiple sclerosis. Archives of Iranian Medicine 2015;18(7):435-40. [PMID: ] [PubMed] [Google Scholar]
- Bitarafan S, Saboor-Yaraghi A, Sahraian MA, Soltani D, Nafissi S, Togha M, et al. Effect of Vitamin A supplementation on fatigue and depression in multiple sclerosis patients: A double-blind placebo-controlled clinical trial. Iranian Journal of Allergy, Asthma, and Immunology 2016;15(1):13-19. [PMID: ] [PubMed] [Google Scholar]
- Harrirchian MH, Mohammadzadeh Honarvar N, Koohdani F, Bitarafan S, Siassi F, Jafarirad S, et al. The effect of vitamin A supplementation on disease progression, cytokine levels and gene expression in multiple sclerotic patients: Study protocol for a randomized controlled trial. Acta Medica Iranica 2014;52(2):94-100. [PMID: ] [PubMed] [Google Scholar]
Gallien 2014 {published and unpublished data}
- *.Gallien P, Amarenco G, Benoit N, Bonniaud V, Donzé C, Kerdraon J, et al. Cranberry versus placebo in the prevention of urinary infections in multiple sclerosis: A multicenter, randomized, placebo-controlled, double-blind trial. Multiple Sclerosis Journal 2014;20(9):1252-9. [PMID: ] [DOI] [PubMed] [Google Scholar]
Gonsette 2010 {published data only}
- *.Gonsette RE, Sindic C, D'hooghe MB, De Deyn PP, Medaer R, Michotte A, et al. Boosting endogenous neuroprotection in multiple sclerosis: the association of inosine and interferon beta in relapsing remitting multiple sclerosis (ASIIMS) trial. Multiple Sclerosis Journal 2010;16:455-62. [PMID: ] [DOI] [PubMed] [Google Scholar]
- Gonsette RF, Sindic C, D'Hooghe MB, Medaer R, Michotte A, De Deyn P, et al. Association of interferon beta and inosine in relapsing-remitting multiple sclerosis (ASIIMS): a multi-centre, randomized, double-blind, placebo-controlled phase II (proof of concept) trial in 157 patients [abstract]. Multiple Sclerosis Journal 2008;14:S44. [Google Scholar]
Irish 2017 {published data only}
- *.Irish AK, Erickson CM, Wahls TL, Snetselaar LG, Darling WG. Randomized control trial evaluation of a modified paleolithic dietary intervention in the treatment of relapsing-remitting multiple sclerosis: A pilot study. Degenerative Neurological and Neuromuscular Disease 2017;7:1-18. [PMID: ] [DOI] [PMC free article] [PubMed] [Google Scholar]
Khalili 2012 {published data only}
- *.Khalili M, Eskandarai G, Ghajarzadeh M, Azimi A, Eghtesadi S, Sahraian MA, et al. Lipoic acid and multiple sclerosis: A randomized controlled clinical trial. Current Topics in Nutraceutical Research 2012;10:95-100. [Google Scholar]
Khalili 2014 {published data only}
- *.Khalili M, Azimi A, Izadi V, Eghtesadi S, Mirshafiey A, Sahraian MA, et al. Does lipoic acid consumption affect the cytokine profile in multiple sclerosis patients: A double-blind, placebo-controlled, randomized clinical trial. Neuroimmunomodulation 2014;21:291-6. [PMID: ] [DOI] [PubMed] [Google Scholar]
- Khalili M, Eghtesadi S, Mirshafiey A, Eskandari G, Sanoobar M, Sahraian MA, et al. Effect of lipoic acid consumption on oxidative stress among multiple sclerosis patients: A randomized controlled clinical trial. Nutritional Neuroscience 2014;17(1):16-20. [PMID: ] [DOI] [PubMed] [Google Scholar]
- Seifar F, Khalili M, Azimi A. Effect of lipoic acid on oxidative stress in multiple sclerosis patients: A double blind randomised clinical trial [abstract]. European Journal of Neurology 2016;23(S2):825. [Google Scholar]
Kouchaki 2017 {published data only}
- *.Kouchaki E, Tamtaji OR, Salami M, Bahmani F, Daneshvar Kakhaki R, Akbari E, et al. Clinical and metabolic response to probiotic supplementation in patients with multiple sclerosis: A randomized, double-blind, placebo-controlled trial. Clinical Nutrition 2017;36:1245-9. [PMID: ] [DOI] [PubMed] [Google Scholar]
Mahler 2015 {published data only}
- Mähler A, Steiniger J, Bock M, Klug L, Parreidt N, Lorenz M, et al. Green tea and energy metabolism in multiple sclerosis patients [abstract]. Multiple Sclerosis Journal 2013;19(S1):524. [Google Scholar]
- *.Mähler A, Steiniger J, Bock M, Klug L, Parreidt N, Lorenz M, et al. Metabolic response to epigallocatechin-3-gallate in relapsing-remitting multiple sclerosis: A randomized clinical trial. American Journal of Clinical Nutrition 2015;101(3):487-95. [PMID: ] [DOI] [PubMed] [Google Scholar]
Malin 2008 {published data only}
- *.Malin S, Cotugna N, Fang C. Effect of creatine supplementation on muscle capacity in individuals with multiple sclerosis. Journal of Dietary Supplements 2008;5(1):20-32. [PMID: ] [DOI] [PubMed] [Google Scholar]
Markowitz 2009 {published data only}
- *.Markowitz CE, Spitsin S, Zimmerman V, Jacobs D, Udupa JK, Hooper DC, et al. The treatment of multiple sclerosis with inosine. Journal of Alternative and Complementary Medicine 2009;15(6):619-25. [PMID: ] [DOI] [PMC free article] [PubMed] [Google Scholar]
Millar 1973 {published data only}
- *.Millar JH, Zilkha KJ, Langman MJ, Wright HP, Smith AD, Belin J, et al. Double-blind trial of linoleate supplementation of the diet in multiple sclerosis. British Medical Journal 1973;1(5856):765-8. [PMID: ] [DOI] [PMC free article] [PubMed] [Google Scholar]
Munoz Garcia 2015 {published data only}
- *.Muñoz García D, Midaglia L, Martinez Vilela J, Marín Sánchez M, López González FJ, Arias Gómez M, et al. Associated inosine to interferon: Results of a clinical trial in multiple sclerosis. Acta Neurologica Scandanavia 2015;131:405-10. [PMID: ] [DOI] [PubMed] [Google Scholar]
Naghashpour 2013 {published data only}
- *.Naghashpour M, Majdinasab N, Shakerinejad G, Kouchak M, Haghighizadeh MH, Jarvandi F, et al. Riboflavin supplementation to patients with multiple sclerosis does not improve disability status nor is riboflavin supplementation correlated to homocysteine. International Journal of Vitamin and Nutrition Research 2013;83(5):281-90. [PMID: ] [DOI] [PubMed] [Google Scholar]
Orefice 2016 {published data only}
- Montella S, Carotenuto A, Orefice NS, Orefice G. A double-blind, randomized, versus-placebo study of palmitoylethanolamide in subjects with relapsing remitting multiple sclerosis: Preliminary results [abstract]. Journal of Neurology 2014;261(S1):S437-8. [Google Scholar]
- Orefice N, Calabrese M, Carotenuto A, Cerillo I, Montella S, Cerullo G, et al. A double-blind, randomized, versus-placebo study of palmitoylethanolamide in relapsing-remitting multiple sclerosis [abstract]. Multiple Sclerosis Journal 2014;20(S1):114-5. [Google Scholar]
- *.Orefice NS, Alhouayek M, Carotenuto A, Montella S, Barbato F, Comelli A, et al. Oral palmitoylethanolamide treatment is associated with reduced cutaneous adverse effects of interferon-β1a and circulating proinflammatory cytokines in relapsing-remitting multiple sclerosis. Neurotherapeutics 2016;13(2):428-38. [PMID: 26857391 ] [DOI] [PMC free article] [PubMed] [Google Scholar]
Pantzaris 2013 {published data only}
- Pantzaris M, Loukaides G, Ntzani E, Patrikios I. A novel oral medical nutrition formula (PLP10) for the treatment of relapsing-remitting multiple sclerosis: A randomised, double-blind, placebo-controlled proof-of-concept clinical trial [abstract]. Multiple Sclerosis Journal 2012;18(S4):473. [Google Scholar]
- *.Pantzaris MC, Loukaides GN, Ntzani EE, Patrikios IS. A novel oral nutraceutical formula of omega-3 and omega-6 fatty acids with vitamins (PLP10) in relapsing remitting multiple sclerosis: a randomised, double-blind, placebo-controlled proof-of-concept clinical trial. BMJ Open 2013;3(4):e002170. [PMID: ] [DOI] [PMC free article] [PubMed] [Google Scholar]
- Patrikios I, Loucaides G, Pantzaris M, Crawford M, Ghebremeskel K. Omega-3, omega-6 PUFA and gamma-tocopherol in multiple sclerosis: PLP10 intervention efficacy and red blood cells' membrane lipids composition [abstract]. Multiple Sclerosis Journal 2015;21(S11):323. [Google Scholar]
- Patrikios I, Pantzaris M, Loukaides G, Ntzani E. Oral nutraceutical formula (PLP10) for the treatment of relapsing remitting multiple sclerosis: double-blind, randomized clinical trial [abstract]. Clinical Nutrition 2012;7(1):266. [Google Scholar]
Paty 1978 {published data only}
- Paty DW, Cousin HK, McDonald LE. Letter: Linoleic acid in multiple sclerosis. Lancet 1975;1(7917):1197-8. [PMID: ] [DOI] [PubMed] [Google Scholar]
- *.Paty DW, Cousin HK, Read S, Adlakha K. Linoleic acid in multiple sclerosis: Failure to show any therapeutic benefit. Acta Neurologica Scandinavica 1978;58(1):53-8. [PMID: ] [DOI] [PubMed] [Google Scholar]
- Paty DW. Double-blind trial of linoleic acid in multiple sclerosis. Archives of Neurology 1983;40(11):693-4. [PMID: ] [DOI] [PubMed] [Google Scholar]
Ramirez‐Ramirez 2013 {published data only}
- *.Ramirez-Ramirez V, Macias-Islas MA, Ortiz GG, Pacheco-Moises F, Torres-Sanchez ED, Sorto-Gomez TE, et al. Efficacy of fish oil on serum of TNF α , IL-1 β, and IL-6 oxidative stress markers in multiple sclerosis treated with interferon beta-1b. Oxidative Medicine and Cellular Longevity 2013;2013:709493. [PMID: ] [DOI] [PMC free article] [PubMed] [Google Scholar]
- Ramirez-Ramirez VR, Ortiz GG, Islas MA, Sanchez ET, Moises FP, la Rosa AC, et al. Effect of fish oil on cytokines, oxidative stress markers and progression disability in multiple sclerosis [abstract]. Multiple Sclerosis Journal 2012;18(12):1836. [Google Scholar]
- Sorto-Gomez TE, Ortiz GG, Pacheco-Moises FP, Torres-Sanchez ED, Ramirez-Ramirez V, Macias-Islas MA, et al. Effect of fish oil on glutathione redox system in multiple sclerosis. American Journal of Neurodegenerative Disease 2016;5(2):145-51. [PMID: ] [PMC free article] [PubMed] [Google Scholar]
Rezapour‐Firouzi 2013 {published data only}
- Rezapour-Firouzi S, Arefhosseini SR, Ebrahimi-Mamaghani M, Baradaran B, Sadeghihokmabad E, Mostafaei S, et al. Alteration of delta-6-desaturase (FADS2), secretory phospholipase-A2 (sPLA2) enzymes by Hot-nature diet with co-supplemented hemp seed, evening primrose oils intervention in multiple sclerosis patients. Complementary Therapies in Medicine 2015;23(5):652-7. [PMID: ] [DOI] [PubMed] [Google Scholar]
- Rezapour-Firouzi S, Arefhosseini SR, Ebrahimi-Mamaghani M, Baradaran B, Sadeghihokmabad E, Torbati M, et al. Activity of liver enzymes in multiple sclerosis patients with Hot-nature diet and co-supplemented hemp seed, evening primrose oils intervention. Complementary Therapies in Medicine 2014;22(6):986-93. [PMID: ] [DOI] [PubMed] [Google Scholar]
- Rezapour-Firouzi S, Arefhosseini SR, Ebrahimi-Mamaghani M, Farhoudi M, Baradaran B, Ali TM, et al. Erythrocyte membrane fatty acids in multiple sclerosis patients and hot-nature dietary intervention with co-supplemented hemp-seed and evening-primrose oils. African Journal of Traditional, Complementary, and Alternative Medicine 2013;10(6):519-27. [PMID: ] [DOI] [PMC free article] [PubMed] [Google Scholar]
- *.Rezapour-Firouzi S, Arefhosseini SR, Mehdi F, Mehrangiz E, Baradaran B, Sadeghihokmabad E. Immunomodulatory and therapeutic effects of hot-nature diet and co-supplemented hemp seed, evening primrose oils intervention in multiple sclerosis patients. Complementary Therapies in Medicine 2013;21(5):473-80. [PMID: ] [DOI] [PubMed] [Google Scholar]
- Rezapour-Firouzi S, Rafie S, Farhoudi M, Ebrahimi-Mamaghani M, Baradaran B, Elyar S, et al. Regulation of lipid-dependent membrane enzymes by hot nature diet with co-supplemented hemp seed, evening primrose oils intervention in multiple sclerosis patients. Journal of Pure and Applied Microbiology 2013;7(4):2891-901. [Google Scholar]
Sanoobar 2015 {published data only}
- Sanoobar M, Dehghan P, Khalili M, Azimi A, Seifar F. Coenzyme Q10 as a treatment for fatigue and depression in multiple sclerosis patients: A double blind randomized clinical trial. Nutritional Neuroscience 2016;19(3):138-43. [PMID: ] [DOI] [PubMed] [Google Scholar]
- Sanoobar M, Eghtesadi S, Azimi A, Khalili M, Jazayeri S, Reza Gohari M. Coenzyme Q10 supplementation reduces oxidative stress and increases antioxidant enzyme activity in patients with relapsing-remitting multiple sclerosis. International Journal of Neuroscience 2013;123(11):776-82. [PMID: ] [DOI] [PubMed] [Google Scholar]
- *.Sanoobar M, Eghtesadi S, Azimi A, Khalili M, Khodadadi B, Jazayeri S, et al. Coenzyme Q10 supplementation ameliorates inflammatory markers in patients with multiple sclerosis: A double blind, placebo, controlled randomized clinical trial. Nutritional Neuroscience 2015;18(4):169-76. [PMID: ] [DOI] [PubMed] [Google Scholar]
- Seifar F, Khalili M, Sanoobar M, Azimi A, Modarresi F. A double blind clinical trial of the effect of coenzyme Q10 on oxidative stress, depression and fatigue in multiple sclerosis patients [abstract]. Multiple Sclerosis Journal 2015;21(S11):330. [Google Scholar]
Shinto 2016 {published data only}
- *.Shinto L, Marracci G, Mohr DC, Bumgarner L, Murchison C, Senders A, et al. Omega-3 fatty acids for depression in multiple sclerosis: A randomized pilot study. PLoS One 2016;11(1):e0147195. [PMID: ] [DOI] [PMC free article] [PubMed] [Google Scholar]
- Shinto L, Marracci G, Stuber L, Bourdette D. Omega-3 fatty acids as an adjunct therapy for depression in multiple sclerosis: A randomized, double-blind placebo-controlled pilot trial [abstract]. Neurology 2010;74(S2):A295. [Google Scholar]
Tomassini 2004 {published data only}
- *.Tomassini V, Pozzilli C, Onesti E, Pasqualetti P, Marinelli F, Pisani A, et al. Comparison of the effects of acetyl L-carnitine and amantadine for the treatment of fatigue in multiple sclerosis: Results of a pilot, randomised, double-blind, crossover trial. Journal of the Neurological Sciences 2004;218(1-2):103-8. [PMID: ] [DOI] [PubMed] [Google Scholar]
Torkildsen 2012 {published data only}
- Kvistad SS, Myhr KM, Holmøy T, Šaltytė Benth J, Wergeland S, Beiske AG, et al. Body mass index influence interferon-beta treatment response in multiple sclerosis. Journal of Neuroimmunology 2015;288:92-7. [PMID: ] [DOI] [PubMed] [Google Scholar]
- Kvistad SS, Myhr KM, Holmøy T, Benth JS, Wergeland S, Løken-Amsrud KI, et al. Body mass index influence disease activity and interferon-beta treatment response in multiple sclerosis [abstract]. Multiple Sclerosis Journal 2015;21(S11):165-6. [Google Scholar]
- Torkildsen O, Bakke S, Beiske A, Bjerve K, Bjornara B, Bjorna I, et al. Omega-3 fatty acids treatment in relapsing-remitting multiple sclerosis [abstract]. European Journal of Neurology 2011;18(S2):49. [Google Scholar]
- Torkildsen O, Beiske A, Hovdal H, Midgard R, Bjorna I, Henriksen O, et al. Effect of omega-3 fatty acid treatment in multiple sclerosis (OFAMS study): Results from a randomised, double-blind, placebo-controlled trial [abstract]. Multiple Sclerosis Journal 2011;17(S1):412. [Google Scholar]
- Torkildsen O, Myhr KM, Beiske A, Bjerve KS, Hovdal H, Midgard R, et al. Alpha-linolenic acid (ALA) serum levels are associated with reduced MRI activity in a prospective cohort of MS patients [abstract]. Multiple Sclerosis Journal 2017;23(S1):15. [Google Scholar]
- *.Torkildsen O, Wergeland S, Bakke S, Beiske AG, Bjerve KS, Hovdal H, et al. Omega-3 fatty acid treatment in multiple sclerosis (OFAMS Study): A randomized, double-blind, placebo-controlled trial. Archives of Neurology 2012;69(8):1044-51. [PMID: ] [DOI] [PubMed] [Google Scholar]
Tourbah 2016 {published data only}
- Arnold DL, Pelletier J, Berry I, Barillot C, Jean B, Galanaud D, et al. MD1003 in progressive multiple sclerosis: 24-month brain MRI results of the MS-SPI trial [abstract]. Multiple Sclerosis Journal 2017;23(S3):35-6. [Google Scholar]
- Laplaud DA, Gout O, Clavelou P, Pelletier J, Sedel F, Tourbah A. Effect of MD1003 (high-dose biotin) in spinal progressive multiple sclerosis (MS-SPI): Subgroup analyses [abstract]. Multiple Sclerosis Journal 2017;23(S3):402-3. [Google Scholar]
- Lasser R, Bendarraz A, Sedel F. Pharmaceutical-grade high-dose biotin improves outcome in non-active progressive multiple sclerosis: Phase 3 placebo-controlled results [abstract]. Multiple Sclerosis Journal 2017;23(13):NP12. [Google Scholar]
- Papeix C, Lebrun-Frenay C, Defer G, Labauge P, Ruiz M, Simon O, et al. Effect of MD1003 (high-dose biotin) in spinal progressive multiple sclerosis (MS-SPI): EDSS sub-scores [abstract]. Multiple Sclerosis Journal 2017;23(S3):938-9. [Google Scholar]
- Sedel F. High dose biotin for not-active progressive multiple sclerosis [abstract]. Neurotherapeutics 2017;14(3):825. [Google Scholar]
- Tourbah A, Frenay CL, Edan G, Clanet M, Papeix C, Vukusic S, et al. Effect of MD1003 (high doses of biotin) in progressive multiple sclerosis: Results of a pivotal phase III randomized double blind placebo controlled study [abstract]. Neurology 2015;84(S14):PL2.002. [Google Scholar]
- Tourbah A, Lebrun-Frenay C, Edan G, Clanet M, Papeix AC, Vukusic S, et al. High doses of biotin in progressive multiple sclerosis: Extension phase results of the MS-SPI trial [abstract]. European Journal of Neurology 2016;23(S2):70. [Google Scholar]
- Tourbah A, Lebrun-Frenay C, Edan G, Clanet M, Papeix C, Vukusic S, et al. MD1003 (high doses of biotin) in progressive multiple sclerosis: Subgroup analyses of the MS-SPI trial [abstract]. Multiple Sclerosis Journal 2015;21(S11):785. [Google Scholar]
- *.Tourbah A, Lebrun-Frenay C, Edan G, Clanet M, Papeix C, Vukusic S, et al. MD1003 (high-dose biotin) for the treatment of progressive multiple sclerosis: A randomised, double-blind, placebo-controlled study. Multiple Sclerosis Journal 2016;22(13):1719-31. [PMID: ] [DOI] [PMC free article] [PubMed] [Google Scholar]
- Tourbah A, Lebrun-Frenay, C, Edan G, Clanet M, Papeix AC, Vukusic S, et al. Effect of MD1003 (high doses of biotin) in progressive multiple sclerosis: results of a pivotal phase III randomised double-blind placebo controlled study [abstract]. European Journal of Neurology 2015;22(S1):49. [Google Scholar]
- Vukusic S, De Seze J, Edan G, Moreau T, Brochet B, Lasser R, et al. Effect of MD1003 (high-dose biotin) for the treatment of progressive MS: 36-month follow-up data [abstract]. Multiple Sclerosis Journal 2017;23(S3):401-402. [Google Scholar]
Weinstock‐Guttman 2005 {published and unpublished data}
- Weinstock-Guttman B, Baier M, Lee-Kwen P, Feichter J, Dinehart S, Venkatraman J, et al. A randomized study of low-fat diet with omega-3 fatty acid supplementation in patients with relapsing-remitting multiple sclerosis (RRMS) [abstract]. Neurology 2002;58(7):A461-2. [Google Scholar]
- *.Weinstock-Guttman B, Baier M, Park Y, Feichter J, Lee-Kwen P, Gallagher E, et al. Low fat dietary intervention with omega-3 fatty acid supplementation in multiple sclerosis patients. Prostaglandins, Leukotrienes, and Essential Fatty Acids 2005;73(5):397-404. [PMID: ] [DOI] [PubMed] [Google Scholar]
Yadav 2005 {published data only}
- *.Yadav V, Marracci G, Lovera J, Woodward W, Bogardus K, Marquardt W, et al. Lipoic acid in multiple sclerosis: A pilot study. Multiple Sclerosis 2005;11(2):159-65. [CN-00512619] [PMID: ] [DOI] [PubMed] [Google Scholar]
Yadav 2016 {published data only}
- Yadav V, Maracci G, Kim E, Spain R, Cameron M, Overs S, et al. Effects of a very low fat, plant-food based diet on fatigue in multiple sclerosis: Report of a pilot trial [abstract]. Multiple Sclerosis Journal 2014;20(S1):91. [Google Scholar]
- Yadav V, Marracci G, Kim E, Spain R, Cameron M, Overs S, et al. Effects of a low fat plant based diet in multiple sclerosis (MS): results of a 1-year long randomized controlled (RC) study [abstract]. Neurology 2014;82(S10):P6.152. [Google Scholar]
- *.Yadav V, Marracci G, Kim E, Spain R, Cameron M, Overs S, et al. Low-fat, plant-based diet in multiple sclerosis: A randomized controlled trial. Multiple Sclerosis and Related Disorders 2016;9:80-90. [PMID: ] [DOI] [PubMed] [Google Scholar]
Zandi‐Esfahan 2017 {published data only}
- *.Zandi-Esfahan S, Fazeli M, Shaygannejad V, Hasheminia J, Badihian S, Aghayerashti M, et al. Evaluating the effect of adding Fish oil to Fingolimod on TNF-alpha, IL1beta, IL6, and IFN-gamma in patients with relapsing-remitting multiple sclerosis: A double-blind randomized placebo-controlled trial. Clinical Neurology and Neurosurgery 2017;163:173-8. [PMID: ] [DOI] [PubMed] [Google Scholar]
References to studies excluded from this review
Bisaga 2011 {published data only}
- Bisaga GN, Odinak MM, Boiko AN, Melnik IuB, Popova NF. Possibilities of treatment of multiple sclerosis exacerbations without corticosteroids: A role of metabolic and antioxidant therapy. Zhurnal Nevrologii i Psikhiatrii imeni S. S. Korsakova 2011;111(2):44-8. [PMID: ] [PubMed] [Google Scholar]
Bisaga 2012 {published data only}
- Bisaga GN, Odinak MM, Boiko AN, Melnik YB, Popova NF. Treatment of exacerbations of multiple sclerosis without the use of corticosteroids: the role of metabolic and antioxidant therapy. Neuroscience and Behavioral Physiology 2012;42(2):123-7. [Google Scholar]
Bitarafan 2013 {published data only}
- Bitarafan S, Harirchian MH, Sahraian MA, Keramatipour M, Beladi Moghadam N, Togha M, et al. Impact of vitamin A supplementation on RAR gene expression in multiple sclerosis patients. Journal of Molecular Neuroscience 2013;51(2):478-84. [PMID: ] [DOI] [PubMed] [Google Scholar]
Bittner 2016 {published data only}
- Bittner F, Murchison C, Bourdette D, Spain R. The pharmacokinetics of lipoic acid at baseline and 48 weeks in secondary progressive multiple sclerosis patients. Annals of Neurology 2016;80(S20):S117. [Google Scholar]
Cendrowski 1982 {published data only}
- Cendrowski W. Unsaturated fatty acids in the immunology and therapy of multiple sclerosis. Polski Tygodnik Lekarski 1982;37(8):225-7. [PubMed] [Google Scholar]
Cignarella 2017 {published data only}
- Cignarella F, Cantoni C, Ghezzi L, Zhou Y, Cross AH, Piccio L. Intermittent fasting in experimental autoimmune encephalomyelitis and multiple sclerosis. Multiple Sclerosis Journal 2017;23(S1):69. [Google Scholar]
Coe 2017 {published data only}
- Coe S, Axelsson E, Murphy V, Collett J, Clegg M, Izadi H, et al. The effect of high flavonoid cocoa on fatigue in people with multiple sclerosis. Multiple Sclerosis Journal 2016;22(S3):823. [DOI] [PubMed] [Google Scholar]
- Coe S, Axelsson E, Murphy V, Santos M, Collett J, Clegg M, et al. Flavonoid rich dark cocoa may improve fatigue in people with multiple sclerosis, yet has no effect on glycaemic response: An exploratory trial. Clinical Nutrition ESPEN 2017;21:20-5. [PMID: 30014865 ] [DOI] [PubMed] [Google Scholar]
Dworkin 1981 {published data only}
- Dworkin RH. Linoleic acid and multiple sclerosis. Lancet 1981;1(8230):1153-4. [PMID: ] [DOI] [PubMed] [Google Scholar]
Dworkin 1984 {published data only}
- Dworkin RH, Bates D, Millar JH, Paty DW. Linoleic acid and multiple sclerosis: A reanalysis of three double-blind trials. Neurology 1984;34(11):1441-5. [PMID: ] [DOI] [PubMed] [Google Scholar]
Eghtesadi 2015 {published data only}
- Eghtesadi S, Khalili M, Azimi A, Mirshafiey A, Sahraian M, Motevalian A, et al. Study of the effect of lipoic acid consumption on cytokine profile: A double-blind randomized clinical trial. Annals of Nutrition and Metabolism 2015;67(S1):301. [Google Scholar]
Field 1979 {published data only}
- Field EJ. Polyunsaturated fatty acids and colchicine in multiple sclerosis. British Medical Journal 1979;1(6160):411-12. [PMID: ] [DOI] [PMC free article] [PubMed] [Google Scholar]
Fitzgerald 2017 {published data only}
- Fitzgerald K, Vizthum D, Henry-Barron B, Baer D, Sullivan P, Cassard S, et al. Calorie restriction diets and changes in the metabolome in people with multiple sclerosis. Multiple Sclerosis Journal 2017;23(S3):664-5. [Google Scholar]
- Fitzgerald K, Vizthum D, Henry-Barron B, Baer D, Sullivan P, Cassard S, et al. Concomitant changes in weight and in sleep quality among people with multiple sclerosis. Multiple Sclerosis Journal 2017;23(S3):761. [Google Scholar]
- Fitzgerald KC, Vizthum D, Henry-Barron B, Cassard S, Sullivan P, Baer D, et al. Effects of intermittent calorie restriction on weight, fat mass, lean mass, visceral adipose tissue: Results from a pilot controlled-feeding study in multiple sclerosis patients. Neurology 2017;88(S16):P3.390. [Google Scholar]
- Fitzgerald SK, Vizthum D, Barron B, Sullivan P, Baer D, Mowry EM. Calorie restriction diets and changes in the metabolome in people with multiple. Annals of Neurology 2017;82(S21):S191. [Google Scholar]
Gasperini 2011 {published data only}
- Gasperini C, Sormani MP, Galgani S, Stromillo ML, Scagnolari C, Solaro C, et al. Evaluation of efficacy of an add-on therapy with cianocobalamine (Vitamin B12) plus calcium levofolinate in relapsing-remitting multiple sclerosis patients already in treatment with interferon beta over a period of 24 months for a better longterm outcome (ADVANCE). Multiple Sclerosis Journal 2011;17:S208-9. [Google Scholar]
Harbige 2007 {published data only}
- Harbige LS, Sharief MK. Polyunsaturated fatty acids in the pathogenesis and treatment of multiple sclerosis. British Journal of Nutrition 2007;98(S1):S46-S53. [PMID: ] [DOI] [PubMed] [Google Scholar]
Holmoy 2013 {published data only}
- Holmoy T, Loken-Amsrud KI, Bakke SJ, Beiske AG, Bjerve KS, Hovdal H, et al. Inflammation markers in multiple sclerosis: CXCL16 reflects and may also predict disease activity. PLoS One 2013;8(9):e75021. [PMID: ] [DOI] [PMC free article] [PubMed] [Google Scholar]
Jafarirad 2012 {published data only}
- Jafarirad S, Siassi F, Harirchian MH, Sahraian MA, Eshraghian MR, Shokri F, et al. The effect of vitamin A supplementation on stimulated T-cell proliferation with myelin oligodendrocyte glycoprotein in patients with multiple sclerosis. Journal of Neurosciences in Rural Practice 2012;3(3):294-8. [PMID: ] [DOI] [PMC free article] [PubMed] [Google Scholar]
Jafarirad 2013 {published data only}
- Jafarirad S, Siassi F, Harirchian M, Amani R, Bitarafan S, Saboor-Yaraghi A. The effect of vitamin A supplementation on biochemical parameters in multiple sclerosis patients. Iranian Red Crescent Medical Journal 2013;15(3):194-8. [PMID: ] [DOI] [PMC free article] [PubMed] [Google Scholar]
Kouchaki 2018 {published data only}
- Kouchaki E, Afarini M, Abolhassani J, Mirhosseini N, Bahmani F, Masoud SA, et al. High-dose ω-3 fatty acid plus vitamin D3 supplementation affects clinical symptoms and metabolic status of patients with multiple sclerosis: a randomized controlled clinical trial. Journal of Nutrition 2018;148(8):1380-6. [DOI] [PubMed] [Google Scholar]
Lambert 2003 {published data only}
- Lambert CP, Archer RL, Carrithers JA, Fink WJ, Evans WJ, Trappe TA. Influence of creatine monohydrate ingestion on muscle metabolites and intense exercise capacity in individuals with multiple sclerosis. Archives of Physical Medicine and Rehabilitation 2003;84(8):1206-10. [PMID: ] [DOI] [PubMed] [Google Scholar]
Lieben 2017 {published data only}
- Lieben CK, Blokland A, Deutz NE, Jansen W, Han G, Hupperts RM. Intake of tryptophan-enriched whey protein acutely enhances recall of positive loaded words in patients with multiple sclerosis. Clinical Nutrition 2018;37(1):321-8. [PMID: ] [DOI] [PubMed] [Google Scholar]
Loder 2002 {published data only}
- Loder C, Allawi J, Horrobin D. Treatment of multiple sclerosis with lofepramine, L-phenylalanine and vitamin B12: Mechanism of action and clinical importance: roles of the locus coeruleus and central noradrenergic systems. Medical Hypotheses 2002;59(5):594-602. [PMID: ] [DOI] [PubMed] [Google Scholar]
Lopes De Carvalho 2012 {published data only}
- Lopes De Carvalho L, Francavilla G, Motta R, Brichetto G. D-mannose, cranberry and Vitamin C are effective in preventing urinary tract infections in multiple sclerosis subjects. Multiple Sclerosis Journal 2012;18(5):S12-S13. [Google Scholar]
Lovera 2015 {published data only}
- Lovera J, Ramos A, Devier D, Garrison V, Kovner B, Reza T, et al. Polyphenon E, non-futile at neuroprotection in multiple sclerosis but unpredictably hepatotoxic: Phase I single group and phase II randomized placebo-controlled studies. Journal of Neurological Sciences 2015;358(1-2):46-52. [PMID: ] [DOI] [PMC free article] [PubMed] [Google Scholar]
Mauriz 2013 {published data only}
- Mauriz E, Laliena A, Vallejo D, Tuñón M, Rodriguez-López J, Rodriguez-Pérez R, et al. Effects of a low-fat diet with antioxidant supplementation on biochemical markers of multiple sclerosis long-term care residents. Nutricion Hospitalaria 2013;28(6):2229-35. [PMID: ] [PubMed] [Google Scholar]
Mauriz 2014 {published data only}
- Mauriz E, Vallejo D, Tuñón M, Rodriguez-López J, Rodriguez-Pérez R, Sanz-Gómez J, et al. Effects of dietary supplementation with lemon verbena extracts on serum inflammatory markers of multiple sclerosis patients. Nutricion Hospitalaria 2014;31(2):764-71. [PMID: ] [DOI] [PubMed] [Google Scholar]
Mertin 1973 {published data only}
- Mertin J, Shenton BK, Field EJ. Unsaturated fatty acids in multiple sclerosis. British Medical Journal 1973;2(5869):777-8. [PMID: ] [DOI] [PMC free article] [PubMed] [Google Scholar]
Meyer‐Rienecker 1976 {published data only}
- Meyer-Rienecker JH, Jenssen HL, Kohler H, Field EJ, Shenton BK. Effect of gamma-linolenate in multiple sclerosis. Lancet 1976;2(7992):966. [DOI] [PubMed] [Google Scholar]
Millar 1984 {published data only}
- Millar H. Preliminary-results of double-blind linoleic-acid treatment trials in multiple-sclerosis carried out in Belfast, Newcastle-Upon-Tyne and London, Ontario. Irish Journal of Medical Science 1984;153(4):153. [Google Scholar]
Moccia 2019 {published data only}
- Moccia M, Capacchione A, Lanzillo R, Carbone F, Micillo T, Perna F, et al. Coenzyme Q10 supplementation reduces peripheral oxidative stress and inflammation in interferon-β1a-treated multiple sclerosis. Therapeutic Advances in Neurological Disorders 2019;12:1756286418819074. [PMID: ] [DOI] [PMC free article] [PubMed] [Google Scholar]
Mohammadzadeh Honarvar 2013 {published data only}
- Mohammadzadeh Honarvar N, Harirchian M, Koohdani F, Siassi F, Abdolahi M, Bitarafan S, et al. The effect of vitamin A supplementation on retinoic acid-related orphan receptor γt (RORγt) and interleukin-17 (IL-17) gene expression in Avonex-treated multiple sclerotic patients. Journal of Molecular Neuroscience 2013;51(3):749-53. [PMID: ] [DOI] [PubMed] [Google Scholar]
Mohammadzadeh Honarvar 2016 {published data only}
- Mohammadzadeh Honarvar N, Harirchian MH, Abdolahi M, Abedi E, Bitarafan S, Koohdani F, et al. Retinyl palmitate supplementation modulates T-bet and interferon gamma gene expression in multiple sclerosis patients. Journal of Molecular Neuroscience 2016;59(3):360-5. [PMID: 27122150] [DOI] [PubMed] [Google Scholar]
Saboor‐Yaraghi 2015 {published data only}
- Saboor-Yaraghi A, Harirchian M, Mohammadzadeh HN, Bitarafan S, Abdolahi M, Siassi F, et al. The effect of vitamin A supplementation on FoxP3 and TGF-β gene expression in avonex-treated multiple sclerosis patients. Journal of Molecular Neuroscience 2015;56(3):608-12. [PMID: ] [DOI] [PubMed] [Google Scholar]
Salari 2015 {published data only}
- Salari S, Khomand P, Arasteh M, Yousefzamani B, Hassamzadeh K. Zinc sulphate: A reasonable choice for depression management in patients with multiple sclerosis: A randomized, double-blind, placebo-controlled clinical trial. Pharmacological Reports 2015;67(3):606-9. [PMID: ] [DOI] [PubMed] [Google Scholar]
Saresella 2017 {published data only}
- Saresella M, Mendozzi L, Rossi V, Mazzali F, Piancone F, LaRosa F, et al. Immunological and clinical effect of diet modulation of the gut microbiome in multiple sclerosis patients: A pilot study. Frontiers in Immunology 2017;8:1391. [PMID: ] [DOI] [PMC free article] [PubMed] [Google Scholar]
Schultz 1984 {published data only}
- Schultz A. Efficacy of cranberry juice and ascorbic acid in acidifying the urine in multiple sclerosis subjects. Journal of Community Health Nursing 1984;1(3):159-69. [PMID: ] [DOI] [PubMed] [Google Scholar]
Shinto 2008 {published data only}
- Shinto L, Calabrese C, Morris C, Yadav V, Griffith D, Frank R, et al. A randomized pilot study of naturopathic medicine in multiple sclerosis. Journal of Alternative and Complementary Medicine 2008;14(5):489-96. [PMID: ] [DOI] [PMC free article] [PubMed] [Google Scholar]
Simpson 1985 {published data only}
- Simpson L, Shand B, Olds R. Dietary supplementation with Efamol and multiple sclerosis. New Zealand Medical Journal 1985;98:1053. [PubMed] [Google Scholar]
Skakonik 1963 {published data only}
- Skakonik W, Eisner M. Trials in the treatment of multiple sclerosis with diabetol associated with diets poor in carbohydrates. Annales Academiae Medicae Stetinensis 1963;9:267-70. [PubMed] [Google Scholar]
Spitsin 2010 {published data only}
- Spitsin S, Markowitz C, Zimmerman V, Koprowski H, Hooper D. Modulation of serum uric acid levels by inosine in patients with multiple sclerosis does not affect blood pressure. Journal of Human Hypertension 2010;24(5):359-62. [PMID: ] [DOI] [PubMed] [Google Scholar]
Swank 1990 {published data only}
- Swank RL, Bourdillon RB. Multiple sclerosis: assessment of treatment with a modified low-fat diet. Journal of Nervous and Mental Disease 1960;131:468-88. [PMID: ] [PubMed] [Google Scholar]
- *.Swank RL, Dugan BB. Effect of low saturated fat diet in early and late cases of multiple sclerosis. Lancet 1990;336(8706):37-9. [PMID: ] [DOI] [PubMed] [Google Scholar]
- Swank RL, Goodwin J. Review of MS patient survival on a Swank low saturated fat diet. Nutrition 2003;19(2):161-2. [PMID: ] [DOI] [PubMed] [Google Scholar]
- Swank RL, Grimsgaard A. Multiple sclerosis: the lipid relationship. American Journal of Clinical Nutrition 1988;48(6):1387-93. [PMID: ] [DOI] [PubMed] [Google Scholar]
- Swank RL. Multiple sclerosis: Fat-oil relationship. Nutrition 1991;7(5):368-76. [PMID: ] [PubMed] [Google Scholar]
- Swank RL. Multiple sclerosis: Twenty years on low fat diet. Archives of Neurology 1970;23(5):460-74. [PMID: ] [DOI] [PubMed] [Google Scholar]
- Swank RL. Treatment of multiple sclerosis with a low-fat diet. Journal of the American Dietetic Association 1960;36:322-5. [PMID: ] [PubMed] [Google Scholar]
- Swank RL. Treatment of multiple sclerosis with low-fat diet. AMA Archives of Neurology and Psychiatry 1953;69(1):91-103. [PMID: ] [DOI] [PubMed] [Google Scholar]
- Swank RL. Treatment of multiple sclerosis with low-fat diet: Result of seven years' experience. Annals of Internal Medicine 1956;45(5):812-24. [PMID: ] [DOI] [PubMed] [Google Scholar]
- Swank RL. Treatment of multiple sclerosis with low-fat diet; results of five and one-half years' experience. AMA Archives of Neurology and Psychiatry 1955;73(6):631-44. [PMID: ] [DOI] [PubMed] [Google Scholar]
- Wilmot VA, Swank RL. The influence of low-fat diet on blood lipid levels in health and in multiple sclerosis. American Journal of the Medical Sciences 1952;223(1):25-34. [PMID: ] [DOI] [PubMed] [Google Scholar]
Tamtaji 2017 {published data only}
- Tamtaji O, Kouchaki E, Salami M, Aghadavod E, Akbari E, Tajabadi-Ebrahimi M, et al. The effects of probiotic supplementation on gene expression related to inflammation, insulin, and lipids in patients with multiple sclerosis: A randomized, double-blind, placebo-controlled trial. Journal of the American College of Nutrition 2017;36(8):660-5. [PMID: 28922099] [DOI] [PubMed] [Google Scholar]
Toncev 2006 {published data only}
- Toncev G. Therapeutic value of serum uric acid levels increasing in the treatment of multiple sclerosis. Vojnosanitetski Pregled 2006;63(10):879-82. [PMID: ] [DOI] [PubMed] [Google Scholar]
Tran 2018 {published data only}
- Tran J, Hartung J, Tompkins CA, Frohna P. Effects of high-and low-fat meals on the pharmacokinetics of ozanimod, a novel sphingosine 1-phosphate receptor modulator. Multiple Sclerosis Journal 2016;22(S3):374. [DOI] [PMC free article] [PubMed] [Google Scholar]
- *.Tran JQ, Hartung JP, Tompkins CA, Frohna PA. Effects of high- and low-fat meals on the pharmacokinetics of ozanimod, a novel sphingosine-1-phosphate receptor modulator. Clinical Pharmacology in Drug Development 2018;7(6):634-40. [PMID: ] [DOI] [PMC free article] [PubMed] [Google Scholar]
van Rensburg 2006 {published data only}
- Rensburg SJ, Kotze MJ, Hon D, Haug P, Kuyler J, Hendricks M, et al. Iron and the folate-vitamin B12-methylation pathway in multiple sclerosis. Metabolic Brain Disease 2006;21(2-3):121-37. [PMID: ] [DOI] [PubMed] [Google Scholar]
Wade 2002 {published data only}
- Wade DT, Young CA, Chaudhuri KR, Davidson DL. A randomised placebo controlled exploratory study of vitamin B12, lofepramine, and L-phenylalanine (the "Cari Loder regime") in the treatment of multiple sclerosis. Journal of Neurology, Neurosurgery, and Psychiatry 2002;73(3):246-9. [PMID: ] [DOI] [PMC free article] [PubMed] [Google Scholar]
References to studies awaiting assessment
Bock 2015 {published data only}
- Bock M, Michaelsen A, Paul F. Ketogenic diet and prolonged fasting improve health related quality of life and blood lipid profile in multiple sclerosis - A randomized controlled trial. Multiple Sclerosis Journal 2015;21(S11):794-5. [Google Scholar]
Kanter 2014 {published data only}
- Kanter J, Keiner E, Biwer A, Coughlin E, DiFabio B, Salmasinia D, et al. A double-blind placebo controlled study of the effect of beta-alanine, a nonessential amino-acid, on neurologic, motor function, quality of life, and fatigue in patients diagnosed with multiple sclerosis. Neurology 2014;82(10 Suppl 1):P7.253. [Google Scholar]
Khalili 2017 {published data only}
- Khalili M, Soltani M, Moghadam SA, Dehghan P, Azimi A, Abbaszadeh O. Effect of alpha-lipoic acid on asymmetric dimethylarginine and disability in multiple sclerosis patients: A randomized clinical trial. Electronic Physician 2017;9(7):4899-905. [PMID: ] [DOI] [PMC free article] [PubMed] [Google Scholar]
Loy 2018 {published data only}
- Loy BD, Fling BW, Horak FB, Bourdette DN, Spain RI. Effects of lipoic acid on walking performance, gait, and balance in secondary progressive multiple sclerosis. Complementary Therapies in Medicine 2018;41:169-74. [PMID: ] [DOI] [PMC free article] [PubMed] [Google Scholar]
Shah 2007 {published data only}
- Shah PS, O'Riordan JI, Gold L, Houston G, Donnan P. The role of diet in early relapsing remitting multiple sclerosis - A randomised controlled single-blind pilot study (ongoing clinical trial). European Journal of Neurology 2007;14:287-8. [Google Scholar]
Tourbah 2018 {published data only}
- Tourbah A, Arndt C, Vighetto A, Deburghgraeve V, Pelletier J, Papeix C, et al. Effect of MD1003 (high doses of biotin) in chronic visual loss related to optic neuritis in multiple sclerosis (MS-ON): Results of a pivotal randomized double masked placebo controlled study [abstract]. Neurology 2016;86(S16):S49.005. [Google Scholar]
- *.Tourbah A, Gout O, Vighetto A, Deburghgraeve V, Pelletier J, Papeix C, et al. MD1003 (high-dose pharmaceutical-grade Biotin) for the treatment of chronic visual loss related to optic neuritis in multiple sclerosis: a randomized, double-blind, placebo-controlled study. CNS Drugs 2018;32(7):661-72. [PMID: ] [DOI] [PMC free article] [PubMed] [Google Scholar]
References to ongoing studies
NCT01514370 {published data only}
- NCT01514370. Dietary supplement of curcumin in subjects with active relapsing multiple sclerosis treated with subcutaneous interferon Beta 1a. ClinicalTrials.gov/show/NCT01514370 (first received 23 January 2012).
NCT01848327 {published data only}
- NCT01848327. Caprylic triglyceride for treatment of cognitive impairments in multiple sclerosis. ClinicalTrials.gov/show/NCT01848327 (first received 7 May 2013).
NCT01915433 {published data only}
- NCT01915433. Wahls Paleo diet and progressive multiple sclerosis. ClinicalTrials.gov/show/NCT01915433 (first received 2 August 2013).
NCT02664623 {published data only}
- NCT02664623. Personalized nutrition advice for optimizing dietary calcium intake in MS patients. ClinicalTrials.gov/show/NCT02664623 (first received 27 January 2016).
NCT02914964 {published data only}
- NCT02914964. Dietary approaches to treat multiple sclerosis-related fatigue study. ClinicalTrials.gov/show/NCT02914964 (first received 26 September 2016).
NCT02936037 {published data only}
- NCT02936037. Effect of MD1003 in progressive multiple sclerosis (SPI2). ClinicalTrials.gov/show/NCT02936037 (first received 18 October 2016).
NCT02986893 {published data only}
- NCT02986893. Pilot diet study for multiple sclerosis. ClinicalTrials.gov/show/NCT02986893 (first received 8 December 2016).
NCT03322982 {published data only}
- NCT03322982. Low fat diet for fatigue in MS. ClinicalTrials.gov/show/NCT03322982 (first received 26 October 2017).
NCT03387046 {published data only}
- NCT03387046. A pilot study in subjects with relapsing remitting multiple sclerosis (RR-MS). ClinicalTrials.gov/show/NCT03387046 (first received 29 December 2017).
NCT03508414 {published data only}
- NCT03508414. Nutritional approaches in multiple sclerosis. ClinicalTrials.gov/show/NCT03508414 (first received 25 April 2018).
Additional references
Adamczyk 2016
- Adamczyk B, Adamczyk-Sowa M. New insights into the role of oxidative stress mechanisms in the pathophysiology and treatment of multiple sclerosis. Oxidative medicine and cellular longevity 2016 Oct 18 [Epub ahead of print]. [PMID: ] [DOI] [PMC free article] [PubMed]
AlAmmar 2019
Altowaijri 2017
- Altowaijri G, Fryman A, Yadav V. Dietary interventions and multiple sclerosis. Current Neurology and Neuroscience Reports 2017;17(3):28. [PMID: ] [DOI] [PubMed] [Google Scholar]
Atkins 2004
- Atkins D, Best D, Briss PA, Eccles M, Falck-Ytter Y, Flottorp S, et al. Grading quality of evidence and strength of recommendations. BMJ 2004;328(7454):1490. [PMID: ] [DOI] [PMC free article] [PubMed] [Google Scholar]
Atlas of MS 2013
- Atlas of MS 2013: Mapping multiple sclerosis around the world. www.msif.org/resources (accessed 4 March 2018).
Bagur 2017
- Bagur MJ, Murcia MA, Jiménez-Monreal AM, Tur JA, Bibiloni MM, Alonso GL, et al. Influence of diet in multiple sclerosis: A systematic review. Advances in Nutrition 2017;8(3):463-72. [PMID: ] [DOI] [PMC free article] [PubMed] [Google Scholar]
Bar‐Or 2010
- Bar-Or A, Fawaz L, Fan B, Darlington PJ, Rieger A, Ghorayeb C, et al. Abnormal B-cell cytokine responses a trigger of T-cell-mediated disease in MS? Annals of Neurology 2010;67(4):452-61. [PMID: ] [DOI] [PubMed] [Google Scholar]
Bjornevik 2017
- Bjornevik K, Chitnis T, Ascherio A, Munger KL. Polyunsaturated fatty acids and the risk of multiple sclerosis. Multiple Sclerosis Journal 2017;23(14):1830-8. [PMID: ] [DOI] [PMC free article] [PubMed] [Google Scholar]
Boringa 2001
- Boringa JB, Lazeron RH, Reuling IE, Adèr HJ, Pfennings L, Lindeboom J, et al. The brief repeatable battery of neuropsychological tests: Normative values allow application in multiple sclerosis clinical practice. Multiple Sclerosis 2001;7(4):263-7. [PMID: ] [DOI] [PubMed] [Google Scholar]
Bowling 2003
- Bowling AC, Stewart TM. Current complementary and alternative therapies for multiple sclerosis. Current Treatment Options in Neurology 2003;5(1):55-68. [PMID: ] [DOI] [PubMed] [Google Scholar]
Brazier 1992
- Brazier JE, Harper R, Jones NM, O'Cathain A, Thomas KJ, Usherwood T, et al. Validating the SF-36 health survey questionnaire: New outcome measure for primary care. BMJ 1992;305(6846):160-4. [PMID: ] [DOI] [PMC free article] [PubMed] [Google Scholar]
Claflin 2018
- Claflin SB, Mei IA, Taylor BV. Complementary and alternative treatments of multiple sclerosis: A review of the evidence from 2001 to 2016. Journal of Neurology, Neurosurgery, and Psychiatry 2018;89(1):34-41. [PMID: ] [DOI] [PubMed] [Google Scholar]
Cohen 2012
- Cohen JA, Reingold SC, Polman CH, Wolinsky JS. Disability outcome measures in multiple sclerosis clinical trials: Current status and future prospects. Lancet Neurology 2012;11(5):467-76. [PMID: ] [DOI] [PubMed] [Google Scholar]
Covidence [Computer program]
- Covidence. Melbourne, Australia: Veritas Health Innovation, Version accessed 5 February 2018.Available at covidence.org.
Cree 2016
- Cree BA, Gourraud PA, Oksenberg JR, Bevan C, Crabtree-Hartman E, Gelfand JM, et al, University of California, San Francisco MS-EPIC Team. Long-term evolution of multiple sclerosis disability in the treatment era. Annals of Neurology 2016;80(4):499-510. [PMID: ] [DOI] [PMC free article] [PubMed] [Google Scholar]
Dardiotis 2017
- Dardiotis E, Arseniou S, Sokratous M, Tsouris Z, Siokas V, Mentis AA, et al. Vitamin B12, folate, and homocysteine levels and multiple sclerosis: A meta-analysis. Multiple Sclerosis and Related Disorders 2017;17:190-7. [PMID: ] [DOI] [PubMed] [Google Scholar]
Deeks 2017
- Deeks JJ, Higgins JP, Altman DG, editor(s). Chapter 9: Analysing data and undertaking meta-analyses. In: Higgins JP, Green S, editor(s). Cochrane Handbook for Systematic Reviews of Interventions Version 5.1.0 (updated March 2011). The Cochrane Collaboration, 2011. Available from handbook.cochrane.org.
Egger 1997
- Egger M, Smith GD, Phillips AN. Meta-analysis: Principles and procedures. BMJ 1997;315(7121):1533-7. [PMID: ] [DOI] [PMC free article] [PubMed] [Google Scholar]
Esposito 2018
- Esposito S, Bonavita S, Sparaco M, Gallo A, Tedeschi G. The role of diet in multiple sclerosis: A review. Nutritional Neuroscience 2018;21(6):377-90. [PMID: ] [DOI] [PubMed] [Google Scholar]
Estruch 2013
- Estruch R, Ros E, Salas-Salvadó J, Covas MI, Corella D, Arós F, et al. Primary prevention of cardiovascular disease with a Mediterranean diet. New England Journal of Medicine 2013;368(14):1279-90. [PMID: ] [DOI] [PubMed] [Google Scholar]
Fisk 1994
- Fisk JD, Ritvo PG, Ross L, Haase DA, Marrie TJ, Schlech WF. Measuring the functional impact of fatigue: Initial validation of the fatigue impact scale. Clinical Infectious Diseases 1994;18(S1):S79-S83. [PMID: ] [DOI] [PubMed] [Google Scholar]
Giovannoni 2018
- Giovannoni G, Soelberg Sorensen P, Cook S, Rammohan K, Rieckmann P, Comi G, et al. Safety and efficacy of cladribine tablets in patients with relapsing-remitting multiple sclerosis: Results from the randomized extension trial of the CLARITY study. Multiple Sclerosis Journal 2018;24(12):1594-1604. [PMID: ] [DOI] [PubMed] [Google Scholar]
GRADEpro GDT [Computer program]
- GRADEpro GDT. Hamilton (ON): McMaster University (developed by Evidence Prime), 2015.Available at gradepro.org.
Hauser 2017
- Hauser SL, Bar-Or A, Comi G, Giovannoni G, Hartung HP, Hemmer B, et al. Ocrelizumab versus interferon beta-1a in relapsing multiple sclerosis. New England Journal of Medicine 2017;376(3):221-34. [PMID: ] [DOI] [PubMed] [Google Scholar]
Higgins 2011
- Higgins JP, Altman DG, Sterne JA, editor(s). Chapter 8: Assessing risk of bias in included studies. In: Higgins JP, Green S, editor(s). Cochrane Handbook for Systematic Reviews of Interventions Version 5.1.0 (updated March 2011). The Cochrane Collaboration, 2011. Available from handbook.cochrane.org.
Jagannath 2018
- Jagannath VA, Filippini G, Di Pietrantonj, Asokan GV, Robak EW, Whamond L, et al. Vitamin D for the management of multiple sclerosis. Cochrane Database of Systematic Reviews 2018, Issue 9. [DOI: 10.1002/14651858.CD008422.pub3] [DOI] [PMC free article] [PubMed] [Google Scholar]
Kamm 2014
- Kamm CP, Uitdehaag BM, Polman CH. Multiple sclerosis: Current knowledge and future outlook. European Neurology 2014;72(3-4):132-41. [PMID: ] [DOI] [PubMed] [Google Scholar]
Krupp 1989
- Krupp LB, LaRocca NG, Muir-Nash J, Steinberg AD. The fatigue severity scale. Application to patients with multiple sclerosis and systemic lupus erythematosus. Archives of Neurology 1989;46(10):1121-3. [PMID: ] [DOI] [PubMed] [Google Scholar]
Kurtzke 1983
- Kurtzke JF. Rating neurological impairment in multiple sclerosis: An expanded disability status scale (EDSS). Neurology 1983;33(11):1444-5. [PMID: ] [DOI] [PubMed] [Google Scholar]
Leong 2009
- Leong EM, Semple SJ, Angley M, Siebert W, Petkov J, McKinnon RA. Complementary and alternative medicines and dietary interventions in multiple sclerosis: What is being used in South Australia and why? Complementary Therapies in Medicine 2009;17:216-23. [PMID: ] [DOI] [PubMed] [Google Scholar]
Lublin 1996
- Lublin FD, Reingold SC. Defining the clinical course of multiple sclerosis: Results of an international survey. National Multiple Sclerosis Society (USA) Advisory Committee on Clinical Trials of New Agents in Multiple Sclerosis. Neurology 1996;46(4):907-11. [PMID: ] [DOI] [PubMed] [Google Scholar]
Lublin 2014
- Lublin FD, Reingold SC, Cohen JA, Cutter GR, Sørensen PS, Thompson AJ, et al. Defining the clinical course of multiple sclerosis: the 2013 revisions. Neurology 2014;83(3):278-86. [PMID: ] [DOI] [PMC free article] [PubMed] [Google Scholar]
Lucchinetti 2005
- Lucchinetti CF, Parisi J, Bruck W. The pathology of multiple sclerosis. Neurologic Clinics 2005;23(1):77-105. [PMID: ] [DOI] [PubMed] [Google Scholar]
Marrie 2010
- Marrie RA, Rudick R, Horwitz R, Cutter G, Tyry T, Campagnolo D, et al. Vascular comorbidity is associated with more rapid disability progression in multiple sclerosis. Neurology 2010;74(13):1041-7. [PMID: ] [DOI] [PMC free article] [PubMed] [Google Scholar]
McDonald 1977
- McDonald WI, Halliday AM. Diagnosis and classification of multiple sclerosis. British Medical Bulletin 1977;33(1):4-9. [PMID: ] [PubMed] [Google Scholar]
McDonald 2001
- McDonald WI, Compston A, Edan G, Goodkin D, Hartung HP, Lublin FD, et al. Recommended diagnostic criteria for MS: Guidelines from the International Panel on the diagnosis of multiple sclerosis. Annals of Neurology 2001;50(1):121-7. [PMID: ] [DOI] [PubMed] [Google Scholar]
Mehta 2009
- Mehta LR, Dworkin RH, Schwid SV. Polyunsaturated fatty acids and their potential therapeutic role in multiple sclerosis. Nature Clinical Practice Neurology 2009;5:82-92. [PMID: ] [DOI] [PubMed] [Google Scholar]
Millar 1967
- Millar JH, Vas CJ, Noronha MJ, Liversedge LA, Rawson MD. Long-term treatment of multiple sclerosis with corticotrophin. Lancet 1967;2(7513):429-31. [PMID: ] [DOI] [PubMed] [Google Scholar]
Montalban 2017
- Montalban X, Hauser SL, Kappos L, Arnold DL, Bar-Or A, Comi G, et al. Ocrelizumab versus placebo in primary progressive multiple sclerosis. New England Journal of Medicine 2017;376(3):209-20. [PMID: ] [DOI] [PubMed] [Google Scholar]
Namaka 2008
- Namaka M, Crook A, Doupe A, Kler K, Vasconcelos M, Klowak M, et al. Examining the evidence: Complementary adjunctive therapies for multiple sclerosis. Neurological Research 2008;30(7):710-19. [PMID: ] [DOI] [PubMed] [Google Scholar]
Noseworthy 2000
- Noseworthy JH, Lucchinetti C, Rodriguez M, Weinshenker BG. Multiple sclerosis. New England Journal of Medicine 2000;343(13):938-52. [PMID: ] [DOI] [PubMed] [Google Scholar]
O'Connor 2012
- O’Connor K, Weinstock-Guttman B, Carl E, Kilanowski C, Zivadinov R, Ramanathan M. Patterns of dietary and herbal supplement use by multiple sclerosis patients. Journal of Neurology 2012;259:637-44. [PMID: ] [DOI] [PubMed] [Google Scholar]
Payne 2001
- Payne A. Nutrition and diet in the clinical management of multiple sclerosis. Journal of Human Nutrition and Dietetics 2001;14(5):349-57. [PMID: ] [DOI] [PubMed] [Google Scholar]
Polman 2005
- Polman CH, Reingold SC, Edan G, Filippi M, Hartung HP, Kappos L, et al. Diagnostic criteria for multiple sclerosis: 2005 revisions to the "McDonald Criteria". Annals of Neurology 2005;58(6):840-6. [PMID: ] [DOI] [PubMed] [Google Scholar]
Polman 2011
- Polman CH, Reingold SC, Banwell B, Clanet M, Cohen JA, Filippi M, et al. Diagnostic criteria for multiple sclerosis: 2010 revisions to the McDonald criteria. Annals of Neurology 2011;69(2):292-302. [PMID: ] [DOI] [PMC free article] [PubMed] [Google Scholar]
Poser 1983
- Poser CM, Paty DW, Scheinberg L, McDonald WI, Davis FA, Ebers GC, et al. New diagnostic criteria for multiple sclerosis: Guidelines for research protocols. Annals of Neurology 1983;13(3):227-31. [PMID: ] [DOI] [PubMed] [Google Scholar]
Pucci 2004
- Pucci E, Cartechini E, Taus C, Giuliani G. Why physicians need to look more closely at the use of complementary and alternative medicine by multiple sclerosis patients. European Journal of Neurology 2004;11:263-7. [PMID: ] [DOI] [PubMed] [Google Scholar]
Review Manager 2014 [Computer program]
- Review Manager 5 (RevMan 5). Version 5.4. Copenhagen: Nordic Cochrane Centre, The Cochrane Collaboration, 2014.
Reynolds 2006
- Reynolds E. Vitamin B12, folic acid, and the nervous system. Lancet Neurology 2006;5(11):949-60. [PMID: ] [DOI] [PubMed] [Google Scholar]
Schumacher 1965
- Schumacher GA, Beede GW, Kibler RF, Kurland LT, Kurtzke JF, McDowell F, et al. Problems of experimental trials of therapy in multiple sclerosis: Report by the panel of evaluation of experimental trials in multiple sclerosis. Annals of the New York Academy of Sciences 1965;122:552-68. [PMID: ] [DOI] [PubMed] [Google Scholar]
Schwarz 2005
- Schwarz S, Leweling H. Multiple sclerosis and nutrition. Multiple Sclerosis 2005;11(1):24-32. [PMID: ] [DOI] [PubMed] [Google Scholar]
Swank 2003a
- Swank RL, Goodwin J. Review of MS patient survival on a swank low saturated fat diet. Nutrition 2003;19(2):161-2. [PMID: ] [DOI] [PubMed] [Google Scholar]
Swank 2003b
- Swank RL, Goodwin JW. How saturated fats may be a causative factor in multiple sclerosis and other diseases. Nutrition 2003;19(5):478. [PMID: ] [DOI] [PubMed] [Google Scholar]
Thompson 2018
- Thompson AJ, Banwell BL, Barkhof F, Carroll WM, Coetzee T, Comi G, et al. Diagnosis of multiple sclerosis: 2017 revisions of the McDonald criteria. Lancet Neurology 2018;17(2):162-73. [PMID: ] [DOI] [PubMed] [Google Scholar]
Tombaugh 2006
- Tombaugh TN. A comprehensive review of the Paced Auditory Serial Addition Test (PASAT). Arch Clin Neuropsychol 2006;21(1):53-76. [PMID: ] [DOI] [PubMed] [Google Scholar]
Torkildsen 2016
- Torkildsen O, Myhr KM, Bo L. Disease-modifying treatments for multiple sclerosis - a review of approved medications. European Journal of Neurology 2016;23(S1):18-27. [PMID: ] [DOI] [PMC free article] [PubMed] [Google Scholar]
Trojano 2011
- Trojano M, Paolicelli D, Tortorella C, Iaffaldano P, Lucchese G, Di Renzo V, et al. Natural history of multiple sclerosis: Have available therapies impacted long-term prognosis? Neurologic Clinics 2011;29(2):309-21. [PMID: ] [DOI] [PubMed] [Google Scholar]
Vickrey 1995
- Vickrey BG, Hays RD, Harooni R, Myers W, Ellison GW. A health-related quality of life measure for multiple sclerosis. Quality of Life Research 1995;4(3):187-206. [PMID: ] [DOI] [PubMed] [Google Scholar]
Yadav 2010
- Yadav V, Shinto L, Bourdette D. Complementary and alternative medicine for the treatment of multiple sclerosis. Expert Review of Clinical Immunology 2010;6(3):381-95. [PMID: ] [DOI] [PMC free article] [PubMed] [Google Scholar]
Yadav 2014
- Yadav V, Bever C Jr, Bowen J, Bowling A, Weinstock-Guttman B, Cameron M, et al. Summary of evidence-based guideline: Complementary and alternative medicine in multiple sclerosis. Neurology 2014;82(12):1083-92. [PMID: ] [DOI] [PMC free article] [PubMed] [Google Scholar]
Ziemssen 2016
- Ziemssen T, Derfuss T, Stefano N, Giovannoni G, Palavra F, Tomic D, et al. Optimizing treatment success in multiple sclerosis. Journal of Neurology 2016;263(6):1053-65. [PMID: ] [DOI] [PMC free article] [PubMed] [Google Scholar]
References to other published versions of this review
Farinotti 2003
- Farinotti M, Simi S, Confalonieri P, Lupo D, Thornton N, Brait L. Dietary interventions for multiple sclerosis (Protocol). Cochrane Database of Systematic Reviews 2003, Issue 2. [DOI: 10.1002/14651858.CD004192] [DOI] [PubMed] [Google Scholar]
Farinotti 2007
- Farinotti M, Simi S, Di Pietrantonj C, McDowell N, Brait L, Lupo D, et al. Dietary interventions for multiple sclerosis. Cochrane Database of Systematic Reviews 2007, Issue 1. [DOI: 10.1002/14651858.CD004192] [DOI] [PubMed] [Google Scholar]
Farinotti 2012
- Farinotti M, Vacchi L, Simi S, Di Pietrantonj C, Brait L, Filippini G. Dietary interventions for multiple sclerosis. Cochrane Database of Systematic Reviews 2012, Issue 12. [DOI: 10.1002/14651858.CD004192.pub3] [DOI] [PubMed] [Google Scholar]