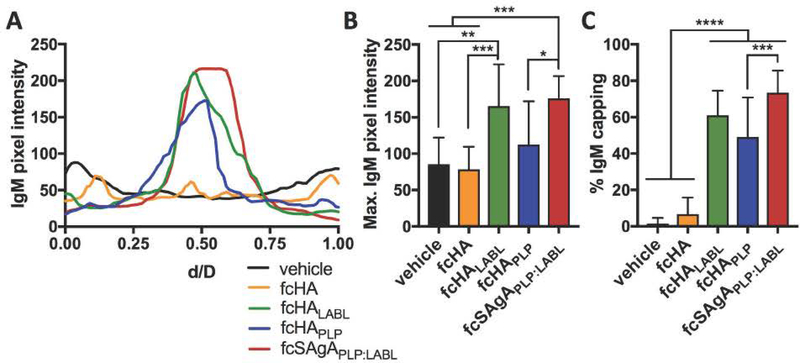
Figure 7.
Quantification of BCR clustering in Raji B cells following perfusion of vehicle, fcHA, fcHALABL, cHAPLP, or fcSAgAPLP:LABL in the microfluidics plate. (A) Representative cell profile plots of IgM pixel intensity relative to normalized cell diameter, d/D. (B) Maximum IgM pixel intensity per cell determined from profile plots of individual cells (n=40). (C) Percent of cells positive for IgM capping (fully coalesced IgM clustering) determined using otsu thresholding (n=100–250 cells per sample). Statistical significance was determined by ANOVA followed by Tukey’s post hoc test with p<0.05 (*p<0.05, **p<0.01, ***p<0.001, ****p<0.0001). Mean+ SD shown. Images were captured using the M04S plate and CellASIC Onyx Microfluidics platform on an Olympus IX81 inverted Epifluorescence microscope and analyzed in ImageJ.

