

Abstract
Rationale:
Pairing rewarding outcomes with audiovisual cues in simulated gambling games increases risky choice in both humans and rats. However, the cognitive mechanism through which this sensory enhancement biases decision making is unknown.
Objectives:
To assess the computational mechanisms that promote risky choice during gambling, we applied a series of reinforcement learning models to a large dataset of choices acquired from rats as they each performed one of two variants of a rat gambling task (rGT), in which rewards on ‘win’ trials were delivered either with or without salient audiovisual cues.
Methods:
We used a sampling technique based on Markov Chain Monte Carlo to obtain posterior estimates of model parameters for a series of RL models of increasing complexity, in order to assess the relative contribution of learning about positive and negative outcomes to the latent valuation of each choice option on the cued and uncued rGT.
Results:
Rats which develop a preference for the risky options on the rGT substantially down-weight the equivalent cost of the time-out punishments during these tasks. For each model tested, the reduction in learning from the negative time-outs correlated with the degree of risk-preference in individual rats. We found no apparent relationship between risk-preference and the parameters that govern learning from the positive rewards.
Conclusions:
The emergence of risk-preferring choice on the rGT derives from a relative insensitivity to the cost of the time-out punishments, as opposed to a relative hypersensitivity to rewards. This hyposensitivity to punishment is more likely to be induced in individual rats by the addition of salient audiovisual cues to rewards delivered on win trials.
Keywords: Decision making, reward, gambling, risk, individual differences, computational modeling
Introduction
Whether designing smartphone apps to keep us engaged, or electronic gambling machines (EGMs) to profit the casino, game designers make frequent use of sound and light stimuli to signal rewarding outcomes (Alter, 2017; Dow Schull, 2014). Such an approach may seem like a superficially harmless way to maintain players’ attention and interest. However, recent data show unequivocally that the addition of such audiovisual reward-paired cues to simulated gambling games can increase risky decision making (Barrus and Winstanley, 2016; Cherkasova et al., 2018). This effect was documented both in humans playing a two-choice lottery task, and in rats performing the rat gambling task (rGT), a gambling-like paradigm in which they must avoid options paired with larger per trial gains but disproportionately long time-out punishments in order to maximize sugar pellet profits.
Gambling on EGMs is consistently reported as one of the most problematic forms of gambling for those with gambling disorder (GD) (Breen and Zimmerman, 2002; Dowling et al., 2005; Griffiths et al., 1999), and GD is highly comorbid with drug use and dependency (Petry, 2000; Petry et al., 2005). Risky decision making is also predictive of greater severity and poor treatment response in substance use disorder (Bechara et al., 2001; Gonzalez et al., 2015; Stevens et al., 2013, 2015). Basal extracellular dopamine levels are lower on average in the nucleus accumbens of rats trained on the cued rGT, as compared to those trained in the absence of win-paired cues, in addition to exhibiting either enhanced risky decision making following cocaine self-administration, or greater levels of cocaine intake (Ferland et al., 2019). Understanding the mechanism through which sensory enhancement of wins can promote risky choice could therefore provide valuable insight into the neurocognitive basis of addiction vulnerability.
The incentive sensitization theory of addiction predicts that dependence develops in those for whom drug-paired cues dominate motivation, and that sensitivity to reward-paired cues in general represents a vulnerability factor for substance use disorder (Berridge and Robinson, 1998; Flagel et al., 2009, 2010, 2011; Meyer et al., 2012). Recent work has extended this idea to other addictions (Limbrick-Oldfield et al., 2017; Robinson et al., 2016; Rømer Thomsen et al., 2014). In support of this general hypothesis, animals which preferentially approach a conditioned stimulus (CS) associated with reward (“sign-tracking”) exhibit a range of neurobiological and behavioural changes associated with addiction (Saunders and Robinson, 2013). Such behavior is thought to reflect the enhanced attribution of incentive salience- a motivational drive- to reward-associated cues. Following this line of reasoning, increased risky choice on the cued rGT may therefore result from enhanced incentive motivation for cue-paired rewards.
Experimental data collected to date provide little support for this hypothesis. Risky choice on the cued rGT is not associated with greater willingness to work for a CS (Ferland et al., 2019), although the absence of a significant correlation between these behavioural measures is far from definitive evidence that the addition of sensory cues to the rGT has not altered learning from rewards. When wins were paired with sensory cues in a two-choice lottery task, human subjects did not spend any longer gazing at reward magnitude information when deciding which of two gambles to take, and the enhanced preference for the most uncertain outcome caused by the cues did not scale with the size of the win as might be expected if the cues were amplifying reward value (Cherkasova et al., 2018). Instead, subjects spent significantly less time fixating on the pie charts which depicted the probability of winning or losing. Furthermore, pupillometry analyses during different phases of the task indicate that pupil dilation is greater during the decision-making phase of the subsequent trial following a win in both the cued and uncued versions, yet this effect was significantly more pronounced in the cued variant. Such data suggest that win-paired stimuli are not enhancing risky choice through value-based attentional capture or similar mechanisms (Anderson et al., 2011), but may instead alter some other aspect of outcome evaluation, such as the processing of potential losses.
Computational modeling of behavioural data, grounded in theories of reinforcement learning, can provide critical insight into the likely mechanism through which subjects are integrating rewarding versus punishing outcomes into the evaluation of different options in a decision space. Such models are strongest when based on large sample sizes, both in terms of the number of unique individuals, and the number of data points available per subject (Vu et al. 2018). We therefore modeled trial-by-trial choice data from 246 rats learning either the cued or uncued rGT, in order to extract the latent learning dynamics that best describe the total likelihood of the dataset. Our goals were to test whether the parameters that govern learning from rewards or punishments differed between the cued and uncued rGT, and between subjects that ultimately developed a risky or optimal decision making profile.
Methods
Subjects
Subjects were male Long Evans rats, either purchased from a commercial vendor (Charles River Laboratories, St. Constant, QC, Canada), or bred in-house. Rats were pair- or trio-housed in a climate-controlled colony room on a reverse 12 hours light-dark cycle (lights off 08.00; temperature 21°C). Rats were food restricted to 85% of their free feeding weight and maintained on 14 g of standard rat chow, plus the sugar pellets earned in the task (~5 g per day). Water was available ad libitum. Behavioural testing began at least one week following the start of food restriction. All housing conditions and testing procedures were in accordance with the guidelines of the Canadian Council on Animal Care, and all protocols were approved by the Animal Care Committee of the University of British Columbia.
Behavioral Data
Behavioural data was assembled from 14 projects completed from May 2012 to November 2018. All rats were experimentally naïve during task acquisition. Of these projects, 200 rats were trained on the classic (uncued) version of the rat Gambling Task (rGT), and 176 rats were trained on the cued version (crGT). Rats with missing data or otherwise erroneous or ambiguous coding of session data were excluded. This left a final count of 110 rats in the classic condition, and 136 rats in the cued condition. Behavioural testing took place in 32 standard five-hole operant conditioning chambers, each enclosed within a ventilated sound-attenuating cabinet (Med Associates Inc., St. Albans, VT, USA). These experimental chambers were configured similarly to those previously described (Cocker et al., 2012; Zeeb et al., 2010) and were controlled by software written in Med PC by CAW running on an IBM-compatible computer. Training sessions for each individual project occurred at a consistent time within the dark phase of the light-dark cycle, although the time of training differed considerably between projects.
Task training was consistent across all 14 projects. Rats were first habituated to the operant chambers in two daily 30-minute sessions, during which sucrose pellets were present in the nose-poke apertures and food magazine. Rats were then trained on a variant of the five-choice serial reaction time (5CSRT) task, in which rats were required to make a nose-poke response in one of the four apertures indicated by a 10 s stimulus light. A correct response was rewarded by the delivery of one sugar pellet to the food magazine. The location of the stimulus light varied between holes 1, 2, 4, and 5 during the session. Sessions lasted 30 minutes and consisted of approximately 100 trials. Rats were trained until they reached a criteria of ≥ 50 correct responses with ≥ 80% accuracy and ≤ 20% omissions.
A task schematic showing the trial structure of the uncued and cued rGT is provided in Figure 1 (Adams et al., 2017). During the 30-minute session, rats initiated a trial by making a nose-poke response within the illuminated food magazine. This response extinguished the traylight, and was followed by a five-second inter-trial interval (ITI). Any nosepoke response made at the five-hole array during the ITI was recorded as a premature response and punished by a five-second time-out period, during which the house light was illuminated and no trials could be initiated. Following the ITI, apertures 1, 2, 4, and 5 in the five-hole array were illuminated for 10 seconds. A lack of response after 10 seconds was recorded as an omission, at which point the food magazine was re-illuminated and rats could initiate a new trial. A nose-poke response within one of the illuminated apertures was either rewarded or punished according to that aperture’s reinforcement schedule. Probability of reward varied among options (0.9–0.4, P1–P4), as did reward size (1–4 sucrose pellets). Punishments were signalled by a light flashing at 0.5 Hz within the chosen aperture, signalling a time-out penalty which lasted for 5–40 seconds depending on the aperture selected. The cued rGT was identical in structure, except for the addition of 2-second compound tone/light cues that occurred concurrently with reward delivery (Barrus and Winstanley, 2016). Cue complexity and variability scaled with reward size, such that the P1 cue consisted of a single tone and illuminated aperture, whereas the P4 cue featured multiple tones and flashing aperture lights presented in four different patterns across rewarded trials. The task was designed such that the optimal strategy to earn the highest number of sucrose pellets during the 30-minute session would be to exclusively select the P2 option, due to the relatively high probability of reward (0.8) and short, infrequent time-out penalties (10 s, 0.2 probability). While options P3 and P4 provide higher per-trial gains of 3 or 4 sucrose pellets, the longer and more frequent time-out penalties associated with these options greatly reduces the occurrence of rewarded trials. Consistently selecting these options results in fewer sucrose pellets earned across the session and are therefore considered disadvantageous. The position of each option for both the uncued and cued rGT was counterbalanced across rats to mitigate potential side bias. Half the animals in each project were trained on version A (left to right arrangement: P1, P4, P2, P3) and the other half on version B (left to right arrangement: P4, P1, P3, P2).
Figure 1.
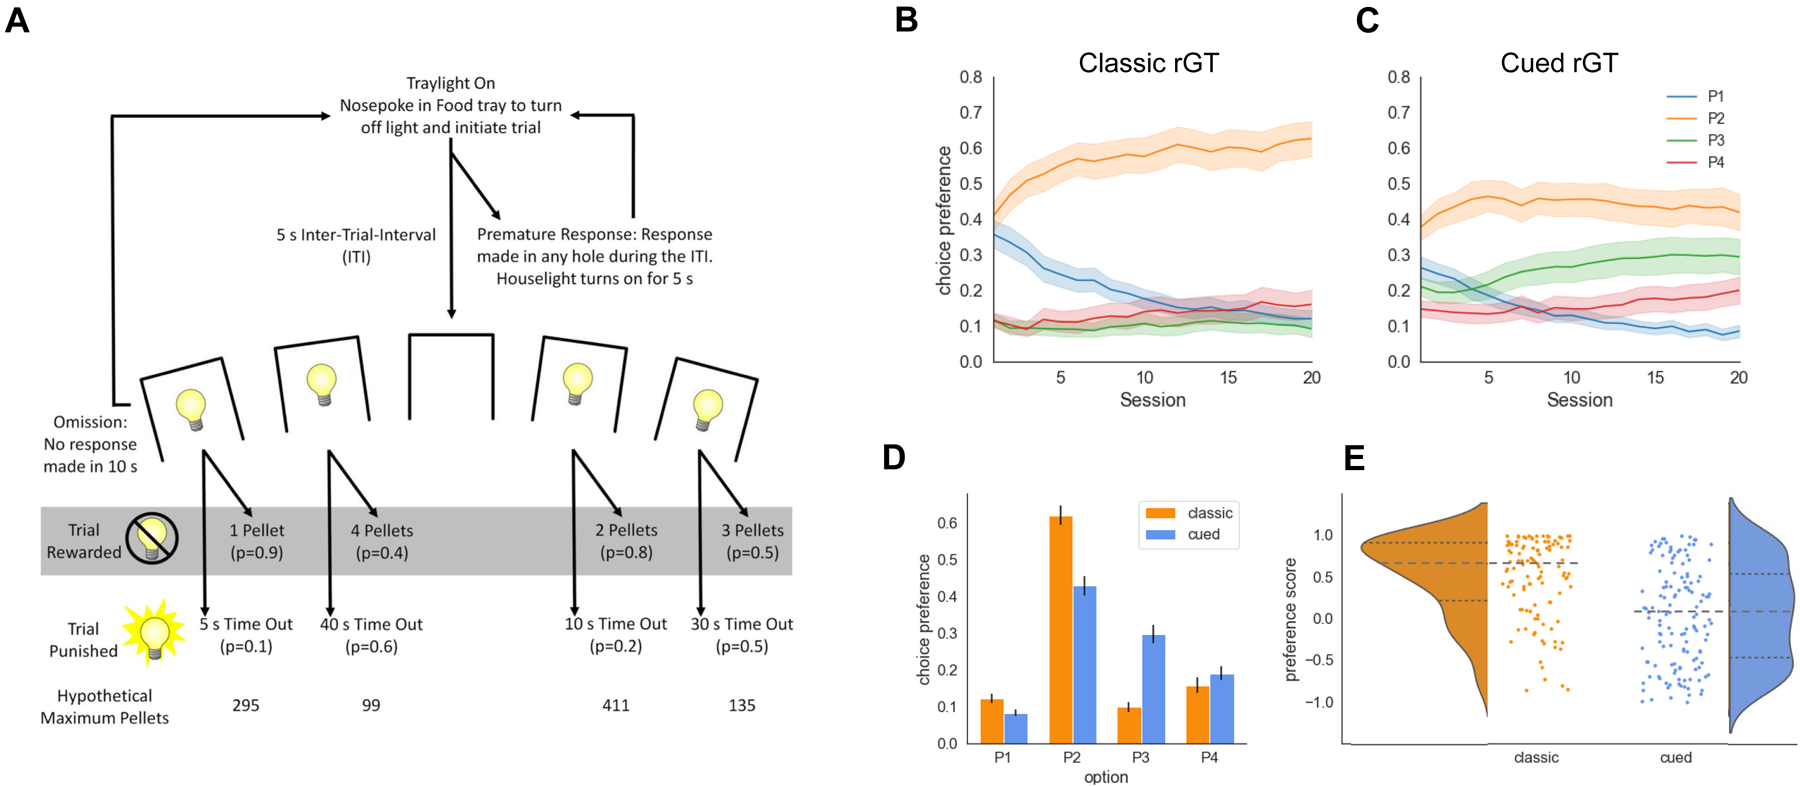
Task and behavioral results. A. Schematic of the (cued) rodent gambling task (rGT). B,C. Average choice preference across 20 sessions on the classic and cued versions of the rGT. Stable choice preference is established by session 20. D. Average choice preference across sessions 18–20 shows that the cued rGT elicits greater choice of option P3, and to a lesser degree, option P4, compared to the classic rGT. E. The distribution of individual preference scores (averaged per rat over sessions 18–20) shows the increased prevalence of risk-preferring rats (i.e. score < 0) in the group trained on the cued rGT. Dashed lines show the median and dotted tines are the upper and lower quartiles of each distribution.
Following training on the 5CSRT task, rats first completed 7 sessions of a forced-choice variant of the rGT, in which rats were presented with only one of the four options in each trial. This ensured that rats had equal exposure to each reinforcement contingency prior to training on the free-choice version of the program. Rats received 5–6 training sessions per week for all projects. The first 20 sessions are considered to be the acquisition phase of the task (Zeeb and Winstanley, 2011). During this phase, the majority of animals initially sample among the four different options before settling on a consistent choice preference. Following the 20th session of the free-choice variant of the task, animals generally exhibit a stable pattern of choice behaviour across sessions.
Behavioral choice preference
Choice data from each rat was concatenated into one long equivalent session. As per previous methods (Ferland et al., 2019; Zeeb and Winstanley, 2011), a preference score was calculated on average for sessions 18–20 by taking the difference in the fraction of choices (P1+P2)-(P3+P4). Rats with a positive preference score at this stage of training were classified as optimal, while rats with a negative preference score were classified as risk-preferring. Behavioral data was analyzed using the python packages pandas (for analysis and statistical tests) and seaborn (for visualization), including the seaborn function violinplot for calculating the Gaussian kernel density estimate of the distribution of individual choice preference scores in each group (as in Figure 1e).
Reinforcement learning models
To analyze different learning dynamics on each version of the rGT, we modeled trial-by-trial choice preference with a series of reinforcement learning models (RL; Sutton and Barto, 1998). Each of these models assume choice preference on every trial probabilistically follows a latent Q-value for each option, which is iteratively updated on each trial according to the experienced outcomes that follow a given choice. To focus model fitting on the evolution of choice preference during the learning phase, these models were fit to all valid choices on each trial from the first 5 sessions for all rats in each group. We chose to fit each model to the uncued and cued rGT groups separately to avoid the assumption that learning on each variant of the task is governed by the same underlying process, putatively captured by each RL model. Thus, we allowed for the possibility that different RL models might perform better at predicting choice for each of the task groups.
For each model, we assume the probability of choosing option Px on each trial follows the current learned Q-values for x= [1,2,3,4] according to a softmax decision rule:
where p(Px) is the probability of choosing option Px,Qx is the learned latent value of option x, and β is the inverse temperature parameter that controls how strongly choice follows the latent Q-values rather than a random (uniform) distribution over the four options. In each learning model, we assume learning of latent Q-values from positive outcomes follows a simple delta-rule update:
where η+ is a learning rate parameter that governs the step-size of the update and Rtr>0 is the number of pellets delivered on a given (positive-outcome only) trial and Qx is the latent value for the chosen option x on a given trial.
RL scaled punishment model (4 parameters):
In the simplest RL model, we assume that the equivalent punishment for a time-out interval on each negative-outcome trial scales linearly with the duration of the punishment:
where Ttr>0 is the experienced time-out duration in seconds on a given (negative-outcome only) trial and m is a scaling parameter that maps experienced duration into an equivalent cost in pellets (i.e. has units pellets/second). Time-out intervals that are indeed experienced as a negative outcome following from the choice of option Px imply m<0, though we do not place this constraint on m during model fitting.
RL scaled + offset punishment model (5 parameters):
Our second model incorporates an additional offset to the linear transform between experienced time-out duration and the equivalent cost of that outcome on a given trial:
Here, rather than constraining the linear transform between experienced duration and equivalent cost for a negative outcome following choice of option Px to be zero for zero duration, we model a nonzero intercept b, allowing a uniform cost (or benefit if b>0) to impact latent Q-values for all negative-outcome trials.
RL independent punishment model (7 parameters):
Finally, we model individual punishment weights for each outcome, allowing a nonlinear mapping between experienced time-out duration and the equivalent cost of that outcome on a given trial:
Here, the mapping between the experienced time-out duration on a given trial and the equivalent cost for that option is controlled independently by ωx for each option Px. As for the previous models, while ωx <0 implies the time-out duration associated with a given option is experienced as a cost, we do not assume this constraint when fitting these models.
For every model, Q-values were initialized at zero for the first session, and we assumed Q-values at the start of a subsequent session (on the next day for example) were the same as at the end of the previous session (i.e., we modeled no inter-session effects on learning). A second set of 3 RL models were also fit to the data following the definitions above and with the additional constraint η−= η+. These single learning rate RL models are marked with a star (*) affixed to the model name.
Hierarchical model fitting
To analyze individual differences in the evolution of choice preference on each version of the rGT, we fit a series of RL models separately to the aggregate group choice data on each of the uncued and cued rGT tasks. In short, each model was fit to the entire set of choices for all rats in each group (i.e., uncued or cued) using Hamiltonian Monte Carlo sampling with Stan to perform full Bayesian inference and return the posterior distribution of model parameters conditional on the data and the specification of the model (Carpenter et al., 2017). In each case, we partially pooled choice data across individual rats in a hierarchical model to simultaneously determine the distribution of individual- and group-level model parameters. This means we assumed individual parameters guiding learning for each rat were governed by a single (unimodal) group-level distribution, parameterized by mean and variance hyper-parameters for each individual-level parameter in the model definition; reliable differences between group-level parameter estimates are interpretable in light of the differences in the prevalence of optimal vs risk-preferring choice preferences in the uncued vs cued rGT groups. We implemented a noncentered parameterization (a.k.a. the “Matt trick”) for group-level β, η+ and η− in each model, as this has been shown to improve performance and reduce autocorrelation between these group-level parameters in hierarchical reinforcement learning models (Ahn et al., 2017).
Each model was fit with Stan using four chains with 1600 steps each (800 burn-in), yielding a total of 3200 posterior samples. To assess the convergence of the chains, we computed the statistic (Gelman et al., 2013), which measures the degree of variation between chains relative to the variation within chains. The Stan development team recommends as a rule of thumb that all parameters have statistics no greater than 1.1. Across all six models, no parameter had , and the mode was 1.00, indicating that for each model all chains had converged successfully. Similarly, the number of effective samples approached 2000 for many parameters indicating that the chains exhibited low autocorrelation. Importantly, no model exhibited any divergent transitions suggesting that there were no neighborhoods of the posterior distribution that the sampler was not able to explore sufficiently well.
To measure the difference between group-level parameters, we used highest density intervals (HDI; (Kruschke, 2014)). The HDI is the interval which contains the required mass such that all points within the interval have a higher probability density than points outside the interval. For example, a 95% HDI of the posterior distribution for a parameter consists of those parameter values that have at least some minimal level of posterior credibility, such that the total probability of all such values is 95%. Parameter values outside this range are unlikely and thus have low credibility. To compare the overall performance of each model, we computed the Watanabe-Akaike Information Criterion (WAIC; (Watanabe, 2010)), which, like AIC or BIC, provides a metric to compare different models fit to the same dataset. The WAIC is computed from the pointwise log-likelihood of the full posterior distribution (thereby assessing model fit) with a second term penalizing for model complexity.
Results
As previously reported, the uncued and cued versions of the rGT task elicit different patterns of choice preference on average for each group (Figure 1b and c). After an initial learning phase, choice preference averaged over rats and across sessions 18–20 showed a clear preference for option P2—the reward-maximizing option—in the uncued rGT group. This average preference was significantly reduced in the cued rGT group, with a concomitant increase in preference for option P3 (Figure 1d; option x task: F(1,980) = 14.23, p=0.0002; uncued vs cued: P1: t(197) = 2.76, p = 0.006; P2: t(240) = 5.24, p < 0.0001; P3: t(200) = −6.98, p < 0.0001; P4: t(237) = −1.15, p = 0.25). At the level of individual rats, choice preference varied widely, with a subset of individual rats in each group displaying idiosyncratic preferences different from the average profile. The distribution of preference scores across rats for each group shows a high degree of heterogeneity in choice preference (Figure 1e): a score > 0 indicates preference for the largely reward-maximizing options, i.e. optimal, while a score < 0 indicates a preference for the higher variability options, i.e. risk-preferring. On average, rats trained on the uncued rGT have a positive preference score (median = 0.63, Wilcoxon signed-rank test p<0.001), while rats trained on the cued rGT are evenly distributed between optimal and risk-preferring choice preferences (median = 0.04, Wilcoxon signed-rank test p=0.61).
Modeling learning dynamics on the rGT
We separately collated choice data from rats that performed either the uncued or cued rGT and fit a series of RL models to the full ensemble of behavioral responses for each group using a hierarchical fitting procedure based on Hamiltonian Monte Carlo (HMC; see Methods), a variant of Markov Chain Monte Carlo (MCMC) that samples the posterior distribution of model parameters conditional on the data and the specification of the model. These models treated choice on each trial as probabilistically driven by latent Q-values for each option P1–4, learned through trial-and-error experience of the associated positive and negative outcomes. Each model sought to parametrize different hypotheses about the effective ‘cost’ of the (presumably) negative time-out punishments with respect to the rewarding pellet outcomes associated with each choice option. These ‘equivalent punishment’ parameters were estimated for each model alongside separate learning parameters for the two types of outcomes (positive learning rate η+ for learning from pellet outcomes and negative learning rate η− for learning from the time-out punishments) and an inverse temperature parameter, β, that quantified the ‘noisiness’ of choice relative to the latent learned values of the options. A second set of models (denoted *) assumed a single learning rate for both positive and negative outcomes (i.e. η+=η−).
We fit each RL model to all valid choice trials from sessions 1–5 from all rats in each of the uncued and cued rGT groups. Amongst the models tested, the independent punishment weight RL model yielded the best fit to the data for each of the classic and cued rGT groups (Figure 2a; ΔWAIC > 0 for all models compared to the independent punishment model). In general, increasing the complexity of the mapping from time-out duration to an equivalent punishment improved model fit as assessed by WAIC, with the simple linear scaling models fitting the least well and the independent punishment scaling models fitting the best. Allowing for different learning rates from positive and negative outcomes marginally improved model fit for each class of equivalent punishment models (apart from the scaled and offset punishment RL model fit to the cued rGT group, in which any improvement in model likelihood from the addition of an extra learning rate parameter did not outweigh the additional complexity of this model for this dataset).
Figure 2.
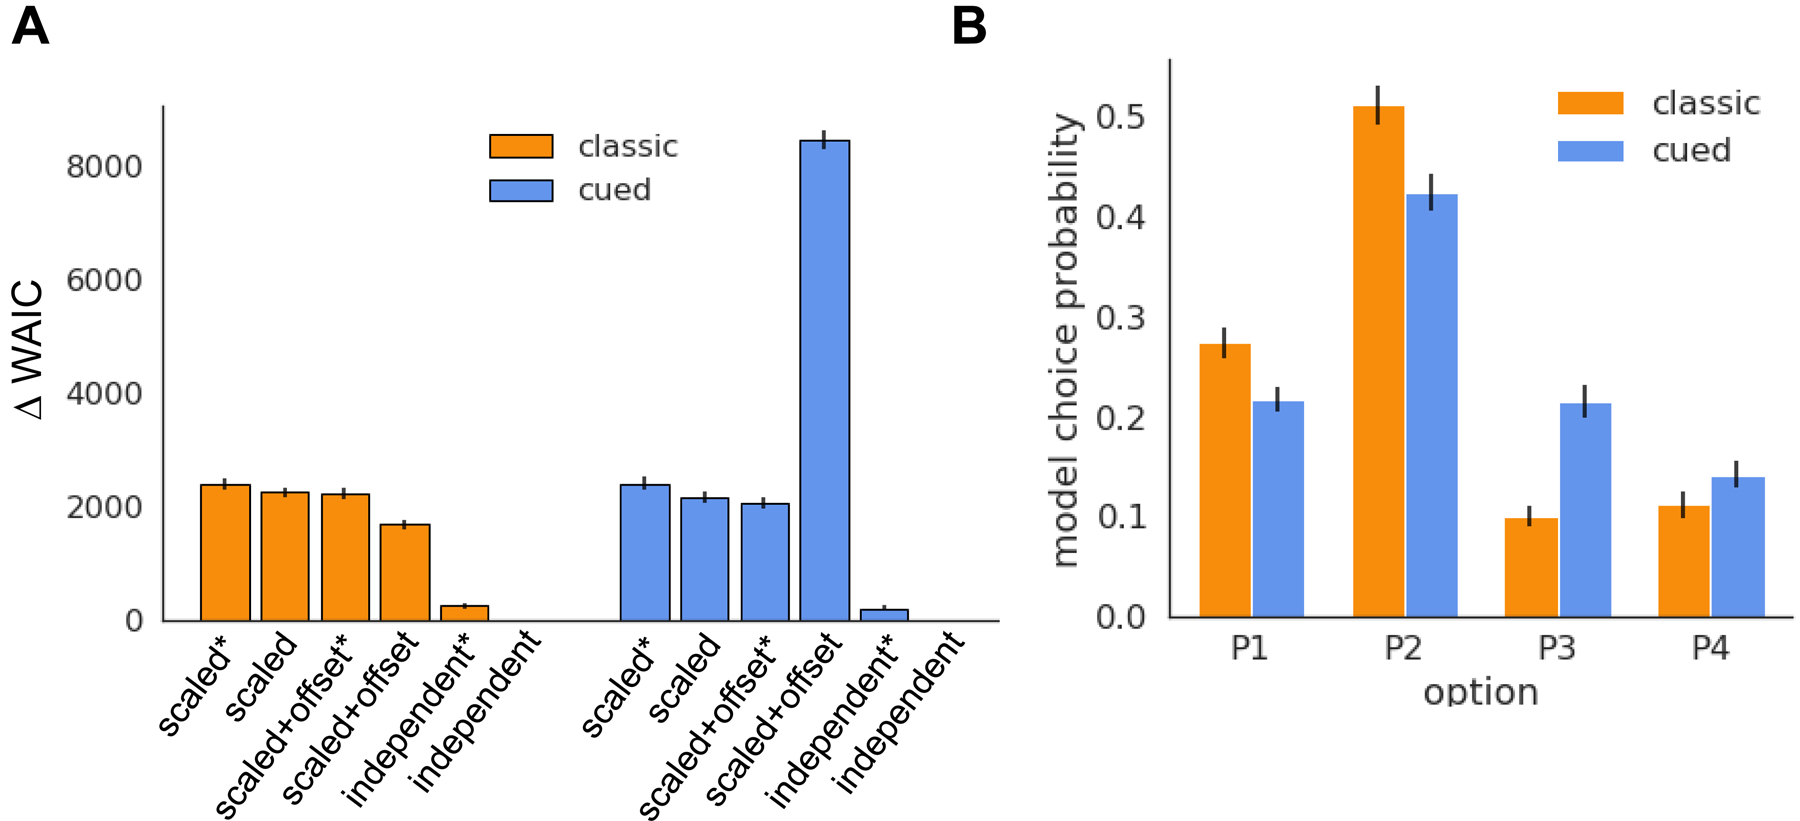
Model fits. A. Difference in WAIC between each model and the independent punishment RL model (with Δ WAIC = 0). Lower WAIC indicates a better explanation of the data. Error bars are SEM. B. Average choice probability (sessions 18–20) for the dual-learning rate independent punishment RL model simulated with the posterior estimates of the individual-level model parameters foreach of the classic and cued rGT.
To confirm the best-fitting independent punishment RL model captured the dominant features of the behavioral data, we simulated the probability of each choice option on each trial for the full uncued and cued rGT datasets, using the posterior samples of each individual-level model parameter (Figure 2b). Extracting the average model choice probabilities for sessions 18–20 recapitulates the relative increase in preference for the P3 and P4 options on the cued vs uncued rGT, indicating this model appropriately captures the relative prevalence of risky vs optimal choice preference on the two rGT variants ( option x task: F(1,980) = 15.89, p<0.0001; uncued vs cued: P1: t(218) = 2.88, p = 0.004; P2: t(240) = 3.29, p =0.001; P3: t(215) = −6.20, p < 0.0001; P4: t(237) = −1.52, p = 0.12).
Group-level differences in learning on the classic and cued rGT tasks
Inspection of the posterior estimates of the group-level mean parameters reveals key differences in learning for rats trained on the uncued vs cued rGT (Figure 3). Our hierarchical modeling approach assumes individual estimates for each model parameter follow a single group-level distribution parameterized by mean and variance hyper-parameters; reliable differences between group-level parameter estimates are interpretable in light of the different prevalence of optimal vs risk-preferring rats in each cohort. For the scaled punishment and scaled + offset punishment models, the posterior estimates for the mean group negative learning rate are credibly different (95% HDI for the classic-cued mean η− distributions > 0). In the independent punishment model, the posterior distributions for the scaling parameter ω3 for option P3 (that is, the option primarily associated with the emergence of risk-preferring choice in this task) is credibly different for the uncued and cued rGT groups. For no model tested did the posterior estimates for the group mean η+ reliably differ between groups trained on the two variants of the task. Interestingly, mean weights parametrizing the cost of the four time-out punishments in the independent punishment model suggested some intervals did not modulate the latent value of the corresponding choice option as an explicit cost (at least on average); this result may indicate rats are more likely to select a given choice option again after a time-out, in order to obtain an expected reward that is only occasionally withheld.
Figure 3.
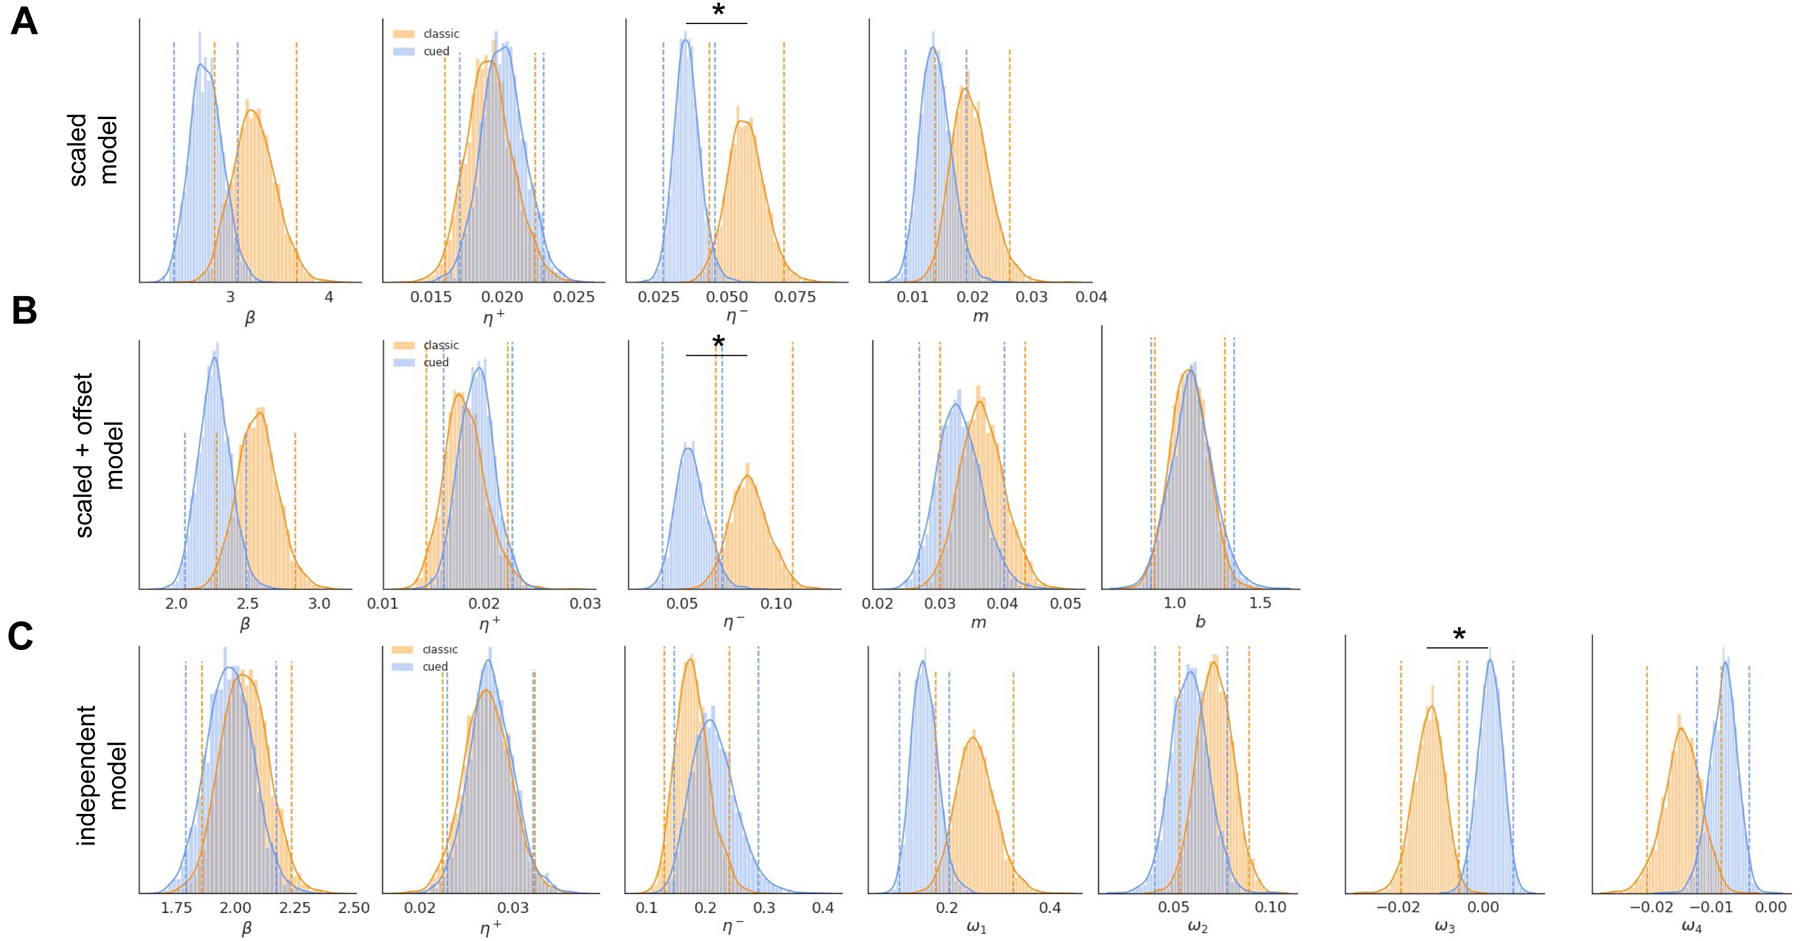
Group-level posterior estimates of model parameters. Asterisks mark parameters for which the 95% HDI of the sample difference between classic and cued rGT mean estimates was greater than zero, indicating a credible difference. Dashed lines demarcate the 95% HDI for each distribution. A. Posterior estimates for the group mean β, η+, η− and m parameters for the scaled punishment RL model. B. Posterior estimates for the group mean β, η+, η−, m and b parameters for the scaled+offset punishment RL model. C. Posterior estimates for the group mean β, η+, η− and ω parameters for the independent punishment RL model.
To confirm the relationship between the differences in the group level posterior parameter distributions and the increased number of risk-preferring rats on the cued rGT, we performed a post-hoc analysis in which we assigned rats from each of the tasks to either a risk-preferring or an optimal group, based on their preference scores from the end of training, and fit each model to these identified groups. In each case, a similar subset of the parameters that govern learning from the time-out punishments showed credible differences (in the same direction as the results above) between the risk-preferring and optimal group distributions (scaled model:η− and m; scaled+offset model: η−, m and b; independent model: η+, η−, m and b) confirming the differences observed between the cued and uncued rGT group parameters are indeed related to the establishment of risk-preferring choice in a greater number of rats trained on the cued rGT. Model comparison for these two groups defined on preference score identified the scaled+offset punishment RL model as the most likely given these data, a result that may reflect the independent punishment RL model has more complexity than necessary for these data that display more homogeneity in choice preference.
Insensitivity to time-out punishments predicts risk preference on the rGT
The group-level results described above suggest learning from time-out punishments, rather than from rewarding outcomes, differs between the uncued and cued rGT cohorts. To test which model parameters are associated with the emergence of risky choice we compared mean posterior parameter estimates at the individual level for optimal vs risk-preferring rats within each task group (Figure 4). For the scaled punishment model, mean individual posterior estimates for m differed significantly between optimal and risk-preferring rats in both the uncued and cued rGT cohorts, as did β and η− for the cued rGT cohort (Mann-Whitney U test, p<0.01; Figure 4a). Similarly, the scaled and offset punishment model displayed differences in individual estimates for model parameters that control learning from negative outcomes: both η− and m differed significantly between the optimal and risk preferring rats in both the uncued and cued rGT cohorts, as did individual β and b parameters for the cued rGT cohort (Figure 4b). In the independent punishment model, only the punishment duration weights for option P2 and P4 differed significantly between optimal and risk-preferring rats in both groups, along with the weight for option P3 in the cued rGT cohort alone (Figure 4c).
Figure 4.
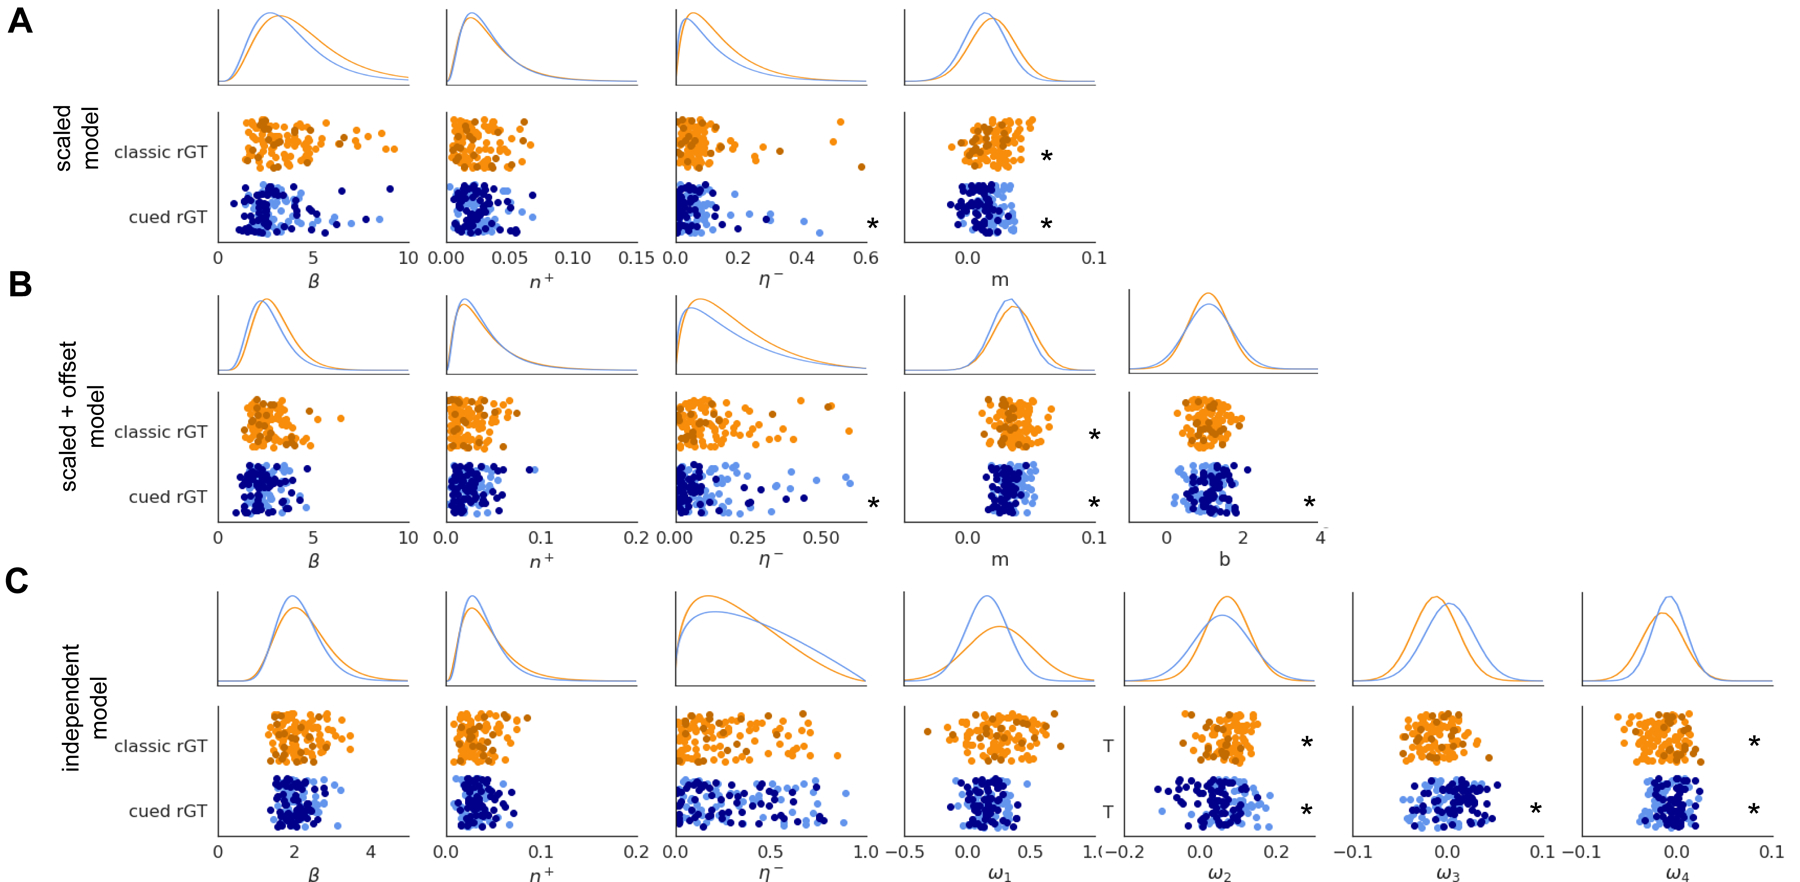
Individual-level mean posterior estimates of model parameters. Top rows show the group-level distribution from which the individual estimates are sampled (parameterized by the average posterior mean and variance estimates for each parameter). Asterisks mark parameters which significantly differ at the individual level between optimal and risk-preferring rats.
As individual choice preference is distributed broadly over the interval [−1,1] for rats trained on the cued rGT, we next tested whether any of the parameters that control the sensitivity to negative outcomes in these learning models could reliably predict continuous preference scores at the end of training for rats trained on each variant of the rGT task (Figure 5). Across each model tested, we found a subset of parameters that control the relative scaling of the time-out punishments relative to rewards were highly predictive of individual rats’ ultimate preference scores on both the uncued and cued tasks (scaled model: uncued m R2=0.10, F(1,108)=11.75, p<0.01, cued m R2=0.22, F(1,134)= 38.54, p<0.01; scaled+offset model: uncued m R2=0.15, F(1,108)=18.68, p<0.01, cued m R2=0.20, F(1,134)=33.62, p<0.01; independent punishment model: uncued ω2 R2=0.08, F(1,108)=9.868, p<0.01 and ω4 R2=0.20, F(1,108)=27.03, p<0.01, cued ω2 R2=0.21, F(1,134)=35.61, p<0.01 and ω4 R2=0.10, F(1,134)=15.16, p<0.01). While ω3 was highly predictive of preference score for individual rats in the cued rGT group (cued ω3 R2=0.11, F(1,134)=16.98, p<0.01), this was not the case for the uncued rGT group. Overall, these predictive relationships indicate significantly lower effective punishment for a given time-out duration for risky compared to optimal rats. In addition to these effects across tasks, we found η− estimates in the scaled and offset punishment model fit to the cued rGT group was reliably related to subsequent choice preference, with a lower learning rate from negative outcomes significantly predicting a reduced, i.e. riskier, preference score (cued η− R2=0.07, F(1,134)=10.78, p<0.01). Interestingly, the independent punishment model showed a significant negative relationship between individual η+ estimates and preference score in the uncued (but not the cued) rGT group (uncued η+ R2=0.09, F(1,108)=10.48, p<0.01). The predictive relationships between model parameters that regulate learning from negative outcomes and subsequent choice preference were largely preserved in the single learning rate models (scaled* model: uncued m R2=0.11, F(1,108)=14.20, p<0.01, cued m R2=0.30, F(1,134)= 57.67, p<0.01; scaled+offset* model: uncued m R2=0.15, F(1,108)=18.93, p<0.01, cued m R2=0.25, F(1,134)=44.82, p<0.01; independent punishment model: uncued ω2 no relationship, ω3 no relationship and ω4 R2=0.23, F(1,108)=34.73, p<0.01, cued ω2 R2=0.15, F(1,134)=23.24, p<0.01, ω3 R2=0.16, F(1,134)=26.06, p<0.01 and ω4 R2=0.20, F(1,134)=34.34, p<0.01).
Figure 5.
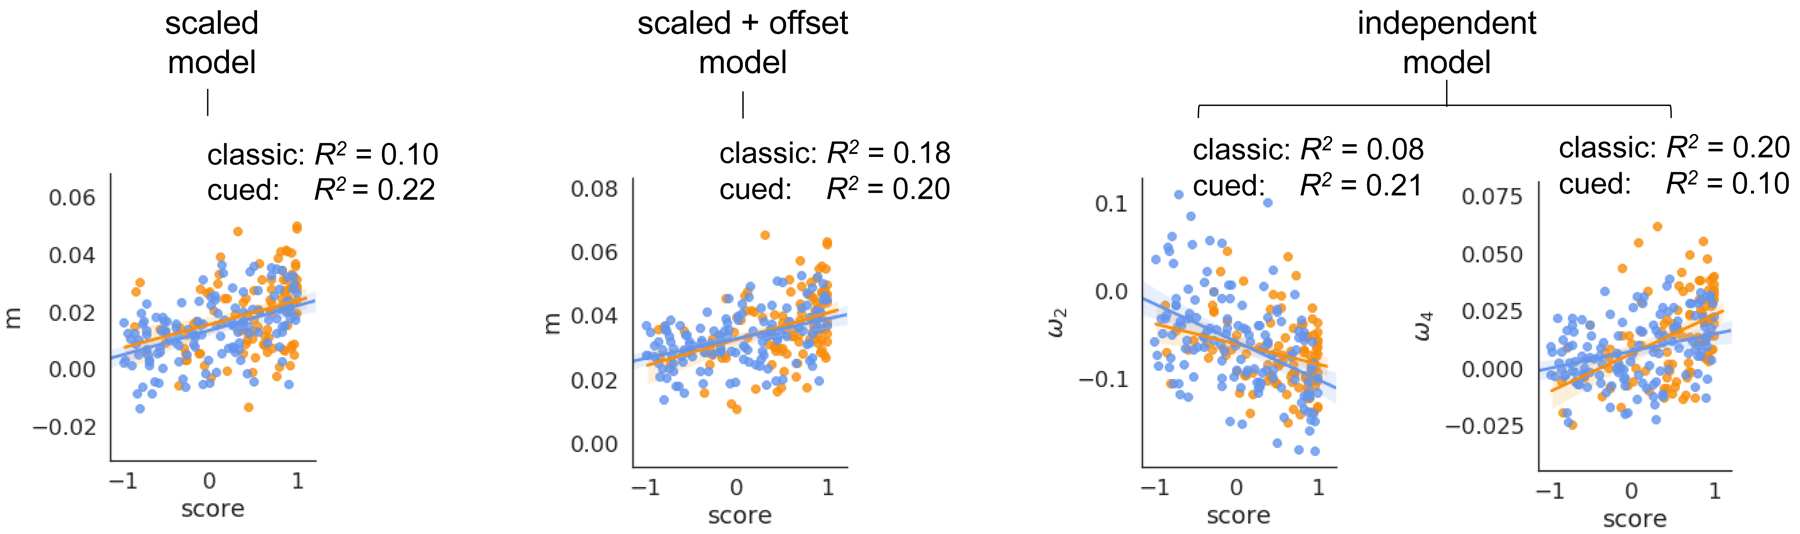
Punishment insensitivity predicts the degree of subsequent risk preference on both the classic and cued rGT tasks (p<0.01 for all coefficients).
The ‘equivalent cost’ of time-out durations is specific to each choice option on the rGT
Each RL model we tested revealed an association between altered learning from time-out punishments and the emergence of risky choice on the rGT. To study the equivalent cost imposed by the time-out punishments for optimal and risk-preferring rats according to the tested RL models, we used the average posterior estimate of the m,b and ω parameters for each individual rat to transform the time-out duration for each choice option into its equivalent cost (in pellets; Figure 6). For each model, time-outs ‘cost’ less for the risk-preferring rats; this time-out insensitivity is in addition to a global insensitivity to time-outs displayed by all rats performing the rGT, as evidenced by the positive intercept for each model that allowed this term to vary (and also thus better fit the behavioral data as assessed by WAIC). Interestingly, the equivalent cost of the time-outs for the best-fitting, independent punishment RL model are highly nonlinear in duration, with 10s time-out for P2 and 30s time-out for P3 shifting the latent valuation of the respective option by almost the same amount for the risky rats performing the cued rGT. This suggests that the insensitivity to time-out punishments displayed by the risk-preferring rats is at least partially specific to the more immediately rewarding, though more variable, choice options. While the profile of equivalent cost for each time-out duration is nonlinear, it remains monotonic with duration, suggesting the punishment insensitivity associated with risky choice on the task is not completely independent of duration.
Figure 6,
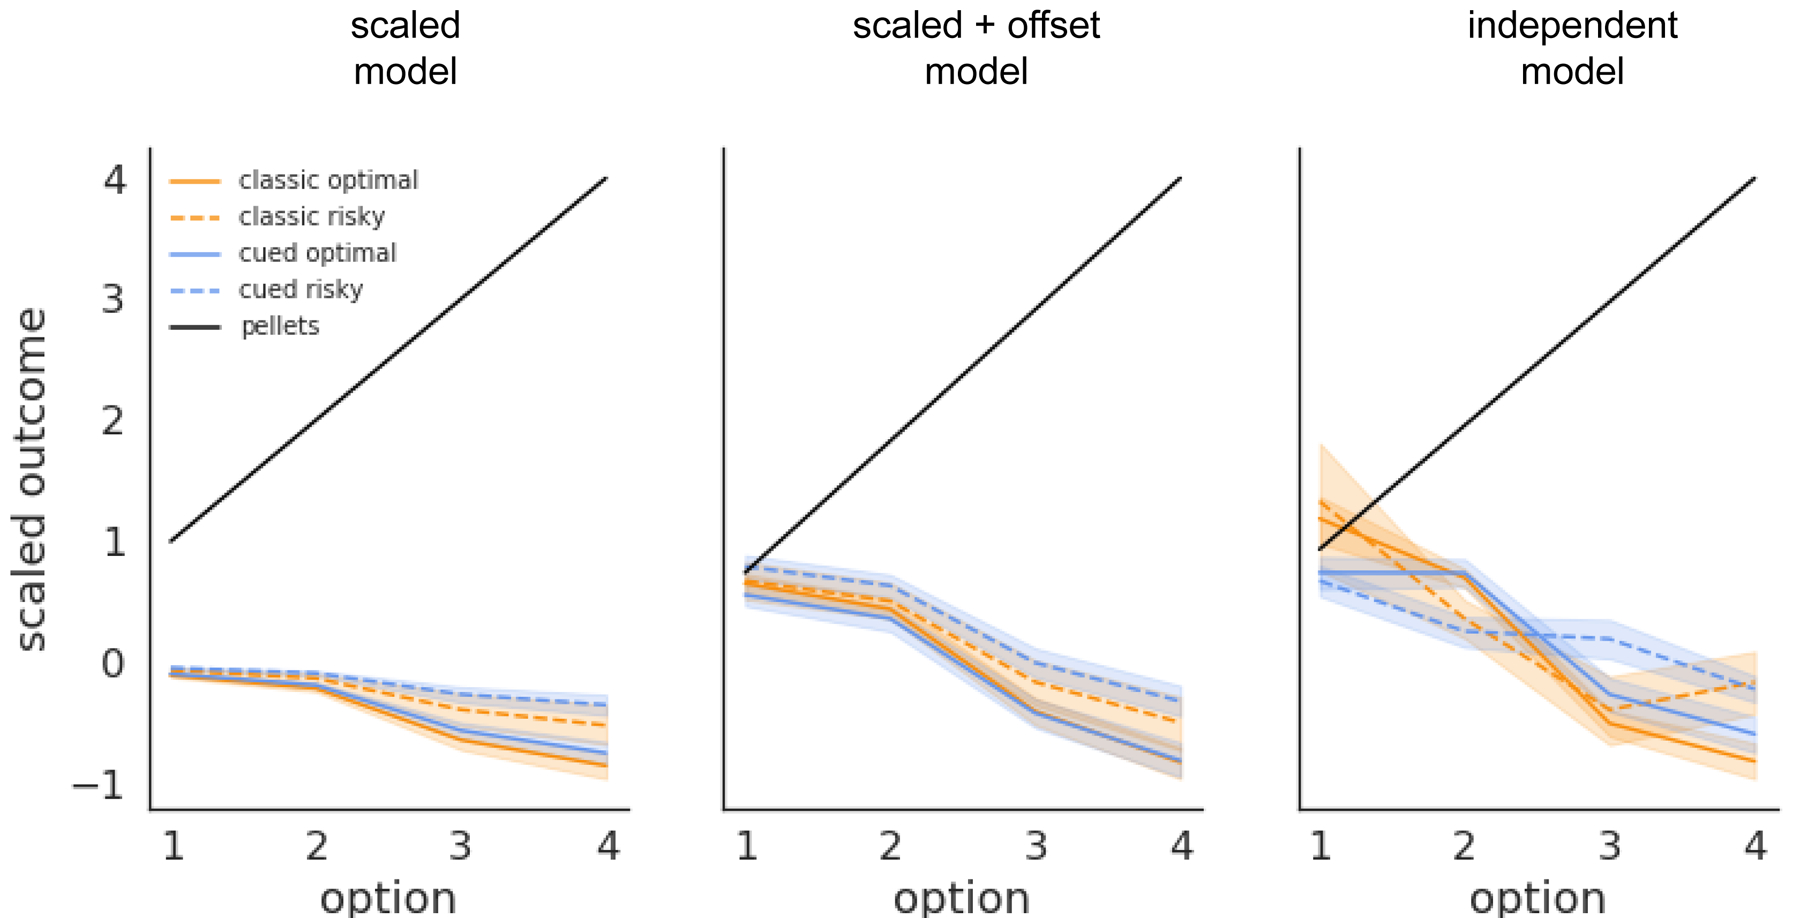
Effective cost of time-out punishments for each option for optimal and risky rats under each dual-learning rate RL model.
Discussion
Using a computational approach based on reinforcement learning models, we show that risk-preferring rats are hyposensitive to punishing time-outs associated with risky choices, but not hypersensitive to the potential rewards, during the early sessions of rGT training. Across all models tested, individual parameter estimates pertaining to punishment sensitivity (m, b and ω) significantly predicted whether rats would go on to develop a risk-preferring or optimal decision-making pattern. The fact that this observation was not restricted to a specific form of the model increases our confidence that this finding is robust. Despite the clear elevation in preference for the risky options seen in the cued task, choice in both versions of the rGT was best fit by the same RL model, as might be expected from the identical reinforcement contingencies and trial structure. As such, we conclude that the cued version of the rGT elicits an insensitivity to time-out punishments more effectively in a larger number of subjects, rather than evoking a unique learning mechanism separate from that adopted by the smaller fraction of risk-preferring subjects on the uncued rGT task.
In all the models tested, the learning rate from rewards was the same across the cued and uncued rGT at the group-level, even though significantly more subjects exhibited a preference for the risky options on the cued task variant. In contrast, the punishment learning rate was significantly lower in the cued rGT, suggesting animals’ choice patterns are less influenced by the experience of the punishing time-outs than those in the uncued task. The model which best fit the data allowed independent scaling of punishments against rewards for each option, rather than assuming a linear relationship. This approach revealed that time-out insensitivity on loss trials diverged far more across task variants for P3 and P4. As such, the timeout insensitivity induced by the addition of reward-concurrent cues is unlikely to reflect a global blunting of the perception of duration, but is instead uniquely manifest when the probability and duration of the punishments is comparatively large, or when the variance in reward rate is relatively high.
The finding that risky choice is driven by hyposensitivity to punishments, rather than hypersensitivity to rewards, on the uncued version of the task is perhaps surprising, but not necessarily unexpected. However, the observation that this same mechanism underlies the greater degree of risky choice on the cued rGT seems more counter-intuitive, given that the cues co-occur with rewards, and do not feature on punished trials. Theoretically, the greater complexity of the cues associated with wins on P3 and P4 could contribute to the selective time-out insensitivity associated with these options, but such an explanation cannot easily explain why risk-preferring animals on the uncued task exhibit poor learning from punishments. Nevertheless, it will be important to explore in future studies whether the scaling of cue complexity with reward size is critical for the ability of win-paired cues to promote risky choice, as the two features are currently confounded in the existing cued rGT. One particular question that remains to be explored in future work is to test whether using time outs as punishment is necessary for the induction of punishment insensitivity by the win-paired cues. Indeed, it remains an open question as to whether salient cues on rewarding outcomes will induce time out insensitivity even in settings that do not involve probabilistic choice.
The non-linearity of the scaling factor mapping punishments on to units of rewards may, in part, be a function of the reinforcement contingencies used, in that the punishments associated with the larger rewards do not multiply in a linear way (i.e. each increase in unit of reward is not matched by a constant increment in punishment duration). However, if we consider the punishment-to-reward ratio simply in terms of pellets and seconds, the ratio increases from 5:1 to 10:1 as the options transition from optimal (P1, P2) to risky (P3, P4). Each longer punishment should therefore be more, rather than less, effective at decreasing the latent value for these options, if the cost of the time-outs is mediated by duration alone. By design, the punishments are also considerably more frequent after choice of the risky options. One line of reasoning might suggest these negative events should therefore be more expected, and trigger less of a negative prediction error, and thus less updating of the latent value for the corresponding option. Repeated experience with punishment would therefore lead over time to reduced learning from these negative events. However, by the same analogy, the more intermittent delivery of rewarding outcomes should generate stronger positive prediction errors, and amplify learning, yet we saw no evidence of potentiated learning from rewards in the cued rGT, or in risk-preferring animals. Obviously, the fact that rewards are delivered more frequently on P1 and P2 does not impair most animals’ ability to learn that these options deliver maximal reward over time, and to develop a stable preference for these options. Indeed, in the absence of win-paired cues, this reward-maximization approach is the most common choice pattern observed.
Blunted learning from punishments is particularly pronounced for option P3. This choice is associated with maximal uncertainty regarding whether the outcome will be a win or a loss, given that the probability of either event is 0.5. As a result, there is the greatest degree of variance in the sequence of trial outcomes, and rewarded trials are highly likely to be followed by non-rewarded trials. As summarized in the introduction, pairing wins with audiovisual cues in a two-choice lottery task amplified the increase in pupil dilation caused by winning during decision making on the subsequent trial. Pupil dynamics are largely influenced by the noradrenergic system, and this increase in pupil dilation could theoretically reflect greater arousal induced by cued wins. Whether this win-potentiated arousal is evident in rats performing the cued rGT has yet to be determined, but is theoretically possible. Should this effect persist throughout a non-rewarded choice on a subsequent trial and the experience of the time-out penalty, it could contribute to altered processing of the punishment signal. Given that wins followed by losses are more likely on P3 and P4, updating of the value of these options may be particularly vulnerable to cue-driven punishment insensitivity. This hypothesis remains highly speculative, but anticipatory skin conductance responses on the Iowa Gambling Task have been linked to the degree of disparity between wins and losses in human subjects (Tomb et al., 2002), suggesting that bigger differences between wins and losses can increase arousal during decision making, and human subjects find slot machine games which incorporate winning sounds both physiologically and psychologically more arousing (Dixon et al., 2014). Given that the same RL model accounts for risky choice on both the cued and uncued tasks, this line of reasoning would suggest that risk-preferring rats on the classic, uncued version experience more arousal following risky wins, which then alters their ability to encode subsequent losing outcomes effectively.
Alternatively, insensitivity to punishments in risk-preferring rats may reflect alterations in the way in which animals represent the structure of the task. Successful performance of the rGT requires animals to use both rewarding and punishing outcomes to update the value of each particular option i.e. to treat both types of outcomes as if they follow from the same ‘state’. If animals instead represent wins and losses as arising from independent states, this may result in aberrant choice patterns, as learning from outcomes in one state will not generalize to learning in another. Given that experience of the reward is more salient, winning outcomes may be more easily associated with the choice made. If losing outcomes are not recognized as arising from the same state (or action), animals would not devalue an option appropriately based on the experience of the time-out penalties, and exhibit a bias towards options paired with the larger rewards. It is easy to see how this misrepresentation of outcomes as independent could be facilitated by the addition of salient audiovisual cues to wins, in that one outcome is made more noticeable and distinct from the other.
These hypotheses need not be mutually exclusive, and both can be investigated empirically. If time-out sensitivity is driven by the experience of a win on the previous trial, then poor learning from losses should be particularly evident on “probe” sessions in which win and loss trials are systematically interleaved on a particular option. Developing a model in which the parameters that control learning were allowed to vary dynamically over time would thus be able to detect such session-specific alterations in learning. Furthermore, if elevated arousal caused by risky wins drives hyposensitivity to subsequent punishments, then dampening the noradrenergic system may decrease risky choice in risk-preferring animals, whereas amplifying noradrenergic signaling may have the opposite effect. In the uncued, classic rGT, the noradrenaline reuptake inhibitor atomoxetine significantly decreased choice of P2, and tended to increase choice of P3, providing some early support for this hypothesis (Silveira et al., 2016), but the effects of noradrenergic manipulations on the cued rGT, and in optimal versus risk-preferring animals, have yet to be reported.
If time-out insensitivity is instead driven by a misinterpretation of the latent state structure of the task, such that winning and losing outcomes are interpreted as arising from separate states, then increasing the perceptual similarity between wins and losses should encourage re-integration of both outcomes into the same state and enable more accurate valuation of each option. As such, pairing delivery of both wins and losses after choice of a particular option with the same audiovisual cues could theoretically reduce cue-driven risky choice. Such a suggestion may seem counter-intuitive, given that features of gambling products which increase the similarity between winning and losing instead cause the player to misinterpret a loss as a win, as in the case of losses disguised as wins (LDWs) (Dixon et al., 2010), and the near-miss effect (Clark et al., 2009; Griffiths, 1991). Instead pairing losses with audiovisual cues that likewise scale in complexity and salience with the size of the penalty may combat cue-driven risky choice. Indeed, such an approach has been successful in reducing the ability of LDWs to motivate game play, largely by allowing subjects to recognize these events as losses (Dixon et al., 2015).
Neuronal activity within the orbitofrontal cortex (OFC) has been found to encode latent task states in rats, and this information is thought to influence action selection through regulating activity of striatal cholinergic interneurons (Stalnaker et al., 2016; Takahashi et al., 2011; Wilson et al., 2014). If a task-state representation is miscoded within the OFC, resulting in risky choice, then silencing this region during acquisition might be expected to attenuate the ability of win-paired cues to amplify risky choice. Lesions to the OFC made prior to acquisition of the uncued rGT did not alter preference for P3 or P4, which was generally low in all animals, but did increase preference for P1 over P2 within the first five sessions (Zeeb and Winstanley, 2011). Although we interpreted this effect as a difficulty in learning which option provided the greatest reward over time, by biasing animals towards the option associated with greater reinforcement rate, it is possible that this manipulation instead allowed for greater integration of punishing outcomes with an option’s latent value, though this conclusion is harder to reconcile with data from reversal learning and devaluation studies suggesting impaired updating of value following OFC damage (e.g. (Chudasama and Robbins, 2003; Gallagher et al., 1999; Rudebeck and Murray, 2008)). Nevertheless, data from rodent behavioural studies show that the addition of cues can alter the role played by this brain region in task performance (Zeeb et al., 2010), such that silencing the OFC during acquisition of the cued rGT could produce a distinct behavioural result. Another unique hypothesis potentially generated by this computational modeling approach concerns the impact of silencing the basolateral amygdala. Previous work suggests dampening output from this region promotes risky decision making on the uncued rGT by decreasing sensitivity to loss in optimal decision-makers (Zeeb and Winstanley, 2011). Given that risk-preferring rats already fail to learn from these punishment signals, shutting down this region may have limited effects on acquisition or performance of the cued rGT, given the larger proportion of animals that exhibit a bias towards the risky options on this version of the task.
While we hope that the current model will prove heuristically useful, there are some limitations to the approach used here. To date, we have only modelled data from male rats. Research using both human and rodent subjects indicates that females may explore options for longer, resulting in greater sampling of risky options, and that greater risky choice in females may result from greater anxiety or stress sensitivity (van den Bos et al., 2012, 2013; Georgiou et al., 2018; Zhang et al., 2017). As such, it will be important to determine whether variation in the same learning parameters predicts risk preference in female rats. We have also not considered other behavioural variables, such as reaction time or premature responding, in the models presented here. Such measurements provide valuable information regarding information processing speed and motor impulsivity, and our previous meta-analysis indicates that both of these indices correlate with risky decision making at the population level (Barrus et al., 2015). Computational approaches could help determine whether rapid selection of options and/or responding prematurely at the array precipitates, or results from, risky decisions. Furthermore, does the outcome of a risky choice, be it a win or a loss, differentially influence the decision speed on the next trial, or the chances of a premature response being made? We have also not accounted for other drivers of choice beyond the updating of an option’s latent value, such as the tendency to simply repeat the previous response (perseveration). These approaches might account for more variance in the data, and improve the accuracy of the models’ predictions, but they will inevitably require more parameters, increasing the chances of over-fitting.
An additional caveat pertains to the generalization of these results beyond the first five sessions of training on the rGT task. While our models were able to predict choice at the end of training with relatively high accuracy, the mechanisms that promote risk-preferring choice beyond session five remain to be directly tested. Likewise, a more restrictive focus on only the first session of training may provide a more nuanced picture of the establishment of risk-preferring choice in the very early stages before choice preference becomes relatively stable (which possibly occurs before session five). In particular, a focus on the first sessions of training may reveal subtle differences in positive learning rate between the groups that are masked by the dominant effect of the insensitivity to time out punishments evident after this early window. One approach to reveal potential dynamic changes in the parameters that govern learning on this task is to introduce parameters that vary with increased experience on the task (for e.g. by session), at the cost of greatly increased model complexity.
Computational modeling of rodent behavioural data is, in general, underutilized by the field of behavioural neuroscience. Direct manipulations of brain regions and neurotransmitter systems are powerful methods to determine causal relationships between behavior and brain function, but computational analyses of trial-by-trial data has allowed us to parse learning from rewards versus punishments in a way that we would have been unable to do otherwise.
Combining these types of computational approaches with in vivo manipulations has the potential to maximize the knowledge available from our experiments, and provide novel insights into the neurocognitive basis of both naturally-occurring individual differences in decision making, and behavioural variation as a result of experimental manipulations. Such synergy will hopefully accelerate our understanding of the brain processes that contribute to both optimal and maladaptive decision making, and their role in psychiatric disease.
Funding:
This work was supported by National Institutes of Health grant R01DA042065 from NIDA and the Swartz Center for Theoretical Neuroscience at Princeton University (AJL) and an operating grant awarded to CAW from the Canadian Institutes for Health Research (CIHR; PJT-162312). In the past three years, CAW has consulted for Hogan Lovells LLP and received due compensation. The authors confirm they have no other conflicts of interest or financial disclosures to make.
References
- Adams WK, Barkus C, Ferland J-MN, Sharp T, and Winstanley CA (2017). Pharmacological evidence that 5-HT2C receptor blockade selectively improves decision making when rewards are paired with audiovisual cues in a rat gambling task. Psychopharmacology 234, 3091–3104. [DOI] [PubMed] [Google Scholar]
- Ahn W-Y, Haines N, and Zhang L (2017). Revealing Neurocomputational Mechanisms of Reinforcement Learning and Decision-Making With the hBayesDM Package. Computational Psychiatry 1, 24–57. [DOI] [PMC free article] [PubMed] [Google Scholar]
- Alter A (2017). Irresistible: The rise of addictive technology and the business of keeping us hooked (New York, NY, US: Penguin Press; ). [Google Scholar]
- Anderson BA, Laurent PA, and Yantis S (2011). Value-driven attentional capture. PNAS 108, 10367–10371. [DOI] [PMC free article] [PubMed] [Google Scholar]
- Barrus MM, and Winstanley CA (2016). Dopamine D3 Receptors Modulate the Ability of Win-Paired Cues to Increase Risky Choice in a Rat Gambling Task. J. Neurosci 36, 785–794. [DOI] [PMC free article] [PubMed] [Google Scholar]
- Barrus MM, Hosking JG, Zeeb FD, Tremblay M, and Winstanley CA (2015). Disadvantageous decision-making on a rodent gambling task is associated with increased motor impulsivity in a population of male rats. J Psychiatry Neurosci 40, 108–117. [DOI] [PMC free article] [PubMed] [Google Scholar]
- Bechara A, Dolan S, Denburg N, Hindes A, Anderson SW, and Nathan PE (2001). Decision-making deficits, linked to a dysfunctional ventromedial prefrontal cortex, revealed in alcohol and stimulant abusers. Neuropsychologia 39, 376–389. [DOI] [PubMed] [Google Scholar]
- Berridge KC, and Robinson TE (1998). What is the role of dopamine in reward: hedonic impact, reward learning, or incentive salience? Brain Research Reviews 28, 309–369. [DOI] [PubMed] [Google Scholar]
- van den Bos R, Jolles J, van der Knaap L, Baars A, and de Visser L (2012). Male and female Wistar rats differ in decision-making performance in a rodent version of the Iowa Gambling Task. Behavioural Brain Research 234, 375–379. [DOI] [PubMed] [Google Scholar]
- van den Bos R, Homberg J, and de Visser L (2013). A critical review of sex differences in decision-making tasks: Focus on the Iowa Gambling Task. Behavioural Brain Research 238, 95–108. [DOI] [PubMed] [Google Scholar]
- Breen RB, and Zimmerman M (2002). Rapid Onset of Pathological Gambling in Machine Gamblers. J Gambl Stud 18, 31–43. [DOI] [PubMed] [Google Scholar]
- Carpenter B, Gelman A, Hoffman MD, Lee D, Goodrich B, Betancourt M, Brubaker M, Guo J, Li P, and Riddell A (2017). Stan: A Probabilistic Programming Language. Journal of Statistical Software 76, 1–32. [DOI] [PMC free article] [PubMed] [Google Scholar]
- Cherkasova MV, Clark L, Barton JJS, Schulzer M, Shafiee M, Kingstone A, Stoessl AJ, and Winstanley CA (2018). Win-Concurrent Sensory Cues Can Promote Riskier Choice. J. Neurosci 38, 10362–10370. [DOI] [PMC free article] [PubMed] [Google Scholar]
- Chudasama Y, and Robbins TW (2003). Dissociable Contributions of the Orbitofrontal and Infralimbic Cortex to Pavlovian Autoshaping and Discrimination Reversal Learning: Further Evidence for the Functional Heterogeneity of the Rodent Frontal Cortex. J. Neurosci 23, 8771–8780. [DOI] [PMC free article] [PubMed] [Google Scholar]
- Clark L, Lawrence AJ, Astley-Jones F, and Gray N (2009). Gambling Near-Misses Enhance Motivation to Gamble and Recruit Win-Related Brain Circuitry. Neuron 61, 481–490. [DOI] [PMC free article] [PubMed] [Google Scholar]
- Cocker PJ, Hosking JG, Benoit J, and Winstanley CA (2012). Sensitivity to Cognitive Effort Mediates Psychostimulant Effects on a Novel Rodent Cost/Benefit Decision-Making Task. Neuropsychopharmacology 37, 1825–1837. [DOI] [PMC free article] [PubMed] [Google Scholar]
- Dixon MJ, Harrigan KA, Sandhu R, Collins K, and Fugelsang JA (2010). Losses disguised as wins in modern multi-line video slot machines. Addiction 105, 1819–1824. [DOI] [PubMed] [Google Scholar]
- Dixon MJ, Harrigan KA, Santesso DL, Graydon C, Fugelsang JA, and Collins K (2014). The Impact of Sound in Modern Multiline Video Slot Machine Play. J Gambl Stud 30, 913–929. [DOI] [PMC free article] [PubMed] [Google Scholar]
- Dixon MJ, Collins K, Harrigan KA, Graydon C, and Fugelsang JA (2015). Using Sound to Unmask Losses Disguised as Wins in Multiline Slot Machines. J Gambl Stud 31, 183–196. [DOI] [PubMed] [Google Scholar]
- Dow Schull N (2014). Addiction by Design: Machine Gambling in Las Vegas (Princeton, NJ, USA: Princeton University Press; ). [Google Scholar]
- Dowling N, Smith D, and Thomas T (2005). Electronic gaming machines: are they the ‘crack-cocaine’ of gambling? Addiction 100, 33–45. [DOI] [PubMed] [Google Scholar]
- Ferland J-MN, Hynes TJ, Hounjet CD, Lindenbach D, Haar CV, Adams WK, Phillips AG, and Winstanley CA (2019). Prior Exposure to Salient Win-Paired Cues in a Rat Gambling Task Increases Sensitivity to Cocaine Self-Administration and Suppresses Dopamine Efflux in Nucleus Accumbens: Support for the Reward Deficiency Hypothesis of Addiction. J. Neurosci 39, 1842–1854. [DOI] [PMC free article] [PubMed] [Google Scholar]
- Flagel SB, Akil H, and Robinson TE (2009). Individual differences in the attribution of incentive salience to reward-related cues: Implications for addiction. Neuropharmacology 56, 139–148. [DOI] [PMC free article] [PubMed] [Google Scholar]
- Flagel SB, Robinson TE, Clark JJ, Clinton SM, Watson SJ, Seeman P, Phillips PEM, and Akil H (2010). An Animal Model of Genetic Vulnerability to Behavioral Disinhibition and Responsiveness to Reward-Related Cues: Implications for Addiction. Neuropsychopharmacology 35, 388–400. [DOI] [PMC free article] [PubMed] [Google Scholar]
- Flagel SB, Cameron CM, Pickup KN, Watson SJ, Akil H, and Robinson TE (2011). A food predictive cue must be attributed with incentive salience for it to induce c-fos mRNA expression in cortico-striatal-thalamic brain regions. Neuroscience 196, 80–96. [DOI] [PMC free article] [PubMed] [Google Scholar]
- Gallagher M, McMahan RW, and Schoenbaum G (1999). Orbitofrontal Cortex and Representation of Incentive Value in Associative Learning. J. Neurosci 19, 6610–6614. [DOI] [PMC free article] [PubMed] [Google Scholar]
- Gelman A, Carlin JB, Stern HS, Dunson DB, Vehtari A, Rubin DB, Carlin JB, Stern HS, Dunson DB, Vehtari A, et al. (2013). Bayesian Data Analysis (Chapman and Hall/CRC; ). [Google Scholar]
- Georgiou P, Zanos P, Bhat S, Tracy JK, Merchenthaler IJ, McCarthy MM, and Gould TD (2018). Dopamine and Stress System Modulation of Sex Differences in Decision Making. Neuropsychopharmacology 43, 313–324. [DOI] [PMC free article] [PubMed] [Google Scholar]
- Gonzalez R, Schuster RM, Mermelstein RM, and Diviak KR (2015). The role of decision-making in cannabis-related problems among young adults. Drug and Alcohol Dependence 154, 214–221. [DOI] [PMC free article] [PubMed] [Google Scholar]
- Griffiths M (1991). Psychobiology of the Near-Miss in Fruit Machine Gambling. The Journal of Psychology 125, 347–357. [DOI] [PubMed] [Google Scholar]
- Griffiths M, Scarfe A, and Bellringer P (1999). The UK National Telephone Gambling Helpline—Results on the First Year of Operation. J Gambl Stud 15, 83–90. [DOI] [PubMed] [Google Scholar]
- Kruschke J (2014). Doing Bayesian Data Analysis: A Tutorial with R, JAGS, and Stan (Academic Press; ). [Google Scholar]
- Limbrick-Oldfield EH, Mick I, Cocks RE, McGonigle J, Sharman SP, Goldstone AP, Stokes PRA, Waldman A, Erritzoe D, Bowden-Jones H, et al. (2017). Neural substrates of cue reactivity and craving in gambling disorder. Translational Psychiatry 7, e992. [DOI] [PMC free article] [PubMed] [Google Scholar]
- Meyer PJ, Lovic V, Saunders BT, Yager LM, Flagel SB, Morrow JD, and Robinson TE (2012). Quantifying Individual Variation in the Propensity to Attribute Incentive Salience to Reward Cues. PLOS ONE 7, e38987. [DOI] [PMC free article] [PubMed] [Google Scholar]
- Petry NM (2000). Psychiatric Symptoms in Problem Gambling and Non-Problem Gambling Substance Abusers. American Journal on Addictions 9, 163–171. [DOI] [PubMed] [Google Scholar]
- Petry NM, Stinson FS, and Grant BF (2005). Comorbidity of DSM-IV pathological gambling and other psychiatric disorders: results from the National Epidemiologic Survey on Alcohol and Related Conditions. J Clin Psychiatry 66, 564–574. [DOI] [PubMed] [Google Scholar]
- Robinson MJF, Fischer AM, Ahuja A, Lesser EN, and Maniates H (2016). Roles of “Wanting” and “Liking” in Motivating Behavior: Gambling, Food, and Drug Addictions In Behavioral Neuroscience of Motivation, Simpson EH, and Balsam PD, eds. (Cham: Springer International Publishing; ), pp. 105–136. [DOI] [PubMed] [Google Scholar]
- Rømer Thomsen K, Fjorback LO, Møller A, and Lou HC (2014). Applying incentive sensitization models to behavioral addiction. Neuroscience & Biobehavioral Reviews 45, 343–349. [DOI] [PubMed] [Google Scholar]
- Rudebeck PH, and Murray EA (2008). Amygdala and Orbitofrontal Cortex Lesions Differentially Influence Choices during Object Reversal Learning. J. Neurosci 28, 8338–8343. [DOI] [PMC free article] [PubMed] [Google Scholar]
- Saunders BT, and Robinson TE (2013). Individual variation in resisting temptation: Implications for addiction. Neuroscience & Biobehavioral Reviews 37, 1955–1975. [DOI] [PMC free article] [PubMed] [Google Scholar]
- Silveira MM, Murch WS, Clark L, and Winstanley CA (2016). Chronic atomoxetine treatment during adolescence does not influence decision-making on a rodent gambling task, but does modulate amphetamine’s effect on impulsive action in adulthood. [DOI] [PubMed] [Google Scholar]
- Stalnaker TA, Berg B, Aujla N, and Schoenbaum G (2016). Cholinergic Interneurons Use Orbitofrontal Input to Track Beliefs about Current State. J. Neurosci 36, 6242–6257. [DOI] [PMC free article] [PubMed] [Google Scholar]
- Stevens L, Betanzos-Espinosa P, Crunelle CL, Vergara-Moragues E, Roeyers H, Lozano O, Dom G, Gonzalez-Saiz F, Vanderplasschen W, Verdejo-García A, et al. (2013). Disadvantageous Decision-Making as a Predictor of Drop-Out among Cocaine-Dependent Individuals in Long-Term Residential Treatment. Front. Psychiatry 4. [DOI] [PMC free article] [PubMed] [Google Scholar]
- Stevens L, Goudriaan AE, Verdejo-Garcia A, Dom G, Roeyers H, and Vanderplasschen W (2015). Impulsive choice predicts short-term relapse in substance-dependent individuals attending an in-patient detoxification programme. Psychological Medicine 45, 2083–2093. [DOI] [PubMed] [Google Scholar]
- Sutton RS, and Barto AG (1998). Reinforcement learning: An introduction (MIT press; Cambridge: ). [Google Scholar]
- Takahashi YK, Roesch MR, Wilson RC, Toreson K, O’Donnell P, Niv Y, and Schoenbaum G (2011). Expectancy-related changes in firing of dopamine neurons depend on orbitofrontal cortex. Nature Neuroscience 14, 1590–1597. [DOI] [PMC free article] [PubMed] [Google Scholar]
- Tomb I, Hauser M, Deldin P, and Caramazza A (2002). Do somatic markers mediate decisions on the gambling task? Nature Neuroscience 5, 1103–1104. [DOI] [PubMed] [Google Scholar]
- Watanabe S (2010). Asymptotic Equivalence of Bayes Cross Validation and Widely Applicable Information Criterion in Singular Learning Theory. Journal of Machine Learning Research 11, 3571–3594. [Google Scholar]
- Wilson RC, Takahashi YK, Schoenbaum G, and Niv Y (2014). Orbitofrontal Cortex as a Cognitive Map of Task Space. Neuron 81, 267–279. [DOI] [PMC free article] [PubMed] [Google Scholar]
- Zeeb FD, and Winstanley CA (2011). Lesions of the Basolateral Amygdala and Orbitofrontal Cortex Differentially Affect Acquisition and Performance of a Rodent Gambling Task. J. Neurosci 31, 2197–2204. [DOI] [PMC free article] [PubMed] [Google Scholar]
- Zeeb FD, Floresco SB, and Winstanley CA (2010). Contributions of the orbitofrontal cortex to impulsive choice: interactions with basal levels of impulsivity, dopamine signalling, and reward-related cues. Psychopharmacology 211, 87–98. [DOI] [PubMed] [Google Scholar]
- Zhang F, Xiao L, and Gu R (2017). Does Gender Matter in the Relationship between Anxiety and Decision-Making? Front. Psychol 8. [DOI] [PMC free article] [PubMed] [Google Scholar]