Abstract
OBJECTIVES
The aim of this work is the development of coronary atherosclerosis T1-weighted characterization with integrated anatomical reference (CATCH) technique and the validation by comparison with high-risk plaque features (HRPF) observed on intracoronary optical coherence tomography (OCT) and invasive coronary angiography.
BACKGROUND
T1-weighted cardiac magnetic resonance with or without contrast media has been used for characterizing coronary atherosclerosis showing promising prognostic value. Several limitations include: 1) coverage is limited to proximal coronary segments; 2) spatial resolution is low and often anisotropic; and 3) a separate magnetic resonance angiography acquisition is needed to localize lesions.
METHODS
CATCH acquired dark-blood T1-weighted images and bright-blood anatomical reference images in an interleaved fashion. Retrospective motion correction with 100% respiratory gating efficiency was achieved. Reference control subjects (n = 13) completed both pre- and post-contrast scans. Stable angina patients (n = 30) completed pre-contrast scans, among whom 26 eligible patients also completed post-contrast scans. After cardiac magnetic resonance, eligible patients (n = 22) underwent invasive coronary angiography and OCT for the interrogation of coronary atherosclerosis. OCT images were assessed and scored for HRPF (lipid-richness, macrophages, cholesterol crystals, and microvessels) by 2 experienced analysts blinded to magnetic resonance results.
RESULTS
Per-subject analysis showed none of the 13 reference control subjects had coronary hyperintensive plaques (CHIP) in either pre-contrast or post-contrast CATCH. Five patients had CHIP on pre-contrast CATCH and 5 patients had CHIP on post-contrast CATCH. Patients with CHIP had greater lipid abnormality than those without. Per-segment analysis showed elevated pre- and post-contrast plaque to myocardium signal ratio in the lesions with HRPF versus those without. Positive correlation was observed between plaque to myocardium signal ratio and OCT HRPF scoring. CHIP on pre-contrast CATCH were associated with significantly higher stenosis level than non-CHIP on invasive coronary angiography.
CONCLUSIONS
CATCH provided accelerated whole heart coronary plaque characterization with simultaneously acquired anatomical reference. CHIP detected by CATCH showed positive association with high-risk plaque features on invasive imaging studies.
Keywords: atherosclerosis, inflammation, intraplaque hemorrhage, magnetic resonance imaging, optical coherence tomography
Plaque rupture is the most common mechanism for acute coronary syndromes, accounting for approximately 70% of fatal acute myocardial infarctions and/or sudden coronary deaths (1). The detection of coronary plaques at high risk for rupture may improve the assessment of risk for acute coronary syndrome and facilitate therapeutic decision making (2).
Recently, T1-weighted (T1w) cardiac magnetic resonance (CMR) with (3) or without (4) contrast enhancement has been proposed for characterizing coronary atherosclerosis. Noguchi et al. (5) examined the signal intensity of coronary plaques on native T1w CMR from 568 patients with suspected or known coronary artery disease (CAD) and demonstrated that high intensity plaques are associated with higher risk of coronary events during a 6-year follow-up. Intraplaque hemorrhage, the primary suspect for causing coronary hyperintensive plaques (CHIP) on pre-contrast T1w CMR, is a potent atherogenic stimulus that contributes to the deposition of free cholesterol, macrophage infiltration, and enlargement of the necrotic core (6). Varma et al. (7) investigated the coronary wall enhancement by gadolinium in T1w CMR images from patients with CAD and patients with systemic lupus erythematosus and found that coronary wall contrast enhancement may serve as a direct marker for vessel wall injury and remodeling related to inflammation.
Despite the promising prognostic capability of T1w CMR for the assessment of coronary atherosclerosis, the current protocols using conventional Cartesian acquisition and navigator gating have several drawbacks that may hinder the clinical application of this technique. First, anatomical coverage is limited to only the proximal segments of coronary arteries. Second, current spatial resolution is low and anisotropic, leading to blurring and partial volume effects. Third, acquisition time is long and unpredictable, depending largely on the breathing pattern of the patient. Patient movement associated with prolonged scanning also causes considerable exclusion rate due to poor image quality (5). Lastly, because the background tissue in T1w CMR is heavily suppressed, a separate acquisition of bright-blood images is needed to provide the anatomical reference for identifying and localizing target lesions. This further lengthens the total scan time and requires additional steps of image registration.
The first aim of this study is to address the aforementioned limitations of conventional protocols by developing a highly efficient magnetic resonance (MR) imaging method for coronary artery plaque characterization, namely, coronary atherosclerosis T1-weighted characterization with integrated anatomical reference (CATCH). CATCH is designed to provide the following: 1) 3-dimensional whole-heart coverage; 2) isotropic high spatial resolution (1.13 mm3); and 3) simultaneously acquired dark-blood T1w images and anatomical reference images. The second aim of this study is to validate this new MR imaging technique by comparing it with high-risk plaque features observed on invasive coronary imaging studies.
METHODS
MR SEQUENCE DESIGN.
The proposed MR acquisition method was based on prospectively electrocardiogram-gated, inversion recovery (IR) prepared spoiled gradient echo (fast low angle shot) sequence with golden angle 3-dimensional radial trajectory (Figure 1A). The IR pulse was applied every other heartbeat, allowing interleaved acquisition of dark-blood T1w images and bright-blood anatomical reference images (Figure 1B). Slab-selective excitation pulses were used to suppress the tissue outside of the heart to reduce the streaking artifacts resulting from radial undersampling. Spectral adiabatic IR was used together with water-only excitation pulses to suppress the signal from epicardial fat. No respiratory gating was applied with all of the imaging data used for reconstruction (equivalent to 100% respiratory gating efficiency). Diaphragm navigator was turned on in “monitor-only” mode for monitoring patients’ breathing conditions during the scan. A flip-back pulse was applied immediately after IR pulse to restore the navigator signal.
FIGURE 1. Image Acquisition Strategy of the CATCH Technique.
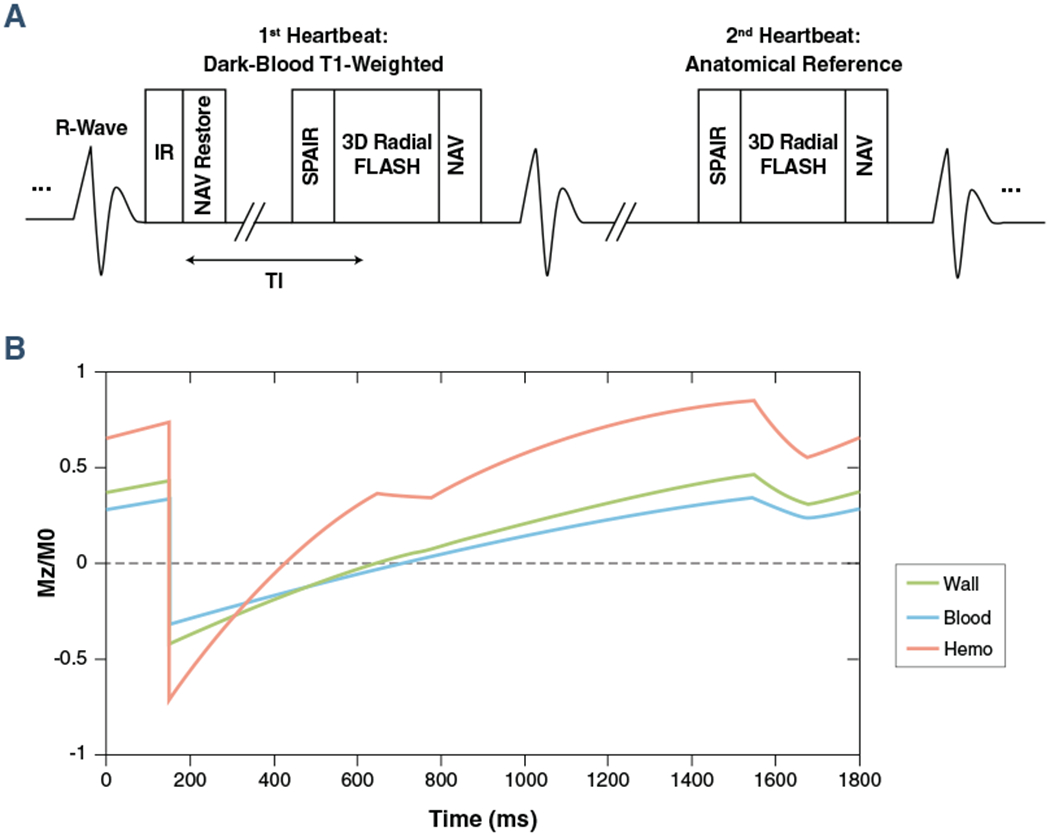
(A) Sequence diagram of coronary atherosclerosis T1-weighted characterization with integrated anatomical reference (CATCH) for accelerated 3-dimensional dark-blood T1-weighted coronary imaging with interleaved anatomical reference. (B) Simulated steady-state signal behavior of different tissue types (blood, normal vessel wall, and intraplaque hemorrhage). FLASH = fast low angle shot; IR = inversion recovery; NAV = navigator; SPAIR = spectral adiabatic inversion recovery; TI = time interval.
MR RECONSTRUCTION SCHEME.
An image-based retrospective affine motion correction algorithm was used to correct for respiratory motion between different bins with an integrated self-calibrating iterative sensitivity-encoding scheme (Figure 2) (8). Both dark-blood and bright-blood k-space data were segmented into 6 respiratory bins using the navigator signal as the consistent criteria. Breathing motion parameters were estimated based on the bright-blood data, which had higher signal to noise ratio. Because of the same binning criteria, intra-bin motions in both dark-blood and bright-blood k-space data were assumed identical. Therefore the same motion correction transformation could be applied for both dark-blood and bright-blood images.
FIGURE 2. Image Reconstruction Strategy of the CATCH Technique.
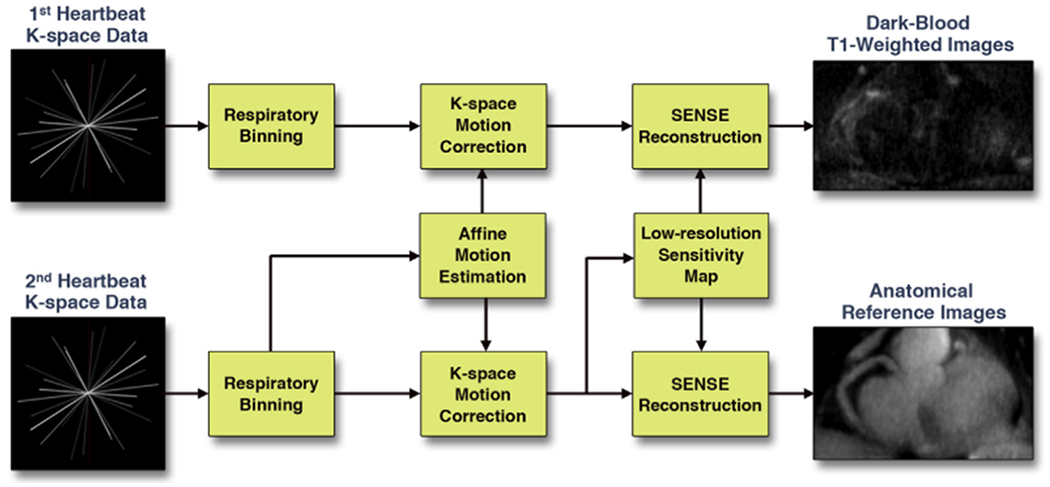
The schematic flow chart shows the image reconstruction processes for interleaved dark-blood T1-weighted images and bright-blood anatomical reference images. Motion compensation and parallel imaging were integrated in the joint reconstruction utilizing the high signal to noise ratio of the anatomical reference magnetic resonance data. CATCH = coronary atherosclerosis T1-weighted characterization with integrated anatomical reference; SENSE = sensitivity encoding.
ENROLLMENT CRITERIA.
The study protocol was approved by the institutional review boards of both participating institutions. Informed consent was obtained from each subject before being enrolled in the study. Healthy volunteers (n = 13) with no known CAD were recruited for the control group. Consecutive patients (n = 30) with new-onset or recurrent stable chest pain for whom coronary catheterization were planned were enrolled into the patient group.
Exclusion criteria for this study were the following: 1) acute coronary syndrome (acute myocardial or unstable angina); 2) history of coronary revascularization (coronary bypass graft surgery, and/or percutaneous coronary intervention); 3) claustrophobia; 4) renal insufficiency with estimated glomerular filtration rate <45 ml/min/1.73 m2 (for post-contrast MR); or 5) known allergy to gadolinium-based contrast media (for post-contrast MR). Specific control and patient characteristics are summarized in Table 1.
TABLE 1.
Control and Patient Characteristics
| Control Subjects (n = 13) | Patients (n = 30) | p Value | |
|---|---|---|---|
| Age, yrs | 36 ± 15 | 62 ± 10 | <0.0001 |
| Male | 6 (46) | 23 (77) | <0.0001 |
| BMI, kg/m2 | 23.2 ± 2.4 | 24.0 ± 2.4 | 0.034 |
| Diabetes mellitus | 0 (0) | 6 (20) | <0.0001 |
| Dyslipidemia | 0 (0) | 24 (80) | <0.0001 |
| Heart rate, beats/min | 66.2 ± 6.6 | 65.8 ± 8.9 | 0.865 |
| History of MI | 0 (0) | 1 (3) | 0.326 |
| Medications | |||
| Aspirin | 1 (7.7) | 30 (100) | <0.0001 |
| Beta-blocker | 0 (0) | 10 (33) | 0.00067 |
| Statin | 0 (0) | 24 (80) | <0.0001 |
Values are mean ± SD or n (%).
BMI = body mass index; MI = myocardial infarction.
MR IMAGING PROTOCOL.
In vivo MR imaging was performed on clinical 3-T scanners (MAGNETOM Verio and MAGNETOM Trio, Siemens AG Healthcare, Erlangen, Germany) with 12-channel body matrix receiver coil. Preparatory scans were performed before the CATCH sequence including the following steps: 1) low-resolution 2-dimensional survey images with multiple orientations to localize the heart; 2) multiecho gradient echo sequence for cardiac shimming; and 3) free-breathing 4-chamber cine images of the heart to determine the trigger delay time when the motion of the coronary arteries was minimal.
Pre-contrast CATCH sequence was executed with the following parameters: 3-dimensional sagittal slab covering the entire heart with field-of-view = 3303 mm3; matrix size = 2883; spatial resolution = 1.13 mm3; flip angle = 12°; repetition time/echo time = 4.6/2.3 ms; inversion time interval = 580 ms, applied every other heartbeat; bandwidth = 721 Hz/pixel; total number of radial projections = 8,500; acquisition time was approximately 10 min depending on heart rate. Immediately after the pre-contrast imaging, gadoterate meglumine (Dotarem, Guerbet, Bloomington, Indiana) was injected intravenously with the dose of 0.1 mmol/kg bodyweight at the injection rate of 2 ml/s, followed by 20 ml of saline flush. After 25 min of delay time to allow contrast media to wash out, a Look-Locker type sequence (9) was used to determine the optimal inversion time interval (typically about 270 ms) to null the blood pool signal. The post-contrast CATCH sequence was executed using the identical parameters as the pre-contrast one, but employing patient-specific inversion time intervals.
ICA AND OCT IMAGING PROTOCOL.
After completing CMR, 22 eligible patients underwent invasive coronary angiography (ICA) and intracoronary optical coherence tomography (OCT) for plaque evaluation within 5 days. OCT was performed in selected coronary arteries based on ICA findings with either the M2 or the C7-XR imaging systems (LightLab Imaging, Inc., St. Jude Medical, St. Paul, Minnesota). An occlusion catheter was positioned proximally and an imaging catheter was positioned distally. During imaging acquisition, an occlusion balloon (Helios, Avantec Vascular Corp., Sunnyvale, California) was inflated to 0.4 to 0.6 atm and lactated Ringer solution was infused at 0.5 to 1.0 ml/s. In the M2 system, the imaging catheter was pulled from distal to proximal with a motorized pullback system at 1.0 mm/s. In the C7-XR system, the pullback speed was 20 mm/s due to the system’s faster frame rate (100 frame/s). Contrast medium was continuously flushed through a guiding catheter at the rate of 4 to 5 ml/s for 3 to 4 s. Images from were acquired and stored digitally for subsequent analysis.
IMAGE ANALYSIS.
CATCH images were reviewed on a clinical workstation (Leonardo, Siemens AG Healthcare, Erlangen, Germany) with consensus reading by 2 experienced observers (Y.X. and Q.Y.) who were blinded to patient information and invasive imaging results. Fusion images were created on the workstation by overlaying the dark-blood T1w images onto the reference images using the Fusion functionality. Region of interest analysis was performed on the T1w images with anatomical reference images and fusion images displayed simultaneously to localize the coronary arteries. In total, 30 coronary segments that had coronary plaque by invasive angiography and matched OCT data available for comparison were evaluated. Plaque to myocardial ratio (PMR), defined as the signal intensity of the coronary plaque normalized by the signal intensity of adjacent myocardium, was measured on both pre-contrast and post-contrast images using the method previously described (4). Full dynamic window level was used for display and actual signal intensity was used for quantification. According to Noguchi et al. (5), lesions with PMR value >1.4 were considered CHIP.
All OCT images were analyzed by 2 experienced analysts who were blinded to MR analysis results. Cross-sectional OCT images were analyzed at 1-mm intervals using a dedicated software program (QIVUS, Medis Medical Imaging Systems, Inc., Leiden, the Netherlands). OCT images were assessed qualitatively for 4 major high-risk plaque features: 1) large lipid pools, defined as signal-poor regions with diffuse borders (10); 2) macrophage clusters, defined as multiple strong back reflections resulting in a high signal variance in the area (11); 3) cholesterol crystals, defined as oriented, linear, highly reflecting structures within the plaques (12); and 4) microvessels, defined as the well-delineated low backscattering structures <200 μm in diameter and showing a trajectory within the vessel (13). Each feature was scored based on the following diagnostic confidence scale: 1 = negative; 2 = likely negative; 3 = unsure; 4 = likely positive; 5 = positive.
STATISTICAL ANALYSIS.
All statistical analysis was performed in R statistical programming language version 3.0.3 (The R Foundation for Statistical Computing, Vienna, Austria). A 2-tailed 2-sample heteroscedastic Student t test was performed between OCT-positive (score ≥4) and OCT-negative (score ≤3) segments for pre-contrast and post-contrast PMR after verification of data normality with Shapiro-Wilk test. Categorical variables were analyzed using Fisher exact test or the chi-square test as appropriate. Pearson correlation analysis was performed between OCT scoring and PMR values. All numerical data are presented in the format of mean ± SD (normally distributed data) or median and interquartile range (non-normally distributed data) and statistical difference was considered significant when p was <0.05.
RESULTS
PER-PATIENTS ANALYSIS.
All 13 subjects in the control group successfully completed both the pre-contrast and post-contrast CATCH scans. All 30 patients completed the pre-contrast CATCH scan, among which 26 eligible patients also completed the post-contrast CATCH scan. The ineligible patients for the post-contrast CATCH included ones with known allergy to contrast media (n = 1), inability to continue the scan due to claustrophobia (n = 2), and insufficient renal function (n = 1). The average scan time of each CATCH scan was 10.4 ± 1.1 min.
Based on PMR cutoff value of 1.4 (5), no CHIP was found in the control group on either pre-contrast or post-contrast CATCH images. Five patients (5 of 30, 16.7%) and 5 patients (5 of 26, 19.2%) had CHIP on pre-contrast CATCH and post-contrast CATCH, respectively, among which 3 patients (3 of 26, 11.5%) had CHIP on both.
Table 2 summarizes the clinical characteristics comparison among patients with no CHIP [CHIP (−)], pre-contrast CHIP [CHIP (pre)], and post-contrast CHIP [CHIP (post)]. Notably, the CHIP (pre) group had significantly higher low-density lipoprotein level (+34%) and higher total cholesterol level (+19%) than the CHIP (−) group. The CHIP (pre) and CHIP (post) groups also had slightly lower body mass index (−7.7%).
TABLE 2.
Patient Characteristics Categorized by CMR
| CHIP (−) (n = 23) | CHIP (pre) (n = 5) | p Value | CHIP (post) (n = 5) | p Value | |
|---|---|---|---|---|---|
| Age, yrs | 62 ± 11 | 63 ± 8 | 0.395 | 65 ± 9 | 0.301 |
| Male | 18 (78) | 4 (80) | 0.469 | 3 (60) | 0.489 |
| BMI, kg/m2 | 25.4 ± 2.5 | 23.7 ± 0.7 | 0.0079 | 23.6 ± 0.7 | 0.0078 |
| Diabetes mellitus | 5 (22) | 1 (20) | 0.469 | 1 (20) | 0.469 |
| Smoking | 17 (74) | 3 (60) | 0.287 | 2 (40) | 0.173 |
| Dyslipidemia | 19 (83) | 3 (60) | 0.211 | 3 (60) | 0.211 |
| Heart rate, beats/min | 66.7 ± 9.1 | 65.2 ± 7.0 | 0.356 | 60.6 ± 7.4 | 0.094 |
| Systolic BP, mm Hg | 127 ± 13 | 138 ± 21 | 0.201 | 132 ± 18 | 0.356 |
| Diastolic BP, mm Hg | 76.2 ± 9.0 | 83 ± 8.9 | 0.101 | 81 ± 8 | 0.161 |
| HDL, mg/dl | 39.1 ± 8.8 | 37.8 ± 8.9 | 0.397 | 36.0 ± 7.1 | 0.231 |
| LDL, mg/dl | 90.7 ± 34.8 | 121.4 ± 22.2 | 0.025 | 108.4 ± 31.9 | 0.178 |
| T-chol, mg/dl | 161.0 ± 34.4 | 191.8 ± 25.4 | 0.037 | 166.0 ± 38.2 | 0.409 |
| Triglycerides, mg/dl | 144.5 ± 67.8 | 145.5 ± 69.7 | 0.415 | 132.4 ± 48.9 | 0.342 |
| History of MI | 1 (4) | 0 (0) | 0.164 | 0 (0) | 0.164 |
| Creatinine, mg/dl | 0.91 ± 0.24 | 1.06 ± 0.39 | 0.237 | 1.07 ± 0.44 | 0.253 |
| CRP, mg/dl | 3.77 ± 6.48 | 5.50 ± 4.71 | 0.299 | 2.58 ± 3.04 | 0.309 |
| Medications | |||||
| Aspirin | 23 (100) | 5 (100) | NA | 5 (100) | NA |
| Beta-blocker | 8 (35) | 2 (40) | 0.489 | 0 (0) | 0.001 |
| Statin | 20 (87) | 2 (40) | 0.064 | 3 (60) | 0.171 |
Values are mean ± SD or n (%).
BP = blood pressure; CHIP = coronary hyperintensive plaque; CMR = cardiac magnetic resonance; CRP = C-reactive protein; HDL = high-density lipoprotein; LDL = low-density lipoprotein; NA = not available; T-chol = total cholesterol; other abbreviations as in Table 1.
PER-SEGMENT ANALYSIS.
The whole-heart coverage and fine spatial resolution by CATCH enabled the examination of the entire coronary circulation, including the mid-distal segments that were previously not accessible. Table 3 summarizes the localization of the segments (n = 30) that had complete data sets (MR, ICA, and OCT) according to the presence of CHIP.
TABLE 3.
Localization of the Examined Coronary Segments
| LM | LAD | LCX | Dg | RCA | ||||||
|---|---|---|---|---|---|---|---|---|---|---|
| Location | Proximal | Mid | Distal | Proximal | Distal | Proximal | Mid | Distal | ||
| Total | 1 | 4 | 13 | 0 | 3 | 3 | 1 | 2 | 1 | 2 |
| CHIP (pre) | 1/1 | 1/4 | 2/13 | 0/0 | 0/3 | 0/3 | 1/1 | 0/2 | 0/1 | 0/2 |
| CHIP (post) | 0/1 | 1/4 | 2/13 | 0/0 | 0/3 | 0/3 | 1/1 | 1/2 | 0/1 | 0/2 |
Values are n or n/n.
CHIP = coronary hyperintensive plaque; Dg = diagonal branch; LM = left main; LAD = left anterior descending; LCX = left circumflex; RCA = right coronary artery.
Figure 3 shows a representative patient case with a CHIP on pre-contrast CATCH images. Pre-contrast T1w images showed a CHIP at mid LAD as localized on the anatomical reference images. ICA showed significant stenosis (70%) at the same location. On the computed tomography angiography the lesion appeared to be a noncalcified plaque with “napkin-ring sign” attenuation pattern. OCT image showed large signal-poor area suggestive of possible lipid core or intraplaque hemorrhage (yellow arrows).
FIGURE 3. Representative Case of a Suspected CAD Patient With a CHIP in the Mid LAD on Pre-Contrast CATCH.
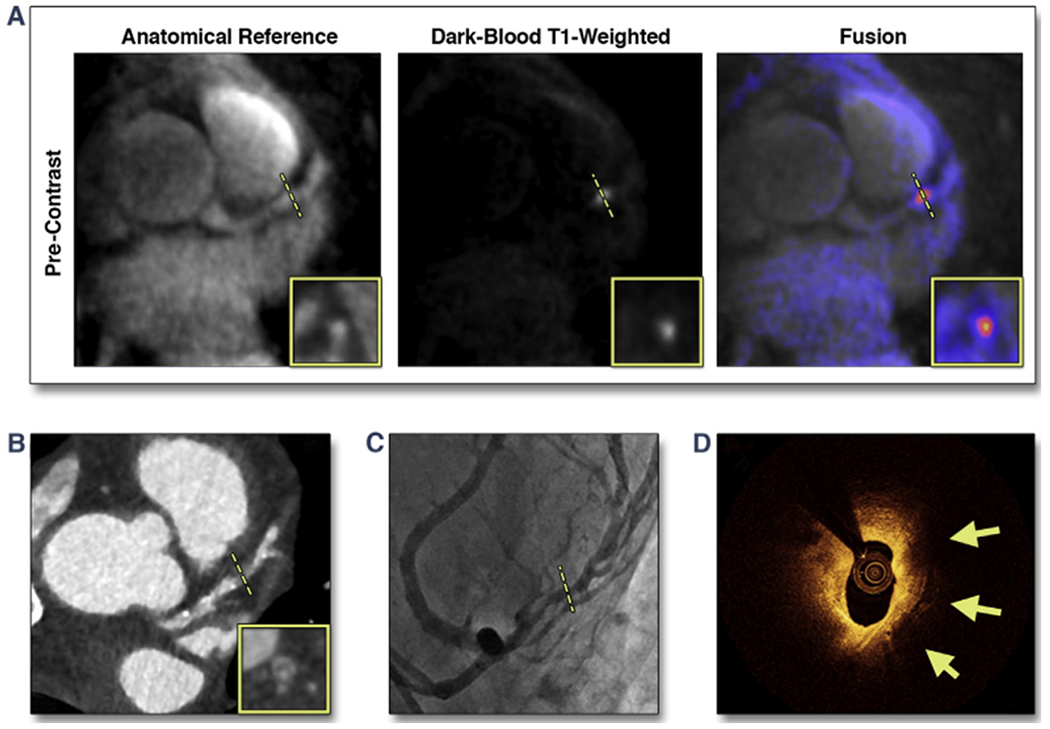
(A) Pre-contrast T1-weighted, anatomical reference and fusion images. (B) Computed tomography angiography. (C) X-ray angiography. (D) Optical coherence tomography cross-sectional image at the corresponding location of the coronary hyperintensive plaque (CHIP) on coronary atherosclerosis T1-weighted characterization with integrated anatomical reference (CATCH). Arrows point to signal-poor regions, suggesting a large lipid pool. Dotted lines represent the location and orientation of the cross-sectional images at the lesion which are shown in boxes. CAD = coronary artery disease; LAD = left anterior descending.
Figure 4 shows a different representative patient case with a CHIP on post-contrast T1w CATCH. Pre-contrast T1w images showed no CHIP. Post-contrast T1w showed diffused wall enhancement at proximal right coronary artery as localized on the anatomical reference images. Corresponding x-ray angiography showed only mild stenosis (30%) at proximal right coronary artery. Computed tomography angiography showed marked positive modeling at the location of the stenosis. OCT image showed strong multifocal back reflections and signal heterogeneity within the overlying tissue suggestive of high macrophage density (yellow arrows).
FIGURE 4. Representative Case of a Suspected CAD Patient With a CHIP in the Proximal RCA on Post-Contrast CATCH.
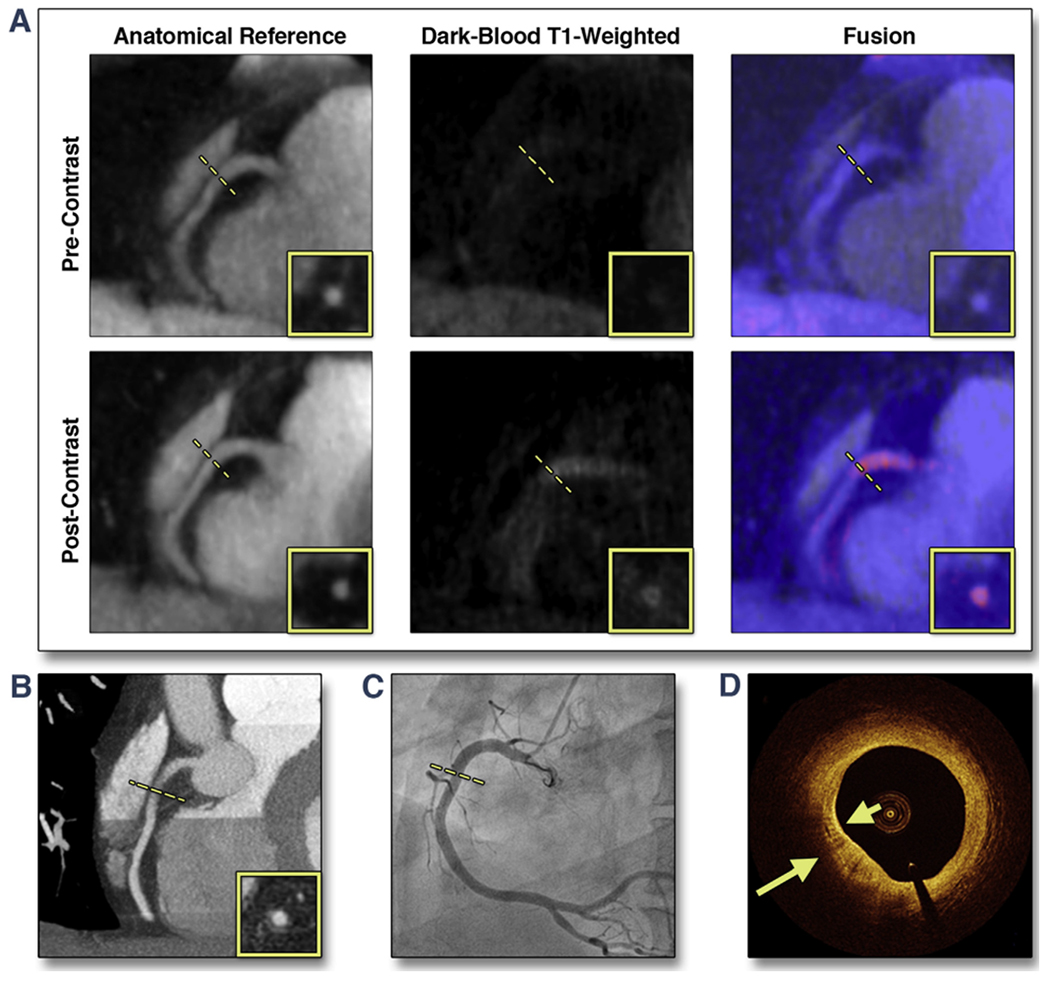
(A) Pre- and post-contrast T1-weighted, anatomical reference and fusion images. (B) Computed tomography angiography. (C) X-ray angiography. (D) Optical coherence tomography cross-sectional image at the corresponding location of the CHIP on CATCH. Arrows point to areas with multiple strong back reflections, suggesting macrophage clusters. Dotted lines represent the location and orientation of the cross-sectional images at the lesion which are shown in boxes. RCA = right coronary artery; other abbreviations as in Figure 3.
Figure 5 shows the relationship between PMR on CATCH and OCT classifications. Significantly elevated pre-contrast PMR was observed in coronary lesions with large lipid pools, multiple macrophages clusters, and presence of cholesterol crystals. Significantly elevated post-contrast PMR was observed in lesions with multiple macrophages clusters and presence of microvessels.
FIGURE 5. Relationship Between PMR and OCT Classifications.
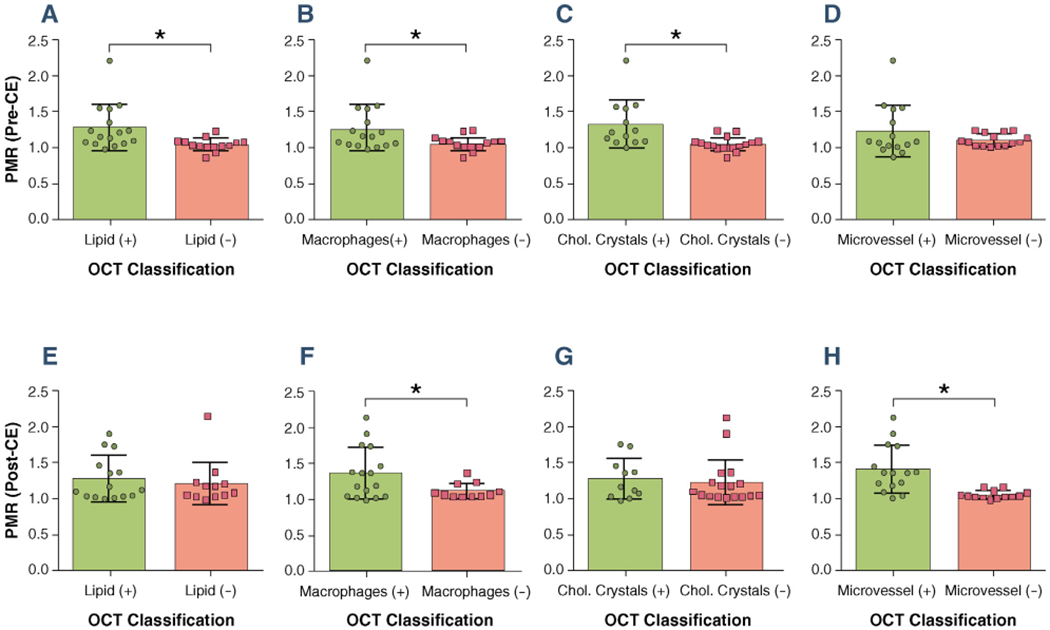
Coronary plaques with high-risk features as classified by optical coherence tomography (OCT) tended to be hyperintensive on coronary atherosclerosis T1-weighted characterization with integrated anatomical reference images. (A to D) Pre-contrast plaque to myocardium signal ratio (PMR) versus OCT classifications. (E to H) Post-contrast PMR versus OCT classifications. Error bars represent standard deviation. Positive sign (+) and negative sign (−) denote lesion groups with corresponding OCT grading. Star signs (*) denote statistical significance (p < 0.05). CE = contrast enhancement; Chol. = cholesterol.
Figure 6 shows the results of the correlation analysis between OCT plaque risk score and PMR values. A moderate, but significant positive correlation was found between pre-contrast PMR and OCT risk score (r = 0.58, p = 0.0012), as well as post-contrast PMR and OCT risk score (r = 0.56, p = 0.0016). When we combined pre- and post-contrast PMR, we found stronger correlation with OCT scores (r = 0.68, p = 0.000052), which suggested that there might be additional value in performing both pre- and post-contrast CATCH.
FIGURE 6. Analysis of Correlation Between OCT Scoring and PMR Values.
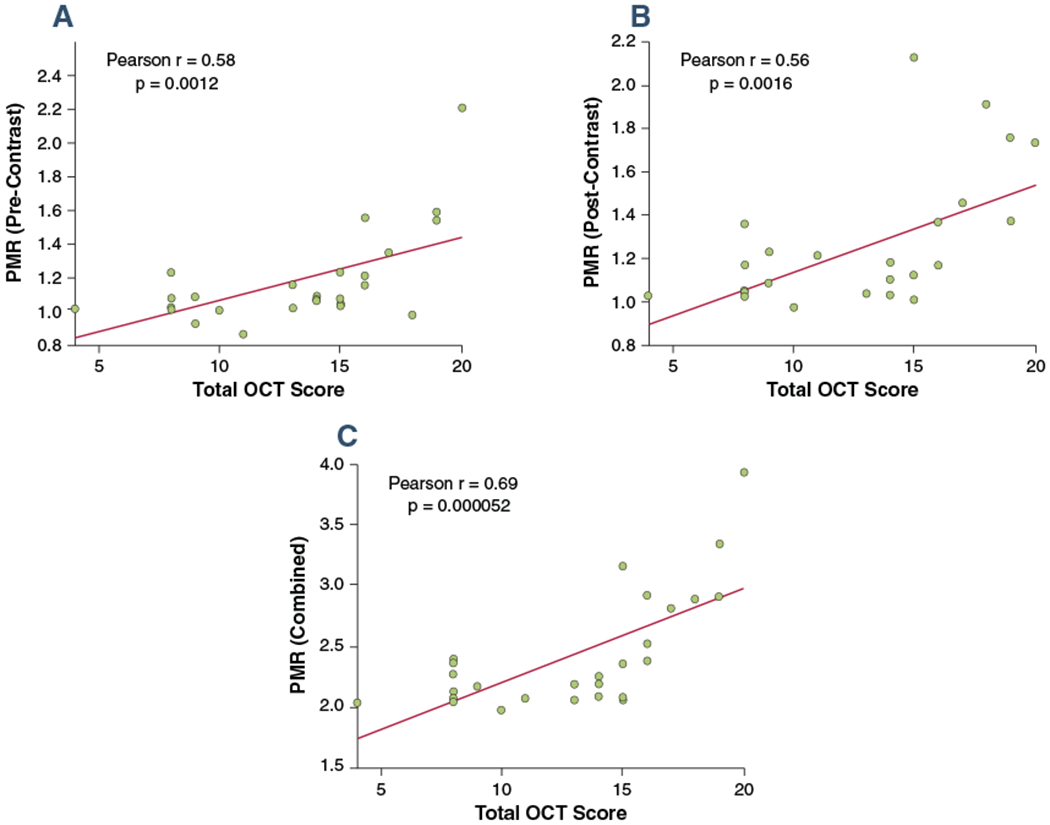
(A) Correlation between OCT high-risk plaque feature scoring and pre-contrast PMR values. (B) Correlation between OCT high-risk plaque feature scoring and post-contrast PMR values. (C) Correlation between OCT high-risk plaque feature scoring and combined pre- and post-contrast PMR values. Abbreviations as in Figure 5.
Based on the ICA results of all 30 patients, pre-contrast CHIP had significantly higher degree of luminal stenosis than did plaques without pre- or post-contrast hyperintensity (median 75% vs. 60%; p = 0.005). However, there was no significant difference between post-contrast CHIP and plaques without hyperintensity. Figure 7 shows the distribution of stenosis levels of the examined lesions categorized in terms of plaque hyperintensity.
FIGURE 7. Relationship Between MR Signal Hyperintensity and Stenosis Level.
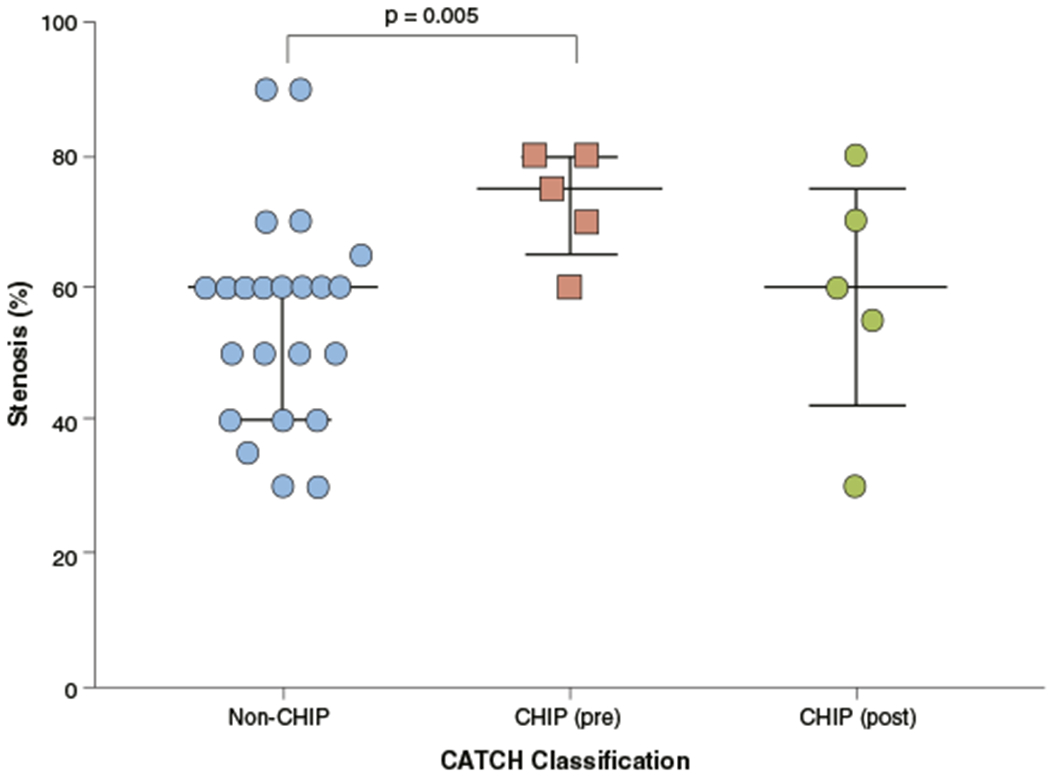
Based on invasive coronary angiography (n = 30), pre-contrast CHIP had significantly higher lesion stenosis level than non-CHIP. Error bars represent interquartile range. Abbreviations as in Figure 3.
DISCUSSION
TECHNICAL IMPROVEMENTS.
CATCH imaging technique developed in this work is the first MR method to enable coronary plaque characterization with simultaneously acquired bright-blood reference images. The reference images were acquired along with dark-blood T1w images in an interleaved fashion; therefore they were inherently coregistered to each other. This design provides potential benefits for its clinical applications. First, no additional image-registration steps were required and perfectly matched fusion images could be generated easily by overlaying the 2 sets of images. Second, no additional bright-blood scan such as MR angiography was needed to help localizing lesions. Therefore, the entire protocol could be shortened, which could potentially facilitate the clinical application of coronary plaque T1w imaging.
The CATCH technique allowed accelerated imaging of the entire coronary artery system. Whole-heart coverage and fine isotropic resolution were achieved with scan time of approximately 10 min. This now more easily enables integration into a routine clinical protocol that was not possible before. In comparison, a conventional navigator gated Cartesian scan with similar coverage and spatial resolution is estimated to require scan time of about 40 min, depending on the patient’s breathing pattern. Based on our experience, such protocol would not be clinically feasible due to patient discomfort and motion-induced image quality degradation. The accelerated acquisition by CATCH was achieved in 2 aspects. First, respiratory motion was corrected retrospectively to allow the utilization of all k-space data for image reconstruction, which was equivalent to having 100% efficiency in navigator gating. Second, a higher level of undersampling can be tolerated by radial acquisition (factor of 3.7 in this application) than conventional Cartesian acquisition (typical factor of 2 with parallel imaging), because undersampling in radial acquisition has “noise-like” streaking artifacts, whereas undersampling in Cartesian acquisition results in ghosting. In this application, the streaking artifacts were also largely suppressed by the iterative sensitivity encoding reconstruction.
CLINICAL IMPLICATIONS.
This is also the first study to show that CHIP on both pre-contrast (native) and post-contrast T1w CMR were associated with high risk plaque features detected by OCT imaging in patients with stable angina pectoris. Previously, several groups have investigated the nature of native CHIP by comparing it with other imaging modalities. The study by Kawasaki et al. (4) demonstrated that pre-contrast hyperintensity on MR was typically associated with ultrasound attenuation on intravascular ultrasound, remarkably low x-ray attenuation on coronary computed tomography angiography, and positive remodeling, all of which suggested high-risk lesions. More recently, Matsumoto et al. (14) showed that native intrawall hyperintensity was associated with macrophage accumulation as assessed by OCT, which is consistent with the results in our study. In addition, we also found the association between native CHIP and cholesterol crystals. Jansen et al. (15) showed that CHIP correctly identified intracoronary thrombus in 9 of 10 patients recently presenting with acute coronary syndrome. Similar finding was also observed by Ehara et al. (16) using OCT comparison, though only in a small number of patients. However, we were not able to establish such a link between native CHIP and intracoronary thrombus in this study, as none of the patients presented with thrombus during OCT imaging. This was likely due to the fact that the patients enrolled in this study consisted of a more stable population, as we excluded all subjects with acute symptoms including acute coronary syndrome.
Although CHIP on pre- and post-contrast CATCH both resulted from shortened T1 in the plaque tissue, it is important to note the different mechanisms leading the 2 types of CMR hyperintensity. Pre-contrast T1w hyperintensity stems from endogenous source(s) with inherent short T1. Among different plaque tissue types, methemoglobin from recent intraplaque hemorrhage/thrombus and lipids from necrotic cores are most likely contributors to the elevated native CMR signal. Though no study on coronary plaques is currently available with histopathological validation, extensive evidence from carotid plaque studies on endarterectomy specimen has pointed to intraplaque hemorrhage as the major source of native hyperintensity on CMR (17). The preliminary comparison with OCT imaging in our study suggested that the CHIP on the pre-contrast T1w images were associated with large lipid pools. Unfortunately, currently, there is no standard imaging method to detect intraplaque hemorrhage in vivo.
Post-contrast T1w hyperintensity, on the other hand, results from exogenous cause of T1 shortening, in other words, the residual gadolinium contrast media in the coronary vessel wall. Previous studies suggested that post-contrast CHIP are caused by endothelial leakiness (18) commonly associated with neovascularization and vascular inflammation. Yeon et al. (19) examined post-contrast CHIP in CAD patients and found increasing prevalence of coronary artery wall contrast enhancement with increasing severity of plaque calcification by multislice computed tomography and correlation with lumen stenosis by ICA. Varma et al. (7) found significantly higher contrast-to-noise ratio and total enhanced area in CAD patients and patients with systemic lupus erythematosus compared with healthy control subjects. In this study, our observation was in line with previous reports, as we found the associations among post-contrast enhancement, macrophage clusters (inflammation), and microvessels (vessel remodeling) as seen on OCT. However, it is important to note that currently the exact mechanism of plaque contrast enhancement is still not fully understood and histological verification is needed.
STUDY LIMITATIONS.
First, the sample size in this study, particularly the number of positive cases, remains small. The preliminary findings in this study, although found to be statistically significant, have to be further validated in a larger clinical study. Second, CATCH is designed to largely suppress tissue types with normal range of T1 and facilitate the identification of CHIP as they appeared as “hot spots” among mostly dark background tissue. However, it also made it hard to identify plaques that were not hyperintense and therefore could not reliably evaluate global plaque burden. The bright-blood reference images, although sufficient for anatomical localization, may not have the ideal image contrast as a dedicated CMR angiography. Third, no histopathological data was available in this study to precisely verify the components in the native and post-contrast CHIP. In particular, macrophage accumulation was not quantified or rigorously validated. Therefore, the results should be interpreted with caution. Lastly, CMR imaging visualizes the entire wall, albeit with a limited spatial resolution, whereas OCT could only assess the superficial layers of the vessel wall due to the limited optical penetration. Nevertheless, OCT is acknowledged as among the most reliable tools for coronary plaque characterization. Moreover, as the most important morphological determinants of plaque vulnerability are superficial, the region of greatest interest was still within the imaging range of the current OCT system. We consider, therefore, that the quality of both coronary CMR and OCT data obtained in this study is sufficiently high to support our conclusion.
The concept of using PMR to quantify plaque hyperintensity requires further studies. First, the best cutoff PMR threshold of CHIP for risk stratification is still not clear. A previous study by Noguchi et al. (5) has demonstrated that pre-contrast PMR cutoff value of 1.4 provides the best prognostic accuracy. However, no consensus has been reached, and PMR cutoff of 1.0 has also been used by others in recent studies (4,14). No study has yet investigated the appropriate PMR cutoff value for post-contrast CMR based on outcome data. Second, PMR is normalized by myocardial signal intensity, which may be perturbed due to pathophysiology and/or acquisition-related factors such inversion time, flip angle, and the frequency of IR pulses. Therefore the variability and reliability of PMR also requires further investigation.
Future technical improvements for the proposed CATCH technique are possible on the following aspects. First, methods to improve lumen-to-tissue contrast such as T2 preparation may be applied to the bright-blood acquisition to facilitate the detection of stenosis. Second, the image reconstruction of CATCH was performed off the scanner and took more than 2 h per patient. Further work is needed to implement the process on the scanner and reduce the reconstruction time. Third, the current analysis of CATCH images was based on manual regions of interest, which could introduce user variability. Future work may utilize the registered bright-blood images to segment the coronary arteries and detect CHIP on the dark-blood images automatically.
CONCLUSIONS
The proposed CATCH technique enabled accelerated T1w whole-heart coronary plaque imaging with fine isotropic resolution and simultaneously acquired anatomical reference. The preliminary comparison with invasive imaging studies demonstrated the association between CHIP on CATCH and high-risk atherosclerotic plaque features on OCT and ICA.
PERSPECTIVES.
COMPETENCY IN MEDICAL KNOWLEDGE:
The proposed CATCH technique provided accelerated whole heart MR coronary plaque characterization with integrated anatomical reference. Hyperintensity on CATCH was found to be positively associated with high-risk plaque features on OCT and greater lipid abnormality. CATCH can potentially serve as a noninvasive, nonradiation imaging tool to determine the riskiness of coronary lesions.
TRANSLATIONAL OUTLOOK:
Image reconstruction and the qualification of plaque hyperintensity have to be faster and more automated before this technique can be applied in a larger patient population. Further studies are needed to establish the ideal cutoffs of pre- and post-contrast PMR for risk stratification before they can be used as fully quantitative imaging biomarkers.
Acknowledgments
This work was supported by grants from the National Heart, Lung, and Blood Institute (R01HL096119), American Heart Association (15SDG25710441), National Science Foundation of China (81322022, 81229001), and Leading Foreign Research Institute Recruitment Program through the National Research Foundation of Korea funded by the Ministry of Science, ICT and Future Planning (2012027176). Dr. Bairey Merz has received consulting fees from Gilead, Medscape, and Research Triangle Institute International; fees for lectures to Beaumont Seventh Annual Heart Disease, Complex Cardio Catheter Therapeutics, European Horizon, Florida Hospital, Fifth Annual Flagstaff Cardiology Symposium, Inova Health System Symposium, Korean Cardiology Society, Primary Care Physician Symposium, Practice Point Communications, Valley Health Grand Rounds, Vascular Biology Working Group, University of Colorado, University of Utah, Washington University Grand Rounds, Women Heart, Harold Buchwald Heart Health, and Tufts Nicholson Lecture; and grants from Women’s Ischemia Study Evaluation, Ranolazine Women’s Ischemic Syndrome Evaluation, Microvascular, Normal Control, and Flight Attendant Medical Research Institute. All other authors have reported that they have no relationships relevant to the contents of this paper to disclose.
ABBREVIATIONS AND ACRONYMS
- CAD
coronary artery disease
- CATCH
coronary atherosclerosis T1-weighted characterization with integrated anatomical reference
- CHIP
coronary hyperintensive plaque
- CMR
cardiac magnetic resonance
- ICA
invasive coronary angiography
- IR
inversion recovery
- OCT
optical coherence tomography
- PMR
plaque to myocardium signal intensity ratio
- T1w
T1-weighted
REFERENCES
- 1.Naghavi M, Libby P, Falk E, et al. From vulnerable plaque to vulnerable patient: a call for new definitions and risk assessment strategies: Part I. Circulation 2003;108:1664–72. [DOI] [PubMed] [Google Scholar]
- 2.Motoyama S, Ito H, Sarai M, et al. Plaque characterization by coronary computed tomography angiography and the likelihood of acute coronary events in mid-term follow-up. J Am Coll Cardiol 2015;66:337–46. [DOI] [PubMed] [Google Scholar]
- 3.Maintz D, Ozgun M, Hoffmeier A, et al. Selective coronary artery plaque visualization and differentiation by contrast-enhanced inversion prepared MRI. Eur Heart J 2006;27:1732–6. [DOI] [PubMed] [Google Scholar]
- 4.Kawasaki T, Koga S, Koga N, et al. Characterization of hyperintense plaque with noncontrast T(1)-weighted cardiac magnetic resonance coronary plaque imaging: comparison with multislice computed tomography and intravascular ultrasound. J Am Coll Cardiol Img 2009;2:720–8. [DOI] [PubMed] [Google Scholar]
- 5.Noguchi T, Kawasaki T, Tanaka A, et al. High-intensity signals in coronary plaques on noncontrast T1-weighted magnetic resonance imaging as a novel determinant of coronary events. J Am Coll Cardiol 2014;63:989–99. [DOI] [PubMed] [Google Scholar]
- 6.Kolodgie FD, Gold HK, Burke AP, et al. Intraplaque hemorrhage and progression of coronary atheroma. N Engl J Med 2003;349:2316–25. [DOI] [PubMed] [Google Scholar]
- 7.Varma N, Hinojar R, D’Cruz D, et al. Coronary vessel wall contrast enhancement imaging as a potential direct marker of coronary involvement: integration of findings from CAD and SLE patients. J Am Coll Cardiol Img 2014; 7:762–70. [DOI] [PMC free article] [PubMed] [Google Scholar]
- 8.Pang J, Sharif B, Arsanjani R, et al. Accelerated whole-heart coronary MRA using motion-corrected sensitivity encoding with threedimensional projection reconstruction. Magn Reson Med 2015;73:284–91. [DOI] [PMC free article] [PubMed] [Google Scholar]
- 9.Look DC, Locker DR. Time saving in measurement of NMR and EPR relaxation times. Rev Sci Instrum 1970;41:250–1. [Google Scholar]
- 10.Yabushita H, Bouma BE, Houser SL, et al. Characterization of human atherosclerosis by optical coherence tomography. Circulation 2002; 106:1640–5. [DOI] [PubMed] [Google Scholar]
- 11.MacNeill BD, Jang IK, Bouma BE, et al. Focal and multi-focal plaque macrophage distributions in patients with acute and stable presentations of coronary artery disease. J Am Coll Cardiol 2004; 44:972–9. [DOI] [PubMed] [Google Scholar]
- 12.Tearney GJ, Jang IK, Bouma BE. Optical coherence tomography for imaging the vulnerable plaque. J Biomed Opt 2006;11:021002. [DOI] [PMC free article] [PubMed] [Google Scholar]
- 13.Gonzalo N, Serruys PW, Okamura T, et al. Optical coherence tomography patterns of stent restenosis. Am Heart J 2009;158:284–93. [DOI] [PubMed] [Google Scholar]
- 14.Matsumoto K, Ehara S, Hasegawa T, et al. Localization of coronary high-intensity signals on T1-weighted MR imaging: relation to plaque morphology and clinical severity of angina pectoris. J Am Coll Cardiol Img 2015;8:1143–52. [DOI] [PubMed] [Google Scholar]
- 15.Jansen CH, Perera D, Makowski MR, et al. Detection of intracoronary thrombus by magnetic resonance imaging in patients with acute myocardial infarction. Circulation 2011;124:416–24. [DOI] [PubMed] [Google Scholar]
- 16.Ehara S, Hasegawa T, Nakata S, et al. Hyperintense plaque identified by magnetic resonance imaging relates to intracoronary thrombus as detected by optical coherence tomography in patients with angina pectoris. Eur Heart J Cardiovasc Imaging 2012;13:394–9. [DOI] [PMC free article] [PubMed] [Google Scholar]
- 17.Moody AR, Murphy RE, Morgan PS, et al. Characterization of complicated carotid plaque with magnetic resonance direct thrombus imaging in patients with cerebral ischemia. Circulation 2003;107:3047–52. [DOI] [PubMed] [Google Scholar]
- 18.Phinikaridou A, Andia ME, Protti A, et al. Noninvasive magnetic resonance imaging evaluation of endothelial permeability in murine atherosclerosis using an albumin-binding contrast agent. Circulation 2012;126:707–19. [DOI] [PubMed] [Google Scholar]
- 19.Yeon SB, Sabir A, Clouse M, et al. Delayed-enhancement cardiovascular magnetic resonance coronary artery wall imaging: comparison with multislice computed tomography and quantitative coronary angiography. J Am Coll Cardiol 2007;50:441–7. [DOI] [PubMed] [Google Scholar]


