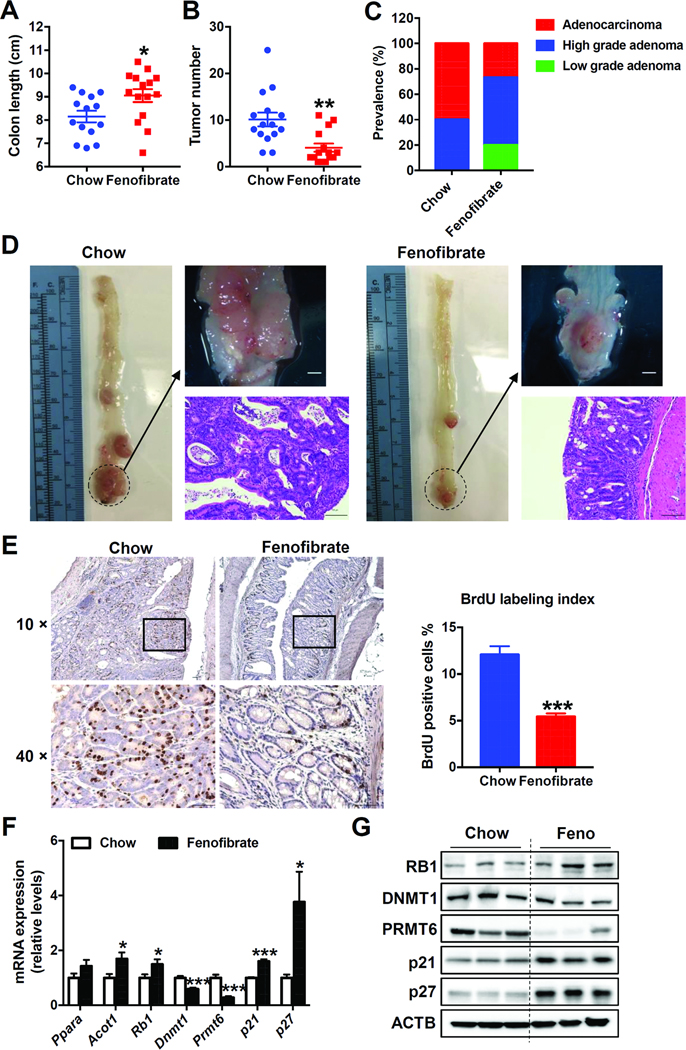
Figure 7. Fenofibrate decreased AOM and DSS-induced colon carcinogenesis in human PPARA transgenic mice.
(A) Colon length. (B) Tumor number. (C) Prevalence of low-grade adenomas, high-grade adenomas and adenocarcinomas. (D) Representative gross pictures (upper) and H&E staining (bottom) of colon sections. Scale bars: upper, 1.5 mm; bottom, 100 μm. (E) Left, Representative BrdU staining of colon sections. Scale bars: 50 μm. Right, BrdU labeling index. (F) The mRNA (n=8) and (G) protein levels of indicated genes in the colon samples of AOM and DSS-administered human PPARA transgenic mice fed on chow diet or fenofibrate diet. * P< 0.05, ** P< 0.01, *** P< 0.001.

