

Objectives
This is a protocol for a Cochrane Review (diagnostic). The objectives are as follows:
To determine the diagnostic accuracy of transient elastography with CAP for diagnosis of moderate and severe hepatic steatosis in people with suspected NAFLD when compared with liver biopsy as reference standard. To achieve this, we will compare none/mild hepatic steatosis (S0 to S1) versus moderate/severe hepatic steatosis (S2 to S3); and none/mild/moderate hepatic steatosis (S0 to S2) versus severe hepatic steatosis (S3).
Secondary objectives
We aim to also identify the pooled sensitivity and specificity for the most common cut‐off values of CAP for diagnosis of none/mild hepatic steatosis (S0 to S1) and moderate/severe hepatic steatosis (S2 to S3); or none/mild/moderate hepatic steatosis (S0 to S2) and severe hepatic steatosis (S3) in people with suspected NAFLD, and to explore potential sources of heterogeneity influencing the diagnostic test accuracy of CAP (see: Investigations of heterogeneity).
Background
Hepatic steatosis (i.e. abnormal retention of fat) is the main clinical manifestation of non‐alcoholic fatty liver disease (NAFLD) (Tiniakos 2018). Whenever there is a suspicion of NAFLD, hepatic steatosis should be documented and measured. Steatosis is defined as intrahepatic fat of at least 5% of liver weight (EASL Guidelines 2016). Liver biopsy has been the primary method for diagnosing NAFLD, and it is the most accurate method for assessing steatosis (EASL Guidelines 2016). The assessment of steatosis is based on measuring the extent of the surface area of a histological section involved, or uninvolved, in the parenchyma, providing the percentage of the affected area. Histologically, hepatic steatosis is graded from 0 to 3: minimal steatosis (grade S0), defined as presence of less than 5% or 10%; mild steatosis, between 5% and 33% (grade S1); moderate steatosis, between 33% and 66% (grade S2); and severe steatosis, more than 66.0% (grade S3) (Table 1).
1. Conversion grid: histopathological scoring systems for NAFLD.
| Feature | Grade range, according to SAF* | Brunt 1999 | NAS (Kleiner 2005) plus fibrosis | SAF* (Bedossa 2014) |
| Steatosis (percentage of hepatocytes with fat accumulation) | S0 | 0–10% | 0–5% | 0–5% |
| S1 | 10–33% | 5–33% | 5–33% | |
| S2 | 34–66% | 34–66% | 34–66% | |
| S3 | > 66% | > 66% | > 66% | |
| Lobular inflammation (number of foci of inflammatory cells within the lobule) | 0 | 0 | 0 | 0 |
| < 2 | 1–2 | |||
| 1 | 2–4 | 2–4 | > 2 | |
| > 4 | > 4 | |||
| Ballooning of hepatocytes | 0 | None/minimal | None | Normal hepatocytes |
| 1 | Present—zone 3 | Few | Clusters of hepatocytes of normal size, but with a rounded shape and pale cytoplasm | |
| 2 | Marked—zone 3 | Many | Same as grade 1 with some enlarged hepatocytes, at least 2‐fold that of normal cells | |
| Fibrosis | F0 | None | None | None |
| F1 | Perisinusoidal or portal fibrosis | 1: perisinusoidal or periportal 1A: mild, zone 3, perisinusoidal 1B: moderate, zone 3, perisinusoidal 1C: portal/periportal | Perisinusoidal or portal fibrosis | |
| F2 | Perisinusoidal and portal/periportal fibrosis | Perisinusoidal and portal/periportal fibrosis | Perisinusoidal and periportal fibrosis without bridging | |
| F3 | Bridging fibrosis | Bridging fibrosis | Bridging fibrosis | |
| F4 | Cirrhosis | Cirrhosis | Cirrhosis |
NAS: NAFLD activity score; SAF: steatosis, activity, fibrosis.
The pathological spectrum of NAFLD ranges from simple steatosis to non‐alcoholic steatohepatitis (NASH), fibrosis, cirrhosis, and hepatocellular carcinoma (HCC) (Angulo 2002). Diagnosis of NAFLD is also based on lack of secondary causes of hepatic fat accumulation: ruling out excessive alcohol consumption, viral hepatitis, other chronic liver diseases such as Wilson's disease, haemochromatosis, autoimmune hepatitis, cholestatic liver disease, starvation, lipodystrophy, coeliac disease, or Cushing's disease as well as medications (corticosteroids, methotrexate, diltiazem, oxaliplatin, amiodarone, isoniazid, highly active antiretroviral therapy, etc.) (Perumpail 2017). Clinical guidelines suggest moderate consumption of alcohol as a component of NAFLD diagnosis. In Chalasani 2012, EASL Guidelines 2016, NICE 2016, and AISF 2017 guidelines, it is less than 30 g/day for men and less than 20 g/day for women; in the American Association for the Study of Liver Diseases (AASLD) guidelines it is fewer than 21 standard drinks/week in men and fewer than 14 in women (Chalasani 2018); and in the Asia‐Pacific Guidelines, it is less than 14 standard alcoholic drinks/week in men and 14 in women (Chitturi 2018; Wong 2018).
Non‐alcoholic hepatic steatosis is associated with obesity, type 2 diabetes mellitus (T2DM), and dyslipidaemia. Most often, steatosis is detected for the first time when an NAFLD is established. There seems to be no isolated data on the frequency and prognosis of steatosis. One meta‐analysis on data of people with NAFLD from 1989 to 2015 found a global prevalence of 25.2% (Younossi 2016). Specifically, the prevalence of NAFLD was highest in the Middle East (31%) and South America (32%), and lowest in Africa (13.5%) (Younossi 2016).
Among histological features, only liver fibrosis is associated with long‐term outcomes of people with NAFLD (Angulo 2015; Ekstedt 2015). On baseline biopsy, people with NAFLD, but without fibrosis, exhibited progression of fibrosis of one‐stage over 14 years on average, whereas those with NASH progressed to fibrosis with one stage over seven years (Singh 2015). McPherson 2015 reported that progression of NAFLD occurred irrespective of whether the first biopsy showed hepatic steatosis or NASH; about 20% of people showed rapid fibrosis, whereas the remaining 80% had minimal progression. Another study reported that, compared to the general population, NAFLD was associated with an increased overall mortality (standardised mortality ratio of 1.34 to 2.6) (Kwak 2015). Adams 2005 and Ekstedt 2006 reported an absolute risk of liver‐related mortality being 1.7% (median follow‐up of 8 to 14 years), while Soderberg 2010 reported liver‐related mortality of 9.6% (median follow‐up of 21 years). Based on these studies, Angulo 2013 concluded that "the overall and liver‐related mortality in patients with the whole spectrum of NAFLD is greater than in the general population of same age and gender, and that complications of end‐stage liver disease contribute significantly to this higher mortality."
There are no drugs currently approved to prevent or treat hepatic steatosis. A number of pharmacological interventions have been tried in NAFLD, but with overall limited benefit. Lifestyle modification consisting of diet, exercise, and weight loss have been advocated to treat people with NAFLD. Foregut bariatric surgery can also be considered an option to specifically treat obese people with NAFLD or NASH (Chalasani 2018). Traditionally, liver biopsy has been the primary method for diagnosing and assessing the severity of NAFLD (EASL Guidelines 2016). However, when a disease and its progression should be monitored, liver biopsy is not of a practical use, also because it is an invasive procedure and carries a small, but definite, risk of complications. Transient elastography with controlled attenuation parameter (CAP) is an appropriate alternative to liver biopsy in diagnosing steatosis, identification of risk groups, and in evaluation of response to lifestyle modifications (Lombardi 2017; Gurusamy 2018).
Target condition being diagnosed
The target conditions are moderate or severe hepatic steatosis (i.e. S2 and S3) in people with suspected NAFLD. Moderate steatosis (S2) is classified by pathology when it is between 33% and 66%, and as severe (S3) when it is more than 66%.
Index test(s)
Transient elastography with controlled attenuated parameter
Transient elastography with CAP is a suitable diagnostic tool to detect and quantify steatosis along with measuring liver fibrosis (de Ledinghen 2014).
Transient elastography is a mechanical test designed to measure liver stiffness (i.e. the health of the liver) in kilopascals. Steatosis quantification by CAP analyses a measure of the ultrasound attenuation, which corresponds to the decrease in amplitude of ultrasound waves as they propagate through the liver (Echosens 2011). The technology is based on the evaluation of ultrasound signals acquired using a FibroScan device (an ultrasound‐based vibration‐controlled transient elastography (VCTE) system) (Sandrin 2002). A probe is put on the skin surface overlying the liver. After pressing the button on the probe, a pulse wave is transmitted across the liver parenchyma. After a short interval, a second ultrasound wave is transmitted, and the difference between the velocity of the two waves in the liver parenchyma is calculated. Intrahepatic cholestasis, ascites, and congestive heart failure are factors that can distort the results. VCTE system is contraindicated for pregnant women and people with active implantable medical devices (Echosens 2011). CAP is measured with a probe M, designed for the general adult population, at 3.5 MHz at a depth between 25 mm and 65 mm, or with a probe XL, designed for overweight people, at a depth between 35 mm and 75 mm. The XL probe was developed because of problems of obtaining valid measurements with the M‐probe in people with an increased skin‐liver length, which was a frequent finding in obese people (de Ledinghen 2010). CAP is calculated simultaneously with liver stiffness only if the liver stiffness measurements are valid (i.e. range between 100 decibel per metre (dB/m) and 400 dB/m). If they are not valid (i.e. within the provided range), then CAP is not measured (Echosens 2011). Measurement confidence is defined as 1. 10 valid measurements or more; 2. interquartile range/median (IQR/med) less than 30% in elastography; and 3. success rate greater than 60% (Castera 2010).
The advantages of transient elastography with CAP are that it is a non‐invasive test, easy to perform, provides immediate results, and has low cost in comparison with other measurement modalities, such as computed tomography or magnetic resonance‐based methods (de Ledinghen 2014).
One study by Sasso 2010, including 115 participants with chronic liver disease from various causes, was the first to validate CAP as a diagnostic tool for detection and quantification of steatosis, using liver biopsy as the reference standard. Subsequently, strong correlation of CAP with steatosis in the liver compared with liver biopsy has been shown for many chronic liver diseases (Table 2). Diagnostic accuracy of transient elastography with CAP may be affected by variations in cut‐off values of different steatosis grades and different covariates (de Ledinghen 2014). Factors associated with elevated CAP are body mass index (BMI), metabolic syndrome, alcohol, and liver stiffness (Karlas 2017). Also, accurate diagnosis of the stage of steatosis makes it possible to evaluate the risk of developing cardiovascular disease, prognosis, and effectiveness of treatment, which in particular can increase the patient's compliance to further treatment.
2. Controlled attenuation parameter staging and proposed values.
| Steatosis stage | Optimal cut‐off Sasso 2010 |
Optimal cut‐off Shi 2014 |
Median cut‐off Wang 2015 |
Optimal cut‐off Karlas 2017 |
| S1 (mild steatosis) | 237.7 dB/m | 232.5 dB/m | 238 dB/m and 250 dB/m | 248 dB/m |
| SE | 0.91 | 0.78 | 0.78 | 0.688 |
| SP | 0.81 | 0.79 | 0.79 | 0.822 |
| S2 (moderate steatosis) | 259.4 dB/m | 255 dB/m | 259 dB/m and 263 dB/m | 268 dB/m |
| SE | 0.89 | 0.85 | 0.82 | 0.773 |
| SP | 0.86 | 0.79 | 0.79 | 0.812 |
| S3 (severe steatosis) | 292.3 dB/m | 290 dB/m | 290 dB/m | 280 dB/m |
| SE | 1 | 0.83 | 0.86 | 0.882 |
| SP | 0.78 | 0.79 | 0.89 | 0.776 |
S1: mild steatosis (5% or 10% to 33% (depending on scale used)); S2: moderate steatosis (34% to 66%); S3: severe steatosis (greater than 66%) (Index test(s)) (Table 1); SE: sensitivity; SP: specificity; dB/m: decibel/milliwatt.
Clinical pathway
People with insulin resistance or metabolic risk factors, or both (i.e. obesity or metabolic syndrome, age more than 50 years) as well as with persistently abnormal liver enzymes should be suspected of having NAFLD. International guidelines partly differ in the diagnosis of hepatic steatosis in terms of acceptable economic burden (Table 3). The optimal strategy for detecting and grading steatosis, as well as stratifying people with suspected NAFLD and the way to follow‐up the disease progression, has not yet been established as there are no pathognomonic symptoms or signs that can be used for the diagnosis (Leoni 2018).
3. Comparative analysis of recommendations for the diagnosis of non‐alcoholic fatty liver disease.
| EASL | NICE | Asia‐Pacific | AISF | AASLD | |
| Systematic diagnosis of NAFLD | No | No | No | No | No |
| Diagnosis of NAFLD in high‐risk groups | Yes Metabolic risk factors Abnormal liver enzymes |
Yes Type 2 diabetes |
Yes Type 2 diabetes |
Not mentioned | 'Active surveillance' suggested for people with type 2 diabetes mellitus. |
AASLD: American Association for the Study of Liver Diseases (Chalasani 2018); Asia‐Pacific: Asia‐Pacific Working Party (Chitturi 2018; Wong 2018); AISF: Italian Association for the Study of the Liver (AISF 2017); EASL: European Association for the Study of the Liver (EASL Guidelines 2016); NICE: National Institute for Health and Care Excellence (NICE 2016).
The non‐invasive assessment of steatosis in people with suspected NAFLD includes clinical, laboratory, and imaging tests to diagnose NAFLD. A slight increase in the level of aspartate aminotransferase (AST), alanine aminotransferase (ALT), or gamma‐glutamyl transpeptidase (GGTP) can be observed in laboratory data, but normal levels of liver enzymes do not exclude absence of NAFLD. International guidelines vary in their recommendations on how to confirm the presence of steatosis and general liver biochemistry in people with suspected NAFLD. As an initial diagnostic workup, some guidelines recommend non‐invasive imaging examinations, the sequence of which in practice may depend on the availability and cost (EASL Guidelines 2016; NICE 2016; AISF 2017; Chalasani 2018; Chitturi 2018; Wong 2018). The EASL Guidelines 2016, Asia‐Pacific (Chitturi 2018; Wong 2018), and Italian (AISF 2017) clinical guidelines suggest the Fatty Liver Index (FLI) and the NAFLD liver fat score for assessing the presence of steatosis. The AASLD guidelines underline the lack of evidence for the usefulness of quantifying liver steatosis in routine clinical settings and highlight that only the grade of inflammation or fibrosis can determine the prognosis of people with NAFLD (Chalasani 2018). All guidelines previously mentioned agree on the need of non‐invasive laboratory and imaging assessment of advanced fibrosis as the leading prognostic factor among people with NAFLD due to a strong correlation with survival rate and liver‐related outcomes. However, histological analysis of liver biopsies remains the standard against which other methods for assessment of the presence and amount of hepatic injury due to NAFLD are measured, especially for detecting NASH (hepatocyte ballooning and lobular inflammation) and how lobular inflammation differs from simple steatosis.
CAP could be used as a non‐invasive, inexpensive, and accurate method to diagnose NAFLD in NAFLD risk groups (de Ledinghen 2014). Asia‐Pacific guidelines propose CAP as a useful tool for diagnosis of NAFLD, as well as for demonstrating improvement in hepatic steatosis after lifestyle intervention and body‐weight reduction (Chitturi 2018; Wong 2018), while other guidelines report that its role in clinical practice has yet to be determined (Chalasani 2018).
If the diagnostic accuracy of transient elastography plus CAP is shown to be better than the diagnostic accuracy of abdominal ultrasound, then it can replace abdominal ultrasound because transient elastography plus CAP is easier to interpret by the operator in view of the predefined parameters. Transient elastography plus CAP may replace liver biopsy, unless results of liver stiffness and grades of hepatic steatosis measurements are questionable (Eddowes 2019).
The downstream consequences of testing include the following.
True‐positive (TP): patients would benefit from rapid diagnosis and refer for an effective intervention.
True‐negative (TN): patients would be spared unnecessary treatment and would benefit from reassurance and pursuit of an alternative diagnosis.
False‐positive (FP): patients would probably experience anxiety and morbidity caused by additional testing, unnecessary treatment, and possible adverse events; and the chance that a FP result may halt further diagnostic evaluation.
False‐negative (FN): increased risk of morbidity and mortality and delayed treatment initiation, lifestyle modifications.
Figure 1 displays a summary of a currently used diagnostic pathway in assessing the grade of steatosis, choice of intervention, and monitoring and assessment of treatments.
1.
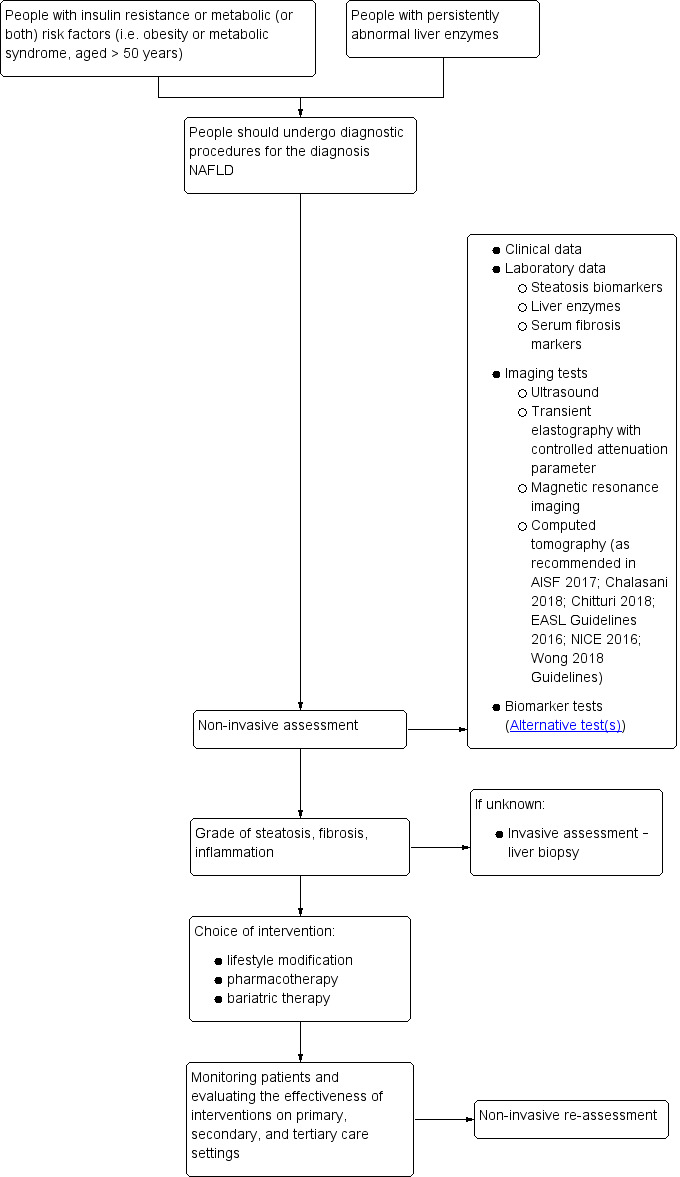
Clinical pathway. NAFLD: non‐alcoholic fatty liver disease.
Alternative test(s)
Biomarker tests
FLI, NAFLD liver fat score (NAFLD‐LFS), hepatic steatosis index (HSI), visceral adiposity index (VAI), and triglyceride‐glucose (TyG) index are some of the biomarkers most often used to quantify steatosis. They are based on aggregate scores, and different anthropometric and metabolic parameters. However, their ability to quantify steatosis is low as shown by one meta‐analysis by Fedchuk 2014. In addition, none of these biomarker tests can distinguish between moderate and severe steatosis (Fedchuk 2014). The areas under the receiver‐operating‐characteristic curves (AUROC) for predicting steatosis of more than 33% (i.e. moderate and severe) were 0.83 (95% confidence interval (CI) 0.72 to 0.91) for FLI, 0.80 (95% CI 0.69 to 0.88) for NAFLD‐LFS, 0.81 (95% CI 0.71 to 0.88) for HSI, 0.92 (95% CI 0.85 to 0.95) for VAI, and 0.90 (0.84 to 0.94) for TyG indices (Fedchuk 2014). The patient data required to perform the tests are BMI, waist circumference, triglycerides, gamma‐glutamyl transferase; presence or absence of metabolic syndrome or T2DM, insulin levels, AST, ALT, high‐density lipoprotein cholesterol, and glucose (Fedchuk 2014).
Other imaging tests
Abdominal ultrasonography is the most common first‐line imaging modality for people with elevated liver enzymes or suspected NAFLD. As compared to the right kidney parenchyma, distal attenuation, and the presence of areas of focal sparing, a typical ultrasonography feature of value to detect or exclude moderate‐to‐pronounced fatty infiltration is hyperechogenicity (an increased response (echo) during the ultrasound examination) (Hernaez 2011). The degree of steatosis can be subjectively scored as mild, moderate, and severe, or as reported in some studies by using ordinal ultrasonography scores (Ballestri 2012). In one meta‐analysis by Hernaez 2011, the pooled sensitivity and specificity of abdominal ultrasonography to distinguish moderate‐to‐severe fatty liver from the absence of steatosis, taking liver biopsy as the reference standard, were 84.8% (95% CI 79.5 to 88.9) (sensitivity) and 93.6% (95% CI 79.5 to 88.9) (specificity). Abdominal ultrasonography has limited sensitivity and does not reliably detect steatosis when it is less than 20% or in people with high BMI (greater than 40 kg/m2) (EASL Guidelines 2016). It is also operator‐dependent.
Magnetic resonance‐based methods are used for the detection or grading of hepatic steatosis and fibrosis. Diffusion‐weighted magnetic resonance imaging (DW‐MRI) measures the random Brownian motion of water molecules within a voxel of tissue. Magnetic resonance elastography (MRE) uses shear waves to assess the tissue displacement in all directions. Magnetic resonance spectroscopy (MRS) is based on the fact that the distribution of electrons within an atom causes nuclei in different molecules to experience slightly different magnetic fields (Tognarelli 2015). DW‐MRI, MRE, and MRS have an overall AUROC of 0.90, sensitivity of 82%, and specificity of 87%. They also exhibit good AUROC (DW‐MRI 0.95 (95% CI 0.93 to 0.97); MRE 0.89 (95% CI 0.86 and 0.91), and MRS 0.88 (95% CI 0.82 to 0.93) (Wang 2018). Magnetic resonance imaging proton density fat fraction (MRI‐PDFF) of liver tissue is an imaging biomarker derived from the fat and water component images acquired during an MRI examination and computed as the ratio of the fraction of mobile protons belonging to triglyceride, relative to those to water. According to Gu 2019, the summary AUROC values of MRI‐PDFF for classifying steatosis grades 0 versus 1 to 3 are 0.98, 0 to 1 versus 2 to 3 are 0.91, and 0 to 2 versus 3 are 0.90. All these methods are accurate and fast methods of detecting liver fat, allowing detailed examination of areas of interest, but they are expensive and may not be routinely available (Wang 2018; Gu 2019).
Computed tomography can measure tissue density in Hounsfield units (HU) from air (–1000) at the bottom of the scale, to bone density at the top of the scale. Computed tomography diagnostic criteria for steatosis are liver attenuation, at least 10 Hounsfield Units (HU) less than that of the spleen (sensitivity 60.5% and specificity 100%), or absolute liver attenuation of less than 40 HU (sensitivity 52.5% and specificity 100%) (Lawrence 2012).
Rationale
Steatosis generally has a favourable outcome, although people with isolated hepatic steatosis and with clinical diagnosis of metabolic syndrome or individual components of metabolic syndrome may be at risk of more rapidly progressive histological inflammatory damage and adverse outcomes associated with NASH (Pais 2013; Rinella 2016). Some studies suggest that the degree of steatosis may predict the severity of histological features (Chalasani 2008), and the incidence and prevalence of diabetes in people with NAFLD (Li 2013; Shah 2015; Targher 2016). The aggregate data provide strong evidence that people with NAFLD are at increased 'independent' risk of developing cardiovascular disease (Armstrong 2014). Similarly, the bidirectional association between NAFLD and components of metabolic syndrome has been strongly established. Also, there are established conditions such as obesity, T2DM, hypertension, and dyslipidaemia, and emerging conditions, such as sleep apnoea, colorectal cancer, osteoporosis, psoriasis, endocrinopathies, and polycystic ovary syndrome independent of obesity, that are associated with NAFLD (Chalasani 2018). The European Association for the Study of the Liver recommends diagnosing obese people, people with a metabolic syndrome, and people at high risk of developing a cardiovascular disease for presence of NAFLD (EASL Guidelines 2016). The ideal method for evaluation of liver steatosis in people with suspected NAFLD must be widely available, non‐invasive, safe, sensitive, accurate for quantification, reproducible, and inexpensive.
The meta‐analyses by Shi 2014 and Wang 2015 showed a high sensitivity and specificity of CAP for NAFLD of S1 or greater, S2 or greater, and S3 or greater (Table 2). However, the study authors did not recommend using this method to diagnose liver steatosis in routine clinical practice. Meta‐analyses conducted by Karlas 2017 and Pu 2019 showed high diagnostic accuracy of transient elastography with CAP. However, the Pu 2019 meta‐analysis has limitations regarding databases searched and have flaws in methodology, including lack of risk of bias assessment. The meta‐analysis of individual data by Karlas 2017 included 537 participants, and the meta‐analysis by Pu 2019 included 1297 participants. However, there are other relevant studies, not included in the mentioned meta‐analyses.
As researchers are using different cut‐off values to determine the stage of steatosis in people with NAFLD, we consider it necessary to conduct this Cochrane systematic review on the diagnostic accuracy of transient elastography with CAP for diagnosis of moderate and severe steatosis in people with suspected NAFLD, including the available evidence.
Objectives
To determine the diagnostic accuracy of transient elastography with CAP for diagnosis of moderate and severe hepatic steatosis in people with suspected NAFLD when compared with liver biopsy as reference standard. To achieve this, we will compare none/mild hepatic steatosis (S0 to S1) versus moderate/severe hepatic steatosis (S2 to S3); and none/mild/moderate hepatic steatosis (S0 to S2) versus severe hepatic steatosis (S3).
Secondary objectives
We aim to also identify the pooled sensitivity and specificity for the most common cut‐off values of CAP for diagnosis of none/mild hepatic steatosis (S0 to S1) and moderate/severe hepatic steatosis (S2 to S3); or none/mild/moderate hepatic steatosis (S0 to S2) and severe hepatic steatosis (S3) in people with suspected NAFLD, and to explore potential sources of heterogeneity influencing the diagnostic test accuracy of CAP (see: Investigations of heterogeneity).
Methods
Criteria for considering studies for this review
Types of studies
We will include cross‐sectional studies with liver histology as reference standard and transient elastography with CAP as index test, providing diagnostic accuracy data (TP, FP, FN, and TN) in people with suspected NAFLD. We will include studies irrespective of publication status, format, and language. We will exclude studies of case‐control design that compared people with known NAFLD to matched controls. Case‐control designs are considered at high risk of bias, as they inflate accuracy estimates (Colli 2014).
Participants
Study participants can be hospitalised or outpatients, of any sex and ethnic origin, and at least 18 years old, with suspected NAFLD. People may present with any diabetes status, and both secondary causes and a daily alcohol consumption, defined as more than 30 g/day for men and more than 20 g/day for women, should be excluded. We will exclude studies with participants who had previously undergone liver transplantation due to a problem with the accuracy verifying the aetiology of steatosis. Majority of people with a long‐term survival after liver transplantation have allografts that are histologically abnormal. This may be caused by the effects of immunosuppression or interactions with other graft complications (Hubscher 2011).
Index tests
Transient elastography with controlled attenuation parameter
Most often, authors use various cut‐off values to grade liver steatosis: a cut‐off value of 259.4 dB/m to 268 dB/m for S0/S1 versus S2/S3, and a cut‐of value of 280 dB/m to 292.3 dB/m for S0/S2 versus S3 (Sasso 2010; Karlas 2017). For our review, we will consider the cut‐off values of transient elastography with CAP as used by the study authors.
Target conditions
The target conditions will be moderate or severe hepatic steatosis in people with suspected NAFLD according histopathological scoring systems for NAFLD (Table 1).
Reference standards
Liver histology with assessment of steatosis.
A liver biopsy allows confirmation of the presence of NAFLD, to differentiate diagnosis between steatosis and steatohepatitis, to assess the stage of fibrosis, and, based on histological data, to predict the development of the disease as well as to exclude other causes of liver damage. However, liver biopsy is not practical when a disease and its progression needs to be monitored. It is an invasive procedure and carries a small, but definite risk of complications. It is also unrealistic to perform liver biopsy in 15% to 40% of the general population.
Following histological scoring systems, there are four grades of hepatic steatosis: minimal steatosis (grade 0), defined as presence of less than 5% or 10%; mild steatosis, between 5% and 33% (grade 1); moderate steatosis, between 33% and 66% (grade 2); and severe steatosis, more than 66% (grade 3). The steatohepatitis elements are steatosis complicated by liver cell injury (evident as ballooned hepatocytes, or Mallory hyaline) with substantial lobular (and occasionally portal) inflammation. The histological changes characterising the stages of fibrosis are defined as stage 1 (perisinusoidal fibrosis); stage 2 (perisinusoidal fibrosis with periportal fibrosis); stage 3 (bridging fibrosis); and stage 4 (fully developed cirrhosis) (Brunt 1999; Kleiner 2012; Bedossa 2014).
Different histopathological scoring systems are used to diagnose or predict progression of NAFLD (Table 1). The NAFLD activity score (NAS) evaluates the degree of morphological changes in scores (Kleiner 2005). It is a modification of the Brunt and Matteoni scales used earlier in 1999 (Brunt 1999). The SAF (steatosis, activity, fibrosis) semi‐quantitative score, proposed by Bedossa 2014, assesses the severity of NAFLD based on severity of steatosis (S, steatosis), balloon dystrophy and lobular inflammation (A, activity), and the stage of liver fibrosis (F, fibrosis). The results of the SAF score assessments are used as an index for NASH staging (e.g. S1A2F3, S2A1F1, etc.) (Bedossa 2014). We will use a conversion grid for hepatic fibrosis staging if a study assesses fibrosis according to Metavir, Kleiner, or Ishak score (French METAVIR CSG 1994: Ishak 1995; Kleiner 2005; Table 4). We will add other histopathological scoring systems to Table 4 if such are used in the included studies.
4. Semi‐quantitative histopathological scoring systems for progression of fibrosis to cirrhosis. Conversion grid for the stages of hepatic fibrosis.
| Stage of estimated fibrosis following: | ||
| METAVIR (French METAVIR CSG 1994) | Ishak 1995 | Kleiner 2005 |
| F0 | F0 | F0 |
| F1 | F1 | F1 |
| F1 | F2 | F1 |
| F2 | F3 | F2 |
| F3 | F4 | F2 |
| F4 | F5 | F3 |
| F4 | F6 | F4 |
F: stage of hepatic fibrosis; F0: no fibrosis; F1: portal fibrous expansion; F2: thin fibrous septa emanating from portal triads; F3: fibrous septa bridging portal triads and central veins; F4: cirrhosis. Clinically significant fibrosis is generally defined as F2 or greater (on the METAVIR scale from F0 to F4 with F4 being cirrhosis).
Search methods for identification of studies
We will combine electronic searches with reading references of the identified studies of possible interest. We will include all studies irrespective of language of publication and publication status. We will translate non‐English language articles with the help of Cochrane Hepato‐Biliary Group (CHBG) collaborators.
Electronic searches
We will search The Cochrane Hepato‐Biliary Group Controlled Trials Register (maintained and searched internally by the CHBG Information Specialist via the Cochrane Register of Studies Web), the Cochrane Hepato‐Biliary Group Diagnostic Test Accuracy Studies Register (maintained and searched internally by the CHBG Information Specialist via the Cochrane Register of Studies Web), the Cochrane Central Register of Controlled Trials (CENTRAL), MEDLINE Ovid, Embase Ovid), CINAHL (EBSCOhost), LILACS (Bireme), Science Citation Index Expanded (Web of Science), and Conference Proceedings Citation Index – Science (Web of Science) (Royle 2003). We will also search ClinicalTrial.gov (clinicaltrials.gov/), European Medicines Agency (EMA) (www.ema.europa.eu/ema/), World Health Organization International Clinical Trial Registry Platform (www.who.int/ictrp), and the Food and Drug Administration (FDA) (www.fda.gov).
Appendix 1 shows the preliminary search strategies for the different databases with the expected time spans for the searches. The given search strategies may be improved at the review preparation phase.
Searching other resources
We will search the references of the included studies to identify additional studies. We will also search for articles related to the included studies by performing the ’related search’ function in MEDLINE (OvidSP) and Embase (OvidSP) and a 'citing reference' search (by searching the articles that cite the included articles) in these databases. We will also search for other types of grey literature in the System for Information on Grey Literature in Europe OpenGrey (www.opengrey.eu/).
Data collection and analysis
We will follow available guidelines as provided in the Cochrane Handbook for Diagnostic Test of Accuracy Reviews (DTA Handbook 2013).
Selection of studies
Three review authors (TT, AB, and CP) will independently identify relevant studies from the retrieved references. The first selection will be based on reference title or abstract. For the second selection, we will retrieve the full texts of selected studies considered to be relevant by at least one of the review authors. Two review authors will independently screen the full‐text of the publications against the inclusion criteria and will resolve any differences through discussion. We will remove duplicates and list multiple publications of the same study within its main reference. We will record the number and details of all studies not fulfilling the inclusion criteria, based on full‐text assessment in the 'Characteristics of excluded studies' table, with the reasons for exclusion. We will illustrate the study selection process using a PRISMA diagram (Moher 2011). We will solve disagreements through discussion. If disagreements persist, AS or KSG will serve as arbitrator.
Data extraction and management
Three review authors (TT, AB, and CP) will independently extract data from each included study, using a prepiloted data extraction form by TT (Table 5). We will then compare our data extraction, and we will resolve differences by discussion.
5. Data extraction form.
| Domain | Items |
| Study characteristics | Author |
| Journal | |
| Publication year | |
| Language | |
| Study design | |
| Start and finish dates of study | |
| Study location (country) | |
| Study population | Number of participants meeting the criteria |
| Total number of participants assessed | |
| Age distribution (mean/median, standard deviation, range) | |
| Sex distribution | |
| Study location | |
| Presence or absence of diabetes mellitus | |
| Serum levels of alanine transferase | |
| Steatosis stage distribution | |
| BMI | |
| Index test | Type of index test's probe used (M or XL) |
| Cut‐off level used for staging of steatosis, dB/m | |
| Blinding of operators for results of histopathological analysis | |
| The validity of the measurements (Number of valid measurements Success rate, IQR/med) | |
| Levels of liver stiffness, kPa | |
| Missing results for index test | |
| Reference test | Blinding of pathologists to results of TE with CAP |
| Severity of steatosis, % | |
| Missing results for reference standard | |
| Levels of histological activity (from 0 to 4) | |
| Flow and timing | Time interval between index test(s) and reference test (weeks) |
| Study results | True positives for each presented cut‐off value |
| False positives for each presented cut‐off value | |
| True negatives for each presented cut‐off value | |
| False negatives for each presented cut‐off value | |
| Correspondence with authors | |
| Funding | Source of funding Are study authors affiliated with the manufacturer of the index test? Is the study directly funded by the manufacturer? Have study authors reported conflicts of interests related to the manufacturer or other funding sources? |
BMI: body mass index; dB/m: decibel/milliwatt; IQR/med: interquartile range/median: kPa: kilopascal; TE with CAP: transient elastography with controlled attenuation parameter.
We will extract all necessary data to calculate TP, FP, TN, and FN values, using the reference standard of liver histology. We will summarise the data from each study in 2 × 2 tables (TP, FP, FN, TN), according to the index tests considered. We will use Review Manager 5 software to enter data and perform analyses (Review Manager 2014). If information on any of the TP, FP, FN, and TN diagnostic test values or results are missing, we will attempt to derive these using other information that the study may provide.
Missing data
We will contact primary authors of abstract publications and full‐text publications by e‐mail to ask for missing data which are needed to design the 2 × 2 tables. If we receive no reply, we will send a second e‐mail after two weeks. If no reply is received, then we will list the study in 'Excluded studies', with a reason for exclusion.
In case a full‐text publication of a study, presented only in an abstract format, is not found, and the abstract lacks the data we need, and study authors do not respond to our requests for missing data, we will judge if we shall list the abstract publication within 'Excluded studies' or 'Studies awaiting assessment', in view of future update of the review.
Assessment of methodological quality
We will use the QUADAS‐2 (QUality Assessment of Diagnostic Accuracy Studies) tool, to assess risk of bias in diagnostic test accuracy studies and the applicability of their results. QUADAS‐2 is based on four quality domains: participant selection, index test, reference standard, and flow and timing (Whiting 2011; QUADAS‐2). There are signalling questions for each of the domains, used to make judgements in terms of risk of bias. The answers to the signalling questions are 'yes', 'no', or 'unclear'. The first three domains are also judged in terms of concerns regarding applicability, and the answers can be 'low', 'high', or 'unclear'.
Appendix 2 shows the signalling questions to our review subject, and the criteria that we will use to assess the methodological quality of each study in our review. Regarding the 'flow and timing' domain, we will consider an interval of three months (12 weeks) the most appropriate interval between the reference standard test and the index test. However, in studies where participants underwent bariatric surgery, we will consider an interval of one month (four weeks) the most appropriate interval between the reference standard test and the index test. This is due to data that have shown a significant decrease in steatosis three months after bariatric surgery (Aldoheyan 2017).
Two review authors (TT and AB) will independently judge risk of bias in each domain and applicability of results. They will provide quotes and comments to support each judgement for each domain. In case of discrepancies and no agreement reached, a third author (CP or KSG) will act as arbitrator.
If we judge a study as 'low' on all domains relating to bias or applicability, then our overall judgement for that study will be 'low risk of bias' or 'low concern regarding applicability'. If we judge a study as 'high' or 'unclear' in one or more domains relating to bias or applicability, then our overall judgement for that study will be 'at risk of bias' or as having 'concerns regarding applicability'.
The guidance to arrive at judgements for risk of bias in each study domain is provided in Appendix 2.
Two review authors (TT and AB) will present the results in 'Risk of bias' summaries and graphs in addition to a narrative summary, as advised on the QUADAS‐2 website. We will check the QUADAS‐2 website for possible updates during the review preparation.
Statistical analysis and data synthesis
We will carry out statistical analyses according to recommendations provided in the Cochrane Handbook for Systematic Reviews of Diagnostic Test Accuracy (Macaskill 2010; DTA Handbook 2013). The analyses will be performed using Review Manager 5 (Review Manager 2014) and Stata Statistical Software (Release 16. TX: StataCorp LLC).
We will build 2 × 2 tables of CAP performance (TP, TN, FP, FN) for all of the predefined target conditions (moderate and severe steatosis). We will estimate sensitivity, specificity, and positive and negative likelihood ratios (LR+ and LR‐) with their 95% CIs. Summary LR+ and LR‐ will be calculated as part of the METADAS code using the formula LR+ = sensitivity/(1 – specificity) and LR– = (1 – specificity)/sensitivity (DTA Handbook 2013). First, we will perform a graphical descriptive analysis of the included studies: we will present coupled forest plots of sensitivity and specificity separately, with their 95% CIs, and we will provide a graphical representation of the studies in the receiver operating characteristic (ROC) space (sensitivity against 1 – specificity).
Second, where appropriate, we will perform meta‐analyses. The method that we will use to estimate summary statistic will depend on the variability in positivity thresholds. If the primary studies report accuracy estimates of CAP using different cut‐off values, we will use the hierarchical summary ROC model (HSROC) to pool data (sensitivities and specificities) and to estimate the summary ROC (SROC) curve (Macaskill 2010).
If performance reported across the primary studies is based on consistent cut‐off values, we will use the bivariate model, and we will provide estimates of summary sensitivity and specificity.
For primary studies that report accuracy results for more than one cut‐off value, we will report sensitivities and specificities for all of the cut‐off values, but we will use a single cut‐off value of CAP for each study in HSROC analysis. This value will be the most frequently used cut‐off value.
We do not plan to include non‐evaluable index test results in our main statistical analysis. We plan to perform an 'intention‐to‐diagnose' analysis as an additional sensitivity analysis (See Sensitivity analyses). We will classify participants with non‐evaluable index test results as FPs if they had a negative reference standard or FNs with a positive reference standard (Schuetz 2012). We will use 3 × 2 tables. If data for the intention‐to‐diagnose analyses are not retrievable from the text, and as mentioned earlier, we will contact publication authors. If we receive no reply, we will include the study in the analyses with data retrievable from the published manuscript.
We will rate the certainty of the evidence, and we will present a summary of our findings, using the GRADE approach (GRADE Handbook 2013; GRADEpro GDT) (detailed below).
Investigations of heterogeneity
We plan to investigate if the following potential sources of heterogeneity may influence our overall results.
-
As there is a significant variation in the activity of steatohepatitis and liver fibrosis among patients, we will analyse:
the different levels of histological activity (from 0 to 4): studies including more than 50% of participants with the sum of ballooning and lobular inflammation below 2 compared to studies including more than 50% of participants with 2 or greater grades of activity – categorical covariate;
the different serum levels of ALT activity (increased ALT activity will be defined as serum ALT above the upper limit of normal, that is, more than 40 IU/L (Gawrieh 2019)): studies including more than 50% of participants with normal serum levels of ALT compared to studies including more than 50% of participants with serum levels of ALT greater than the upper limit – categorical covariate;
the different levels of liver stiffness, in kilopascals (studies including more than 50% of participants with F0/F1/F2 with a cut‐off 8.8 kPa compared to studies including more than 50% of participants with F2/F3 with a cut‐off 12.0 kPa compared to studies including more than 50% of participants with F3/F4 with a cut‐off 38.6 kPa (Boursier 2016)) – categorical covariate;
the different levels of histological fibrosis stage (studies including more than 50% of participants with F0/F1/F2 compared to studies including more than 50% of participants with F3/F4 (Table 4)) – categorical covariate.
-
As T2DM is associated with the development of NAFLD and can lead to advanced stages, we will analyse:
studies including more than 50% of participants with T2DM compared to studies including more than 50% of participants without T2DM (a categorical covariate).
-
As the presence and severity of obesity may limit the obtaining of reliable CAP measurements and requires the use of XL probe, we will analyse:
the different BMIs; studies including more than 50% of participants with BMI below 25 kg/m2 compared to studies including more than 50% of participants with BMI 25 kg/m2 or more) (a categorical covariate);
the different probes for measuring CAP: studies including more than 50% of participants with M probe or studies including more than 50% of participants with XL probe (a categorical covariate).
-
As there are differences in epidemiology of NAFLD in continents and subcontinents, we will analyse:
the study location (population differences): European compared to Asia compared to Africa compared to America (Northern America compared to South America, if relevant studies will be found) (a categorical covariate).
We will estimate effects by adding covariates to the bivariate or HSROC model (depending on the model chosen based on the variation in positivity thresholds reported in the studies). We will assess the statistical significance of the covariate effect using the log‐likelihood ratio test for comparison of models with and without the covariate term. We will consider a P less than 0.05 as two‐sided and statistically significant.
Sensitivity analyses
We will perform sensitivity analysis by excluding studies:
at high risk of bias, that is, studies having high risk of bias in at least one of the domains of QUADAS‐2 (Appendix 2);
published only in abstract or letter form;
with 'no' or 'unclear' answer to the signalling questions: "If a threshold was used, was it prespecified?", "Was there an appropriate interval between the index test and the reference standard?"
with 'no' or 'unclear' answer to the signalling question: "Was there an appropriate interval between the index test and the reference standard?"
intention‐to‐diagnose analyses in terms of index test results (Schuetz 2012).
Publication bias: we will rate publication bias as undetected (not serious) because of the comprehensiveness of the literature search and following extensive outreach to researchers to identify studies.
Certainty of the evidence and 'Summary of findings' table
We will consider the following GRADE factors to assess the certainty of the evidence:
risk of bias: we will use QUADAS‐2 to assess risk of bias;
indirectness: for the review questions, we will look for important differences between the populations studied (e.g. the spectrum of disease), the setting, the index test, and the reference standard;
inconsistency: we will carry out prespecified analyses to investigate potential sources of heterogeneity, and we will downgrade the evidence when we cannot explain inconsistency in the accuracy estimates;
imprecision: we will look at the CIs of sensitivity and specificity estimates and at the unexplained heterogeneity of the results; or TP, FP, FN, and TN rates;
publication bias: we will use the trim‐and‐fill method (Schünemann 2020).
We will follow the instructions in Section 7.5. 'Judgment about the quality of the underlying evidence' of the GRADE Handbook 2013 on how to downgrade or upgrade the evidence. We will justify all our decisions, using footnotes, and we will make comments to aid reader's understanding of the review, where necessary.
We will prepare a 'Summary of Findings' table to present the main results and key information regarding our assessment of the certainty of evidence, using the GRADE approach (GRADE Handbook 2013; GRADEpro GDT).
We will rate the certainty of the evidence in one of the four grades: high, moderate, low, or very low, defined as follows (GRADE Handbook 2013; GRADEpro GDT).
High: we are very confident that the true effect lies close to that of the effect estimate.
Moderate: we are moderately confident of the effect estimate and that the true effect is likely to be close to the effect estimate, but there is a possibility that it is substantially different.
Low: our confidence in the effect estimate is limited, such that the true effect may be substantially different from the effect estimate.
Very low: we have very little confidence in the effect estimate, such that the true effect is likely to be substantially different from the estimate of effect.
History
Protocol first published: Issue 7, 2020
Acknowledgements
Cochrane Review Group funding acknowledgement: the Danish State is the largest single funder of The Cochrane Hepato‐Biliary Group through its investment in The Copenhagen Trial Unit, Centre for Clinical Intervention Research, Rigshospitalet, Copenhagen University Hospital, Denmark. Disclaimer: the views and opinions expressed in this review are those of the authors and do not necessarily reflect those of the Danish State or The Copenhagen Trial Unit.
Peer reviewers: Daniele Prati, Italy. Contact Editor from The Cochrane Diagnostic Accuracy Reviews Editorial Team: Karen R Steingart, UK. Contact editor: Agostino Colli, Italy. Sign‐off editor: Christian Gluud, Denmark.
Appendices
Appendix 1. Search strategy
Transient elastography with controlled attenuation parameter (CAP) for diagnosis of moderate or severe steatosis in people with non‐alcoholic fatty liver disease
| Database | Time span | Search strategy |
| Cochrane Hepato‐Biliary Group Controlled Trials Register | Date will be given at review stage. | (elastogra* or elastic* or TE or fibroscan* or VCTE or controlled attenuation paramet* or CAP) and (fibro* or cirrho* or steatohepati* or steatos* or (nonalcoholic near fatty) or (non‐alcoholic near fatty) or (non alcoholic near fatty) or NAFL* or NASH) |
| Cochrane Hepato‐Biliary Group Diagnostic Test of Accuracy Studies Register | Date will be given at review stage. | (elastogra* or elastic* or TE or fibroscan* or VCTE or controlled attenuation paramet* or CAP) and (fibro* or cirrho* or steatohepati* or steatos* or (nonalcoholic near fatty) or (non‐alcoholic near fatty) or (non alcoholic near fatty) or NAFL* or NASH) |
| Cochrane Central Register of Controlled Trials (CENTRAL) in the Cochrane Library | Latest issue | #1 MeSH descriptor: [Elasticity Imaging Techniques] explode all trees #2 MeSH descriptor: [Liver] explode all trees and with qualifier(s): [diagnostic imaging ‐ DG] #3 elastogra* or elastic* or TE or fibroscan* or VCTE #4 controlled attenuation paramet* or CAP #5 #1 or #2 or #3 or #4 #6 MeSH descriptor: [Non‐alcoholic Fatty Liver Disease] explode all trees #7 MeSH descriptor: [Fatty Liver] explode all trees #8 MeSH descriptor: [Liver Cirrhosis] explode all trees #9 MeSH descriptor: [Fibrosis] explode all trees #10 (fibro* or cirrho* or steatohepati* or steatos* or non?alcoholic near fatty or NAFL* or NASH) #11 #6 or #7 or #8 or #9 or #10 #12 #5 and #11 |
| MEDLINE Ovid | 1946 to the date of the search | 1. exp Elasticity Imaging Techniques/ 2. exp Liver/dg [Diagnostic Imaging] 3. (elastogra* or elastic* or TE or fibroscan* or VCTE).mp. [mp=title, abstract, original title, name of substance word, subject heading word, floating sub‐heading word, keyword heading word, organism supplementary concept word, protocol supplementary concept word, rare disease supplementary concept word, unique identifier, synonyms] 4. (controlled attenuation paramet* or CAP).mp. [mp=title, abstract, original title, name of substance word, subject heading word, floating sub‐heading word, keyword heading word, organism supplementary concept word, protocol supplementary concept word, rare disease supplementary concept word, unique identifier, synonyms] 5. 1 or 2 or 3 or 4 6. exp Non‐alcoholic Fatty Liver Disease/ 7. exp Fatty Liver/ 8. exp Liver Cirrhosis/ 9. exp Fibrosis/ 10. (fibro* or cirrho* or steatohepati* or steatos* or (non?alcoholic adj fatty) or NAFL* or NASH).mp. [mp=title, abstract, original title, name of substance word, subject heading word, floating sub‐heading word, keyword heading word, organism supplementary concept word, protocol supplementary concept word, rare disease supplementary concept word, unique identifier, synonyms] 11. 6 or 7 or 8 or 9 or 10 12. 5 and 11 13. limit 12 to ("adolescent (13 to 18 years)" or "young adult (19 to 24 years)" or "adult (19 to 44 years)" or "young adult and adult (19‐24 and 19‐44)" or "middle age (45 to 64 years)" or "middle aged (45 plus years)" or "all aged (65 and over)" or "aged (80 and over)") |
| Embase Ovid | 1974 to the date of the search | 1. exp transient elastography/ 2. exp elastograph/ 3. (elastogra* or elastic* or TE or fibroscan* or VCTE).mp. [mp=title, abstract, heading word, drug trade name, original title, device manufacturer, drug manufacturer, device trade name, keyword, floating subheading word, candidate term word] 4. (controlled attenuation paramet* or CAP).mp. [mp=title, abstract, heading word, drug trade name, original title, device manufacturer, drug manufacturer, device trade name, keyword, floating subheading word, candidate term word] 5. 1 or 2 or 3 or 4 6. exp nonalcoholic fatty liver/ 7. exp fatty liver/ 8. exp liver cirrhosis/ 9. exp liver fibrosis/ 10. (fibro* or cirrho* or steatohepati* or steatos* or (non?alcoholic adj fatty) or NAFL* or NASH).mp. [mp=title, abstract, heading word, drug trade name, original title, device manufacturer, drug manufacturer, device trade name, keyword, floating subheading word, candidate term word] 11. 6 or 7 or 8 or 9 or 10 12. 5 and 11 13. limit 12 to (adult <18 to 64 years> or aged <65+ years>) |
| LILACS (Bireme) | 1982 to the date of the search | elastogra$ or elastic$ or TE or fibroscan$ or VCTE [Words] and (fibro$ or cirrho$ or steatohepati$ or steatos$ or non$alcoholic fatty or NAFL$ or NASH) [Words] |
| Science Citation Index Expanded (Web of Science) | 1900 to the date of the search | #3 #2 AND #1 #2 TI=(fibro* or cirrho* or steatohepati* or steatos* or (non?alcoholic near fatty) or NAFL* or NASH) #1 TI=(elastogra* or elastic* or TE or fibroscan* or VCTE or (controlled attenuation paramet*) or CAP) |
| Conference Proceedings Citation Index – Science (Web of Science) | 1990 to the date of the search | #3 #2 AND #1 #2 TI=(fibro* or cirrho* or steatohepati* or steatos* or (non?alcoholic near fatty) or NAFL* or NASH) #1 TI=(elastogra* or elastic* or TE or fibroscan* or VCTE or (controlled attenuation paramet*) or CAP) |
Appendix 2. QUADAS‐2
| Domain | 1. Participant selection | 2. Index test | 3. Reference standard | 4. Flow and timing |
| Signalling questions and criteria | Q1: "Was a consecutive or random sample of participants enrolled?" Yes – If the study reports on a consecutive or a random selection of participants. No – if the study reports on another form of selection of participants. Unclear – if the study does not report on how the participants were enrolled. Q2: "Did the study avoid inappropriate exclusions?" Yes – if definitions of exclusion criteria are inappropriate (e.g. difficult to diagnose participants, failure at liver biopsy, failure on transient elastography with controlled attenuation parameter) and all exclusions are reported. No – if exclusion criteria are inappropriate and exclusions are not reported. Unclear – if the study does not report causes of exclusions. |
Q1: "Were the index test results interpreted without knowledge of the results of the reference standard?" Yes – if the study reports that the results of the index test were interpreted without the knowledge of the results of the reference standard. No – if the study reports that results of the index test were interpreted with the results of the reference standard. Unclear – if the study does not report information about blinding of the results of the index test and reference standard. Q2: "If a threshold was used, was it prespecified?" Yes – the cut‐off of transient elastography with controlled attenuation parameter for specific steatosis stage was prespecified. No – it was not. Unclear – there was no such information. |
Q1: "Is the reference standard likely to correctly classify the target condition?" Yes – this item will always be 'Yes' because a correct reference standard is part of the inclusion criteria of this review. No – not applicable. Unclear – not applicable. Q2: "Were the results of liver biopsy interpreted without knowledge of the results of transient elastography with controlled attenuation parameter?" Yes – if the study reports that the results of the reference standard were interpreted without the knowledge of the results of the index test. No – if the study reports that the results of the reference standard were interpreted with the knowledge of the results of the index test. Unclear – if the study does not report information about blinding of the results of the reference standard and the index test. |
Q1: "Was there an appropriate interval between the index test and the reference standard?" Yes – if the interval between the index test and the reference standard was < 3 months. No – if the interval was > 3 months. Unclear – if the study does not report the interval between the index test and the reference standard. For studies with bariatric interventions: Yes – if the interval between the index test and the reference standard was ≤ 1 month. No – if the interval was > 1 month. Unclear – if the study does not report the interval between the index test and the reference standard. Q2: "Did all participants receive the same reference standard (liver biopsy)?" Yes – if the study has only 1 reference standard for all the participants No – if the study has > 1 reference standard. Unclear – if the study information regarding the use of reference standard are unclear Q3: "Were all participants included in the analysis and analysed according to intention‐to‐diagnose principle (non‐evaluable results considered as false)?" Yes – if all enrolled participants were included in the analysis and non‐evaluable index test results were analysed according to the intention‐to‐diagnose principle. No – if any participant was excluded from the analysis for any reason or non‐evaluable index test results were not analysed according to intention‐to‐diagnose principle. Unclear – if the exclusion of participants from the analysis is unclear. |
| Risk of bias |
Could the selection of participants have introduced bias? Low risk: 'Yes' for all signalling questions. High risk: 'No' or 'Unclear' for ≥ 1 signalling question. |
Could the conduct or interpretation of the index test have introduced bias? Low risk: 'Yes' for all signalling questions. High risk: 'No' or 'Unclear' for ≥ 1 signalling question. |
Could the reference standard, its conduct, or its interpretation have introduced bias? Low risk: 'Yes' for all signalling questions. High risk: 'No' or 'Unclear' for ≥ 1 signalling question. |
Could the participant flow have introduced bias? Low risk: 'Yes' for all signalling questions. High risk: 'No' or 'Unclear' for ≥ 1 signalling question. |
| Concerns about applicability |
Are there concerns that included participants and setting do not match the review question? Low concern: there was low concern that the included participants did not match the review question. High concern: there was high concern that the included participants did not match the review question. Unclear concern: if it was unclear. |
Are there concerns that the index test, its conduct, or interpretation differ from the review question? Low concern: the index test, its conduct, or its interpretation does not differ from the way it is used in clinical practice. High concern: the index test, its conduct, or its interpretation differs from the way it is used in clinical practice. Unclear concern: if it was unclear. |
Are there concerns that the target condition as defined by the reference standard does not match the question? High concern: all participants did not undergo liver biopsy for steatosis. Low concern: all participants underwent liver biopsy for steatosis. Unclear concern: if it was unclear. |
— |
| Guide to the overall judgement of bias risk in each quality domain of a study |
|
— | ||
Contributions of authors
Conceiving the protocol: TT, CP, KSG, AB, OB. Designing the protocol: TT, CP, KSG, AB, OB. Co‐ordinating the protocol: CP, KSG, AS. Designing search strategies: TT, CP, KSG. Writing the protocol: TT, OB.
All authors approved of the final version.
Sources of support
Internal sources
-
I.M. Sechenov First Moscow State Medical University (Sechenov University), Russian Federation
a salary
External sources
No sources of support supplied
Declarations of interest
TT: none. OB: none. AB: none. AS: none. KUG: none. CSP: none.
New
References
Additional references
Adams 2005
- Adams LA, Lymp JF, St Sauver J, Sanderson SO, Lindor KD, Feldstein A, et al. The natural history of nonalcoholic fatty liver disease: a population-based cohort study. Gastroenterology 2005;129(1):113-21. [PMID: ] [DOI] [PubMed] [Google Scholar]
AISF 2017
- Italian Association for the Study of the Liver. AISF position paper on nonalcoholic fatty liver disease (NAFLD): updates and future directions. Digestive and Liver Disease 2017;49(5):471-83. [PMID: ] [DOI] [PubMed] [Google Scholar]
Aldoheyan 2017
- Aldoheyan T, Hassanain M, Al-Mulhim A, Al-Sabhan A, Al-Amro S, Bamehriz F, et al. The effects of bariatric surgeries on nonalcoholic fatty liver disease. Surgical Endoscopy 2017;31(3):1142-7. [PMID: ] [DOI] [PubMed] [Google Scholar]
Angulo 2002
- Angulo P. Nonalcoholic fatty liver disease. New England Journal of Medicine 2002;346(16):1221-31. [PMID: ] [DOI] [PubMed] [Google Scholar]
Angulo 2013
- Angulo P. The natural history of NAFLD. In: Farrell GC, McCullough AJ, Day CP, editors(s). Non-Alcoholic Fatty Liver Disease: a Practical Guide. Hoboken (NJ): John Wiley & Sons, 2013:37-45. [Google Scholar]
Angulo 2015
- Angulo P, Kleiner DE, Dam-Larsen S, Adams LA, Bjornsson ES, Charatcharoenwitthaya P, et al. Liver fibrosis, but no other histologic features, is associated with long-term outcomes of patients with nonalcoholic fatty liver disease. Gastroenterology 2015;149(2):389-97.e10. [PMID: ] [DOI] [PMC free article] [PubMed] [Google Scholar]
Armstrong 2014
- Armstrong MJ, Adams LA, Canbay A, Syn WK. Extrahepatic complications of nonalcoholic fatty liver disease. Hepatology (Baltimore, Md.) 2014;59(3):1174-97. [PMID: ] [DOI] [PubMed] [Google Scholar]
Ballestri 2012
- Ballestri S, Lonardo A, Romagnoli D, Carulli L, Losi L, Day CP, et al. Ultrasonographic fatty liver indicator, a novel score which rules out NASH and is correlated with metabolic parameters in NAFLD. Liver International 2012;32(8):1242-52. [PMID: ] [DOI] [PubMed] [Google Scholar]
Bedossa 2014
- Bedossa P. Utility and appropriateness of the fatty liver inhibition of progression (FLIP) algorithm and steatosis, activity, and fibrosis (SAF) score in the evaluation of biopsies of nonalcoholic fatty liver disease. Hepatology (Baltimore, Md.) 2014;60(2):565-75. [PMID: ] [DOI] [PubMed] [Google Scholar]
Boursier 2016
- Boursier J, Vergniol J, Guillet A, Hiriart JB, Lannes A, Le Bail B, et al. Diagnostic accuracy and prognostic significance of blood fibrosis tests and liver stiffness measurement by FibroScan in non-alcoholic fatty liver disease. Journal of Hepatology 2016;65(3):570-8. [PMID: ] [DOI] [PubMed] [Google Scholar]
Brunt 1999
- Brunt EM, Janney CG, Di Bisceglie AM, Neuschwander-Tetri BA, Bacon BR. Nonalcoholic steatohepatitis: a proposal for grading and staging the histological lesions. American Journal of Gastroenterology 1999;94(9):2467-74. [PMID: ] [DOI] [PubMed] [Google Scholar]
Castera 2010
- Castera L, Foucher J, Bernard PH, Carvalho F, Allaix D, Merrouche W, et al. Pitfalls of liver stiffness measurement: a 5-year prospective study of 13,369 examinations. Hepatology (Baltimore, Md.) 2010;51(3):828-35. [PMID: ] [DOI] [PubMed] [Google Scholar]
Chalasani 2008
- Chalasani N, Wilson L, Kleiner DE, Cummings OW, Brunt EM, Unalp A. Relationship of steatosis grade and zonal location to histological features of steatohepatitis in adult patients with non-alcoholic fatty liver disease. Journal of Hepatology 2008;48(5):829-34. [PMID: ] [DOI] [PMC free article] [PubMed] [Google Scholar]
Chalasani 2012
- Chalasani N, Younossi Z, Lavine JE, Diehl AM, Brunt EM, Cusi K, et al. The diagnosis and management of non-alcoholic fatty liver disease: practice guideline by the American Gastroenterological Association, American Association for the Study of Liver Diseases, and American College of Gastroenterology. Gastroenterology 2012;142(7):1592-609. [PMID: ] [DOI] [PubMed] [Google Scholar]
Chalasani 2018
- Chalasani N, Younossi Z, Lavine JE, Charlton M, Cusi K, Rinella M, et al. The diagnosis and management of nonalcoholic fatty liver disease: practice guidance from the American Association for the Study of Liver Diseases. Hepatology (Baltimore, Md.) 2018;67(1):328-57. [PMID: ] [DOI] [PubMed] [Google Scholar]
Chitturi 2018
- Chitturi S, Wong VW, Chan WK, Wong GL, Wong SK, Sollano J, et al. The Asia-Pacific Working Party on Non-alcoholic Fatty Liver Disease guidelines 2017-Part 2: management and special groups. Journal of Gastroenterology and Hepatology 2018;33(1):86-98. [PMID: ] [DOI] [PubMed] [Google Scholar]
Colli 2014
- Colli A, Fraquelli M, Casazza G, Conte D, Nikolova D, Duca P, et al. The architecture of diagnostic research: from bench to bedside – research guidelines using liver stiffness as an example. Hepatology (Baltimore, Md.) 2014;60(1):408-18. [PMID: ] [DOI] [PubMed] [Google Scholar]
de Ledinghen 2010
- Ledinghen V, Vergniol J, Foucher J, El-Hajbi F, Merrouche W, Rigalleau V. Feasibility of liver transient elastography with FibroScan using a new probe for obese patients. Liver International 2010;30(7):1043-8. [PMID: ] [DOI] [PubMed] [Google Scholar]
de Ledinghen 2014
- Ledinghen V, Vergniol J, Capdepont M, Chermak F, Hiriart J-B, Cassinotto C, et al. Controlled attenuation parameter (CAP) for the diagnosis of steatosis: a prospective study of 5323 examinations. Journal of Hepatology 2014;60(5):1026-31. [DOI] [PubMed] [Google Scholar]
DTA Handbook 2013
- Deeks JJ, Bossuyt PM, Gatsonis C, editor(s). Cochrane Handbook for Systematic Reviews of Diagnostic Test Accuracy Version 1.0.0. The Cochrane Collaboration, 2013. Available from srdta.cochrane.org.
EASL Guidelines 2016
- European Association for the Study of the Liver (EASL), European Association for the Study of Diabetes (EASD), European Association for the Study of Obesity (EASO). EASL-EASD-EASO clinical practice guidelines for the management of non-alcoholic fatty liver disease. Journal of Hepatology 2016;64(6):1388-402. [PMID: ] [DOI] [PubMed] [Google Scholar]
Echosens 2011
- Echosens. FibroScan 502. Innovation in liver disease management. delruseurope.com/wp-content/uploads/BrochureFS502TouchEN-WEB.compressed.pdf 2011 (accessed 11 June 2019).
Eddowes 2019
- Eddowes PJ, Sasso M, Allison M, Tsochatzis E, Anstee QM, Sheridan D, et al. Accuracy of FibroScan controlled attenuation parameter and liver stiffness measurement in assessing steatosis and fibrosis in patients with nonalcoholic fatty liver disease. Gastroenterology 2019;156(6):1717-30. [PMID: ] [DOI] [PubMed] [Google Scholar]
Ekstedt 2006
- Ekstedt M, Franzen LE, Mathiesen UL, Thorelius L, Holmqvist M, Bodemar G, et al. Long-term follow-up of patients with NAFLD and elevated liver enzymes. Hepatology (Baltimore, Md.) 2006;44(4):865-73. [PMID: ] [DOI] [PubMed] [Google Scholar]
Ekstedt 2015
- Ekstedt M, Hagstrom H, Nasr P, Fredrikson M, Stal P, Kechagias S, et al. Fibrosis stage is the strongest predictor for disease-specific mortality in NAFLD after up to 33 years of follow-up. Hepatology (Baltimore, Md.) 2015;61(5):1547-54. [PMID: ] [DOI] [PubMed] [Google Scholar]
Fedchuk 2014
- Fedchuk L, Nascimbeni F, Pais R, Charlotte F, Housset C, Ratziu V. Performance and limitations of steatosis biomarkers in patients with nonalcoholic fatty liver disease. Alimentary Pharmacology & Therapeutics 2014;40(10):1209-22. [PMID: ] [DOI] [PubMed] [Google Scholar]
French METAVIR CSG 1994
- French METAVIR Cooperative Study Group. Intraobserver and interobserver variations in liver biopsy interpretation in patients with chronic hepatitis C. Hepatology (Baltimore, Md.) 1994;20(1 Pt 1):15-20. [PMID: ] [PubMed]
Gawrieh 2019
- Gawrieh S, Wilson LA, Cummings OW, Clark JM, Loomba R, Hameed B, et al. Histologic findings of advanced fibrosis and cirrhosis in patients with nonalcoholic fatty liver disease who have normal aminotransferase levels. American Journal of Gastroenterology 2019;114(10):1626-35. [PMID: ] [DOI] [PMC free article] [PubMed] [Google Scholar]
GRADE Handbook 2013
- Schünemann H, Brożek J, Guyatt G, Oxman A, editor(s). Handbook for grading the quality of evidence and the strength of recommendations using the GRADE approach (updated October 2013). GRADE Working Group, 2013. Available from gdt.guidelinedevelopment.org/app/handbook/handbook.html.
GRADEpro GDT [Computer program]
- McMaster University (developed by Evidence Prime) GRADEpro GDT. Version accessed 29 June 2020. Hamilton (ON): McMaster University (developed by Evidence Prime), 2015.Available at gradepro.org.
Gu 2019
- Gu J, Liu S, Du S, Zhang Q, Xiao J, Dong Q, et al. Diagnostic value of MRI-PDFF for hepatic steatosis in patients with non-alcoholic fatty liver disease: a meta-analysis. European Radiology 2019;29(7):3564-73. [PMID: ] [DOI] [PubMed] [Google Scholar]
Gurusamy 2018
- Gurusamy KS, Tsochatzis E, Madden AM. Lifestyle modifications for non-alcohol related fatty liver disease: a network meta-analysis. Cochrane Database of Systematic Reviews 2018, Issue 10. [DOI: 10.1002/14651858.CD013156] [CD013156] [DOI] [PMC free article] [PubMed] [Google Scholar]
Hernaez 2011
- Hernaez R, Lazo M, Bonekamp S, Kamel I, Brancati FL, Guallar E, et al. Diagnostic accuracy and reliability of ultrasonography for the detection of fatty liver: a meta-analysis. Hepatology (Baltimore, Md.) 2011;54(3):1082-90. [PMID: ] [DOI] [PMC free article] [PubMed] [Google Scholar]
Hubscher 2011
- Hubscher SG. What is the long-term outcome of the liver allograft? Journal of Hepatology 2011;55(3):702-17. [PMID: ] [DOI] [PubMed] [Google Scholar]
Ishak 1995
- Ishak K, Baptista A, Bianchi L, Callea F, De Groote J, Gudat F, et al. Histological grading and staging of chronic hepatitis. Journal of Hepatology 1995;22(6):696-9. [PMID: ] [DOI] [PubMed] [Google Scholar]
Karlas 2017
- Karlas T, Petroff D, Sasso M, Fan JG, Mi YQ, Ledinghen V, et al. Individual patient data meta-analysis of controlled attenuation parameter (CAP) technology for assessing steatosis. Journal of Hepatology 2017;66(5):1022-30. [PMID: ] [DOI] [PubMed] [Google Scholar]
Kleiner 2005
- Kleiner DE, Brunt EM, Van Natta M, Behling C, Contos MJ, Cummings OW, et al. Design and validation of a histological scoring system for nonalcoholic fatty liver disease. Hepatology (Baltimore, Md.) 2005;41(6):1313-21. [PMID: ] [DOI] [PubMed] [Google Scholar]
Kleiner 2012
- Kleiner DE, Brunt EM. Nonalcoholic fatty liver disease: pathologic patterns and biopsy evaluation in clinical research. Seminars in Liver Disease 2012;32(1):3-13. [PMID: ] [DOI] [PubMed] [Google Scholar]
Kwak 2015
- Kwak M-S, Kim D. Long-term outcomes of nonalcoholic fatty liver disease. Current Hepatology Reports 2015;14(2):69-76. [Google Scholar]
Lawrence 2012
- Lawrence DA, Oliva IB, Israel GM. Detection of hepatic steatosis on contrast-enhanced CT images: diagnostic accuracy of identification of areas of presumed focal fatty sparing. American Journal of Roentgenology 2012;199(1):44-7. [DOI] [PubMed] [Google Scholar]
Leoni 2018
- Leoni S, Tovoli F, Napoli L, Serio I, Ferri S, Bolondi L. Current guidelines for the management of non-alcoholic fatty liver disease: a systematic review with comparative analysis. World Journal of Gastroenterology 2018;24(30):3361-73. [PMID: ] [DOI] [PMC free article] [PubMed] [Google Scholar]
Li 2013
- Li X, Xia M, Ma H, Hu Y, Yan H, He W, et al. Liver fat content, evaluated through semi-quantitative ultrasound measurement, is associated with impaired glucose profiles: a community-based study in Chinese. PloS One 2013;8(7):e65210. [PMID: ] [DOI] [PMC free article] [PubMed] [Google Scholar]
Lombardi 2017
- Lombardi R, Onali S, Thorburn D, Davidson BR, Gurusamy KS, Tsochatzis E. Pharmacological interventions for non-alcohol related fatty liver disease (NAFLD). Cochrane Database of Systematic Reviews 2017, Issue 3. [DOI: 10.1002/14651858.CD011640.pub2] [CD011640] [DOI] [PMC free article] [PubMed] [Google Scholar]
Macaskill 2010
- Macaskill P, Gatsonis C, Deeks JJ, Harbord RM, Takwoingi Y. Chapter 10: Analysing and presenting results. In: Deeks JJ, Bossuyt PM, Gatsonis, C, editor(s), Cochrane Handbook for Systematic Reviews of Diagnostic Test Accuracy Version 1.0. The Cochrane Collaboration, 2010. Available from srdta.cochrane.org/.
McPherson 2015
- McPherson S, Hardy T, Henderson E, Burt AD, Day CP, Anstee QM. Evidence of NAFLD progression from steatosis to fibrosing-steatohepatitis using paired biopsies: implications for prognosis and clinical management. Journal of Hepatology 2015;62(5):1148-55. [PMID: ] [DOI] [PubMed] [Google Scholar]
Moher 2011
NICE 2016
- National Guideline Centre (UK). Non-alcoholic fatty liver disease: assessment and management. www.nice.org.uk/guidance/ng49 (accessed prior to 2 July 2020). [PMID: 27441333]27441333
Pais 2013
- Pais R, Charlotte F, Fedchuk L, Bedossa P, Lebray P, Poynard T, et al. A systematic review of follow-up biopsies reveals disease progression in patients with non-alcoholic fatty liver. Journal of Hepatology 2013;59(3):550-6. [PMID: ] [DOI] [PubMed] [Google Scholar]
Perumpail 2017
- Perumpail BJ, Khan MA, Yoo ER, Cholankeril G, Kim D, Ahmed A. Clinical epidemiology and disease burden of nonalcoholic fatty liver disease. World Journal of Gastroenterology 2017;23(47):8263-76. [PMID: ] [DOI] [PMC free article] [PubMed] [Google Scholar]
Pu 2019
- Pu K, Wang Y, Bai S, Wei H, Zhou Y, Fan J, et al. Diagnostic accuracy of controlled attenuation parameter (CAP) as a non-invasive test for steatosis in suspected non-alcoholic fatty liver disease: a systematic review and meta-analysis. BMC Gastroenterology 2019;19(1):51. [PMID: ] [DOI] [PMC free article] [PubMed] [Google Scholar]
QUADAS‐2
- University of Bristol. QUADAS-2. www.bristol.ac.uk/population-health-sciences/projects/quadas/quadas-2/ (accessed 29 June 2020).
Review Manager 2014 [Computer program]
- Nordic Cochrane Centre, The Cochrane Collaboration Review Manager (RevMan). Version 5.3. Copenhagen: Nordic Cochrane Centre, The Cochrane Collaboration, 2014.
Rinella 2016
- Rinella ME, Sanyal AJ. Management of NAFLD: a stage-based approach. Nature Reviews. Gastroenterology & Hepatology 2016;13(4):196-205. [PMID: ] [DOI] [PubMed] [Google Scholar]
Royle 2003
- Royle P, Milne R. Literature searching for randomized controlled trials used in Cochrane reviews: rapid versus exhaustive searches. International Journal of Technology Assessment in Health Care 2003;19(4):591-603. [DOI] [PubMed] [Google Scholar]
Sandrin 2002
- Sandrin L, Tanter M, Gennisson JL, Catheline S, Fink M. Shear elasticity probe for soft tissues with 1-D transient elastography. IEEE Transactions on Ultrasonics, Ferroelectrics, and Frequency Control 2002;49(4):436-46. [PMID: ] [DOI] [PubMed] [Google Scholar]
Sasso 2010
- Sasso M, Beaugrand M, Ledinghen V, Douvin C, Marcellin P, Poupon R, et al. Controlled attenuation parameter (CAP): a novel VCTE guided ultrasonic attenuation measurement for the evaluation of hepatic steatosis: preliminary study and validation in a cohort of patients with chronic liver disease from various causes. Ultrasound in Medicine & Biology 2010;36(11):1825-35. [PMID: ] [DOI] [PubMed] [Google Scholar]
Schuetz 2012
- Schuetz GM, Schlattmann P, Dewey M. Use of 3x2 tables with an intention to diagnose approach to assess clinical performance of diagnostic tests: meta-analytical evaluation of coronary CT angiography studies. BMJ (Clinical Research Ed.) 2012;345:e6717. [PMID: ] [DOI] [PMC free article] [PubMed] [Google Scholar]
Schünemann 2020
- Schünemann HJ, Mustafa RA, Brozek J, Steingart KR, Leeflang M, Murad MH, et al. GRADE guidelines: 21 part 2. Test accuracy: inconsistency, imprecision, publication bias, and other domains for rating the certainty of evidence and presenting it in evidence profiles and summary of findings tables. Journal of Clinical Epidemiology 2020;122:142-52. [PMID: ] [DOI] [PubMed] [Google Scholar]
Shah 2015
- Shah RV, Allison MA, Lima JA, Bluemke DA, Abbasi SA, Ouyang P, et al. Liver fat, statin use, and incident diabetes: the Multi-Ethnic Study of Atherosclerosis. Atherosclerosis 2015;242(1):211-7. [PMID: ] [DOI] [PMC free article] [PubMed] [Google Scholar]
Shi 2014
- Shi KQ, Tang JZ, Zhu XL, Ying L, Li DW, Gao J, et al. Controlled attenuation parameter for the detection of steatosis severity in chronic liver disease: a meta-analysis of diagnostic accuracy. Journal of Gastroenterology and Hepatology 2014;29(6):1149-58. [PMID: ] [DOI] [PubMed] [Google Scholar]
Singh 2015
- Singh S, Allen AM, Wang Z, Prokop LJ, Murad MH, Loomba R. Fibrosis progression in nonalcoholic fatty liver vs nonalcoholic steatohepatitis: a systematic review and meta-analysis of paired-biopsy studies. Clinical Gastroenterology and Hepatology 2015;13(4):643-54.e1-9. [PMID: ] [DOI] [PMC free article] [PubMed] [Google Scholar]
Soderberg 2010
- Soderberg C, Stal P, Askling J, Glaumann H, Lindberg G, Marmur J, et al. Decreased survival of subjects with elevated liver function tests during a 28-year follow-up. Hepatology (Baltimore, Md.) 2010;51(2):595-602. [PMID: ] [DOI] [PubMed] [Google Scholar]
Targher 2016
- Targher G, Marchesini G, Byrne CD. Risk of type 2 diabetes in patients with non-alcoholic fatty liver disease: causal association or epiphenomenon? Diabetes & Metabolism 2016;42(3):142-56. [PMID: ] [DOI] [PubMed] [Google Scholar]
Tiniakos 2018
- Dina G Tiniakos, Quentin M Anstee, Alastair D Burt. Fatty Liver Disease. In: Alastair D Burt, Linda D Ferrell, Stefan G Hübscher, , editors(s). Macsween's Pathology of the Liver. Seventh edition. Vol. 5. Elsevier, 2018:308-371. [DOI: 10.1016/B978-0-7020-6697-9.00005-4.] [DOI] [Google Scholar]
Tognarelli 2015
- Tognarelli JM, Dawood M, Shariff MI, Grover VP, Crossey MM, Cox IJ, et al. Magnetic resonance spectroscopy: principles and techniques: lessons for clinicians. Journal of Clinical and Experimental Hepatology 2015;5(4):320-8. [PMID: ] [DOI] [PMC free article] [PubMed] [Google Scholar]
Wang 2015
- Wang Y, Fan Q, Wang T, Wen J, Wang H, Zhang T. Controlled attenuation parameter for assessment of hepatic steatosis grades: a diagnostic meta-analysis. International Journal of Clinical and Experimental Medicine 2015;8(10):17654-63. [PMID: ] [PMC free article] [PubMed] [Google Scholar]
Wang 2018
- Wang XM, Zhang XJ, Ma L. Diagnostic performance of magnetic resonance technology in detecting steatosis or fibrosis in patients with nonalcoholic fatty liver disease: a meta-analysis. Medicine 2018;97(21):e10605. [PMID: ] [DOI] [PMC free article] [PubMed] [Google Scholar]
Whiting 2011
- Whiting PF, Rutjes AW, Westwood ME, Mallett S, Deeks JJ, Reitsma JB, et al. QUADAS-2: a revised tool for the quality assessment of diagnostic accuracy studies. Annals of Internal Medicine 2011;155(8):529-36. [DOI] [PubMed] [Google Scholar]
Wong 2018
- Wong VW, Chan WK, Chitturi S, Chawla Y, Dan YY, Duseja A, et al. Asia-Pacific working party on non-alcoholic fatty liver disease guidelines 2017 – part 1: definition, risk factors and assessment. Journal of Gastroenterology and Hepatology 2018;33(1):70-85. [PMID: ] [DOI] [PubMed] [Google Scholar]
Younossi 2016
- Younossi ZM, Koenig AB, Abdelatif D, Fazel Y, Henry L, Wymer M. Global epidemiology of nonalcoholic fatty liver disease-Meta-analytic assessment of prevalence, incidence, and outcomes. Hepatology (Baltimore, Md.) 2016;64(1):73-84. [PMID: ] [DOI] [PubMed] [Google Scholar]