

Abstract
Three cigarette smoking behaviors influence lung cancer rates: how many people start, the amount they smoke, and the age they quit. California has reduced smoking faster than the rest of the US and trends in these 3 smoking behaviors should inform lung cancer trends. We examined trends in smoking behavior (initiation, intensity, and quitting) in California and the rest of US by regression models using the 1974–2014 National Health Interview Surveys (n=962,174). Lung cancer mortality data for 1970–2013 was obtained from the national Surveillance, Epidemiology, and End Results (SEER) Program. Among those aged 18–35 years, California had much larger declines than the rest of the US in smoking initiation and intensity, and increased quitting. In 2012–14, among this age group, only 18.6% (95% CI, 16.8%–20.3%) had ever smoked; smokers consumed only 6.3 cigarettes/d (95% CI, 5.6–7.0); and 45.7% (95% CI, 41.1%–50.4%) of ever-smokers had quit by age 35. Each of these metrics was at least 24% better than in the rest of the US. There was no marked California effect on quitting or intensity among seniors. From 1986–2013, annual lung cancer mortality decreased more rapidly in California and by 2013 was 28% lower (62.6 vs 87.5/100,000) than in the rest of the US. California’s tobacco control efforts were associated with a major reduction in cigarette smoking among those under age 35 years. These changes will further widen the lung cancer gap that already exists between California and the rest of the US.
Keywords: lung cancer, cigarette smoking, tobacco control, smoking cessation, smoking initiation
INTRODUCTION
Although lung cancer mortality has declined consistently in the United States (US), it still accounts for over 25% of all cancer deaths;(1) thus, further decreasing lung cancer is a major public health priority.(2) Research reported in the 1950s and 1960s showed that cigarette smoking causes 80–90% of lung cancers(3) and prompted increases in smoking cessation(4) and decreases in smoking initiation,(5) but change was slow.(3) California led the rest of the US in implementing tobacco control, including increasing the cigarette tax every decade through 1999. These actions were associated with a faster change in smoking behavior than in the rest of the US during the 1970s and 80s, and this difference was reflected in lung cancer rates 16 years later.(6) Importantly, in 1988 California voters passed a dedicated cigarette excise tax which funded the nation’s first statewide tobacco control program.(7) Ten years later, a number of other states implemented tobacco control programs, funded in part by the Tobacco Master Settlement Agreement.(8) After the year 2000, following 12 years of tobacco control leadership, tobacco control expenditures in California and in the rest of the country were similar, and California’s cigarette prices lagged behind the national average.(9)
As lifetime exposure to cigarettes is important to lung cancer, tobacco control campaigns can target 3 smoking behaviors: initiation, intensity of smoking, and quitting. While preventing initiation is the most effective strategy to reduce the health consequences of smoking in the longer term(10), promoting cessation among those at near-term risk of lung cancer may achieve more immediate reductions in lung cancer mortality.(11) However, the British Doctor’s study determined that individuals who quit smoking at older ages (the peak lung cancer mortality age group) would only gain a small decrease in risk of smoking-related mortality, whereas quitting by age 35 years would avoid almost all later health consequences of smoking, and quitting by age 50 years avoids about half of the health consequences.(12) There is also good evidence that reducing the intensity of daily cigarette smoking will reduce lung cancer risk.(13) Smoking intensity has declined in the US since the 1980s, led by reduced peak consumption levels observed for younger cohorts of smokers.(14)
Approaches to reduce smoking behavior have differed considerably across jurisdictions. Most jurisdictions target smokers to quit,(15) emphasizing the health consequences of smoking, sometimes with hard-hitting advertisements.(16–18) California’s program also included competitive grants for community organizers, mass media messages, and scientific publications emphasizing second-hand smoke exposure (19) (a draft EPA report labelled it a carcinogen in 1990) and industry manipulation of adolescents(20) — together these have been called a “social norm approach” to achieving a smoke-free society.(21) Evidence is needed for the relative success of these differing tobacco control approaches to reducing smoking and lung cancer rates.
In this paper, we compare age-specific trends from the 1970s to 2014 (before the rise of e-cigarettes(22)) in smoking initiation, smoking intensity, and cessation in California versus the rest of the US, allowing for a change in the trend after the year 2000. For initiation, we report trends among those under 35 years whose risk of initiation may have been influenced by the California program, as well as the proportion of ever smokers among older populations. As intensity varies considerably depending on smokefree workplaces,(23) we report separately for the younger and older working populations and for seniors. For cessation, we report trends in the proportion who have quit smoking at the 3 target ages (35, 50, and 65 years). Finally, we update trends in lung cancer for California and the rest of the US(6) to examine how California’s unique approach to tobacco control might be associated with lung cancer mortality.
METHODS
Data Sources
The National Health Interview Survey (NHIS) has assessed smoking behavior in the United States since the 1960s, obtaining data through a complex, multistage sample design involving stratification, clustering, and oversampling of specific population subgroups. This sampling system is updated every decade (24). The National Center for Health Statistics (NCHS) uses the design and weighting information to formulate variance estimates for NHIS statistics. We needed geographic variables (California vs rest of US) from each survey for our analyses. We obtained data use agreements and statistical assistance from NCHS Research Data Center to provide this detail in the late 1990s (for 1974–1995 data) and then in 2016 (for 1997–2014 data). To preserve confidentiality and meet the NCHS’ minimum requirements for cell sizes, we pooled the 1997–2014 data into 3-year intervals (e.g. 2013 estimate represents 2012–2014 surveys). NHIS annual household sample sizes range from 35,000 to 45,000 and report individual-level response rates of >60% for the period for a total sample of 962,174 respondents. The Census estimates of the California population over this period suggest that it is ~10% of the national sample. However, it is important to note that smoking was not collected in every NHIS before 1997.
While lung cancer incidence and mortality follow similar trends, (25) we chose to report lung cancer mortality data as it is the critical endpoint. Data for California and the rest of the United States were obtained for each year from 1970–2013 from the Surveillance, Epidemiology, and End Results (SEER) Program.(26) Lung cancer deaths are from death certificates filed in the 50 states and the District of Columbia. Age-adjusted lung cancer mortality rates of 35 years or older were calculated using the SEER*Stat software version 8.3.5 (www.seer.cancer.gov/seerstat) and standardized in each calendar year to the 2000 US Census population, using SEER recodes for changes from ICD-8, ICD-9, and ICD-10.(27). For each year, we calculated the percent difference between California and the rest of the US [100*(RoUS-CA)/RoUS] and fitted a linear regression line to these data to estimate the average change in this difference each year.
Population-level Smoking Behaviors
In the United States, smoking initiation is assessed with a positive response to the question: “Have you ever smoked at least 100 cigarettes in your entire life?”, thus it ignores limited experimentation with cigarettes. These ever smokers are classified as current or former smokers from their response to: ‘Do you now smoke cigarettes every day, somedays or not at all?’ (prior to 1992, the question was simply: ‘Do you smoke cigarettes now?’). Smoking cessation was defined as the Quit Ratio (former/ever smoker).(28) Smoking intensity was assessed as the number of cigarettes a daily smoker smoked each day, and for non-daily smokers, the average number of cigarettes smoked on days that they smoked (in previous 30 days).
Statistical Analyses
Estimates of ever smoking and smoking intensity were standardized to the 2000 US census by age (18–34, 35–64 and 65+ years), gender, and education (no college vs some college). Analyses of quitting behavior focus on 10-year age groups with mid-points ages 35, 50, and 65 years (30-to 39-year-olds, 45-to 54-year-olds, and 60-to 69-years-olds). Within each 10-year age group, we standardized estimates to the 2000 Census data by gender and education.
As the implementation of tobacco control strategies changed in each location around 2000 (California implementation slowed, whereas in the Rest of the US implementation increased) (29), we allowed for the possibility of a change in slope in each smoking behavior in the year 2000. For each of the 3 smoking behaviors, an initial linear regression was run modeling CA and the rest of the US separately, including an intercept, the year, and the number of years after 2000 (for change in slope) as the dependent variables. Model results were tested to determine if there was a significant (p < 0.05) change in slope for data before and after 2000. If there was no significant change in slope, the model was rerun without the variable for number of years after 2000, thus resulting in a linear line for the entire period.
All analyses were completed in SAS version 9.3.
We used 2 models for ever-smoking: one focused on respondents under age 35 years (to capture recent initiators) and one for those 35+ years, which would reflect initiation before the California campaign. For smoking intensity, we investigated 3 models: one for younger smokers (18–34 years), a second for the older working-age population (35–64 years), and a third for those in retirement (≥65 years). For quitting, we used 3 models centered on our targeted ages of interest (ages 35, 50, and 65 years). Finally, we plotted age-adjusted lung cancer mortality rates for California versus the rest of the US from 1970 through 2013. We calculated the annual difference in lung cancer rates between the 2 locations and fitted a linear regression line.
RESULTS
Smoking Initiation
In 1974, the prevalence of ever-smokers among 18-to 34-year-olds in California was similar to the rest of the US (47.8%; 95% CI, 46.4%–49.3%) (Figure 1a). Through the year 2000, the average annual decline in ever-smoking was twice as fast in California compared to the rest of the US (−0.96%/year, 95% CI,−1.07% to −0.84% vs −0.44%/year, 95% CI, −0.47% to −0.40%, p<0.0001). After 2000, in California only, the rate of decline slowed significantly, to a rate similar to the rest of the US. In 2012–14, prevalence of ever-smoking in California was 18.6% (95% CI, 16.8%–20.3%) which was 40% lower than in the rest, of the US (31.4%, 95% CI, 30.4%–32.3%, p<0.0001).
Figure 1. Trends in smoking initiation in California and the rest of the United States, 1974–2014.
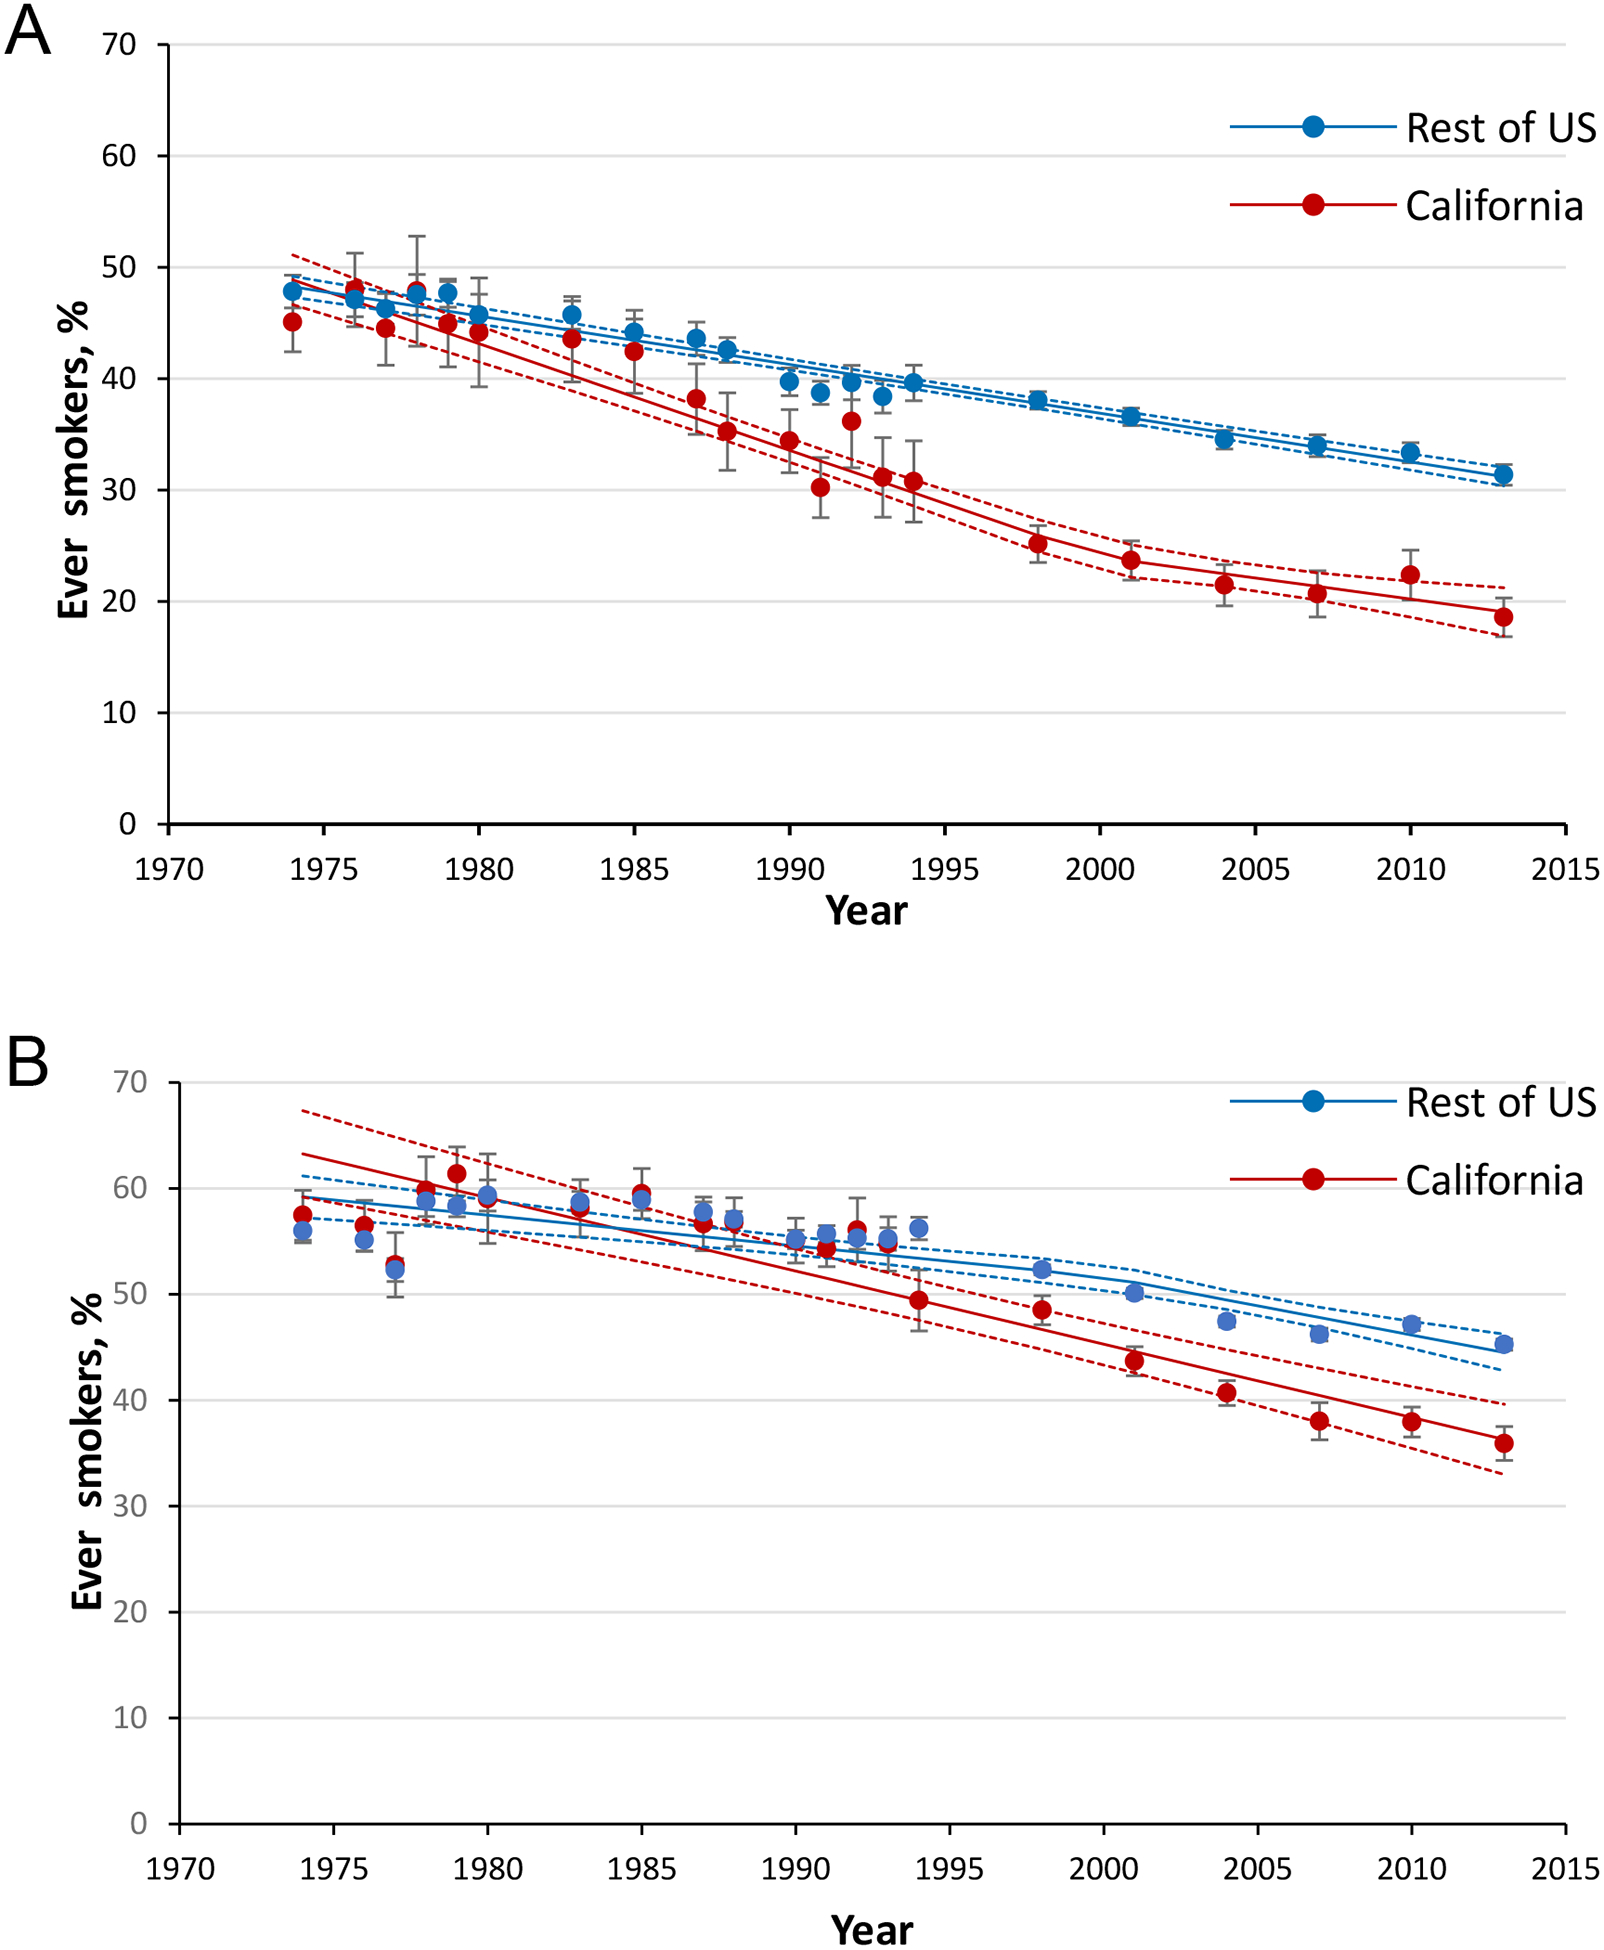
among (A) 18-to 34-year-olds and (B) individuals aged ≥35 years. Data Source: National Health Interview Surveys. Data for years 1997–2014 are collated over a 3-year period (e.g., 2013 point estimate represents years 2012–2014). Error bars represent the 95% confidence intervals.
Among those age 35+ years in the mid-1970s, ~60% of the population in both California and the rest of the US were ever-smokers. (Figure 1b) In the period to 2000, ever smoking declined at twice the rate in California compared, to the rest of the US (−0.69%/year, 95% CI, −0.53% to −0.85% vs −0.29%/year, 95% CI, −0.39% to −0.19%). After 2000, this rate of decline increased only in the rest of the US, to a rate similar to that of California. In 2012–14, California had ~20% fewer ever smokers compared to the rest of the US (35.9%, 95% CI, 34.3%–37.5% vs 45.3%, 95% CI, 44.7%–45.8%).
Smoking Intensity
Among 18-to 34-year-old smokers, in 1978, smoking intensity was similar in California to the rest of the US (18.4 cigarettes/d, 95% CI, 17.6–19.1) (Figure 2a). A split regression line fit the data well (R2=0.98). From 1978 to 2000, consumption declined at a 45% faster annual rate in California than in the rest of the US (−0.48 cigarettes/d, 95% CI, −0.40 to −0.56 vs −0.33 cigarettes/d, 95% CI, 0.29 to −0.36). After 2000, the annual rate of decline in smoking intensity slowed significantly only in California to −0.12 cigarettes/d, (95% CI, −0.06 to 0.29). In 2012–14, smoking intensity among 18-to 34-year-old smokers was 30% lower in California (6.3 cigarettes/d, 95% CI, 5.6–7.0) than in the rest of the US (9.2 cigarette/d; 95% CI, 9.0–9.5).
Figure 2. Average daily cigarette consumption in California and the rest of the US, 1978–2014.
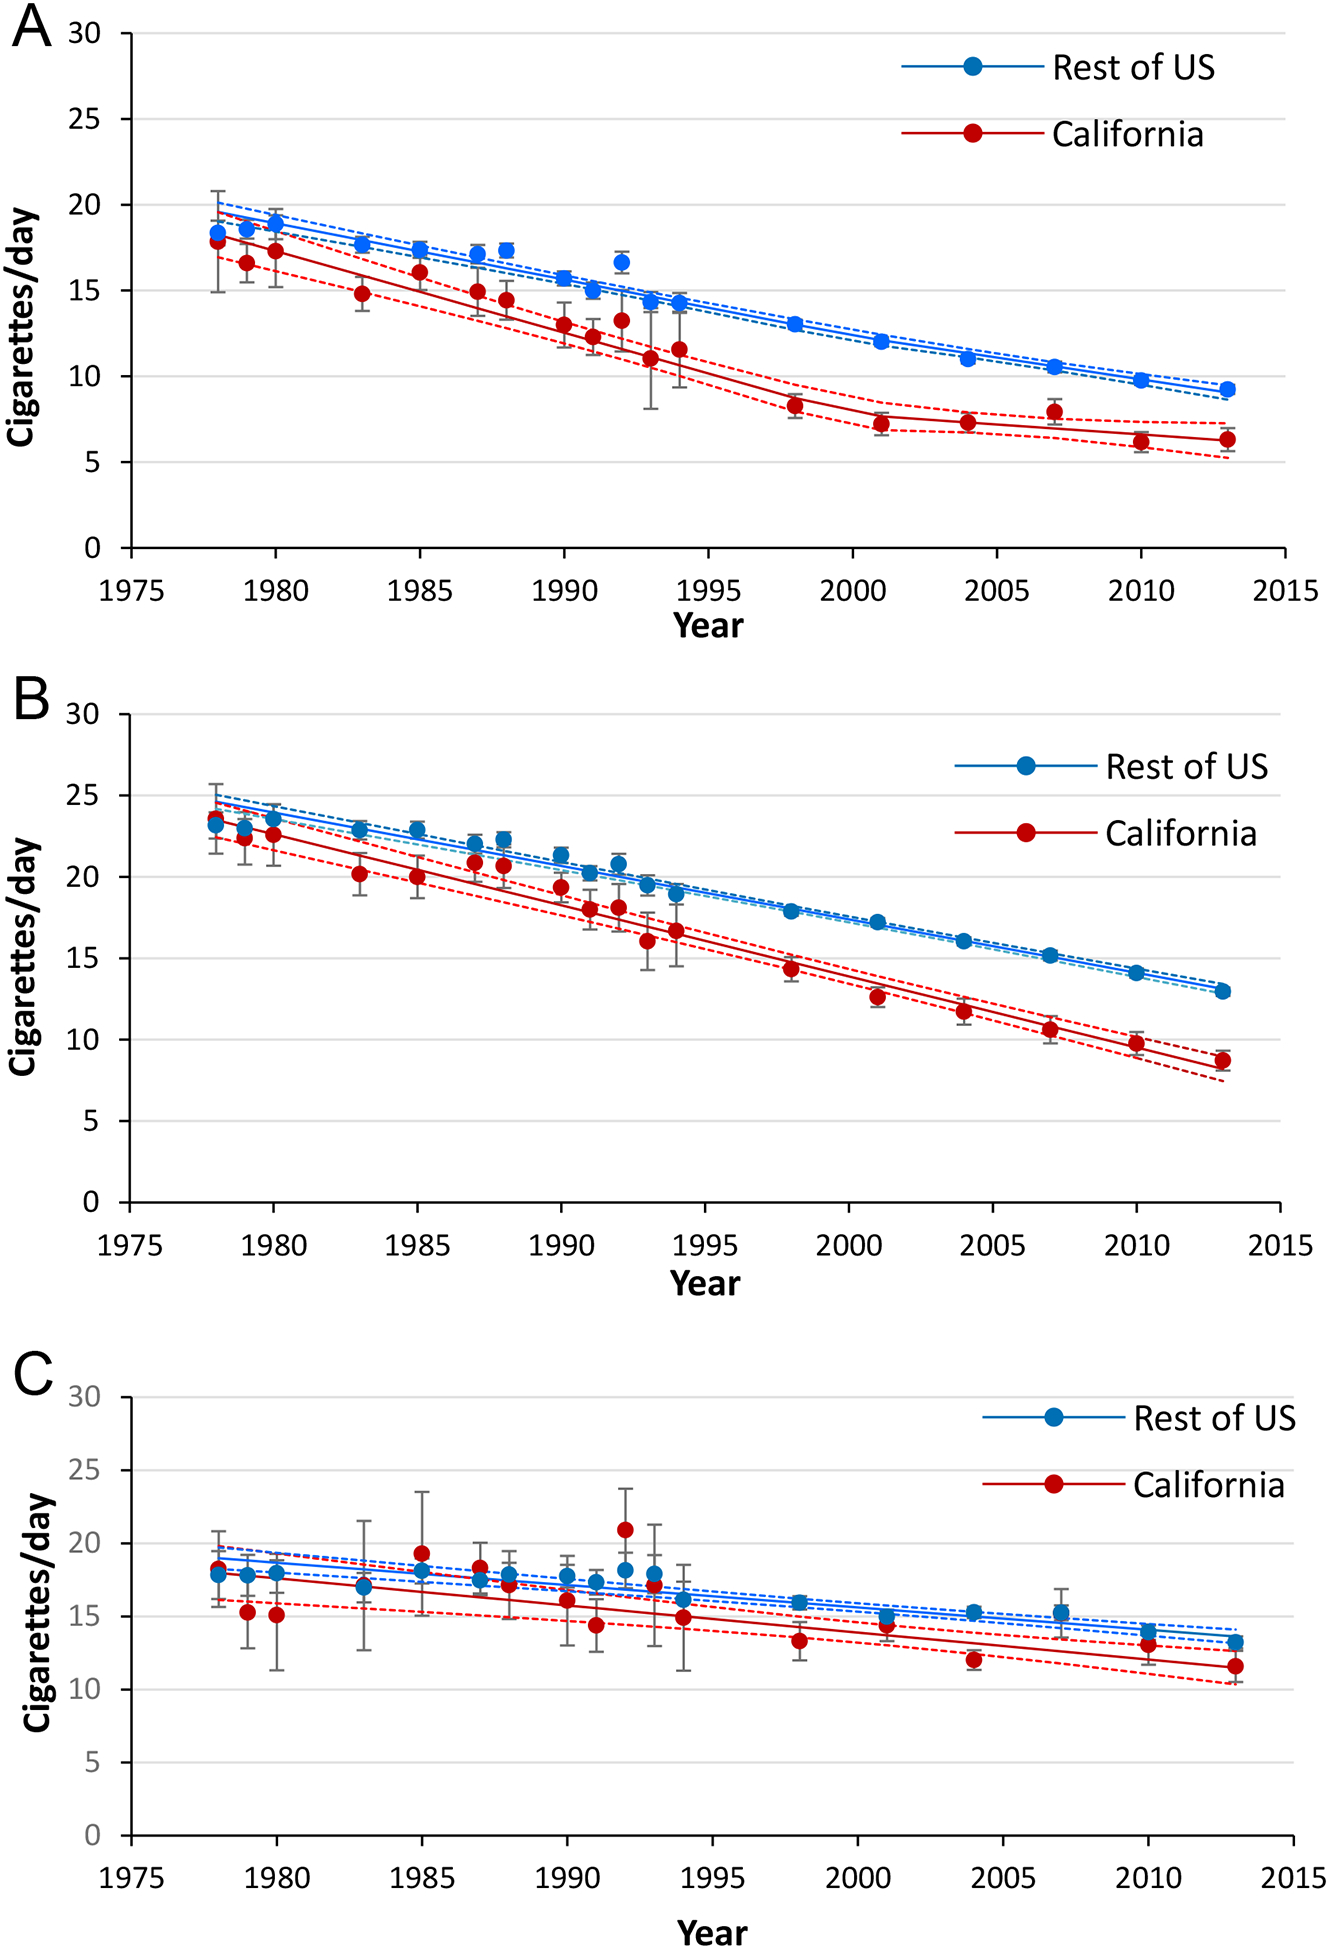
among (A) 18-to 34-year-old smokers (B) 35-to 64-year-old smokers and (C) smokers aged 65+ years. Data Source: National Health Interview Surveys. Data for years 1997–2014 are collated over a 3-year period (e.g., 2013 point estimate represents years 2012–2014). Error bars represent 95% confidence intervals.
Among 35-to 64-year-old smokers, in 1978, smoking intensity in California was similar to the rest of the US (23.2 cigarettes/d, 95% CI, 22.4–24.0) (Figure 2b). A linear regression fit the data well (R2=0.98). Through 2014, the rates of decline were equivalent to the pre-2000 decline seen in each respective location for the 18-to 34-year-olds. In 2012–14, smoking intensity in California was 8.7 cigarettes/d (95% CI, 8.1–9.3), which was 37% lower (p<0.0001) than in the rest of the US (12.9 cigarettes/d, 95% CI, 12.7–13.2).
Among smokers aged 65+ years, in 1978, smoking intensity in California was not different to that in the rest of the US (17.8 cigarettes/d, 95% CI,16.2–19.5) (Figure 2c). Through 2014, the annual average smoking intensity declined significantly in both California (−0.19 cigarettes/d/yr, 95% CI, −0.11 to −0.26) and in the rest of the US (−0.15 cigarettes/d/yr, 95% CI, 0.−12 to −0.18). In 2012–14, the average cigarette consumption in this age group in California was 11.6 cigarettes/d (95% CI, 10.5–12.7), which was 15% lower (p=0.002) than the 13.2 cigarettes/d (95% CI, 12.8–13.6) in the rest of the US.
Quitting by Target Age
In 1978, ~30% of ever-smokers had quit by age 35 years in both California and the rest of the US. (Figure 3a). The model for both locations was an adequate fit to the data (R2=0.61). From 1978 to 2012–14, the quit ratio increased consistently at 0.38%/year (95% CI, 0.16%–0.60%) in California. In the rest of the US, there was no increase until after 2000, when the rate became similar to that in California. In 2012–14, the quit ratio in California was 24% higher than in the rest of the US (45.7%, [95% CI, 41.1%–50.4%] vs 37.8%, [95% CI, 36.1%–39.4%] p=0.0007).
Figure 3. Trends in smoking cessation in California and rest of the United States, 1978–2014.
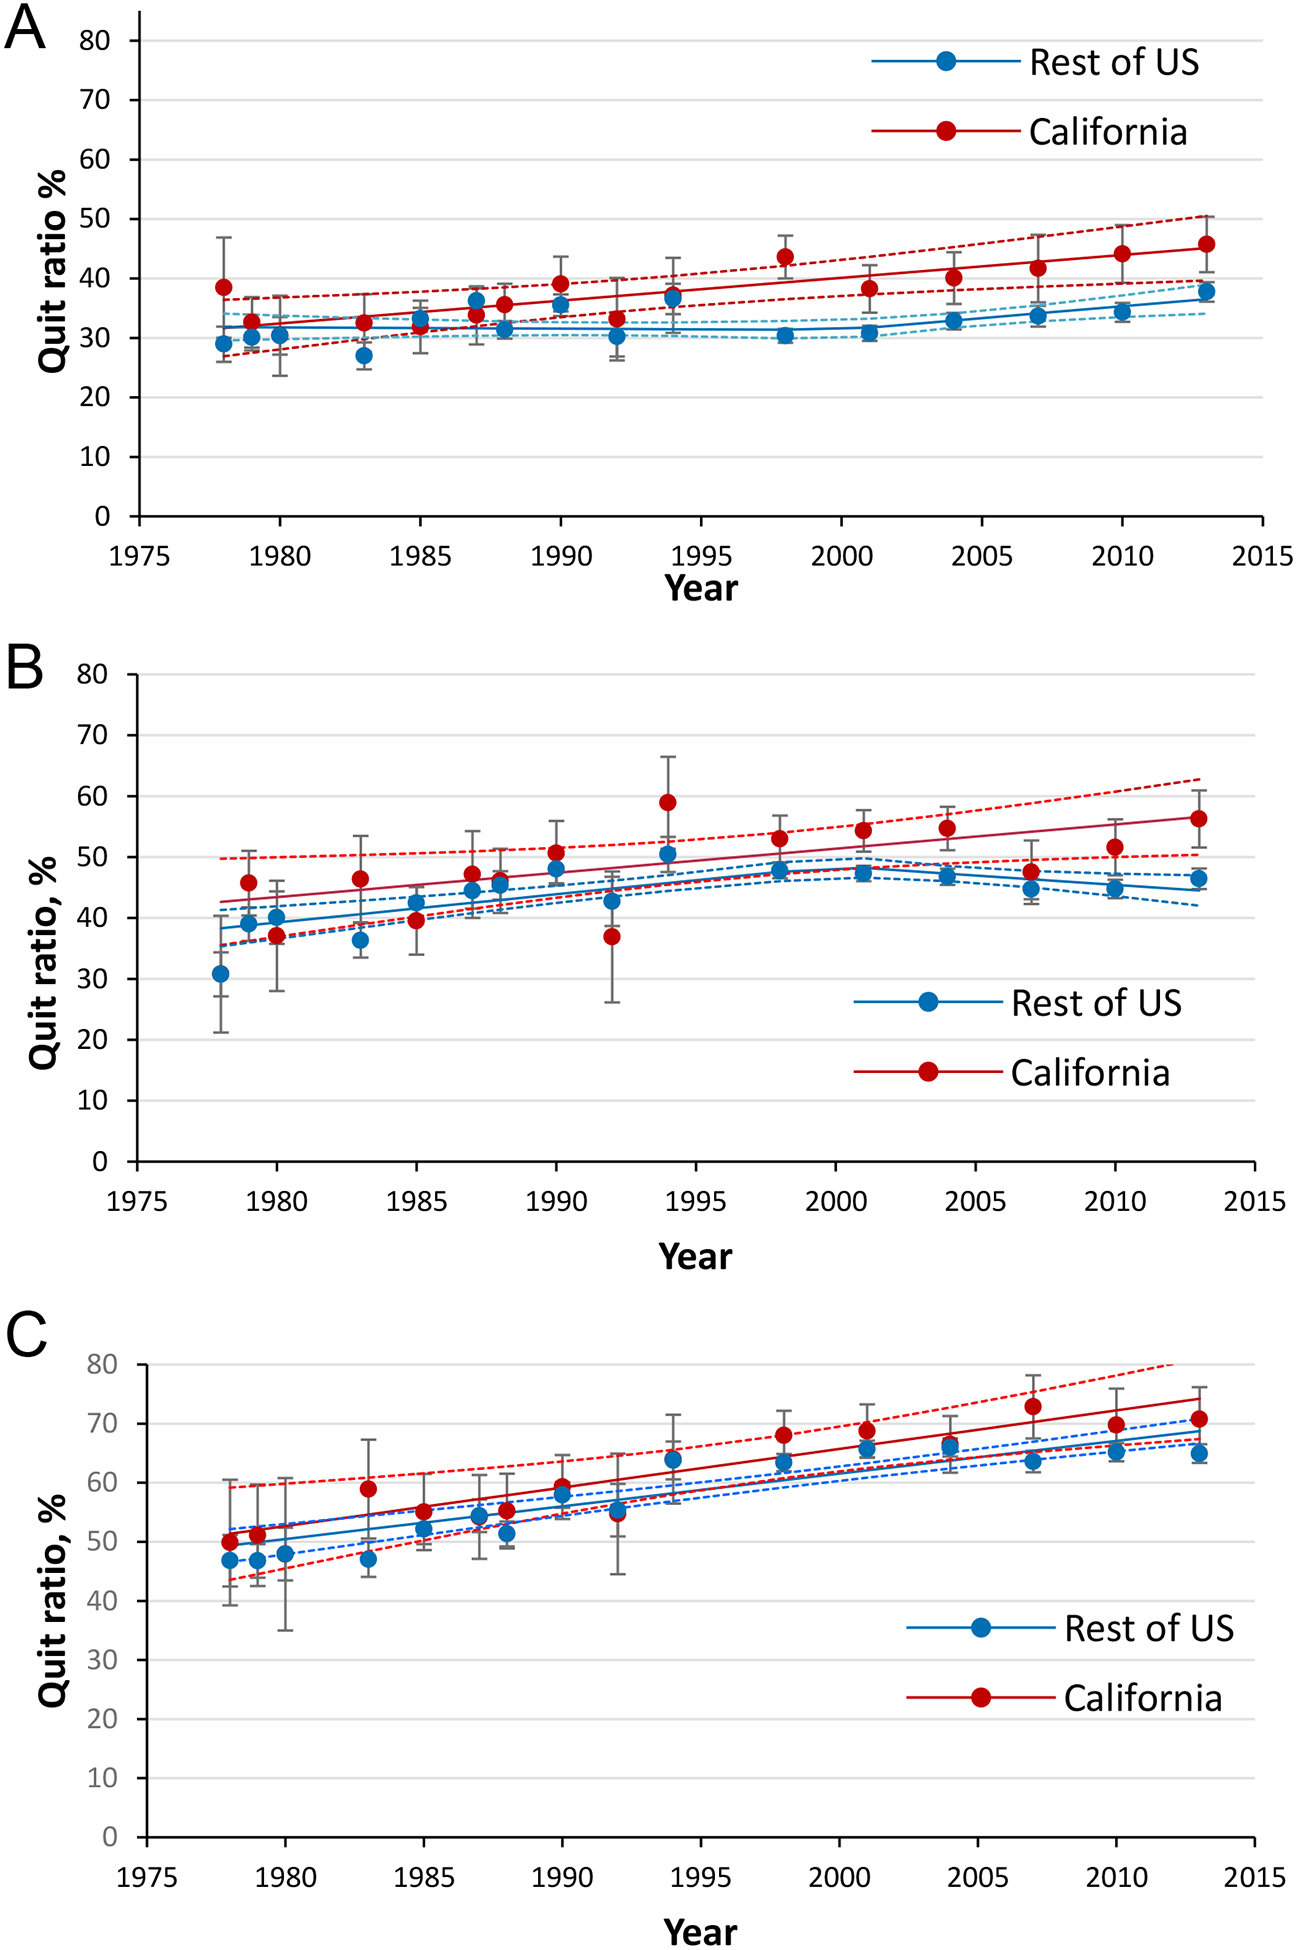
for (A) quitting by target age 35 (among 30-to 39-year-old ever smokers) (B) quitting by target age 50 (among 45-to 54-year-old ever smokers) and (C) quitting by target age 65 (among 60-to 69-year-old ever smokers). Data Source: National Health Interview Surveys. Data for years 1997–2014 are collated over a 3-year period (e.g., 2013 point estimate represents years 2012–2014). Error bars represent 95% confidence intervals. Quit Ratio is the ratio of former smokers to ever smokers.
In 1978, the proportion of ever smokers who had quit by target age 50 years was similar in California and the rest of the US (30.7%, 95% CI, 27.1%–34.4%). (Figure 3b) From 1978–2014 the model was an adequate fit to the data (R2 =0.65) and, quitting increased in California at a consistent rate of 0.4%/year (95% CI, 0.15%–0.65%). Prior to the year 2000, quitting increased at the same rate in the rest of the US. However, after 2000, the quit ratio actually declined through 2014 (−0.37%/year, 95% CI, −0.06 to −0.68). In 2012–14 the quit ratio was 27% higher in California than in the rest of the US (56.3%, 95% CI, 51.6%–60.9% vs 46.4%, 95% CI, 44.7%–48.1%).
In 1978, approximately half of ever smokers in California and the rest of the US had quit by age 65 years. (Figure 3c). A linear regression line fit the model well (R2=0.79). The quit ratio increased consistently and slightly faster in California (0.65%/year, 95% CI, 0.31%–1.00%) than in the rest of the US (0.55%/year, 95% CI, 0.44%–0.67%) with no evidence of a change in slope through 2014. In 2012–14, there was no difference in the proportion of ever smokers who had quit in California compared to the rest of the US (64.9%, 95% CI, 63.3%–66.5%).
Lung Cancer Mortality
In 1970, lung cancer mortality was higher in California (76.3/100,000) than in rest of the US (71.5/100,000) (Figure 4a) and climbed consistently in both locations through 1985 (California = 107.8/100,000; rest of the US = 106.2/100,000). It continued to climb in the rest of the US to peak in 1993 at 116.8/100,000, which was 7% higher than California’s 1985 peak. After a few stable years, lung cancer mortality in California declined consistently from 1991 through 2013, at an average rate of ~2/100,000/year to 62.6/100,000. In the rest of the US, lung cancer mortality also declined after its 1993 peak through 2013 to 87.5/100,000 (rate of 1.5/100,000/year). As the consistent rate of decline in California was 33% faster than the rest of the US, lung cancer mortality rates in California became increasingly lower than in the rest of the US and the percent difference (100 ×(RoUS-CA)/ RoUS) grew at a rate of 0.93%/year (95% CI, 0.88%–0.97%). By 2012–13, lung cancer mortality was 28% lower in California compared to the rest of the US (Figure 4b).
Figure 4. Trends in lung cancer mortality in California and the rest of the United States, 1970–2013 for age 35+ years.
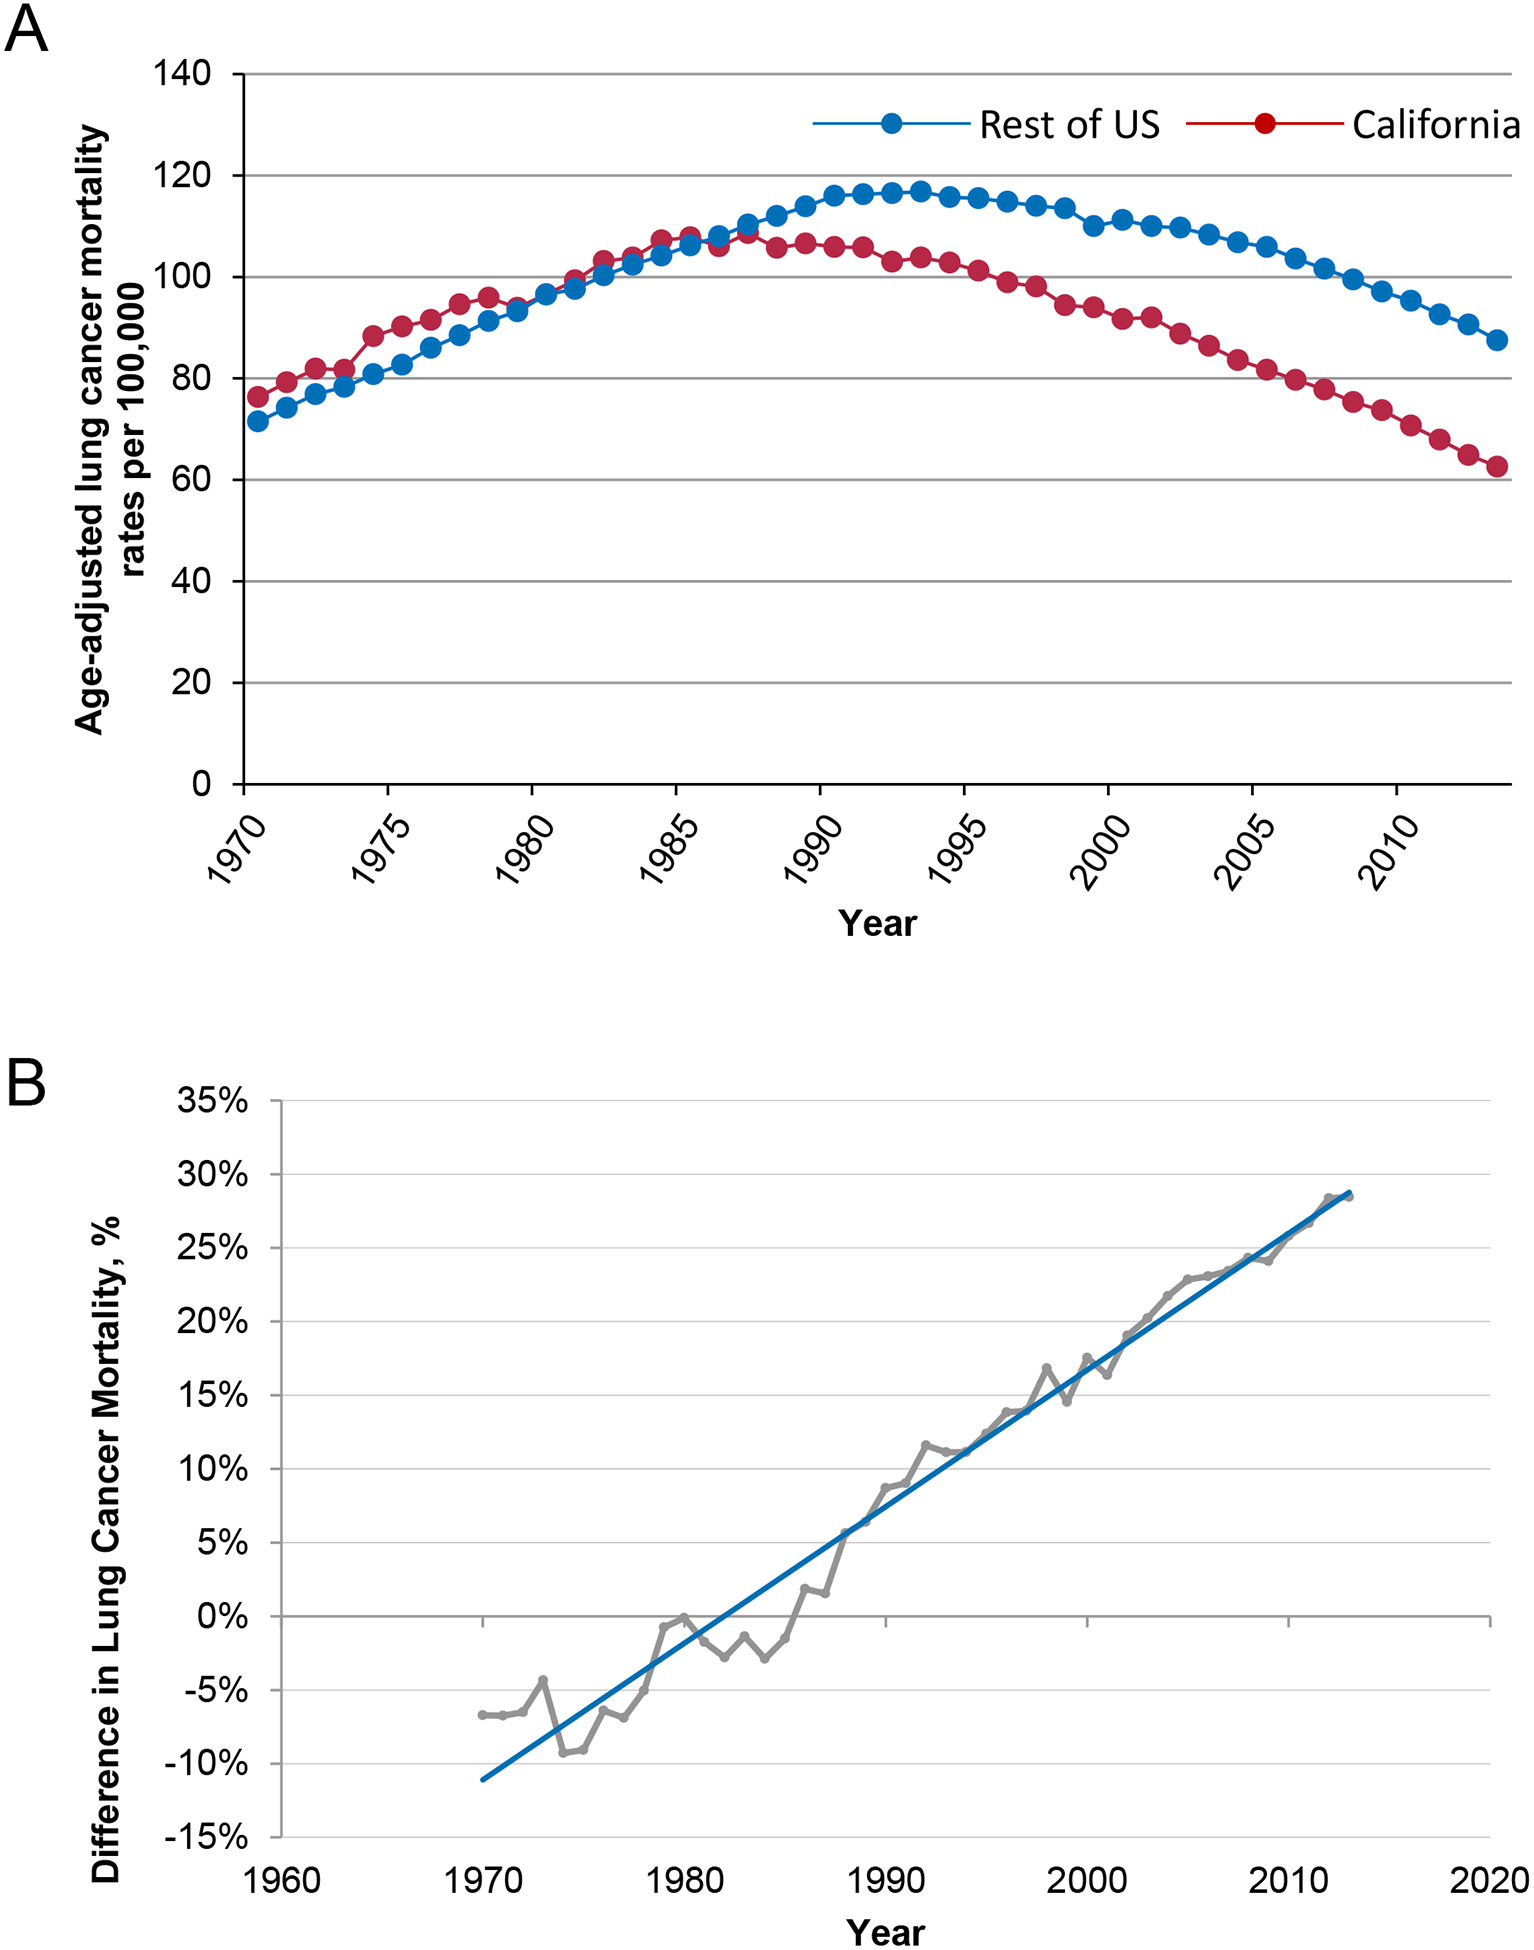
expressed as (A) age-adjusted lung cancer mortality rates per 100,000 and (B) percent difference in lung cancer mortality (100 ×[US-CA]/US); year change slope=93% and R2=97.26%. Data Source: Surveillance, Epidemiology, and End Results (SEER) Program SEER*Stat Database.
DISCUSSION
In its first 12 years, California’s tobacco control program had an important impact on smoking behavior, particularly among the younger ages, compared to the rest of the US. California experienced a rapid decline in smoking initiation in those under 35 years of age and a major decline in intensity of smoking among those of working age. Although there was no marked state-level effect on cessation among smokers at near-term risk for lung cancer (i.e. seniors), the program was associated with increased cessation before age 35 years. However, after the year 2000, a weakened California program and increased tobacco control in the rest of the country cancelled out the year-over-year California gains. Nevertheless, in 2012–14, among those under 35 years, the combination of a 39% lower initiation rate, a 30% lower intensity among continuing smokers, and a 24% higher cessation rate meant that young Californians had much less exposure to cigarette smoking than those of similar age in the rest of the country.
In the 1970s, California did not have the advantage of lower smoking initiation, lower intensity among smokers, and higher cessation, and, indeed, lung cancer mortality was higher than in the rest of the US. However, smoking behavior changed earlier in California than in the rest of the US, and this was not explained by migration or immigration.(30) Furthermore, this change was associated with lung cancer mortality peaking earlier and then, over the past 20 years, declining consistently faster in California compared to the rest of the US. Over this period the percent difference in lung cancer mortality between the rest of the US and California grew by a fairly consistent 1 percentage point per year. Should current trends continue, in 2037, lung cancer mortality will be 50% higher in the rest of the US than in California. No doubt this larger decline in California mortality is attributable in part to the increasingly lower rate of ever-smoking seen among older Californians, as well as to the marginally higher cessation rates and lower smoking intensity observed in these same populations. However, the most dramatic difference in exposure to cigarette smoking has been among those under the age of 35 years, and this can be projected to dramatically increase the annual gap in lung cancer mortality in the future, when the current cohorts mature to the ages most at risk for lung cancer.
California’s Tobacco Control Program started just as the Environmental Protection Agency released its first draft of a report labelling secondhand smoke as a class A carcinogen.(31) The program focused on social norms, providing funding for local community organizers focused on this newly recognized carcinogen.(21,32) There followed a rapid increase in local ordinances restricting where smoking was allowed.(33) The Program highlighted tobacco marketing as a major influence on adolescent smoking,(34) which was followed by a number of ordinances restricting advertising near schools. In 1994 California passed the first state legislation that mandated smokefree workplaces, restaurants and bars, some 8 years ahead of the next jurisdiction.(35) Major changes were documented in protecting non-smokers from secondhand smoke, particularly children and indoor workers.(36) Early in the program, these changes were hypothesized to be more impactful on never-smokers and also on young people who were in the early stages of smoking initiation, as has been born out here.(37) While the Program pioneered quitlines, (38) it did not promote cessation through a health care system approach as was done in the UK.(39) By the mid-1990s, California had implemented a program to limit underage tobacco purchases and promote smoke-free school campuses.(40)
After 17 years of failing to further increase the tobacco tax, in 2016, voters approved a $2 increase in tobacco excise taxes, revitalizing the California Tobacco Control Program. The question remains whether this will be sufficient to recapture the momentum towards a smoke-free society so evident in the 1990s, particularly given the rise of the e-cigarette usage (41) and the evidence that this may herald an increase in cigarette smoking in young people. A comparison of programs that have used a different mix of tobacco control strategies (e.g. New York, Australia), might elucidate how the different strategies have influenced smoking behavior, in particular, whether any of the strategies have been more effective in increasing cessation among seniors.
If, as we strongly expect, changed smoking behavior is the cause of the more rapid decline in lung cancer in California, then we would expect that the decline would be more marked in the histological subtypes of cancer (squamous cell and small cell lung cancer) that are more strongly smoking-related than in adenocarcinoma.(42) Importantly, adenocarcinoma now makes up 47% of all lung cancers in California.(43) It is possible that the faster decline in lung cancer mortality in California reflects a greater dissemination of lung cancer early detection programs that result in early stage diagnosis and more effective treatment. (44) However, most lung cancers are diagnosed when patients present with symptoms, indicating advanced stage disease that is difficult to treat. While the National Lung Screening Trial (NLST) (45) demonstrated a 20% reduction in mortality with low-dose CT (LDCT) screening, concerns such as how to treat large numbers of false positive findings have limited widespread dissemination. (46) An analysis of trends in lung cancer stage between California and the rest of the US will be needed to rule out this unlikely hypothesis.
A strength of this study is that smoking behavior measures are from the NHIS, the longest running US survey on tobacco use. A limitation is that the NHIS is not designed to provide representative estimates of state data. However, NHIS estimates of smoking prevalence for California have been shown to be similar to estimates from other surveys that were designed to make state-representative estimates.(47) A strength is that lung cancer mortality was obtained from death certificates collated through population registries.
California’s tobacco control program, a pioneer in targeting the social norms around smoking, was associated with a major decline in cigarette smoking among those under age 35 years, and a reduction in smoking intensity in working-aged populations, but did not influence quitting among seniors. For the past 2 decades, lung cancer mortality has decreased faster in California than the rest of the US, mainly from these earlier reductions in smoking initiation. These California-specific reductions in cigarette smoking among younger populations should result in increasingly lower lung cancer mortality among younger birth cohorts as they age into the future.
ACKNOWLEDGEMENTS
The authors would like to thank Dr Frances McCarty of the National Center for Health Statistics, Research Data Center for her patience and assistance in helping us get these smoking behavior datasets ready for analysis.
Funding: This work was supported by the Tobacco Related Disease Research Program (TRDRP) grant numbers 24ST-0050 to JPP and YS, 26IR-0024 to JPP and SBM, 24RT-0036 to KM, and 23RT-0016 to DT.
Footnotes
Conflict of Interest. The authors declare no potential conflicts of interest
Publisher's Disclaimer: Disclaimer: The findings and conclusions in this paper are those of the author(s) and do not necessarily represent the views of the Research Data Center, the National Center for Health Statistics, or the Centers for Disease Control and Prevention or the California Department of Public Health.
REFERENCES
- 1.Siegel RL, Miller KD, Jemal A. Cancer statistics, 2018. CA Cancer J Clin 2018;68:7–30. [DOI] [PubMed] [Google Scholar]
- 2.US Department of Health and Human Services. July 22, 2018. Healthy People 2020, Cancer Objective. US Department of Health and Human Services, Centers for Disease Control and Prevention; <https://www.healthypeople.gov/2020/topics-objectives/topic/cancer>. Accessed July 22, 2018. [Google Scholar]
- 3.US Department of Health and Human Services. The Health Consequences of Smoking-50 Years of Progress: A Report of the Surgeon General. Atlanta, GA: Department of Health and Human Services, Centers for Disease Control and Prevention, National Center for Chronic Disease Prevention and Health Promotion, Office on Smoking and Health; 2014. [Google Scholar]
- 4.Pierce JP, Gilpin EA. News media coverage of smoking and health is associated with changes in population rates of smoking cessation but not initiation. Tob Control 2001;10:145–53. [DOI] [PMC free article] [PubMed] [Google Scholar]
- 5.Gilpin EA, Lee L, Evans N, Pierce JP. Smoking initiation rates in adults and minors: United States, 1944–1988. Am J Epidemiol 1994;140:535–43. [DOI] [PubMed] [Google Scholar]
- 6.Pierce JP, Messer K, White MM, Kealey S, Cowling DW. Forty years of faster decline in cigarette smoking in California explains current lower lung cancer rates. Cancer Epidemiol Biomarkers Prev 2010;19:2801–10. [DOI] [PubMed] [Google Scholar]
- 7.Bal DG, Kizer KW, Felten PG, Mozar HN, Niemeyer D. Reducing tobacco consumption in California. Development of a statewide anti-tobacco use campaign. JAMA 1990;264:1570–4. [PubMed] [Google Scholar]
- 8.Niemeyer D, Miner KR, Carlson LM, Baer K, Shorty L. The 1998 Master Settlement Agreement: a public health opportunity realized--or lost? Health Promot Pract 2004;5:21s–32s. [DOI] [PubMed] [Google Scholar]
- 9.Pierce JP, Shi Y, Hendrickson EM, White MM, Noble ML, Kealey S, et al. Tobacco control in California compared with the rest of the USA: trends in adult per capita cigarette consumption. Tob Control 2017 [DOI] [PubMed] [Google Scholar]
- 10.US Department of Health and Human Services. Preventing Tobacco Use Among Youth and Young Adults: A Report of the Surgeon General. Atlanta, GA: US Department of Health and Human Services, Centers for Disease Control and Prevention, National Center for Chronic Disease Prevention and Health Promotion, Office on Smoking and Health; 2012. [Google Scholar]
- 11.Russell MA. Cigarette dependence: II. Doctor’s role in management. Br Med J 1971;2:393–5. [DOI] [PMC free article] [PubMed] [Google Scholar]
- 12.Doll R, Peto R, Boreham J, Sutherland I. Mortality in relation to smoking: 50 years’ observations on male British doctors. BMJ 2004;328:1519. [DOI] [PMC free article] [PubMed] [Google Scholar]
- 13.Vlaanderen J, Portengen L, Schuz J, Olsson A, Pesch B, Kendzia B, et al. Effect modification of the association of cumulative exposure and cancer risk by intensity of exposure and time since exposure cessation: a flexible method applied to cigarette smoking and lung cancer in the SYNERGY Study. Am J Epidemiol 2014;179:290–8. [DOI] [PMC free article] [PubMed] [Google Scholar]
- 14.Pierce JP, Messer K, White MM, Cowling DW, Thomas DP. Prevalence of heavy smoking in California and the United States, 1965–2007. JAMA 2011;305:1106–12. [DOI] [PubMed] [Google Scholar]
- 15.Pierce JP, Dwyer T, Chamberlain A, Aldrich RN, Shelley JM. Targeting the smoker in an anti-smoking campaign. Prev Med 1987;16:816–24. [DOI] [PubMed] [Google Scholar]
- 16.Hill D, Chapman S, Donovan R. The return of scare tactics. Tob Control 1998;7:5–8. [DOI] [PMC free article] [PubMed] [Google Scholar]
- 17.Durkin S, Brennan E, Wakefield M. Mass media campaigns to promote smoking cessation among adults: an integrative review. Tob Control 2012;21:127–38. [DOI] [PubMed] [Google Scholar]
- 18.Murphy-Hoefer R, Davis KC, Beistle D, King BA, Duke J, Rodes R, et al. Impact of the tips from former smokers campaign on population-level smoking cessation, 2012–2015. Prev Chronic Dis 2018;15:E71. [DOI] [PMC free article] [PubMed] [Google Scholar]
- 19.Borland R, Pierce JP, Burns DM, Gilpin E, Johnson M, Bal D. Protection from environmental tobacco smoke in California. The case for a smoke-free workplace. JAMA 1992;268:749–52. [PubMed] [Google Scholar]
- 20.Pierce JP, Gilpin E, Burns DM, Whalen E, Rosbrook B, Shopland D, et al. Does tobacco advertising target young people to start smoking? Evidence from California. JAMA 1991;266:3154–8. [PubMed] [Google Scholar]
- 21.Pierce JP, Evans N, Farkas A, Cavin S, Berry C, Kramer M, et al. Tobacco use in California: An evaluation of the tobacco control program, 1989–1993 A report to the California Department of Health Services. La Jolla, CA, University of California, San Diego;1994. [Google Scholar]
- 22.US Department of Health and Human Services. E-Cigarette Use Among Youth and Young Adults. A Report of the Surgeon General. Atlanta, GA: US Department of Health and Human Services, Centers for Disease Control and Prevention, National Center for Chronic Disease Prevention and Health Promotion, Office on Smoking and Health; 2016. [Google Scholar]
- 23.Hopkins DP, Razi S, Leeks KD, Priya Kalra G, Chattopadhyay SK, Soler RE. Smokefree policies to reduce tobacco use. A systematic review. Am J Prev Med 2010;38:S275–89. [DOI] [PubMed] [Google Scholar]
- 24.Centers for Disease Control, National Center for Health Statistics. National Health Interview Procedures and Methodology. <https://www.cdc.gov/nchs/nhis/methods.html>. Accessed July 7, 2018.
- 25.Cronin KA, Lake AJ, Scott S, Sherman RL, Noone AM, Howlader N, et al. Annual Report to the Nation on the Status of Cancer, part I: National cancer statistics. Cancer 2018;124:2785–800. [DOI] [PMC free article] [PubMed] [Google Scholar]
- 26.Surveillance Epidemiology and End Results (SEER) Program. released December 2016. SEER*Stat Database: Mortality -All COD, Aggregated With State, Total U.S. (1969–2014) <Katrina/Rita Population Adjustment>. National Cancer Institute, DCCPS, Surveillance Research Program <https://seer.cancer.gov/>.
- 27.World Health Organization. ICD-10: International statistical classification of diseases and related health problems: 10th revision. Geneva, CH;1992. [Google Scholar]
- 28.Pierce JP, Fiore MC, Novotny TE, Hatziandreu EJ, Davis RM. Trends in cigarette smoking in the United States: educational differences are increasing. JAMA 1989;261:56–60. [PubMed] [Google Scholar]
- 29.Pierce JP, Shi Y, Hendrickson E, White M, Noble M, Kealey S, et al. Did Slowdown on Taxes and Program Impact California’s Smoking Decline? Tob Regul Sci 2018;4:30–40.30662930 [Google Scholar]
- 30.Gilpin EA, Messer K, White MM, Pierce JP. What contributed to the major decline in per capita cigarette consumption during California’s comprehensive tobacco control programme? Tob Control 2006;15:308–16. [DOI] [PMC free article] [PubMed] [Google Scholar]
- 31.US Environmental Protection Agency. EPA Designates Passive Smoking a “Class A” or Known Human Carcinogen. <https://archive.epa.gov/epa/aboutepa/epa-designates-passive-smoking-class-or-known-human-carcinogen.html>. Accessed July 24, 2018.
- 32.Roeseler A, Burns D. The quarter that changed the world. Tob Control 2010;19 Suppl 1:i3–15. [DOI] [PMC free article] [PubMed] [Google Scholar]
- 33.Pierce JP, Shanks TG, Pertschuk M, Gilpin E, Shopland D, Johnson M, et al. Do smoking ordinances protect non-smokers from environmental tobacco smoke at work? Tob Control 1994;3:15–20. [Google Scholar]
- 34.Pierce JP, Choi WS, Gilpin EA, Farkas AJ, Berry CC. Tobacco industry promotion of cigarettes and adolescent smoking. JAMA 1998;279:511–5. [DOI] [PubMed] [Google Scholar]
- 35.International Agency for Research on Cancer (IARC). Handbooks of Cancer Prevention, Tobacco Control, Vol. 13. Evaluating the Effectiveness of Smoke-free Policies. Lyon, France; 2009. [Google Scholar]
- 36.Gilpin EA, Farkas AJ, Emery SL, Ake CF, Pierce JP. Clean indoor air: advances in California, 1990–1999. Am J Public Health 2002;92:785–91. [DOI] [PMC free article] [PubMed] [Google Scholar]
- 37.Pierce JP, Naquin M, Gilpin E, Giovino G, Mills S, Marcus S. Smoking initiation in the United States: a role for worksite and college smoking bans. J Natl Cancer Inst 1991;83:1009–13. [DOI] [PubMed] [Google Scholar]
- 38.Pierce JP, Cummins SE, White MM, Humphrey A, Messer K. Quitlines and nicotine replacement for smoking cessation: do we need to change policy? Annu Rev Public Health 2012;33:341–56. [DOI] [PubMed] [Google Scholar]
- 39.Royal College of Physicians. Hiding in plain sight: treating tobacco dependency in the NHS. 2018. <www.rcplondon.ac.uk/projects/outputs/hiding-plain-sight-treating-tobacco-dependency-nhs>.
- 40.Gilpin E, Emery S, Farkas A, Distefan J, White M, Pierce J. The California Tobacco Control Program: A Decade of Progress Results from the California Tobacco Surveys 1990–1999. La Jolla, CA;2001. [Google Scholar]
- 41.Huang J, Duan Z, Kwok J, Binns S, Vera LE, Kim Y, et al. Vaping versus JUULing: how the extraordinary growth and marketing of JUUL transformed the US retail e-cigarette market. Tob Control 2018 [DOI] [PMC free article] [PubMed] [Google Scholar]
- 42.Pesch B, Kendzia B, Gustavsson P, Jockel KH, Johnen G, Pohlabeln H, et al. Cigarette smoking and lung cancer--relative risk estimates for the major histological types from a pooled analysis of case-control studies. Int J Cancer 2012;131:1210–9. [DOI] [PMC free article] [PubMed] [Google Scholar]
- 43.DeRouen MC, Hu L, McKinley M, Gali K, Patel M, Clarke C, et al. Incidence of lung cancer histologic cell-types according to neighborhood factors: A population based study in California. PLoS One 2018;13:e0197146. [DOI] [PMC free article] [PubMed] [Google Scholar]
- 44.American Cancer Society. Early Detection of Lung Cancer Guidelines. <https://www.cancer.org/cancer/lung-cancer/prevention-and-early-detection/early-detection.html>. Accessed September 12, 2018.
- 45.National Lung Screening Trial Research Team, Aberle DR, Adams AM, Berg CD, Black WC, Clapp JD, et al. Reduced lung-cancer mortality with low-dose computed tomographic screening. N Engl J Med 2011;365:395–409. [DOI] [PMC free article] [PubMed] [Google Scholar]
- 46.Midthun DE. Early detection of lung cancer. F1000Res 2016;5 [DOI] [PMC free article] [PubMed] [Google Scholar]
- 47.Pierce JP, Gilpin EA, Emery SL, White MM, Rosbrook B, Berry CC, et al. Has the California tobacco control program reduced smoking? JAMA 1998;280:893–9. [DOI] [PubMed] [Google Scholar]